Analysis Report
Updated: 2026-05-03 08:50:10 MYT
Source File: combined-summary-20260503-085010.md
Screening Source: screen-report-20260503-084706.md
Extracted Symbols: NBIS, OKLO, CRWV, IREN, AAOI, AFRM, RKLB, CRDO, HUT, DOCN, CRCL, HIMS, IONQ, AOSL, UCO, APLD, NVTS, VIAV, AMSC, TTMI, RDDT, FSLY, COIN, SYM, MSTX, U, CAMT, CELC, PL, DUOL
Topline Summary
| Symbol |
Spot |
Support |
Resistance |
Flip |
Regime |
P>Res |
P<Sup |
68% Range |
90% Range |
| NBIS |
154.49 |
135.00 |
160.00 |
147.60 |
TRANSITION |
28.6% |
12.6% |
136.40 - 172.58 |
124.73 - 184.25 |
| OKLO |
70.40 |
70.00 |
73.00 |
70.82 |
TREND |
42.6% |
45.4% |
62.07 - 78.73 |
56.69 - 84.11 |
| CRWV |
119.01 |
110.00 |
120.00 |
96.77 |
TRANSITION |
39.3% |
30.9% |
100.36 - 137.66 |
88.33 - 149.69 |
| IREN |
45.66 |
42.50 |
46.50 |
43.86 |
TRANSITION |
37.7% |
27.6% |
38.39 - 52.93 |
33.70 - 57.62 |
| AAOI |
183.51 |
160.00 |
210.00 |
148.23 |
TRANSITION |
22.7% |
29.3% |
138.98 - 228.04 |
110.26 - 256.76 |
| AFRM |
67.54 |
67.00 |
70.00 |
43.41 |
TRANSITION |
33.1% |
47.0% |
57.49 - 77.59 |
51.01 - 84.07 |
| RKLB |
78.81 |
75.00 |
82.00 |
75.90 |
TRANSITION |
33.5% |
26.1% |
69.43 - 88.19 |
63.37 - 94.25 |
| CRDO |
184.38 |
180.00 |
200.00 |
167.12 |
TRANSITION |
16.8% |
37.8% |
164.21 - 204.55 |
151.20 - 217.56 |
| HUT |
76.98 |
72.00 |
79.00 |
83.55 |
TRANSITION |
34.8% |
25.6% |
67.00 - 86.96 |
60.57 - 93.39 |
| DOCN |
102.82 |
100.00 |
105.00 |
63.18 |
TRANSITION |
41.1% |
33.3% |
85.27 - 120.37 |
73.95 - 131.69 |
| CRCL |
99.70 |
97.00 |
115.00 |
90.38 |
TRANSITION |
5.6% |
32.4% |
89.38 - 110.02 |
82.72 - 116.68 |
| HIMS |
27.41 |
27.00 |
28.00 |
24.13 |
TRANSITION |
31.9% |
33.8% |
24.45 - 30.37 |
22.54 - 32.28 |
| IONQ |
46.20 |
45.00 |
50.00 |
39.13 |
TRANSITION |
23.9% |
35.7% |
39.41 - 52.99 |
35.02 - 57.38 |
| AOSL |
43.08 |
40.00 |
45.00 |
27.86 |
TRANSITION |
44.6% |
32.3% |
35.01 - 51.15 |
29.81 - 56.35 |
| UCO |
46.76 |
45.00 |
50.00 |
35.40 |
TRANSITION |
29.2% |
31.7% |
40.67 - 52.85 |
36.74 - 56.78 |
| APLD |
33.55 |
27.00 |
34.00 |
32.23 |
TRANSITION |
34.9% |
5.3% |
29.37 - 37.73 |
26.68 - 40.42 |
| NVTS |
17.45 |
17.00 |
17.50 |
12.37 |
TRANSITION |
48.5% |
36.7% |
14.04 - 20.86 |
11.85 - 23.05 |
| VIAV |
55.33 |
55.00 |
60.00 |
43.33 |
TRANSITION |
26.8% |
39.7% |
47.60 - 63.06 |
42.62 - 68.04 |
| AMSC |
52.51 |
50.00 |
55.00 |
NA |
TRANSITION |
32.8% |
27.3% |
46.02 - 59.00 |
41.83 - 63.19 |
| TTMI |
158.99 |
150.00 |
160.00 |
130.61 |
TRANSITION |
42.4% |
26.0% |
142.61 - 175.37 |
132.05 - 185.93 |
| RDDT |
166.48 |
165.00 |
170.00 |
140.77 |
TREND |
54.3% |
62.0% |
152.39 - 180.57 |
143.30 - 189.66 |
| FSLY |
28.07 |
27.00 |
30.00 |
22.11 |
TRANSITION |
28.7% |
39.3% |
21.95 - 34.19 |
18.00 - 38.14 |
| COIN |
191.25 |
185.00 |
192.50 |
157.23 |
TRANSITION |
43.3% |
28.5% |
171.82 - 210.68 |
159.29 - 223.21 |
| SYM |
58.89 |
45.00 |
60.00 |
50.54 |
TRANSITION |
44.9% |
7.5% |
48.46 - 69.32 |
41.74 - 76.04 |
| MSTX |
36.60 |
35.50 |
37.50 |
27.28 |
TRANSITION |
40.7% |
33.1% |
30.05 - 43.15 |
25.83 - 47.37 |
| U |
27.13 |
27.00 |
29.00 |
21.69 |
TRANSITION |
31.4% |
40.0% |
23.13 - 31.13 |
20.55 - 33.71 |
| CAMT |
186.62 |
170.00 |
200.00 |
96.17 |
TRANSITION |
23.7% |
19.5% |
165.22 - 208.02 |
151.41 - 221.83 |
| CELC |
125.65 |
125.00 |
130.00 |
95.58 |
TRANSITION |
27.3% |
47.6% |
116.05 - 135.25 |
109.86 - 141.44 |
| PL |
36.90 |
35.00 |
37.00 |
33.20 |
TRANSITION |
40.7% |
26.5% |
32.85 - 40.95 |
30.24 - 43.56 |
| DUOL |
111.25 |
110.00 |
125.00 |
98.84 |
TRANSITION |
21.1% |
46.8% |
90.24 - 132.26 |
76.69 - 145.81 |
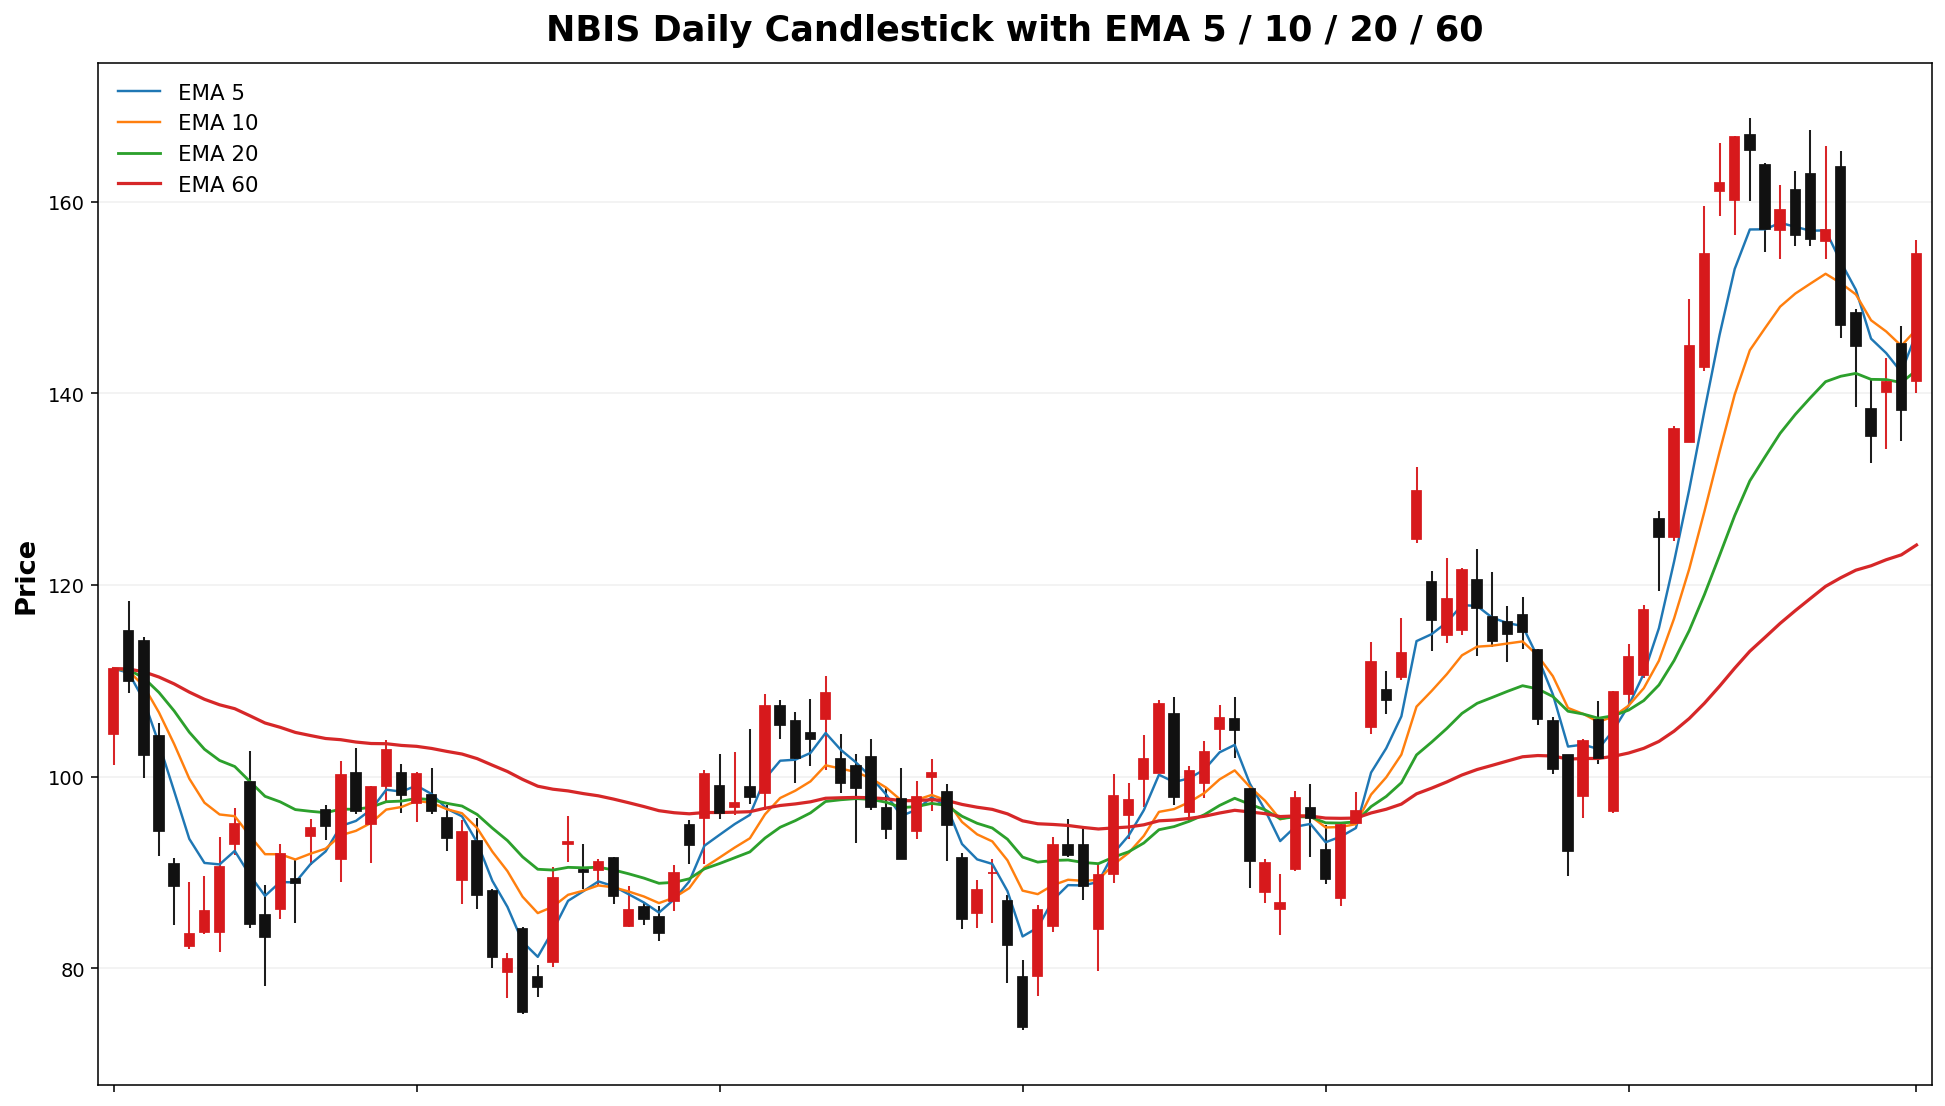
NBIS
Spot: 154.49
Report Time: 2026-05-03 08:47 AM MYT
Regime: TRANSITION
Dealer Gamma: LONG
Term Structure
| Expiry |
DTE |
Forward |
ATM IV |
ATM Straddle |
| 2026-05-08 |
6 |
154.57 |
81.54% |
15.88 |
| 2026-05-15 |
13 |
154.53 |
85.84% |
24.82 |
Weekly Range
| Confidence |
Low |
High |
Width |
| 68% |
136.40 |
172.58 |
36.18 |
| 80% |
131.31 |
177.67 |
46.37 |
| 90% |
124.73 |
184.25 |
59.51 |
| 95% |
119.03 |
189.95 |
70.92 |
Structure & Probabilities
| Support |
Resistance |
Gamma Flip |
Max Pain |
P>Res |
P<Sup |
| 135.00 |
160.00 |
147.60 |
140.00 |
28.6% |
12.6% |
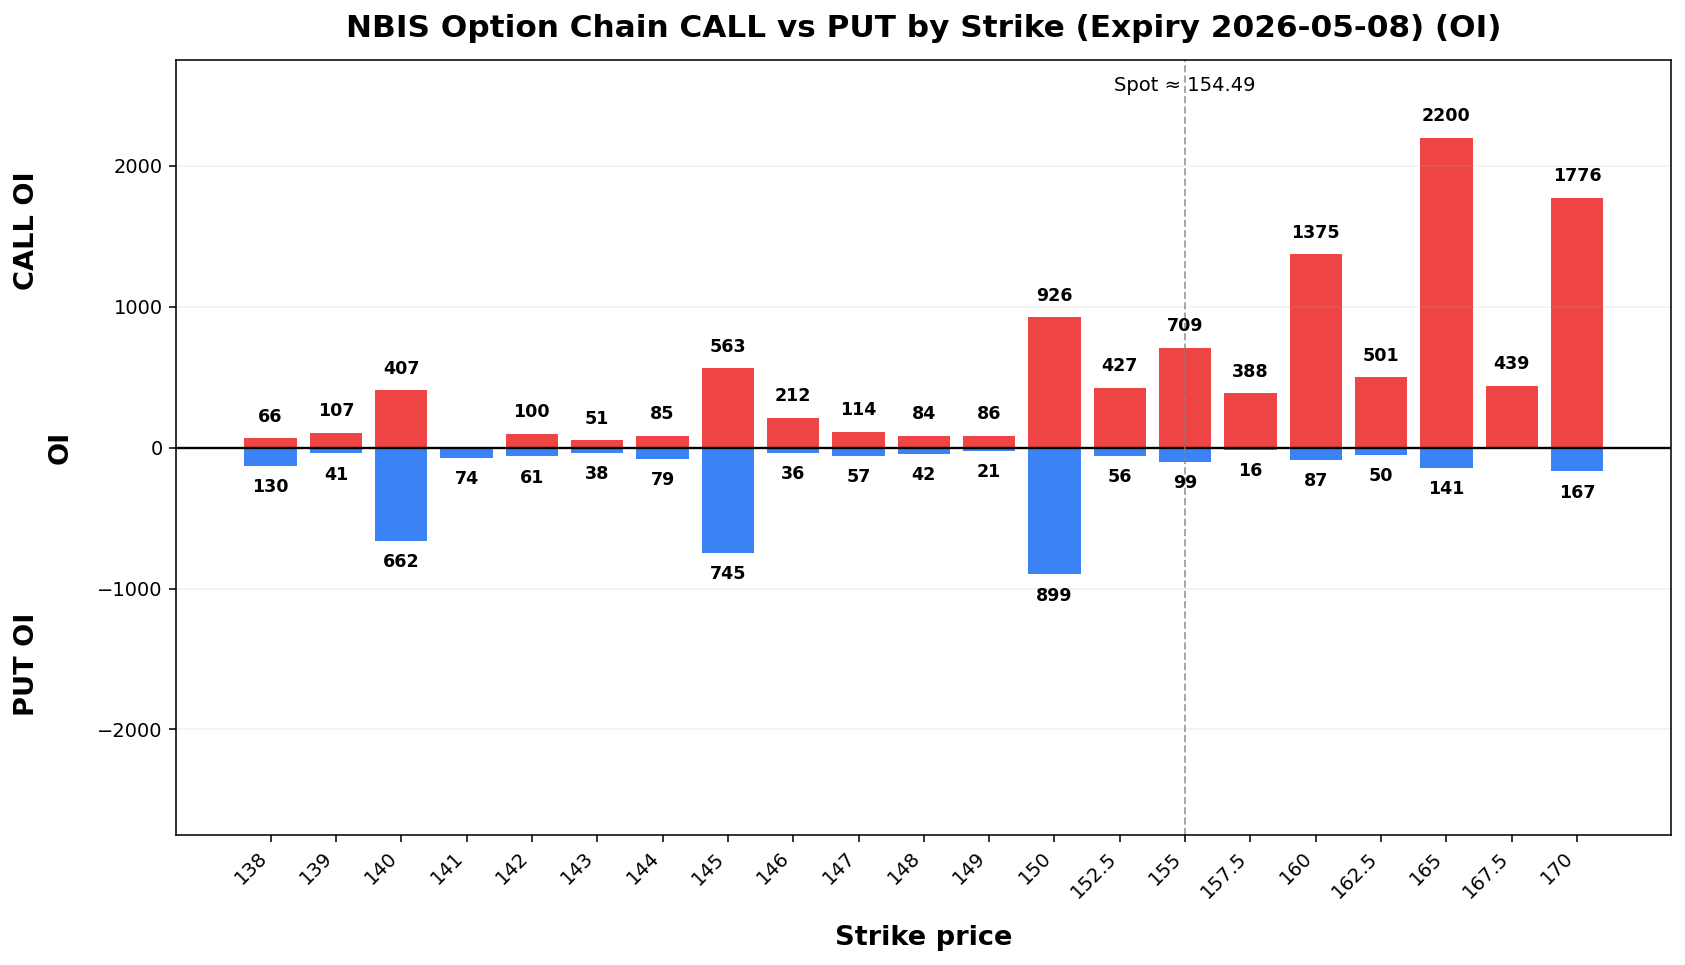
Flow & Skew
| Call Vol |
Put Vol |
Vol P/C |
Call OI |
Put OI |
OI P/C |
Skew |
Skew Bias |
| 29,223 |
22,907 |
0.78 |
17,926 |
29,431 |
1.64 |
2.49 vol pts |
PUT_SKEW |
Tail Risk
| Q10 |
Q50 |
Q90 |
Down Tail |
Up Tail |
Down/Up |
| 125.21 |
153.86 |
178.67 |
29.28 |
24.18 |
1.21 |
Daily Technicals
| EMA20 |
EMA50 |
VWAP20 |
BB Lower |
BB Mid |
BB Upper |
BB Width |
Vol Ratio |
Path |
| 142.40 |
127.39 |
146.52 |
115.84 |
146.62 |
177.40 |
41.99% |
0.98 |
UP trend (expanding) |
Day Plan
- 135.00-160.00 range: fade extremes
- > 160.00: chase only if hold + vol
- < 135.00: risk expand; reduce size
- Regime: TRANSITION
- Tech: UP trend (expanding)
Swing Plan
- Accumulate: 135.00-135.00
- Trim: 160.00-160.00
- Add: close > 160.00
- Cut: close < 135.00
- Best for: transition regime
Raw Text Summary
📌 NBIS @ 154.49 (2026-05-03 08:47 AM MYT)

• Current price is **154.49**. Key support is around **135.00**, and resistance is around **160.00**.
• For the next week, the model’s **68% expected range** is roughly **136.40 to 172.58**.
• A wider **90% range** is about **124.73 to 184.25**.
• Dealer positioning looks **LONG gamma**, so the market behavior is classified as **TRANSITION**.
• The estimated **gamma flip** is near **147.60**. Crossing and holding beyond this area can change the trading behavior.
• Approximate breakout odds: **above resistance 28.6%**, **below support 12.6%** by the target horizon.
• Options skew is tilted toward **puts**, which suggests traders are paying more for downside protection.
• Near-term implied volatility is lower than the next expiry (**IV1 81.54% vs IV2 85.84%**), which suggests a **contango / calmer front expiry** setup.
• On the daily chart, the stock currently looks like **UP trend (expanding)**.
• The implied distribution shows **heavier downside tail risk** than upside tail potential.
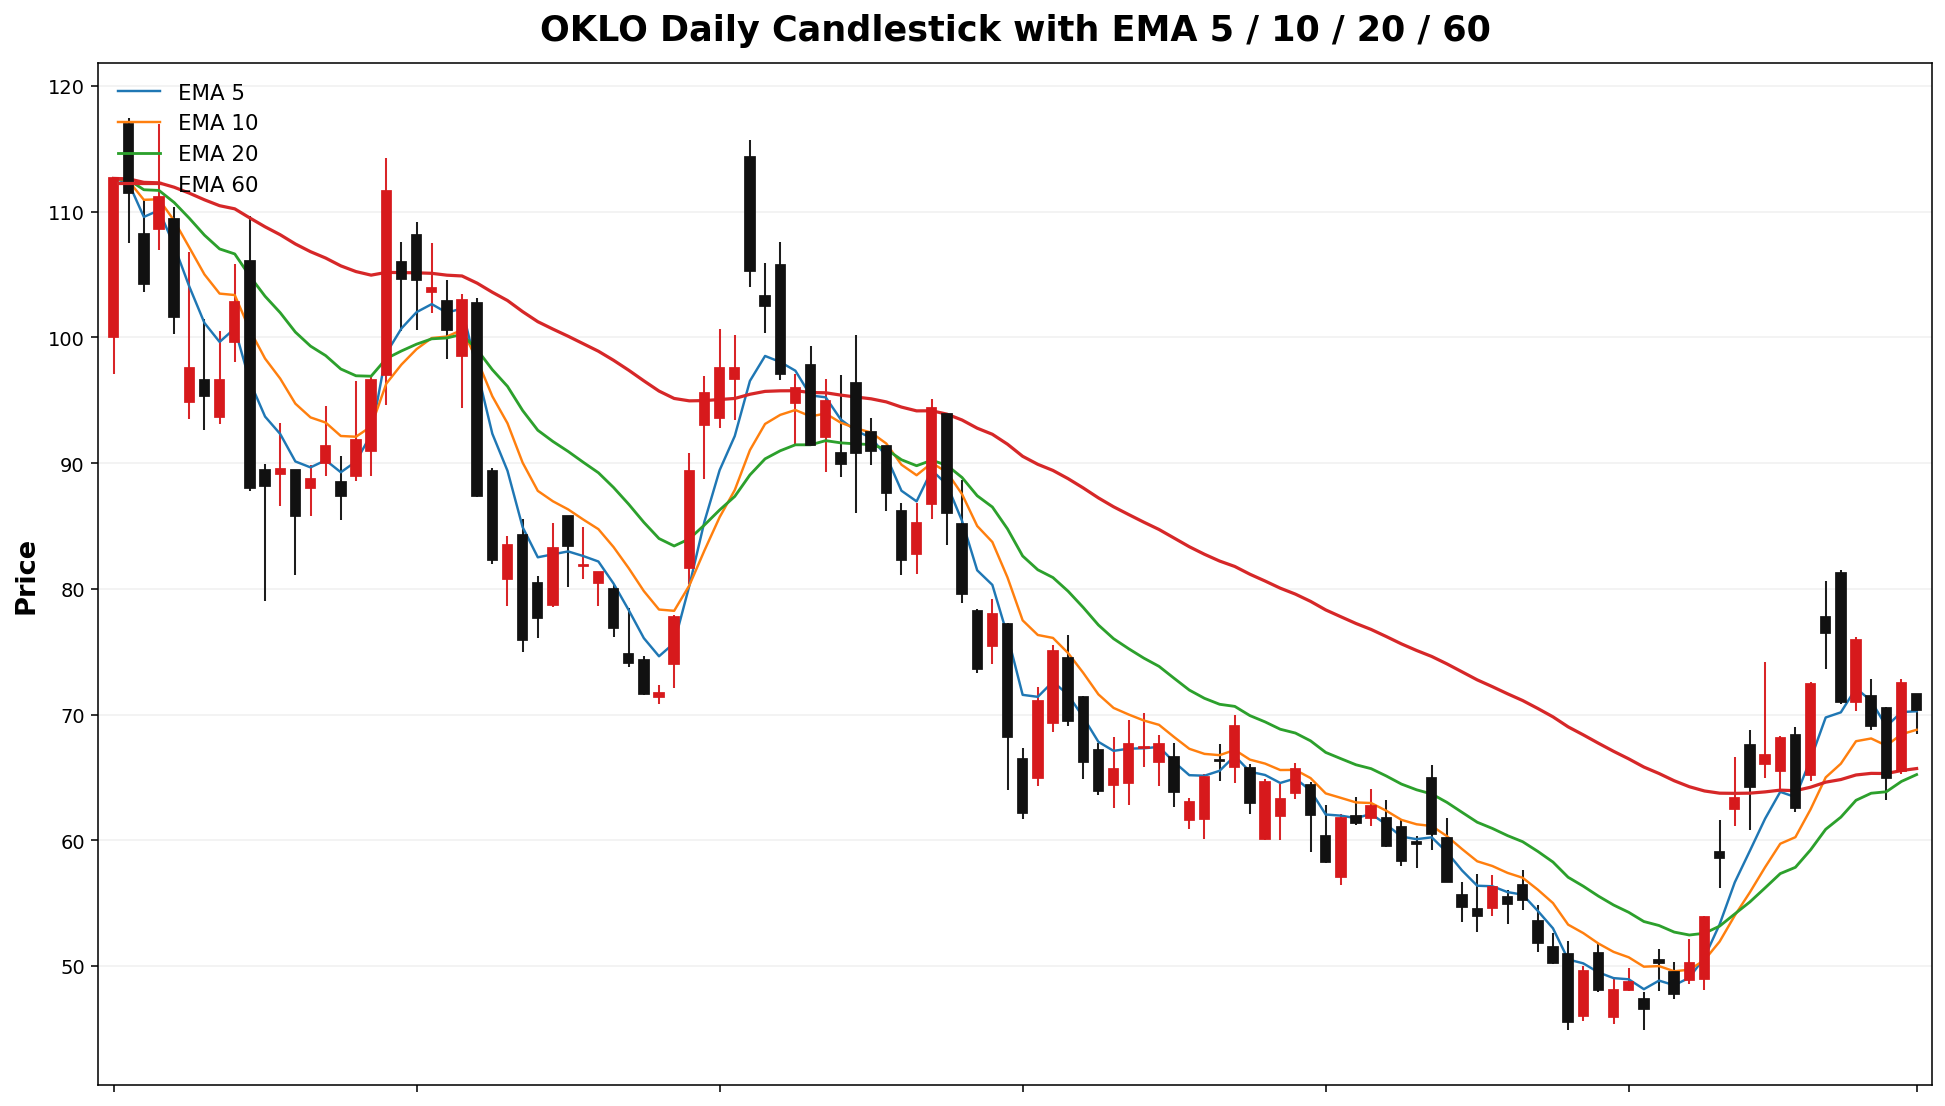
OKLO
Spot: 70.40
Report Time: 2026-05-03 08:47 AM MYT
Regime: TREND
Dealer Gamma: SHORT
Term Structure
| Expiry |
DTE |
Forward |
ATM IV |
ATM Straddle |
| 2026-05-08 |
6 |
70.54 |
82.00% |
7.28 |
| 2026-05-15 |
13 |
70.59 |
87.45% |
11.53 |
Weekly Range
| Confidence |
Low |
High |
Width |
| 68% |
62.07 |
78.73 |
16.67 |
| 80% |
59.72 |
81.08 |
21.36 |
| 90% |
56.69 |
84.11 |
27.41 |
| 95% |
54.07 |
86.73 |
32.66 |
Structure & Probabilities
| Support |
Resistance |
Gamma Flip |
Max Pain |
P>Res |
P<Sup |
| 70.00 |
73.00 |
70.82 |
69.00 |
42.6% |
45.4% |
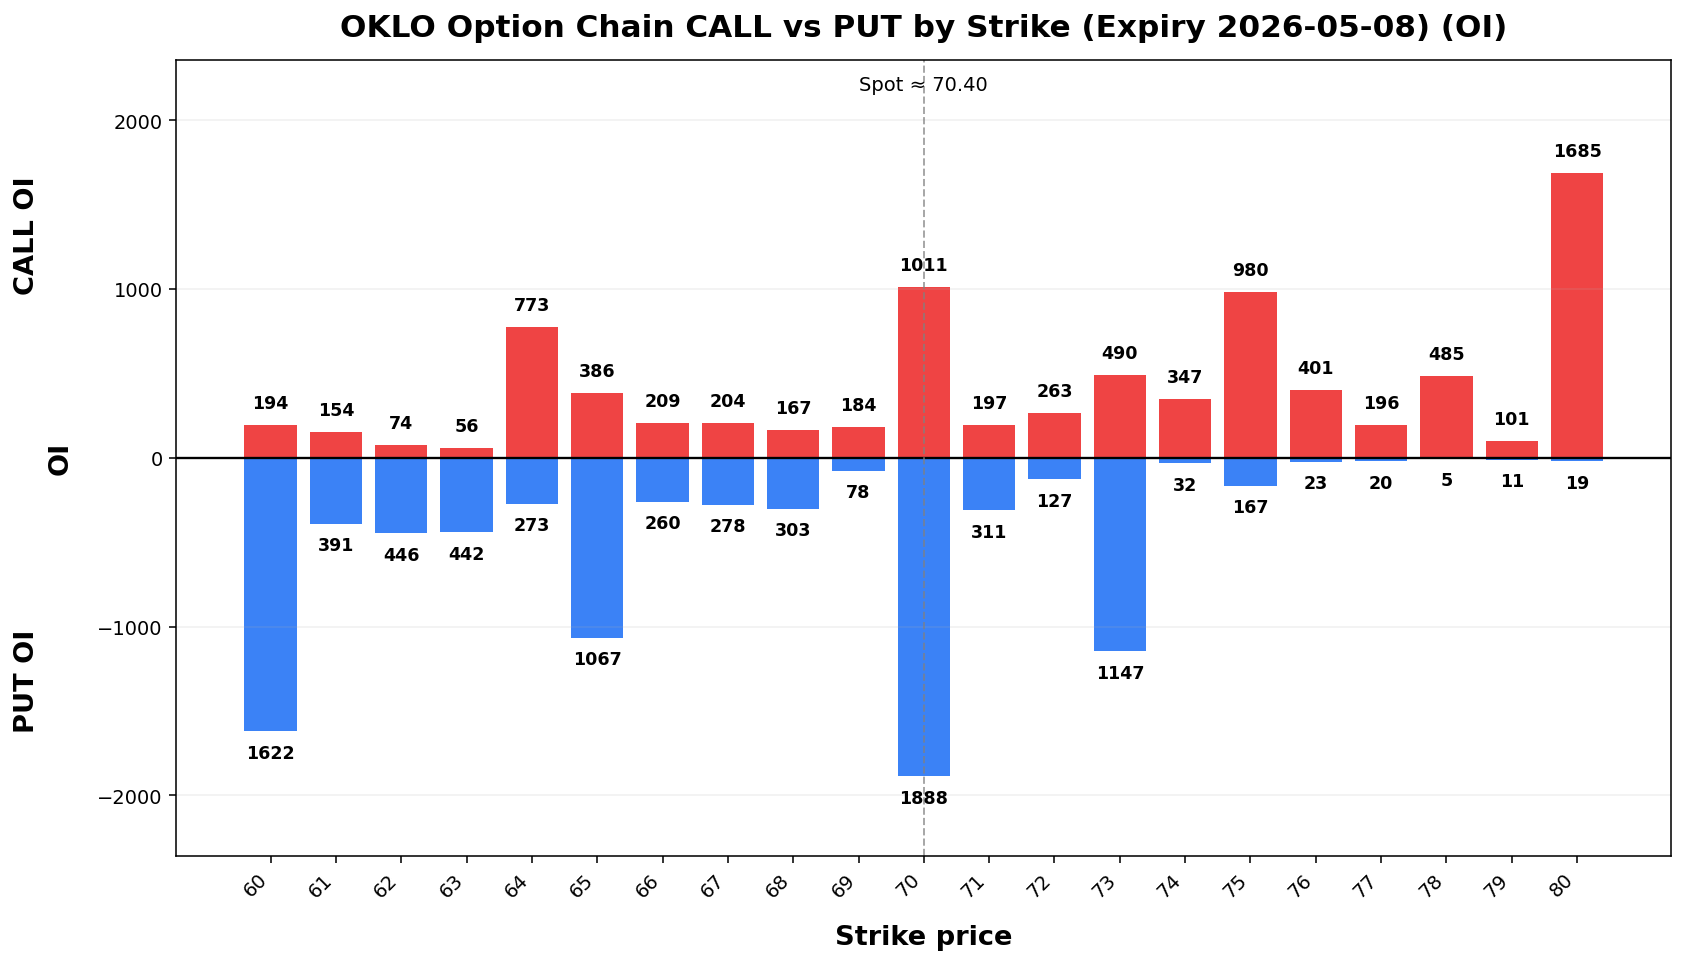
Flow & Skew
| Call Vol |
Put Vol |
Vol P/C |
Call OI |
Put OI |
OI P/C |
Skew |
Skew Bias |
| 10,479 |
15,077 |
1.44 |
14,582 |
36,566 |
2.51 |
-6.30 vol pts |
CALL_SKEW |
Tail Risk
| Q10 |
Q50 |
Q90 |
Down Tail |
Up Tail |
Down/Up |
| 49.02 |
68.51 |
80.90 |
21.38 |
10.50 |
2.04 |
Daily Technicals
| EMA20 |
EMA50 |
VWAP20 |
BB Lower |
BB Mid |
BB Upper |
BB Width |
Vol Ratio |
Path |
| 65.23 |
64.53 |
66.32 |
42.91 |
62.70 |
82.49 |
63.12% |
0.69 |
UP trend (expanding) |
Day Plan
- 70.00-73.00 range: fade extremes
- > 73.00: chase only if hold + vol
- < 70.00: risk expand; reduce size
- Regime: TREND
- Tech: UP trend (expanding)
Swing Plan
- Accumulate: 70.00-70.00
- Trim: 73.00-73.00
- Add: close > 73.00
- Cut: close < 70.00
- Best for: trend regime
Raw Text Summary
📌 OKLO @ 70.40 (2026-05-03 08:47 AM MYT)

• Current price is **70.40**. Key support is around **70.00**, and resistance is around **73.00**.
• For the next week, the model’s **68% expected range** is roughly **62.07 to 78.73**.
• A wider **90% range** is about **56.69 to 84.11**.
• Dealer positioning looks **SHORT gamma**, so the market behavior is classified as **TREND**.
• The estimated **gamma flip** is near **70.82**. Crossing and holding beyond this area can change the trading behavior.
• Approximate breakout odds: **above resistance 42.6%**, **below support 45.4%** by the target horizon.
• Options skew is tilted toward **calls**, which suggests upside speculation is relatively stronger.
• Near-term implied volatility is lower than the next expiry (**IV1 82.00% vs IV2 87.45%**), which suggests a **contango / calmer front expiry** setup.
• Recent volume is only **0.69x** the 20-day average, so breakouts may be less reliable unless volume improves.
• On the daily chart, the stock currently looks like **UP trend (expanding)**.
• The implied distribution shows **heavier downside tail risk** than upside tail potential.
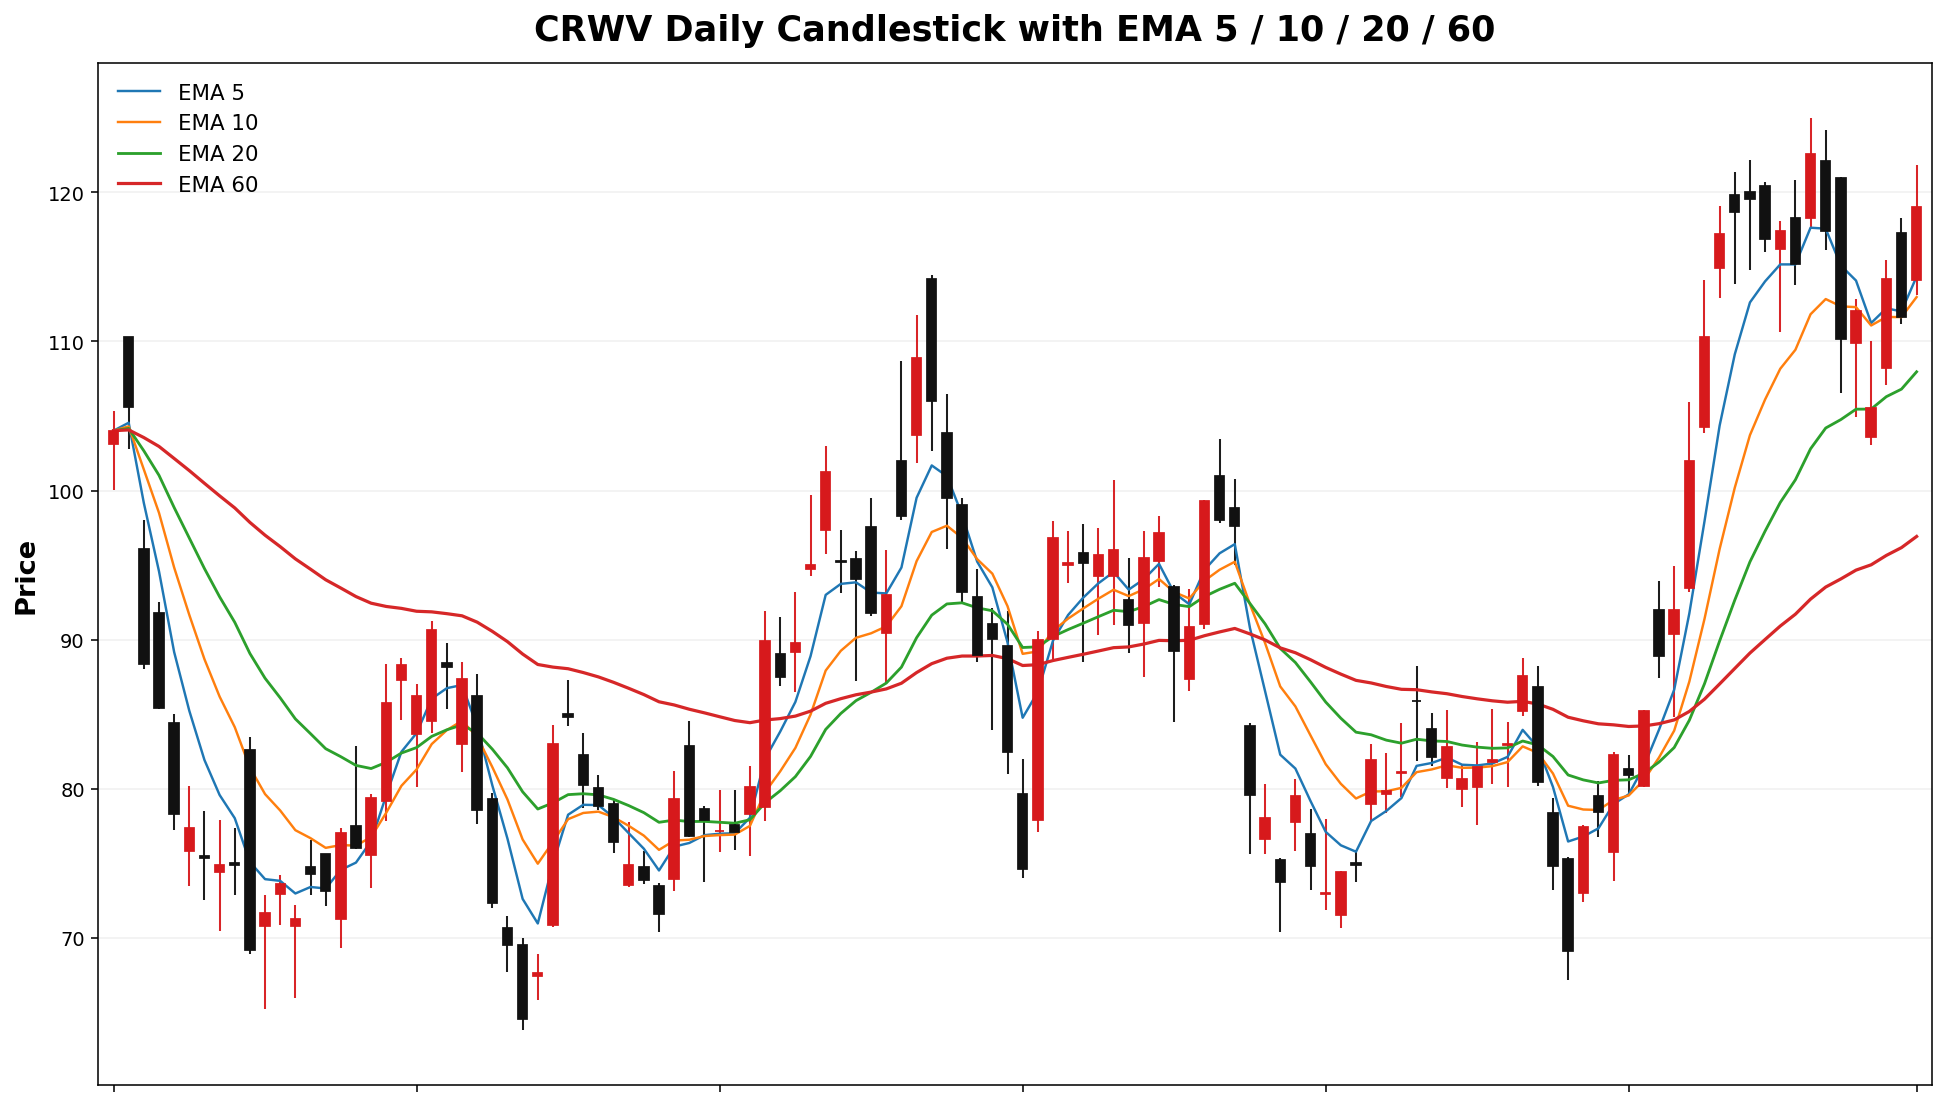
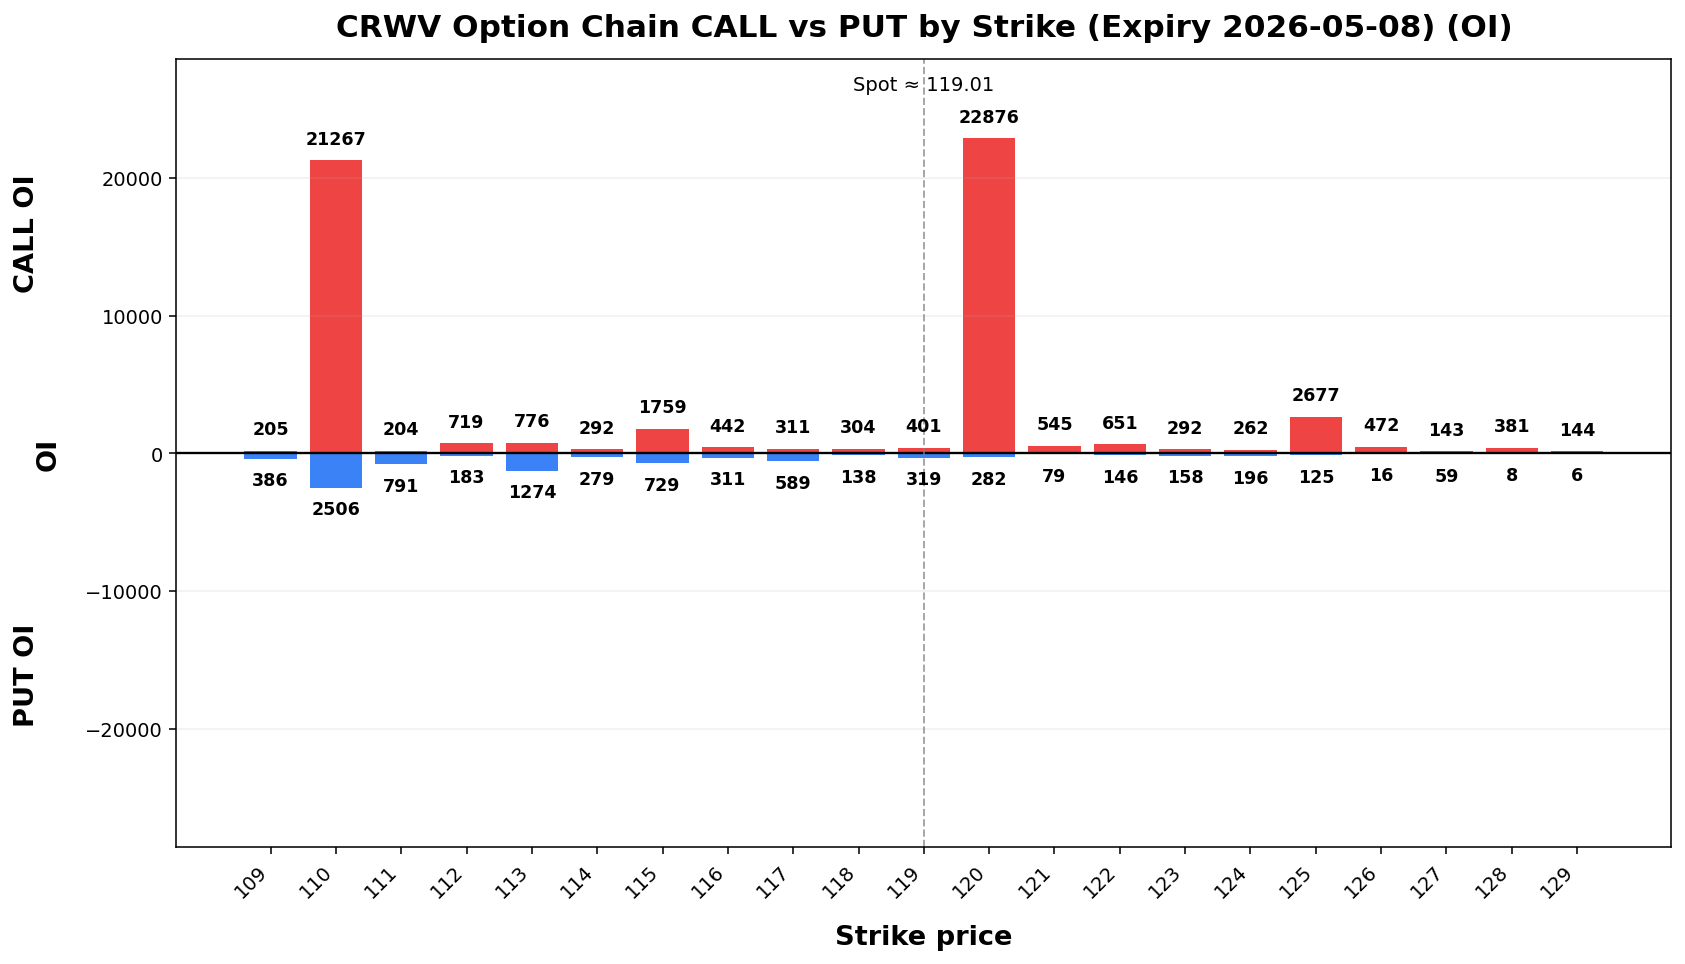
CRWV
Spot: 119.01
Report Time: 2026-05-03 08:47 AM MYT
Regime: TRANSITION
Dealer Gamma: LONG
Term Structure
| Expiry |
DTE |
Forward |
ATM IV |
ATM Straddle |
| 2026-05-08 |
6 |
119.09 |
118.69% |
17.80 |
| 2026-05-15 |
13 |
119.09 |
97.06% |
21.62 |
Weekly Range
| Confidence |
Low |
High |
Width |
| 68% |
100.36 |
137.66 |
37.31 |
| 80% |
95.10 |
142.92 |
47.81 |
| 90% |
88.33 |
149.69 |
61.37 |
| 95% |
82.45 |
155.57 |
73.13 |
Structure & Probabilities
| Support |
Resistance |
Gamma Flip |
Max Pain |
P>Res |
P<Sup |
| 110.00 |
120.00 |
96.77 |
110.00 |
39.3% |
30.9% |
Flow & Skew
| Call Vol |
Put Vol |
Vol P/C |
Call OI |
Put OI |
OI P/C |
Skew |
Skew Bias |
| 28,888 |
57,184 |
1.98 |
74,539 |
78,454 |
1.05 |
14.16 vol pts |
PUT_SKEW |
Tail Risk
| Q10 |
Q50 |
Q90 |
Down Tail |
Up Tail |
Down/Up |
| 77.66 |
118.85 |
145.94 |
41.35 |
26.93 |
1.54 |
Daily Technicals
| EMA20 |
EMA50 |
VWAP20 |
BB Lower |
BB Mid |
BB Upper |
BB Width |
Vol Ratio |
Path |
| 107.96 |
98.59 |
108.33 |
83.92 |
108.84 |
133.75 |
45.79% |
0.82 |
UP trend (expanding) |
Day Plan
- 110.00-120.00 range: fade extremes
- > 120.00: chase only if hold + vol
- < 110.00: risk expand; reduce size
- Regime: TRANSITION
- Tech: UP trend (expanding)
Swing Plan
- Accumulate: 110.00-110.00
- Trim: 120.00-120.00
- Add: close > 120.00
- Cut: close < 110.00
- Best for: transition regime
Raw Text Summary
📌 CRWV @ 119.01 (2026-05-03 08:47 AM MYT)

• Current price is **119.01**. Key support is around **110.00**, and resistance is around **120.00**.
• For the next week, the model’s **68% expected range** is roughly **100.36 to 137.66**.
• A wider **90% range** is about **88.33 to 149.69**.
• Dealer positioning looks **LONG gamma**, so the market behavior is classified as **TRANSITION**.
• The estimated **gamma flip** is near **96.77**. Crossing and holding beyond this area can change the trading behavior.
• Approximate breakout odds: **above resistance 39.3%**, **below support 30.9%** by the target horizon.
• Options skew is tilted toward **puts**, which suggests traders are paying more for downside protection.
• Near-term implied volatility is higher than the next expiry (**IV1 118.69% vs IV2 97.06%**), which suggests **near-term event stress / backwardation**.
• On the daily chart, the stock currently looks like **UP trend (expanding)**.
• The implied distribution shows **heavier downside tail risk** than upside tail potential.
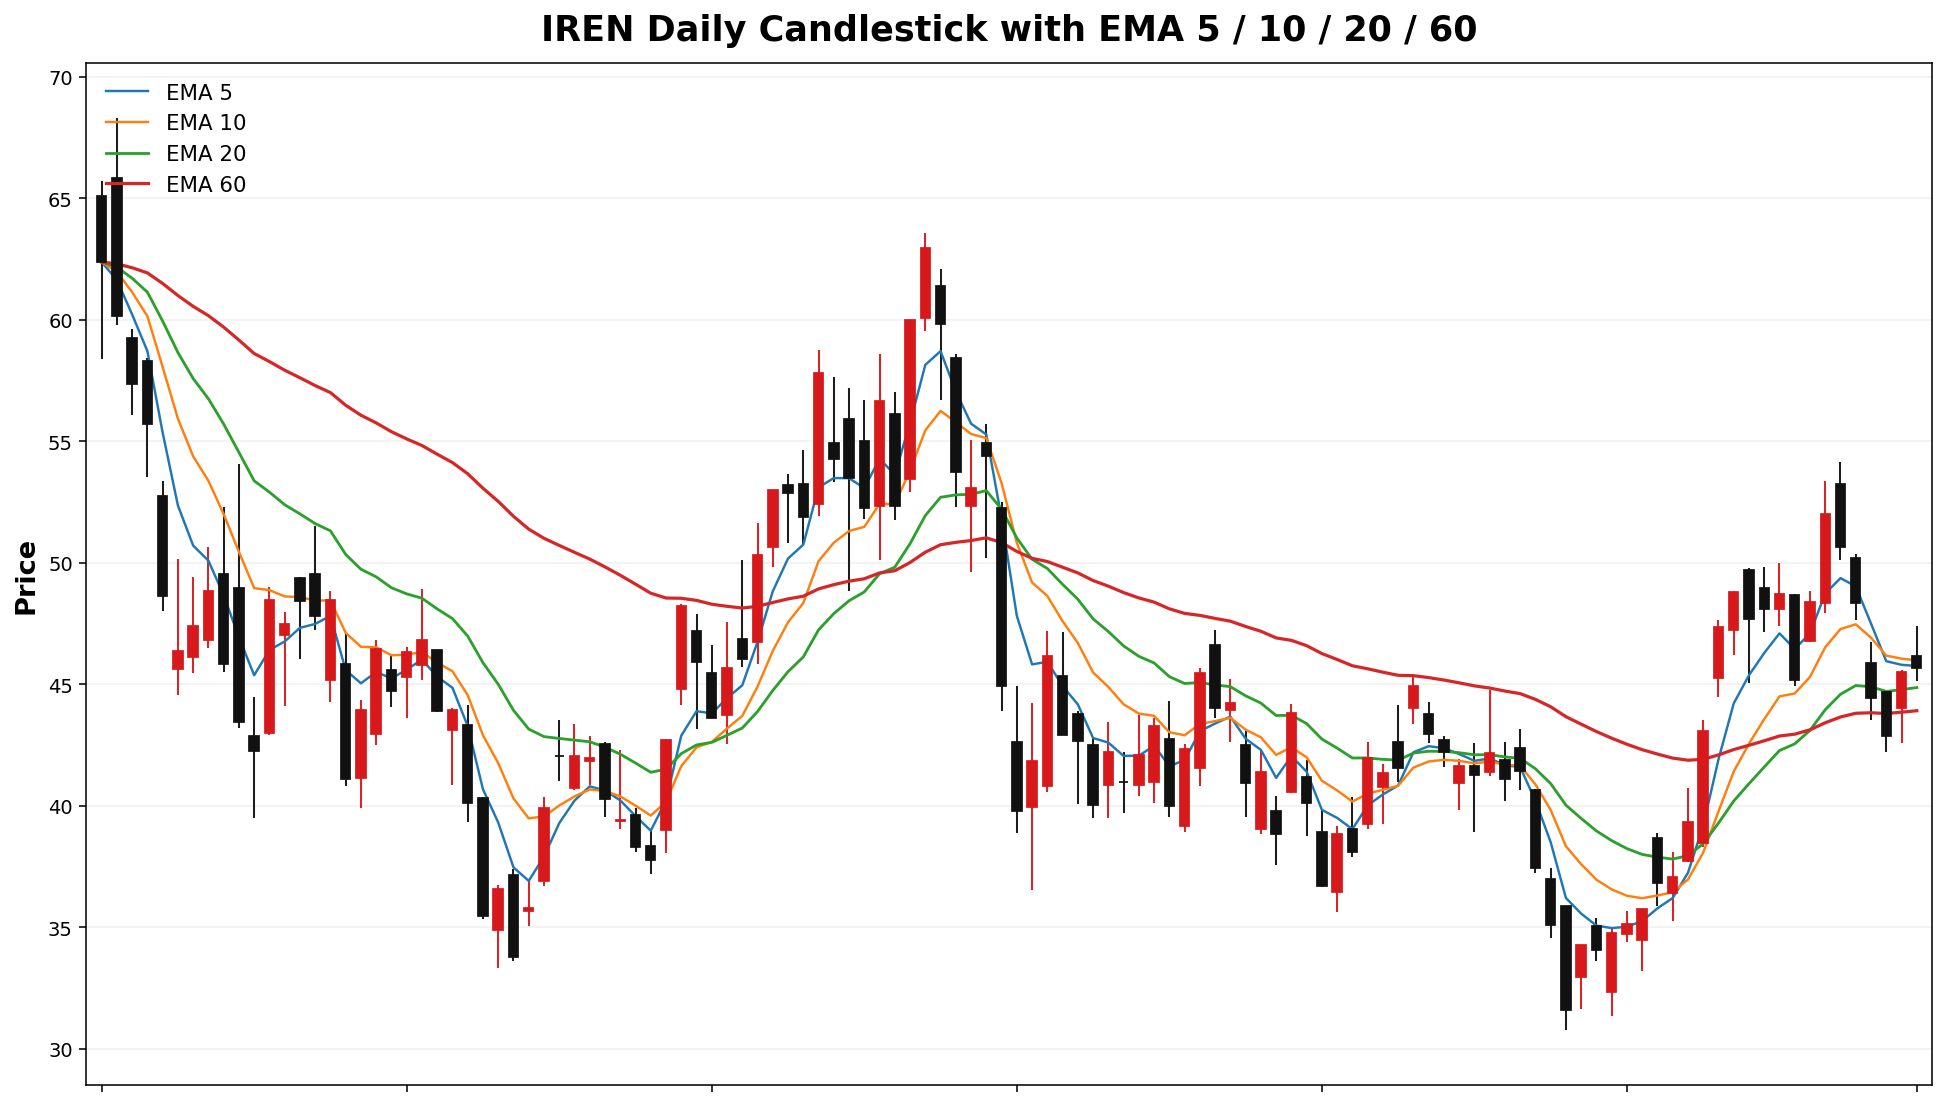
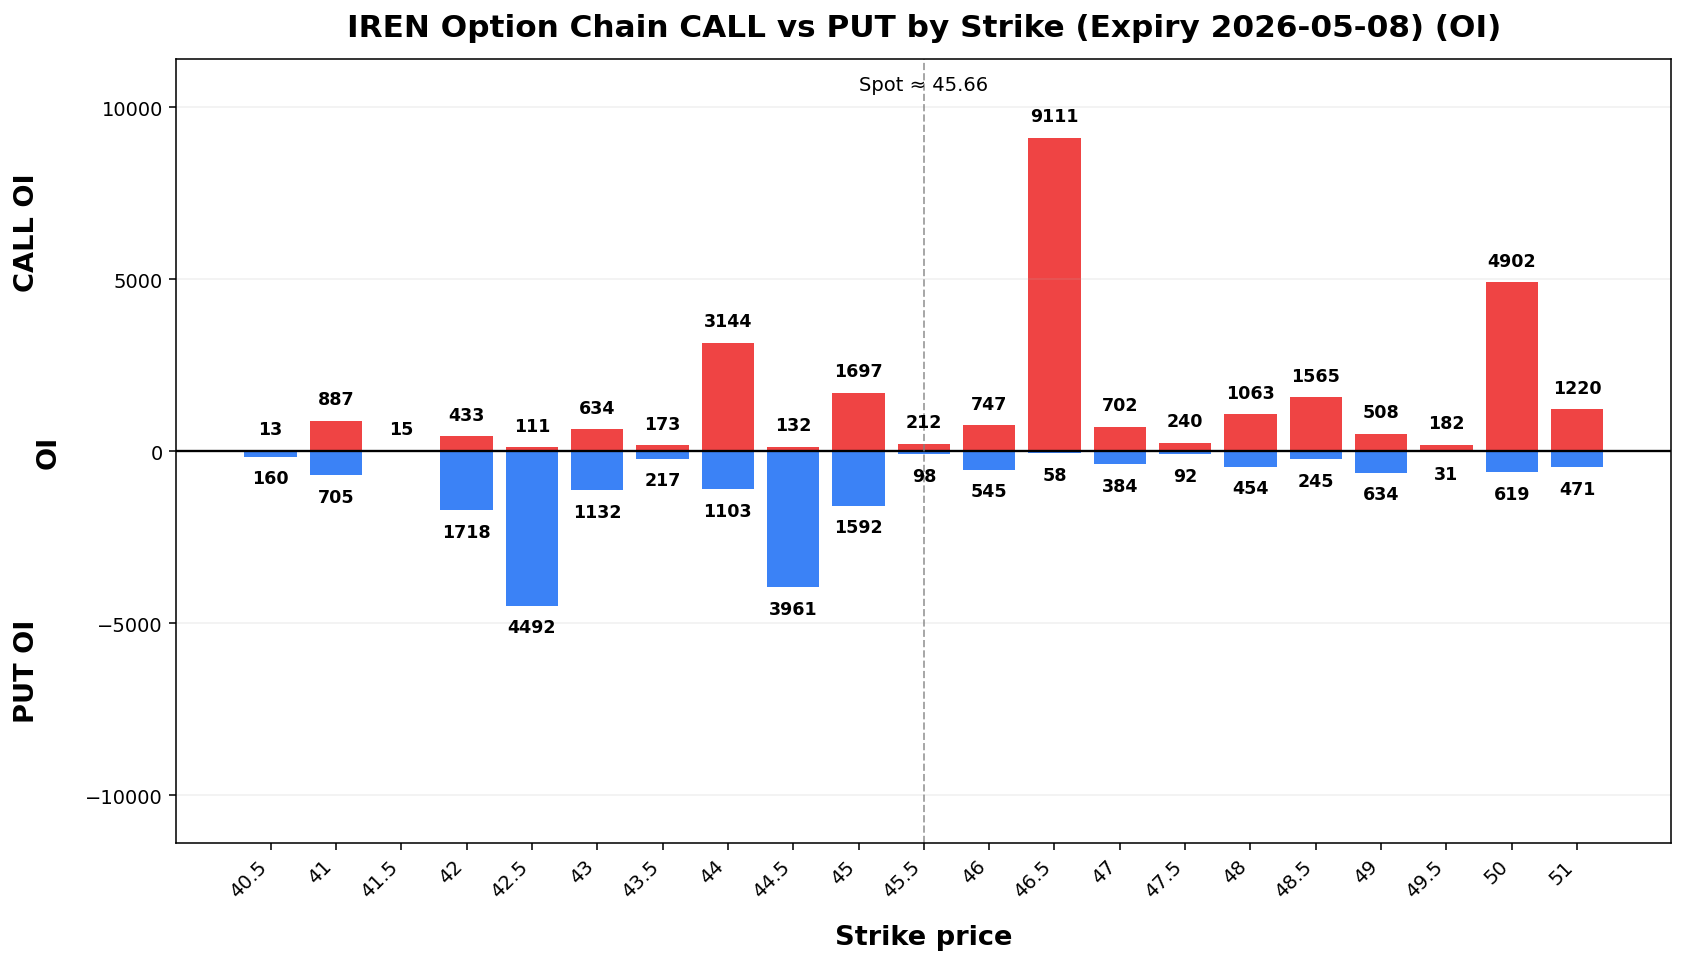
IREN
Spot: 45.66
Report Time: 2026-05-03 08:47 AM MYT
Regime: TRANSITION
Dealer Gamma: LONG
Term Structure
| Expiry |
DTE |
Forward |
ATM IV |
ATM Straddle |
| 2026-05-08 |
6 |
45.70 |
120.35% |
6.92 |
| 2026-05-15 |
13 |
45.74 |
99.15% |
8.47 |
Weekly Range
| Confidence |
Low |
High |
Width |
| 68% |
38.39 |
52.93 |
14.54 |
| 80% |
36.34 |
54.98 |
18.64 |
| 90% |
33.70 |
57.62 |
23.92 |
| 95% |
31.41 |
59.91 |
28.51 |
Structure & Probabilities
| Support |
Resistance |
Gamma Flip |
Max Pain |
P>Res |
P<Sup |
| 42.50 |
46.50 |
43.86 |
44.50 |
37.7% |
27.6% |
Flow & Skew
| Call Vol |
Put Vol |
Vol P/C |
Call OI |
Put OI |
OI P/C |
Skew |
Skew Bias |
| 43,764 |
28,163 |
0.64 |
57,323 |
93,821 |
1.64 |
0.59 vol pts |
FLAT |
Tail Risk
| Q10 |
Q50 |
Q90 |
Down Tail |
Up Tail |
Down/Up |
| 26.02 |
43.95 |
55.87 |
19.64 |
10.21 |
1.92 |
Daily Technicals
| EMA20 |
EMA50 |
VWAP20 |
BB Lower |
BB Mid |
BB Upper |
BB Width |
Vol Ratio |
Path |
| 44.87 |
43.64 |
45.10 |
34.23 |
44.55 |
54.86 |
46.31% |
0.75 |
UP trend (expanding) |
Day Plan
- 42.50-46.50 range: fade extremes
- > 46.50: chase only if hold + vol
- < 42.50: risk expand; reduce size
- Regime: TRANSITION
- Tech: UP trend (expanding)
Swing Plan
- Accumulate: 42.50-42.50
- Trim: 46.50-46.50
- Add: close > 46.50
- Cut: close < 42.50
- Best for: transition regime
Raw Text Summary
📌 IREN @ 45.66 (2026-05-03 08:47 AM MYT)

• Current price is **45.66**. Key support is around **42.50**, and resistance is around **46.50**.
• For the next week, the model’s **68% expected range** is roughly **38.39 to 52.93**.
• A wider **90% range** is about **33.70 to 57.62**.
• Dealer positioning looks **LONG gamma**, so the market behavior is classified as **TRANSITION**.
• The estimated **gamma flip** is near **43.86**. Crossing and holding beyond this area can change the trading behavior.
• Approximate breakout odds: **above resistance 37.7%**, **below support 27.6%** by the target horizon.
• Options skew is fairly balanced, so there is **no strong directional bias** from skew alone.
• Near-term implied volatility is higher than the next expiry (**IV1 120.35% vs IV2 99.15%**), which suggests **near-term event stress / backwardation**.
• Recent volume is only **0.75x** the 20-day average, so breakouts may be less reliable unless volume improves.
• On the daily chart, the stock currently looks like **UP trend (expanding)**.
• The implied distribution shows **heavier downside tail risk** than upside tail potential.
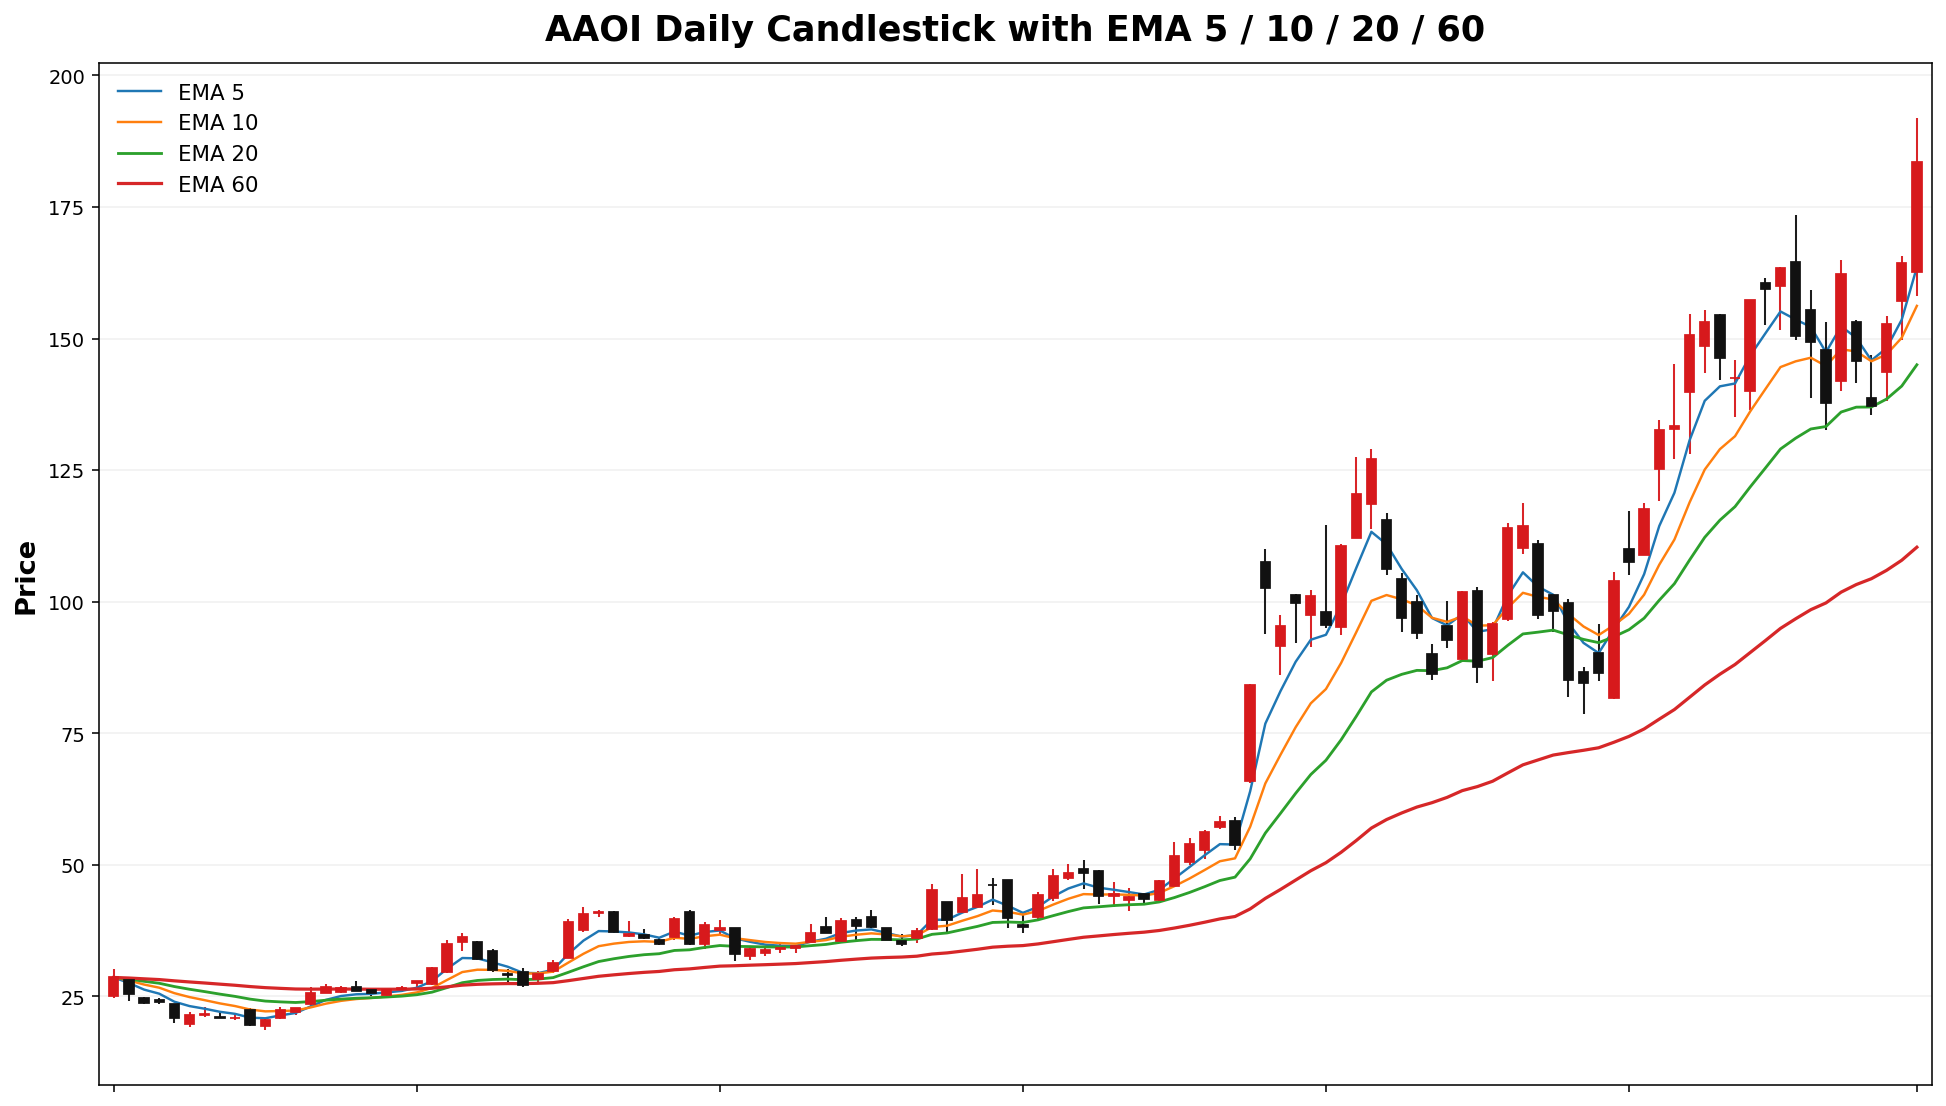
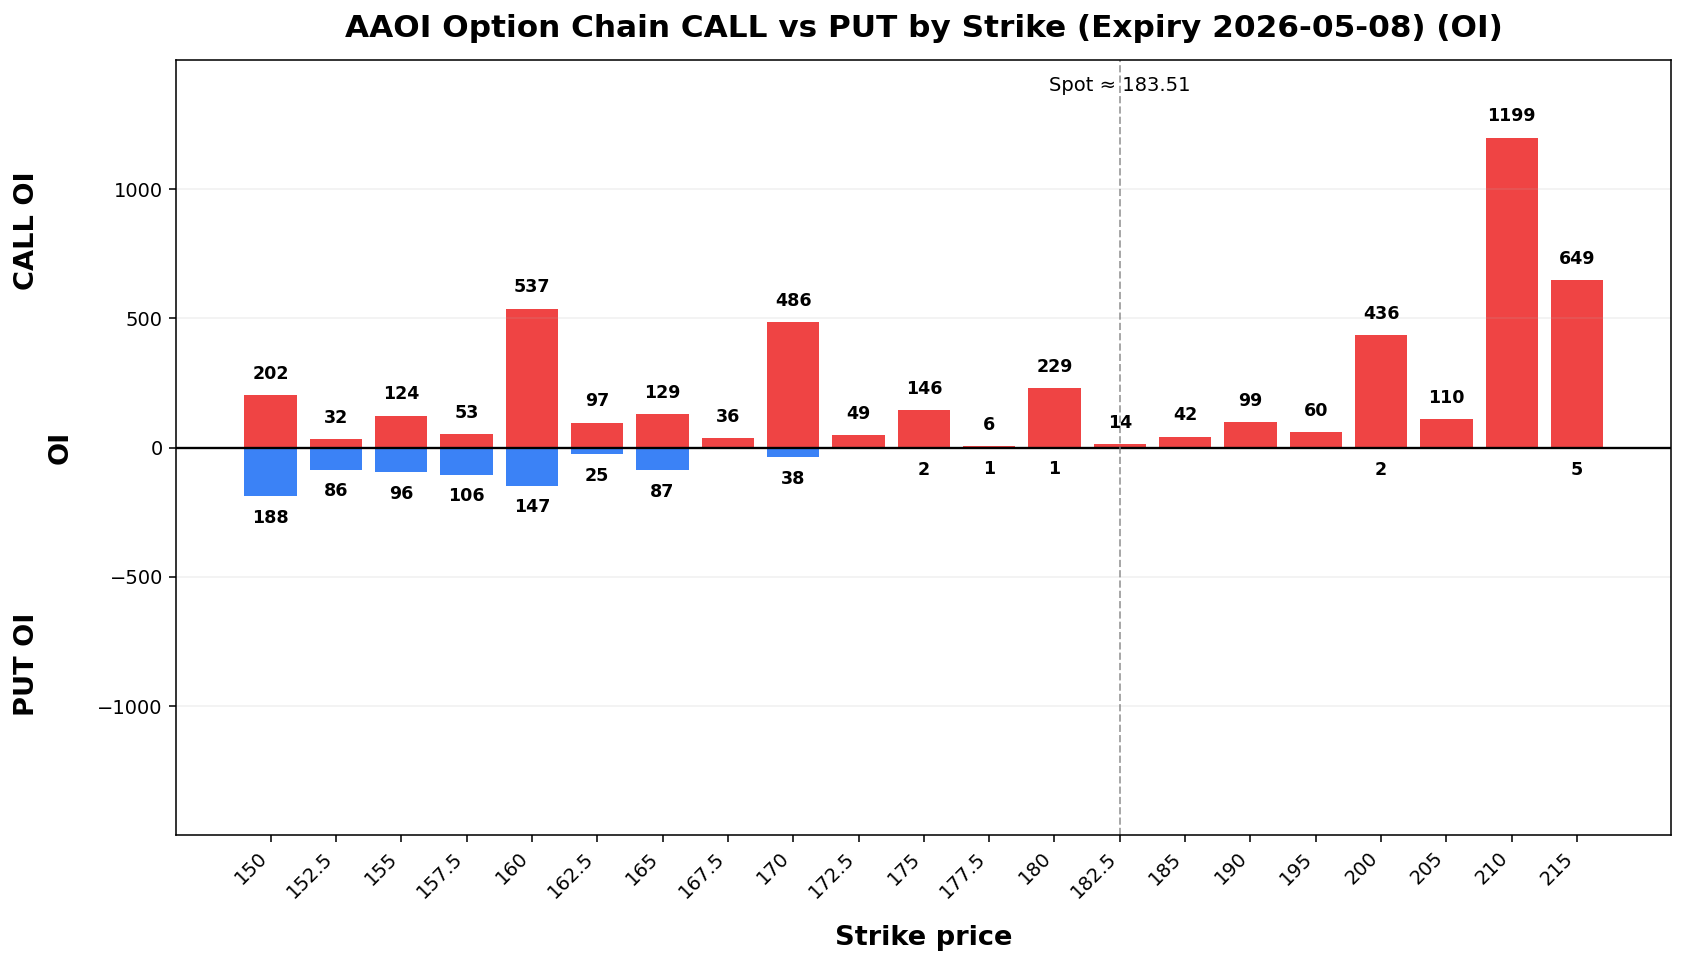
AAOI
Spot: 183.51
Report Time: 2026-05-03 08:47 AM MYT
Regime: TRANSITION
Dealer Gamma: LONG
Term Structure
| Expiry |
DTE |
Forward |
ATM IV |
ATM Straddle |
| 2026-05-08 |
6 |
183.80 |
183.56% |
42.45 |
| 2026-05-15 |
13 |
183.95 |
150.64% |
51.75 |
Weekly Range
| Confidence |
Low |
High |
Width |
| 68% |
138.98 |
228.04 |
89.06 |
| 80% |
126.44 |
240.58 |
114.14 |
| 90% |
110.26 |
256.76 |
146.50 |
| 95% |
96.23 |
270.79 |
174.56 |
Structure & Probabilities
| Support |
Resistance |
Gamma Flip |
Max Pain |
P>Res |
P<Sup |
| 160.00 |
210.00 |
148.23 |
142.00 |
22.7% |
29.3% |
Flow & Skew
| Call Vol |
Put Vol |
Vol P/C |
Call OI |
Put OI |
OI P/C |
Skew |
Skew Bias |
| 8,222 |
14,740 |
1.79 |
9,553 |
12,060 |
1.26 |
7.86 vol pts |
PUT_SKEW |
Tail Risk
| Q10 |
Q50 |
Q90 |
Down Tail |
Up Tail |
Down/Up |
| 122.40 |
168.95 |
235.87 |
61.11 |
52.36 |
1.17 |
Daily Technicals
| EMA20 |
EMA50 |
VWAP20 |
BB Lower |
BB Mid |
BB Upper |
BB Width |
Vol Ratio |
Path |
| 145.01 |
117.39 |
144.16 |
113.30 |
147.38 |
181.47 |
46.25% |
1.14 |
UP trend (expanding) |
Day Plan
- 160.00-210.00 range: fade extremes
- > 210.00: chase only if hold + vol
- < 160.00: risk expand; reduce size
- Regime: TRANSITION
- Tech: UP trend (expanding)
Swing Plan
- Accumulate: 160.00-160.00
- Trim: 210.00-210.00
- Add: close > 210.00
- Cut: close < 160.00
- Best for: transition regime
Raw Text Summary
📌 AAOI @ 183.51 (2026-05-03 08:47 AM MYT)

• Current price is **183.51**. Key support is around **160.00**, and resistance is around **210.00**.
• For the next week, the model’s **68% expected range** is roughly **138.98 to 228.04**.
• A wider **90% range** is about **110.26 to 256.76**.
• Dealer positioning looks **LONG gamma**, so the market behavior is classified as **TRANSITION**.
• The estimated **gamma flip** is near **148.23**. Crossing and holding beyond this area can change the trading behavior.
• Approximate breakout odds: **above resistance 22.7%**, **below support 29.3%** by the target horizon.
• Options skew is tilted toward **puts**, which suggests traders are paying more for downside protection.
• Near-term implied volatility is higher than the next expiry (**IV1 183.56% vs IV2 150.64%**), which suggests **near-term event stress / backwardation**.
• On the daily chart, the stock currently looks like **UP trend (expanding)**.
• The implied distribution shows **heavier downside tail risk** than upside tail potential.
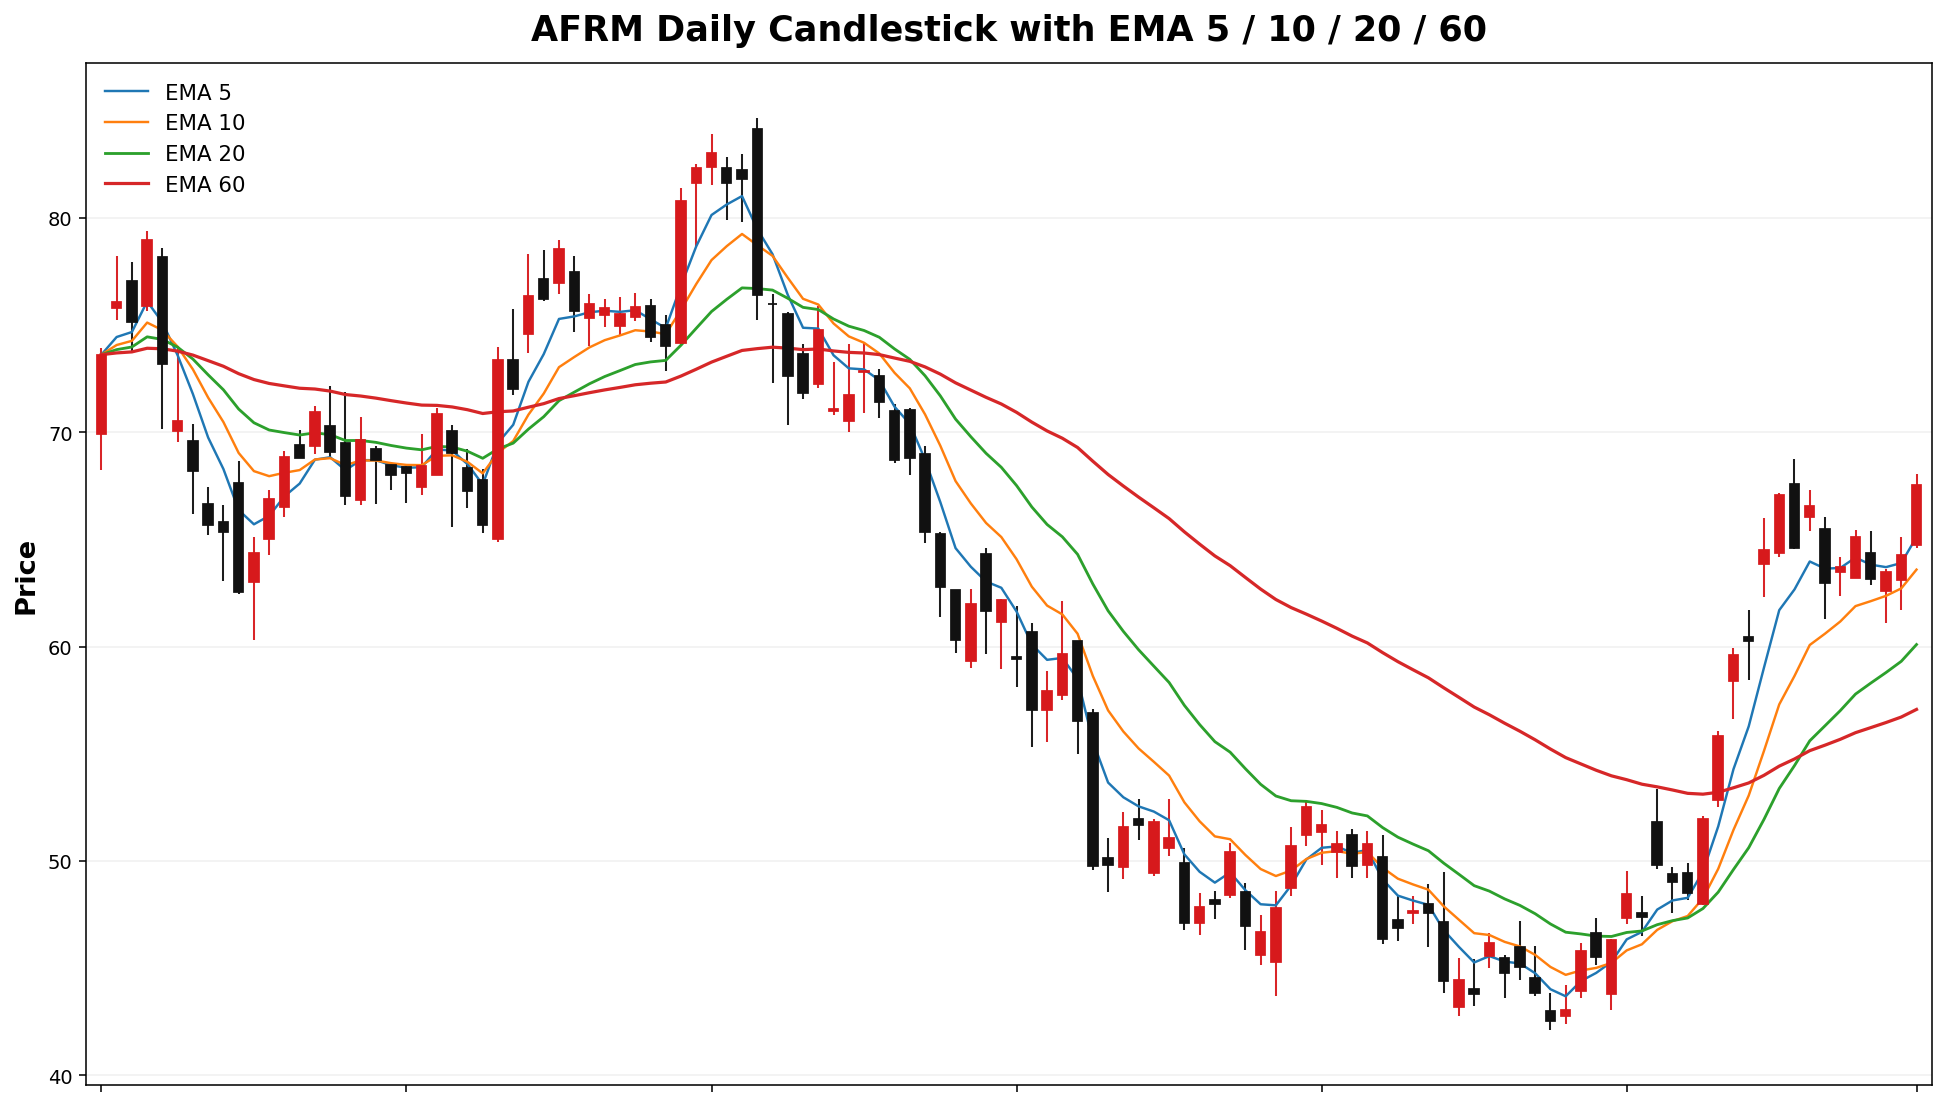
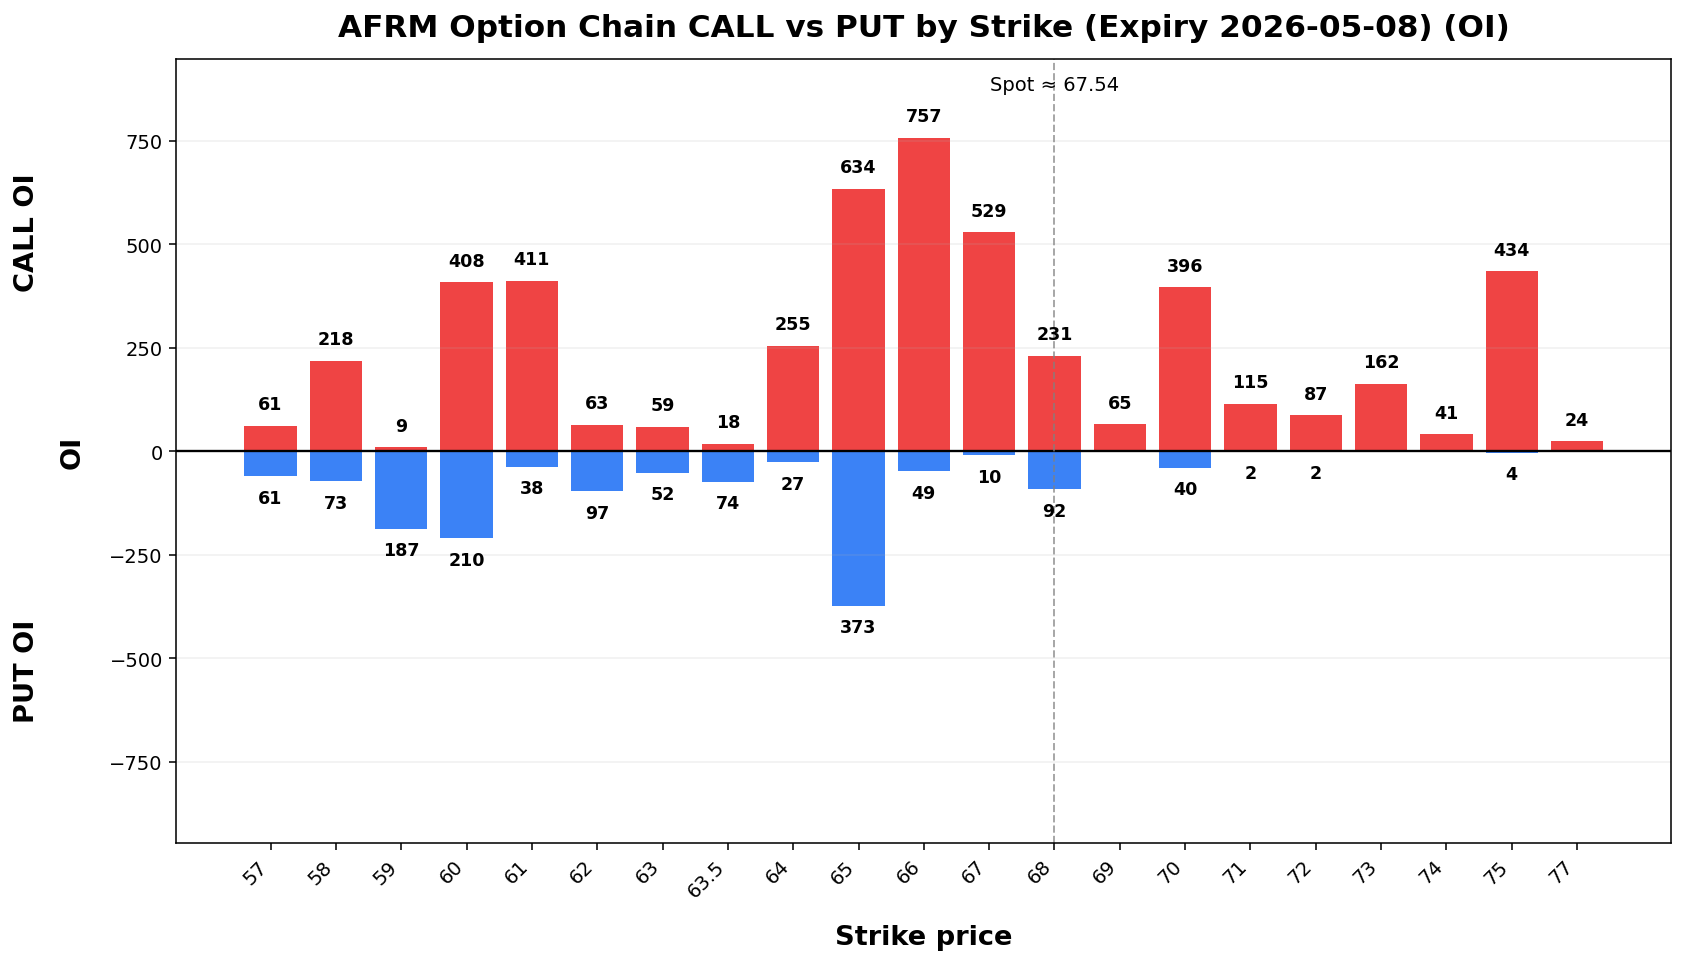
AFRM
Spot: 67.54
Report Time: 2026-05-03 08:47 AM MYT
Regime: TRANSITION
Dealer Gamma: LONG
Term Structure
| Expiry |
DTE |
Forward |
ATM IV |
ATM Straddle |
| 2026-05-08 |
6 |
67.63 |
114.56% |
9.75 |
| 2026-05-15 |
13 |
67.66 |
87.99% |
11.12 |
Weekly Range
| Confidence |
Low |
High |
Width |
| 68% |
57.49 |
77.59 |
20.10 |
| 80% |
54.66 |
80.42 |
25.76 |
| 90% |
51.01 |
84.07 |
33.06 |
| 95% |
47.84 |
87.24 |
39.39 |
Structure & Probabilities
| Support |
Resistance |
Gamma Flip |
Max Pain |
P>Res |
P<Sup |
| 67.00 |
70.00 |
43.41 |
53.00 |
33.1% |
47.0% |
Flow & Skew
| Call Vol |
Put Vol |
Vol P/C |
Call OI |
Put OI |
OI P/C |
Skew |
Skew Bias |
| 5,534 |
2,069 |
0.37 |
7,686 |
4,309 |
0.56 |
6.54 vol pts |
PUT_SKEW |
Tail Risk
| Q10 |
Q50 |
Q90 |
Down Tail |
Up Tail |
Down/Up |
| 44.06 |
65.40 |
81.17 |
23.48 |
13.63 |
1.72 |
Daily Technicals
| EMA20 |
EMA50 |
VWAP20 |
BB Lower |
BB Mid |
BB Upper |
BB Width |
Vol Ratio |
Path |
| 60.10 |
56.85 |
59.38 |
44.70 |
59.20 |
73.69 |
48.98% |
1.26 |
UP trend (expanding) |
Day Plan
- 67.00-70.00 range: fade extremes
- > 70.00: chase only if hold + vol
- < 67.00: risk expand; reduce size
- Regime: TRANSITION
- Tech: UP trend (expanding)
Swing Plan
- Accumulate: 67.00-67.00
- Trim: 70.00-70.00
- Add: close > 70.00
- Cut: close < 67.00
- Best for: transition regime
Raw Text Summary
📌 AFRM @ 67.54 (2026-05-03 08:47 AM MYT)

• Current price is **67.54**. Key support is around **67.00**, and resistance is around **70.00**.
• For the next week, the model’s **68% expected range** is roughly **57.49 to 77.59**.
• A wider **90% range** is about **51.01 to 84.07**.
• Dealer positioning looks **LONG gamma**, so the market behavior is classified as **TRANSITION**.
• The estimated **gamma flip** is near **43.41**. Crossing and holding beyond this area can change the trading behavior.
• Approximate breakout odds: **above resistance 33.1%**, **below support 47.0%** by the target horizon.
• Options skew is tilted toward **puts**, which suggests traders are paying more for downside protection.
• Near-term implied volatility is higher than the next expiry (**IV1 114.56% vs IV2 87.99%**), which suggests **near-term event stress / backwardation**.
• On the daily chart, the stock currently looks like **UP trend (expanding)**.
• The implied distribution shows **heavier downside tail risk** than upside tail potential.
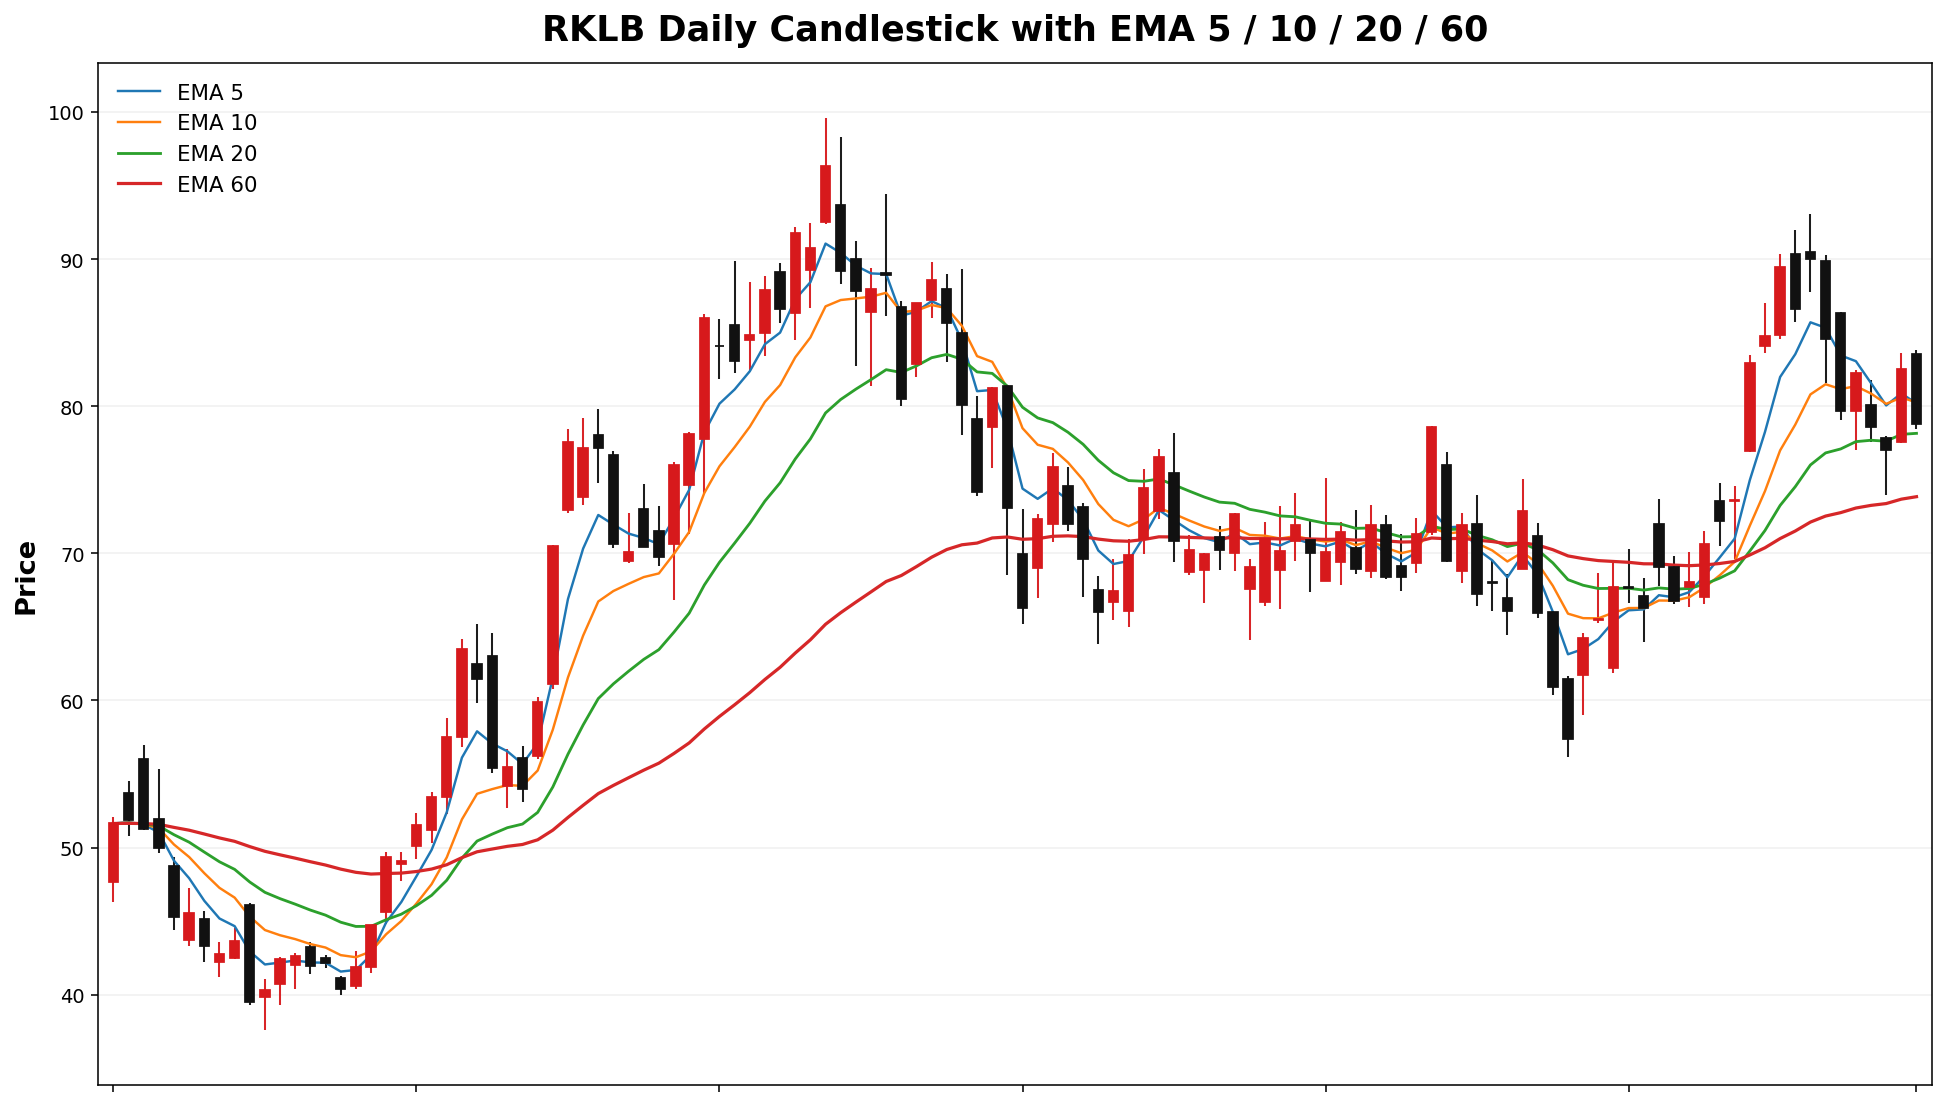
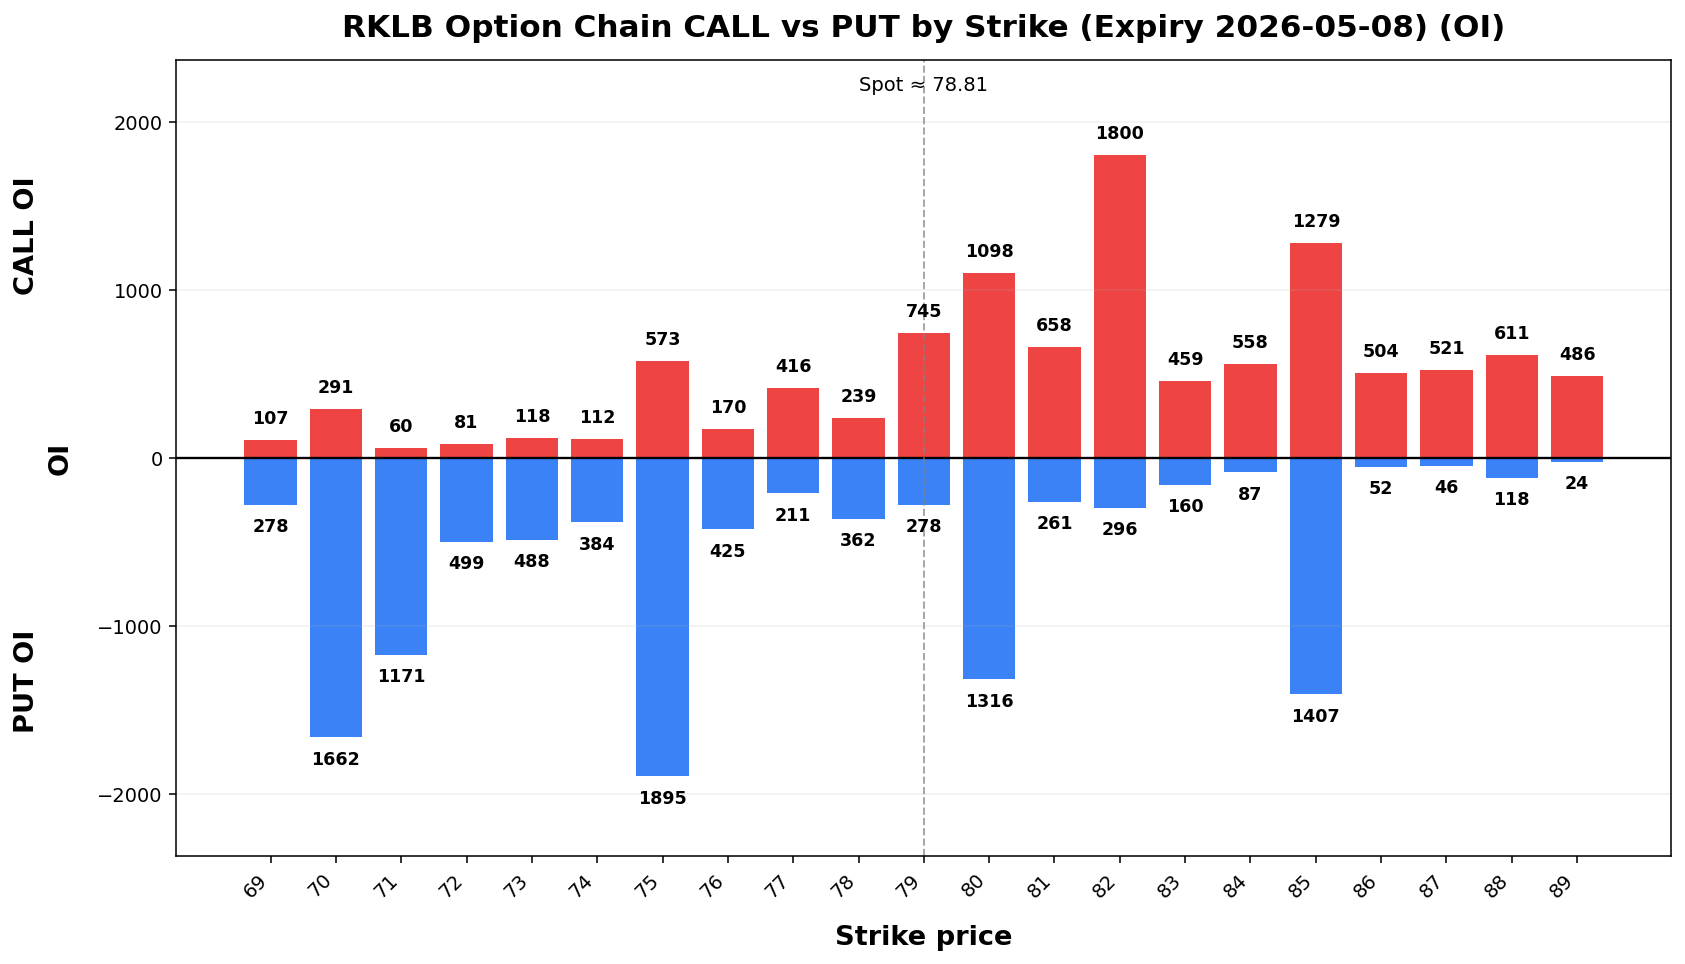
RKLB
Spot: 78.81
Report Time: 2026-05-03 08:47 AM MYT
Regime: TRANSITION
Dealer Gamma: LONG
Term Structure
| Expiry |
DTE |
Forward |
ATM IV |
ATM Straddle |
| 2026-05-08 |
6 |
78.91 |
88.36% |
8.78 |
| 2026-05-15 |
13 |
78.88 |
77.44% |
11.43 |
Weekly Range
| Confidence |
Low |
High |
Width |
| 68% |
69.43 |
88.19 |
18.77 |
| 80% |
66.78 |
90.84 |
24.05 |
| 90% |
63.37 |
94.25 |
30.87 |
| 95% |
60.42 |
97.20 |
36.79 |
Structure & Probabilities
| Support |
Resistance |
Gamma Flip |
Max Pain |
P>Res |
P<Sup |
| 75.00 |
82.00 |
75.90 |
80.00 |
33.5% |
26.1% |
Flow & Skew
| Call Vol |
Put Vol |
Vol P/C |
Call OI |
Put OI |
OI P/C |
Skew |
Skew Bias |
| 14,060 |
13,421 |
0.95 |
26,845 |
22,727 |
0.85 |
-2.00 vol pts |
CALL_SKEW |
Tail Risk
| Q10 |
Q50 |
Q90 |
Down Tail |
Up Tail |
Down/Up |
| 58.69 |
77.07 |
91.20 |
20.12 |
12.39 |
1.62 |
Daily Technicals
| EMA20 |
EMA50 |
VWAP20 |
BB Lower |
BB Mid |
BB Upper |
BB Width |
Vol Ratio |
Path |
| 78.16 |
74.64 |
78.09 |
61.95 |
77.58 |
93.22 |
40.30% |
0.73 |
UP trend (expanding) |
Day Plan
- 75.00-82.00 range: fade extremes
- > 82.00: chase only if hold + vol
- < 75.00: risk expand; reduce size
- Regime: TRANSITION
- Tech: UP trend (expanding)
Swing Plan
- Accumulate: 75.00-75.00
- Trim: 82.00-82.00
- Add: close > 82.00
- Cut: close < 75.00
- Best for: transition regime
Raw Text Summary
📌 RKLB @ 78.81 (2026-05-03 08:47 AM MYT)

• Current price is **78.81**. Key support is around **75.00**, and resistance is around **82.00**.
• For the next week, the model’s **68% expected range** is roughly **69.43 to 88.19**.
• A wider **90% range** is about **63.37 to 94.25**.
• Dealer positioning looks **LONG gamma**, so the market behavior is classified as **TRANSITION**.
• The estimated **gamma flip** is near **75.90**. Crossing and holding beyond this area can change the trading behavior.
• Approximate breakout odds: **above resistance 33.5%**, **below support 26.1%** by the target horizon.
• Options skew is tilted toward **calls**, which suggests upside speculation is relatively stronger.
• Near-term implied volatility is higher than the next expiry (**IV1 88.36% vs IV2 77.44%**), which suggests **near-term event stress / backwardation**.
• Recent volume is only **0.73x** the 20-day average, so breakouts may be less reliable unless volume improves.
• On the daily chart, the stock currently looks like **UP trend (expanding)**.
• The implied distribution shows **heavier downside tail risk** than upside tail potential.
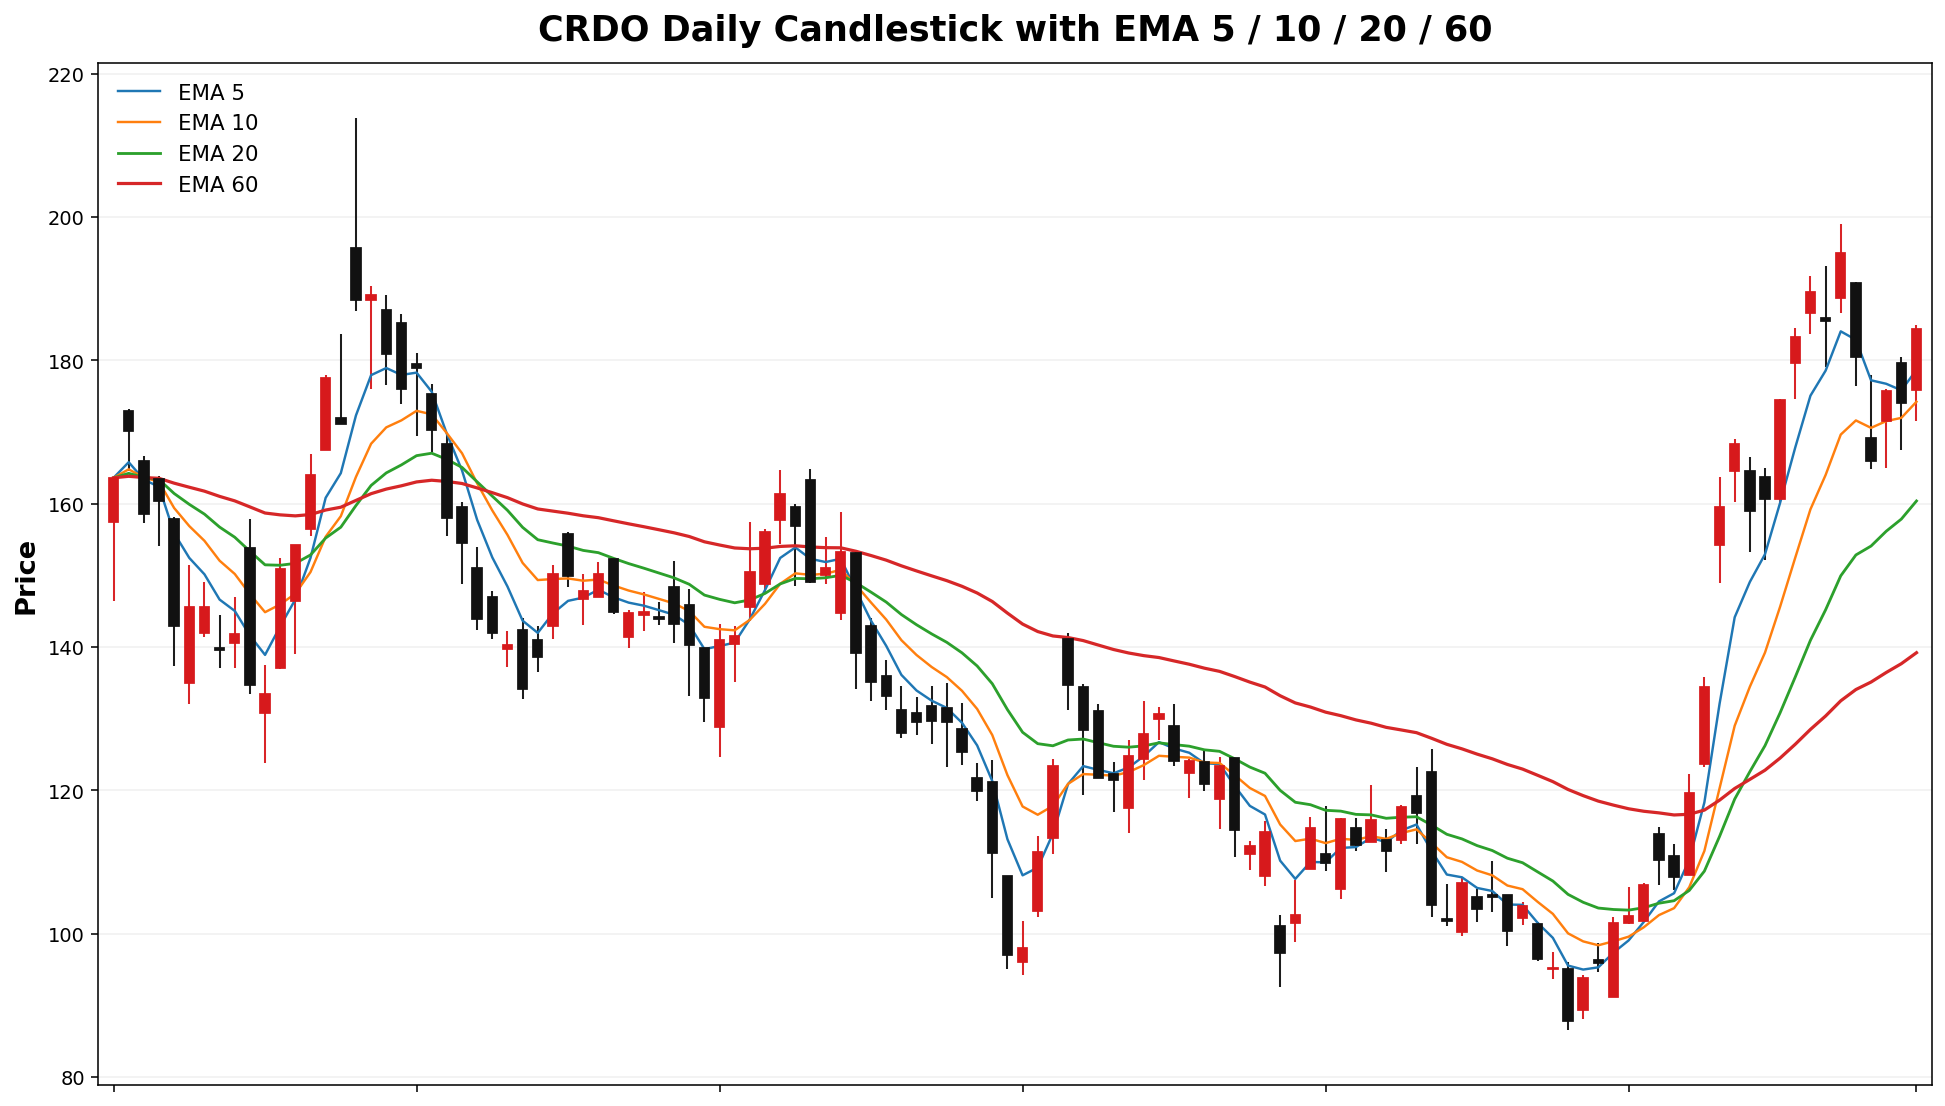
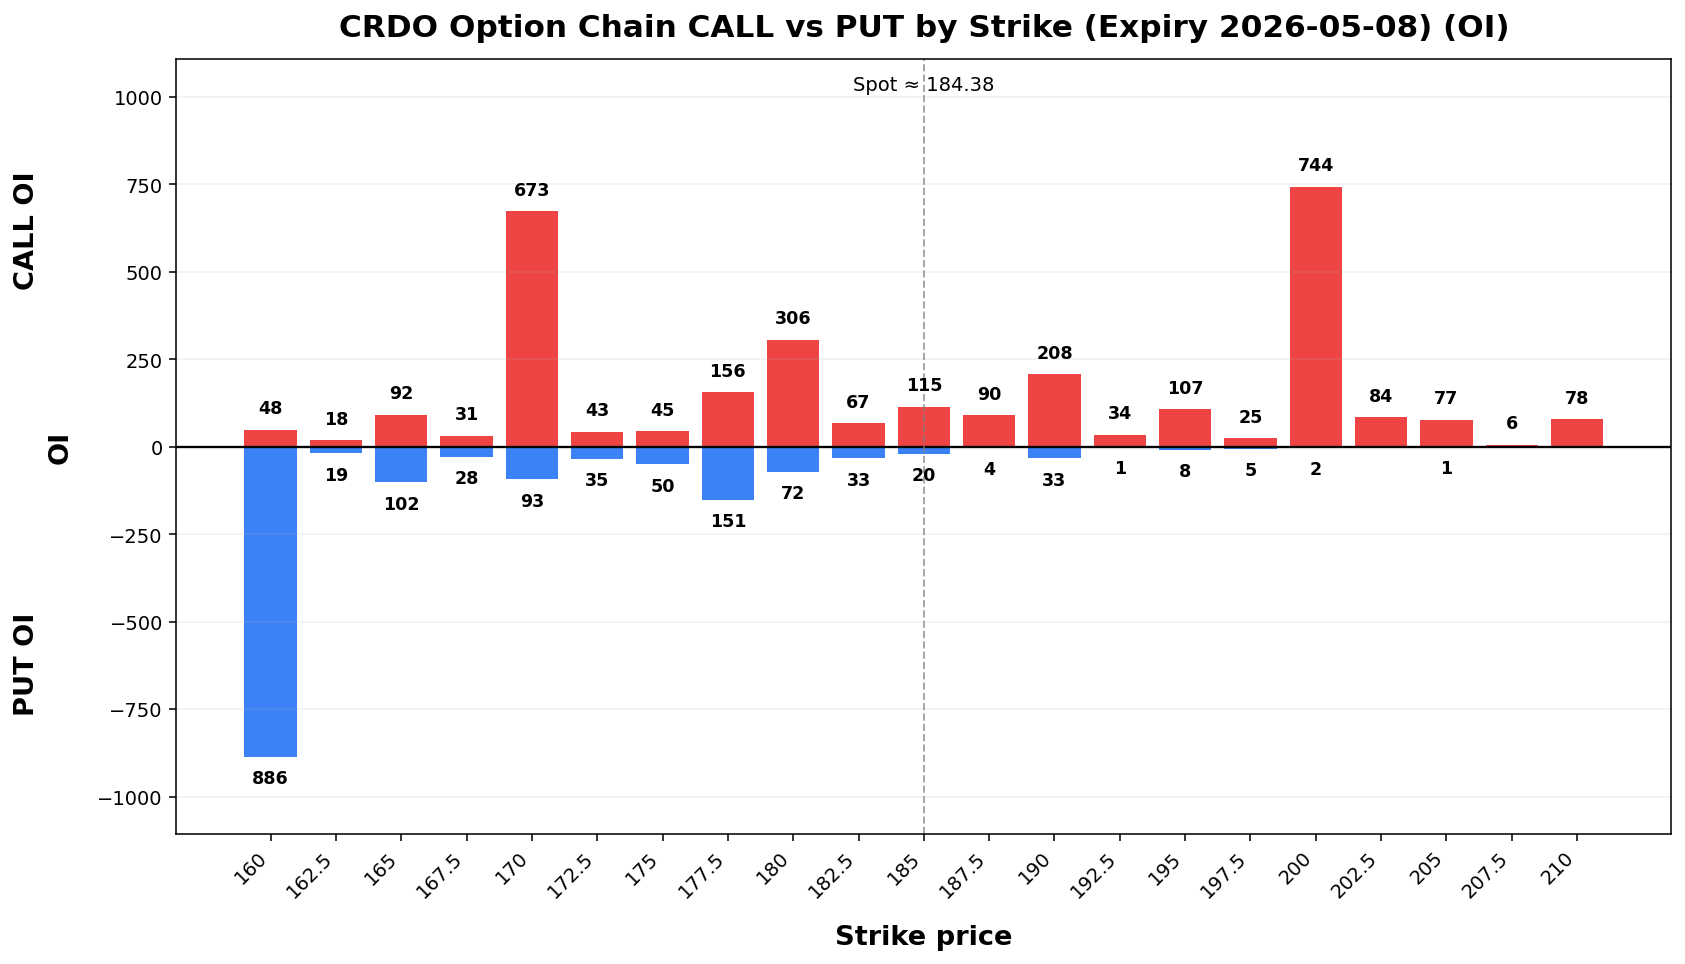
CRDO
Spot: 184.38
Report Time: 2026-05-03 08:47 AM MYT
Regime: TRANSITION
Dealer Gamma: LONG
Term Structure
| Expiry |
DTE |
Forward |
ATM IV |
ATM Straddle |
| 2026-05-08 |
6 |
184.56 |
78.76% |
18.30 |
| 2026-05-15 |
13 |
185.00 |
75.76% |
26.15 |
Weekly Range
| Confidence |
Low |
High |
Width |
| 68% |
164.21 |
204.55 |
40.35 |
| 80% |
158.53 |
210.23 |
51.71 |
| 90% |
151.20 |
217.56 |
66.37 |
| 95% |
144.84 |
223.92 |
79.08 |
Structure & Probabilities
| Support |
Resistance |
Gamma Flip |
Max Pain |
P>Res |
P<Sup |
| 180.00 |
200.00 |
167.12 |
152.50 |
16.8% |
37.8% |
Flow & Skew
| Call Vol |
Put Vol |
Vol P/C |
Call OI |
Put OI |
OI P/C |
Skew |
Skew Bias |
| 3,858 |
3,976 |
1.03 |
5,370 |
6,075 |
1.13 |
3.78 vol pts |
PUT_SKEW |
Tail Risk
| Q10 |
Q50 |
Q90 |
Down Tail |
Up Tail |
Down/Up |
| 149.04 |
181.90 |
213.59 |
35.34 |
29.21 |
1.21 |
Daily Technicals
| EMA20 |
EMA50 |
VWAP20 |
BB Lower |
BB Mid |
BB Upper |
BB Width |
Vol Ratio |
Path |
| 160.38 |
140.93 |
157.42 |
94.46 |
156.87 |
219.27 |
79.56% |
0.63 |
UP trend (expanding) |
Day Plan
- 180.00-200.00 range: fade extremes
- > 200.00: chase only if hold + vol
- < 180.00: risk expand; reduce size
- Regime: TRANSITION
- Tech: UP trend (expanding)
Swing Plan
- Accumulate: 180.00-180.00
- Trim: 200.00-200.00
- Add: close > 200.00
- Cut: close < 180.00
- Best for: transition regime
Raw Text Summary
📌 CRDO @ 184.38 (2026-05-03 08:47 AM MYT)

• Current price is **184.38**. Key support is around **180.00**, and resistance is around **200.00**.
• For the next week, the model’s **68% expected range** is roughly **164.21 to 204.55**.
• A wider **90% range** is about **151.20 to 217.56**.
• Dealer positioning looks **LONG gamma**, so the market behavior is classified as **TRANSITION**.
• The estimated **gamma flip** is near **167.12**. Crossing and holding beyond this area can change the trading behavior.
• Approximate breakout odds: **above resistance 16.8%**, **below support 37.8%** by the target horizon.
• Options skew is tilted toward **puts**, which suggests traders are paying more for downside protection.
• Near-term implied volatility is higher than the next expiry (**IV1 78.76% vs IV2 75.76%**), which suggests **near-term event stress / backwardation**.
• Recent volume is only **0.63x** the 20-day average, so breakouts may be less reliable unless volume improves.
• On the daily chart, the stock currently looks like **UP trend (expanding)**.
• The implied distribution shows **heavier downside tail risk** than upside tail potential.
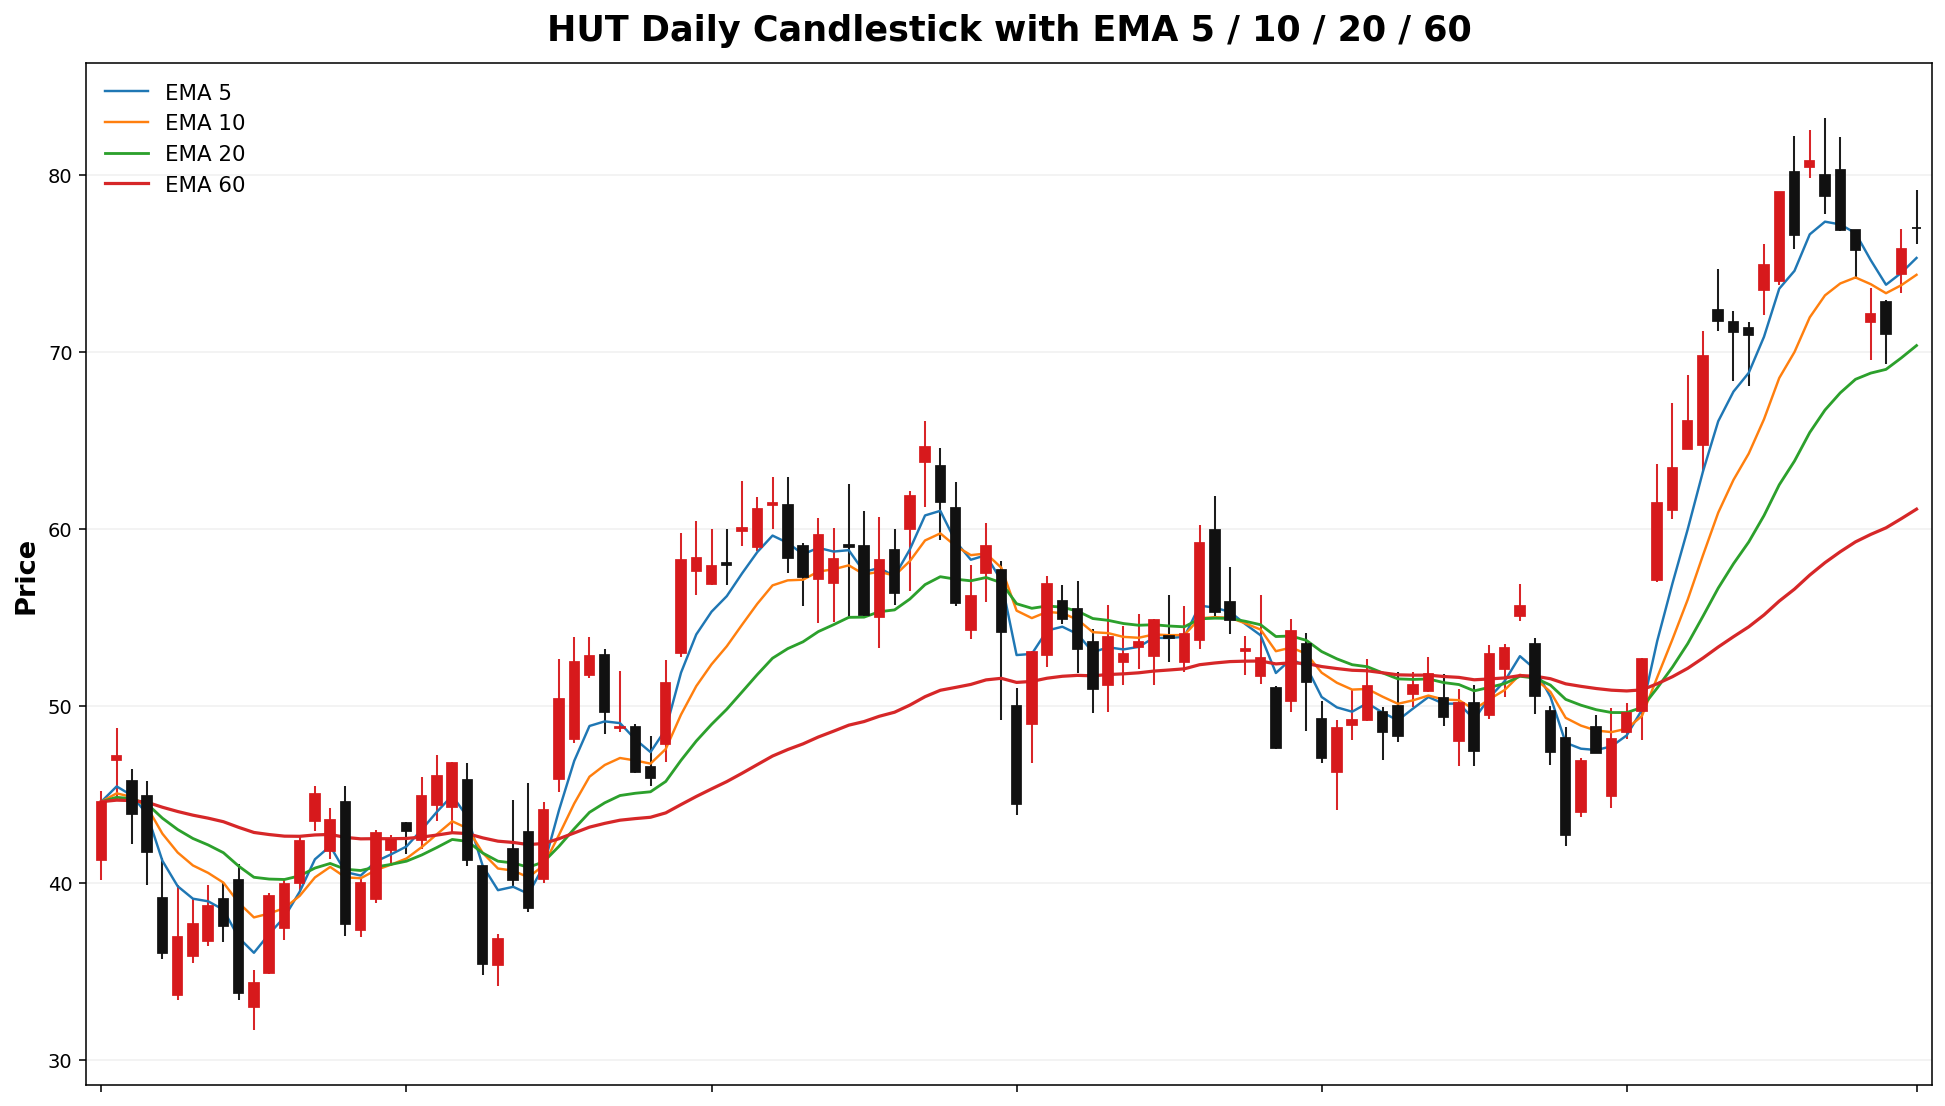
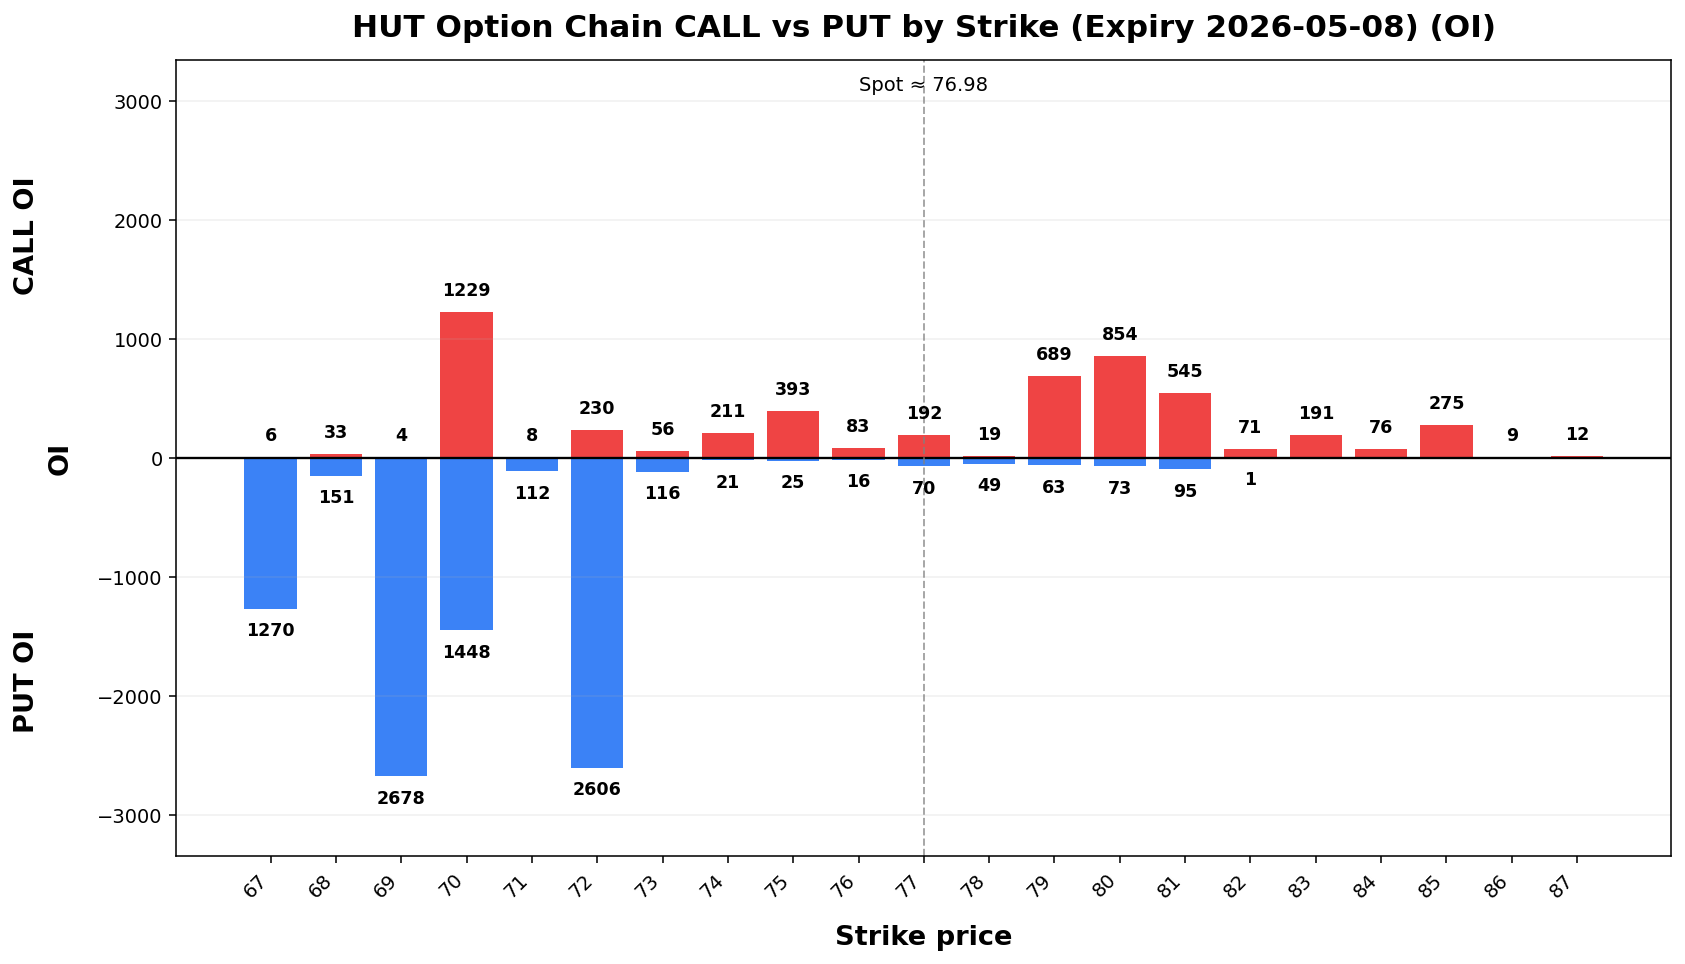
HUT
Spot: 76.98
Report Time: 2026-05-03 08:48 AM MYT
Regime: TRANSITION
Dealer Gamma: LONG
Term Structure
| Expiry |
DTE |
Forward |
ATM IV |
ATM Straddle |
| 2026-05-08 |
6 |
76.94 |
95.61% |
9.27 |
| 2026-05-15 |
13 |
77.03 |
85.35% |
12.30 |
Weekly Range
| Confidence |
Low |
High |
Width |
| 68% |
67.00 |
86.96 |
19.95 |
| 80% |
64.20 |
89.76 |
25.57 |
| 90% |
60.57 |
93.39 |
32.82 |
| 95% |
57.43 |
96.53 |
39.10 |
Structure & Probabilities
| Support |
Resistance |
Gamma Flip |
Max Pain |
P>Res |
P<Sup |
| 72.00 |
79.00 |
83.55 |
72.00 |
34.8% |
25.6% |
Flow & Skew
| Call Vol |
Put Vol |
Vol P/C |
Call OI |
Put OI |
OI P/C |
Skew |
Skew Bias |
| 3,034 |
3,342 |
1.10 |
5,873 |
12,877 |
2.19 |
1.22 vol pts |
PUT_SKEW |
Tail Risk
| Q10 |
Q50 |
Q90 |
Down Tail |
Up Tail |
Down/Up |
| 62.62 |
75.45 |
89.50 |
14.36 |
12.52 |
1.15 |
Daily Technicals
| EMA20 |
EMA50 |
VWAP20 |
BB Lower |
BB Mid |
BB Upper |
BB Width |
Vol Ratio |
Path |
| 70.34 |
62.55 |
70.00 |
53.89 |
70.76 |
87.62 |
47.67% |
0.57 |
UP trend (expanding) |
Day Plan
- 72.00-79.00 range: fade extremes
- > 79.00: chase only if hold + vol
- < 72.00: risk expand; reduce size
- Regime: TRANSITION
- Tech: UP trend (expanding)
Swing Plan
- Accumulate: 72.00-72.00
- Trim: 79.00-79.00
- Add: close > 79.00
- Cut: close < 72.00
- Best for: transition regime
Raw Text Summary
📌 HUT @ 76.98 (2026-05-03 08:48 AM MYT)

• Current price is **76.98**. Key support is around **72.00**, and resistance is around **79.00**.
• For the next week, the model’s **68% expected range** is roughly **67.00 to 86.96**.
• A wider **90% range** is about **60.57 to 93.39**.
• Dealer positioning looks **LONG gamma**, so the market behavior is classified as **TRANSITION**.
• The estimated **gamma flip** is near **83.55**. Crossing and holding beyond this area can change the trading behavior.
• Approximate breakout odds: **above resistance 34.8%**, **below support 25.6%** by the target horizon.
• Options skew is fairly balanced, so there is **no strong directional bias** from skew alone.
• Near-term implied volatility is higher than the next expiry (**IV1 95.61% vs IV2 85.35%**), which suggests **near-term event stress / backwardation**.
• Recent volume is only **0.57x** the 20-day average, so breakouts may be less reliable unless volume improves.
• On the daily chart, the stock currently looks like **UP trend (expanding)**.
• The implied distribution shows **heavier downside tail risk** than upside tail potential.
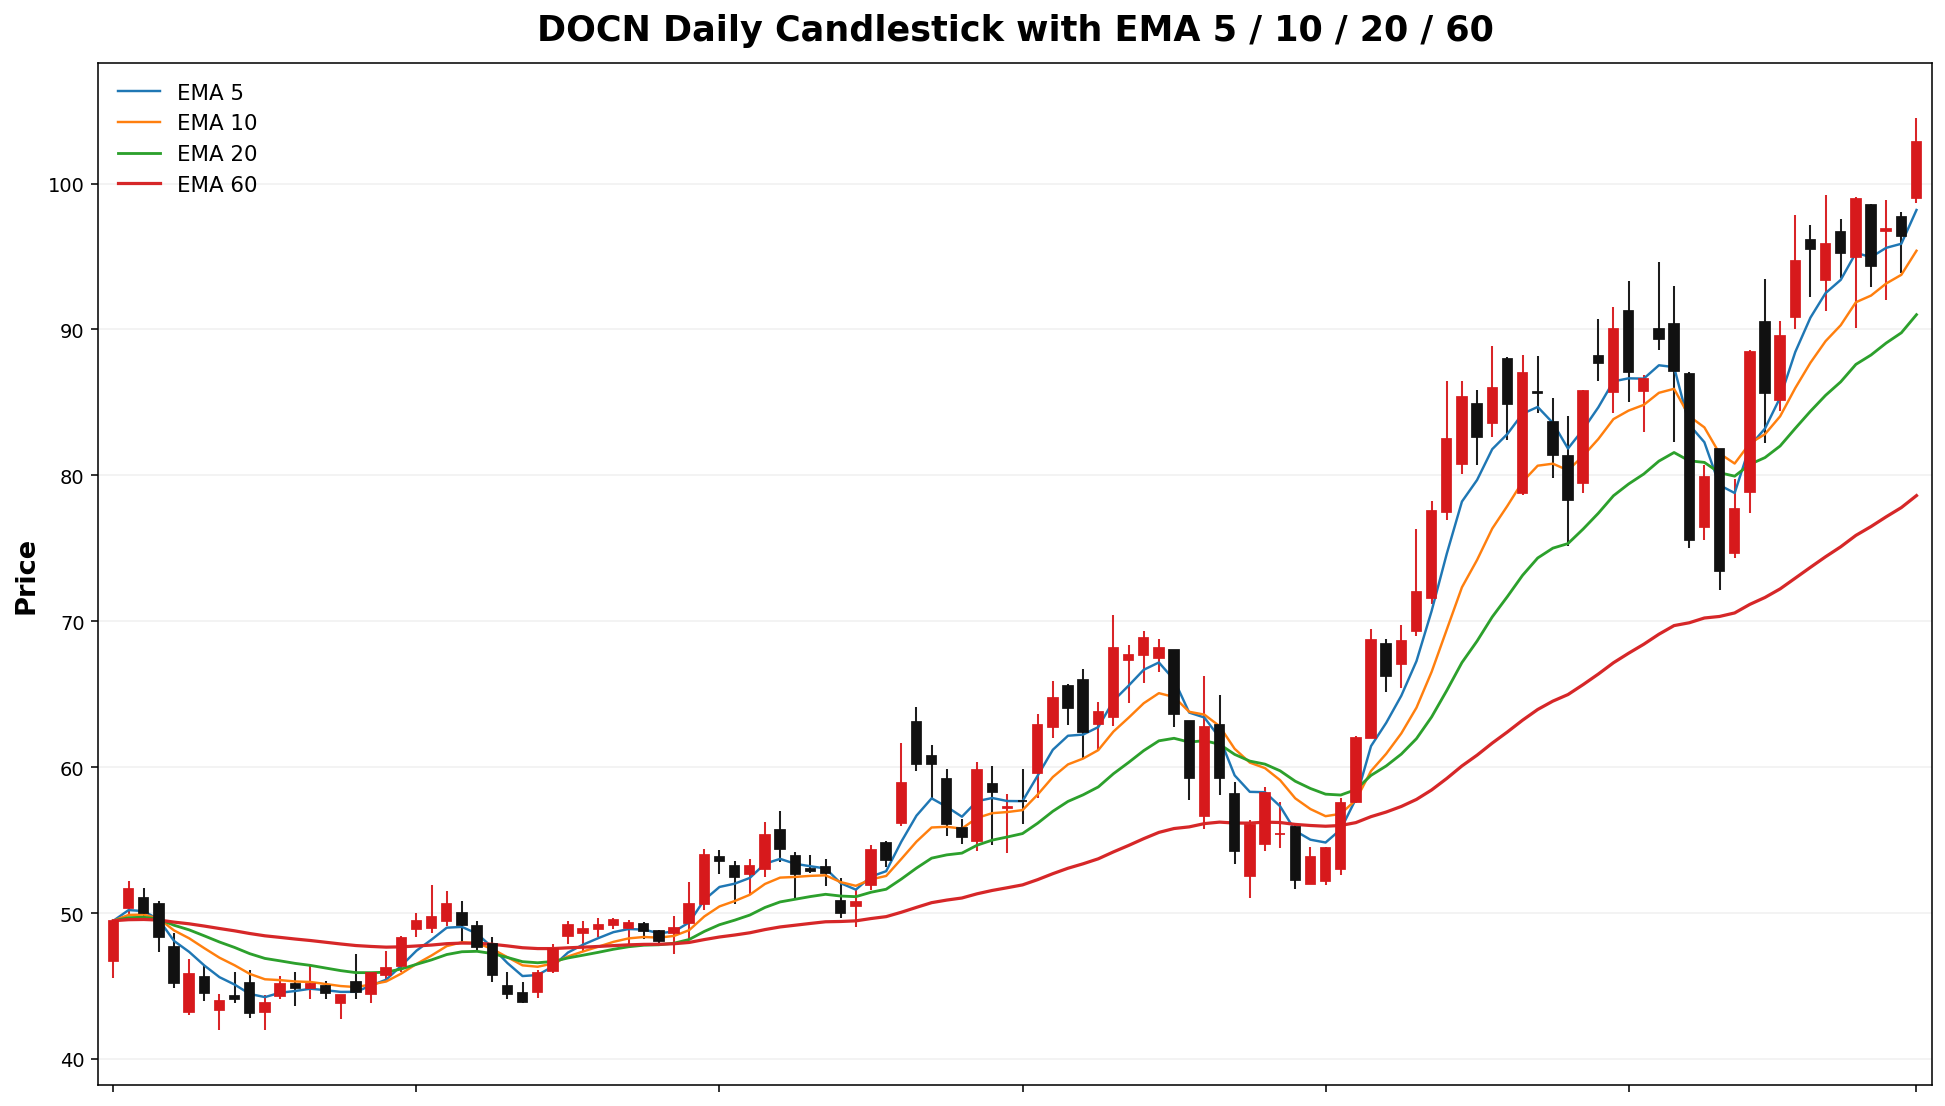
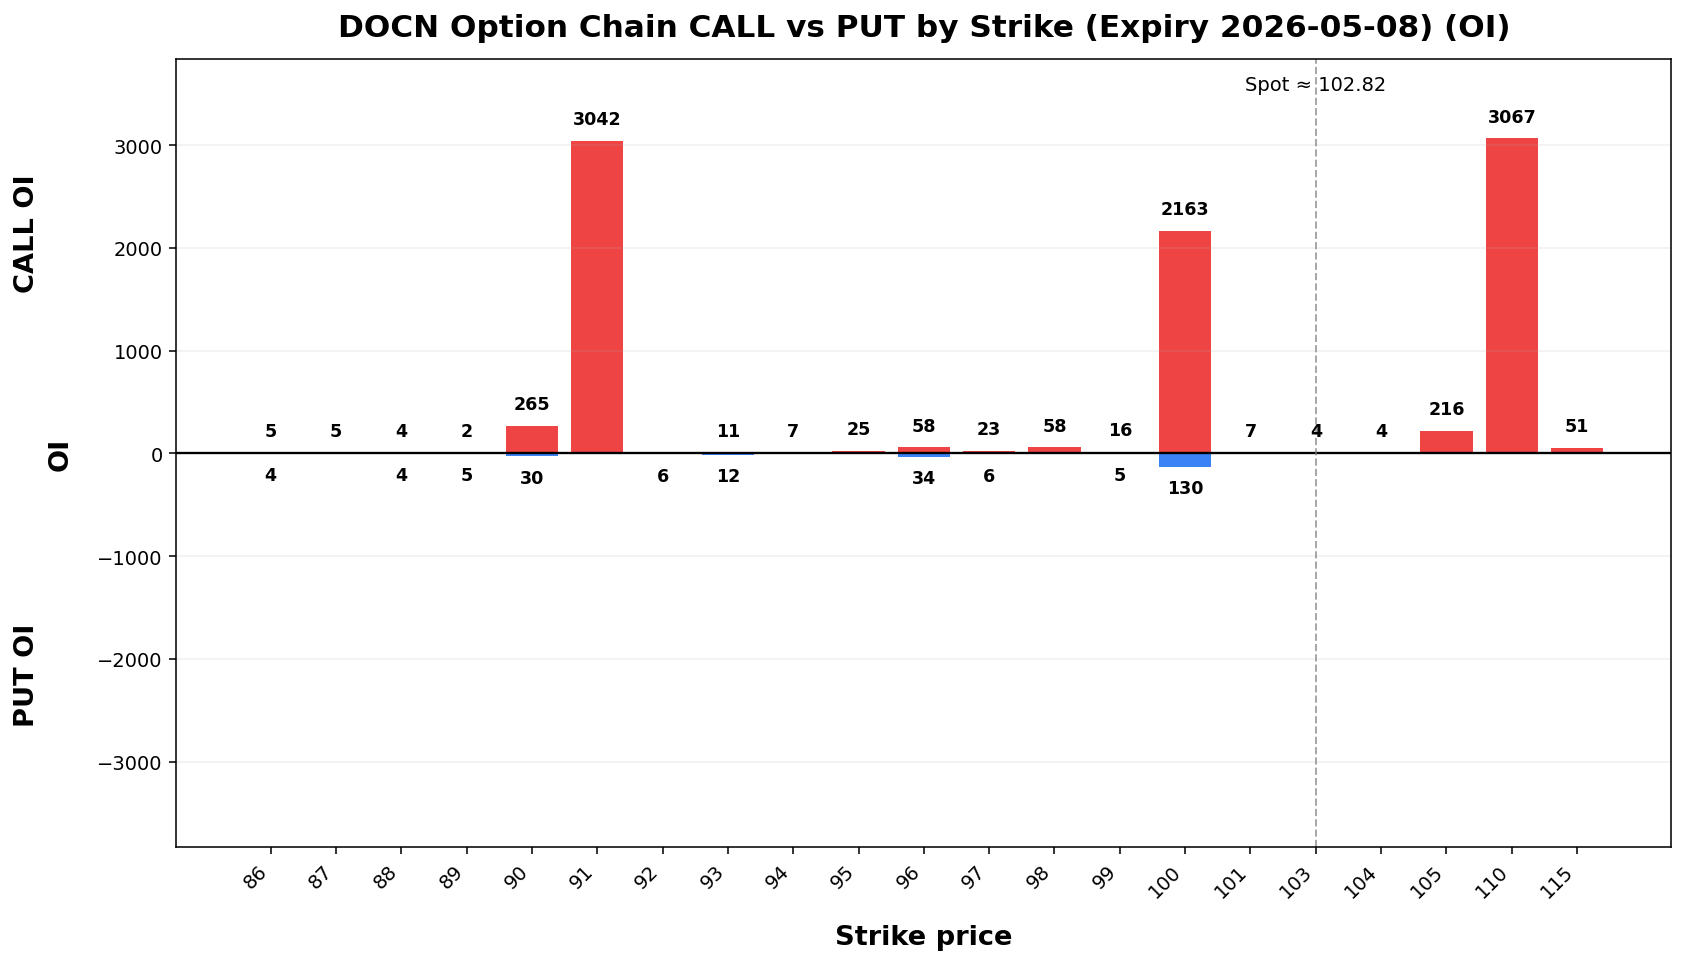
DOCN
Spot: 102.82
Report Time: 2026-05-03 08:48 AM MYT
Regime: TRANSITION
Dealer Gamma: LONG
Term Structure
| Expiry |
DTE |
Forward |
ATM IV |
ATM Straddle |
| 2026-05-08 |
6 |
103.37 |
130.82% |
16.95 |
| 2026-05-15 |
13 |
103.33 |
102.35% |
19.70 |
Weekly Range
| Confidence |
Low |
High |
Width |
| 68% |
85.27 |
120.37 |
35.11 |
| 80% |
80.32 |
125.32 |
44.99 |
| 90% |
73.95 |
131.69 |
57.75 |
| 95% |
68.42 |
137.22 |
68.81 |
Structure & Probabilities
| Support |
Resistance |
Gamma Flip |
Max Pain |
P>Res |
P<Sup |
| 100.00 |
105.00 |
63.18 |
85.00 |
41.1% |
33.3% |
Flow & Skew
| Call Vol |
Put Vol |
Vol P/C |
Call OI |
Put OI |
OI P/C |
Skew |
Skew Bias |
| 1,947 |
391 |
0.20 |
9,321 |
2,295 |
0.25 |
-4.54 vol pts |
CALL_SKEW |
Tail Risk
| Q10 |
Q50 |
Q90 |
Down Tail |
Up Tail |
Down/Up |
| 84.02 |
99.09 |
126.77 |
18.80 |
23.95 |
0.78 |
Daily Technicals
| EMA20 |
EMA50 |
VWAP20 |
BB Lower |
BB Mid |
BB Upper |
BB Width |
Vol Ratio |
Path |
| 91.02 |
81.04 |
87.54 |
73.35 |
89.56 |
105.77 |
36.20% |
0.61 |
UP trend (expanding) |
Day Plan
- 100.00-105.00 range: fade extremes
- > 105.00: chase only if hold + vol
- < 100.00: risk expand; reduce size
- Regime: TRANSITION
- Tech: UP trend (expanding)
Swing Plan
- Accumulate: 100.00-100.00
- Trim: 105.00-105.00
- Add: close > 105.00
- Cut: close < 100.00
- Best for: transition regime
Raw Text Summary
📌 DOCN @ 102.82 (2026-05-03 08:48 AM MYT)

• Current price is **102.82**. Key support is around **100.00**, and resistance is around **105.00**.
• For the next week, the model’s **68% expected range** is roughly **85.27 to 120.37**.
• A wider **90% range** is about **73.95 to 131.69**.
• Dealer positioning looks **LONG gamma**, so the market behavior is classified as **TRANSITION**.
• The estimated **gamma flip** is near **63.18**. Crossing and holding beyond this area can change the trading behavior.
• Approximate breakout odds: **above resistance 41.1%**, **below support 33.3%** by the target horizon.
• Options skew is tilted toward **calls**, which suggests upside speculation is relatively stronger.
• Near-term implied volatility is higher than the next expiry (**IV1 130.82% vs IV2 102.35%**), which suggests **near-term event stress / backwardation**.
• Recent volume is only **0.61x** the 20-day average, so breakouts may be less reliable unless volume improves.
• On the daily chart, the stock currently looks like **UP trend (expanding)**.
• The implied distribution shows **more upside tail potential** than downside tail risk.
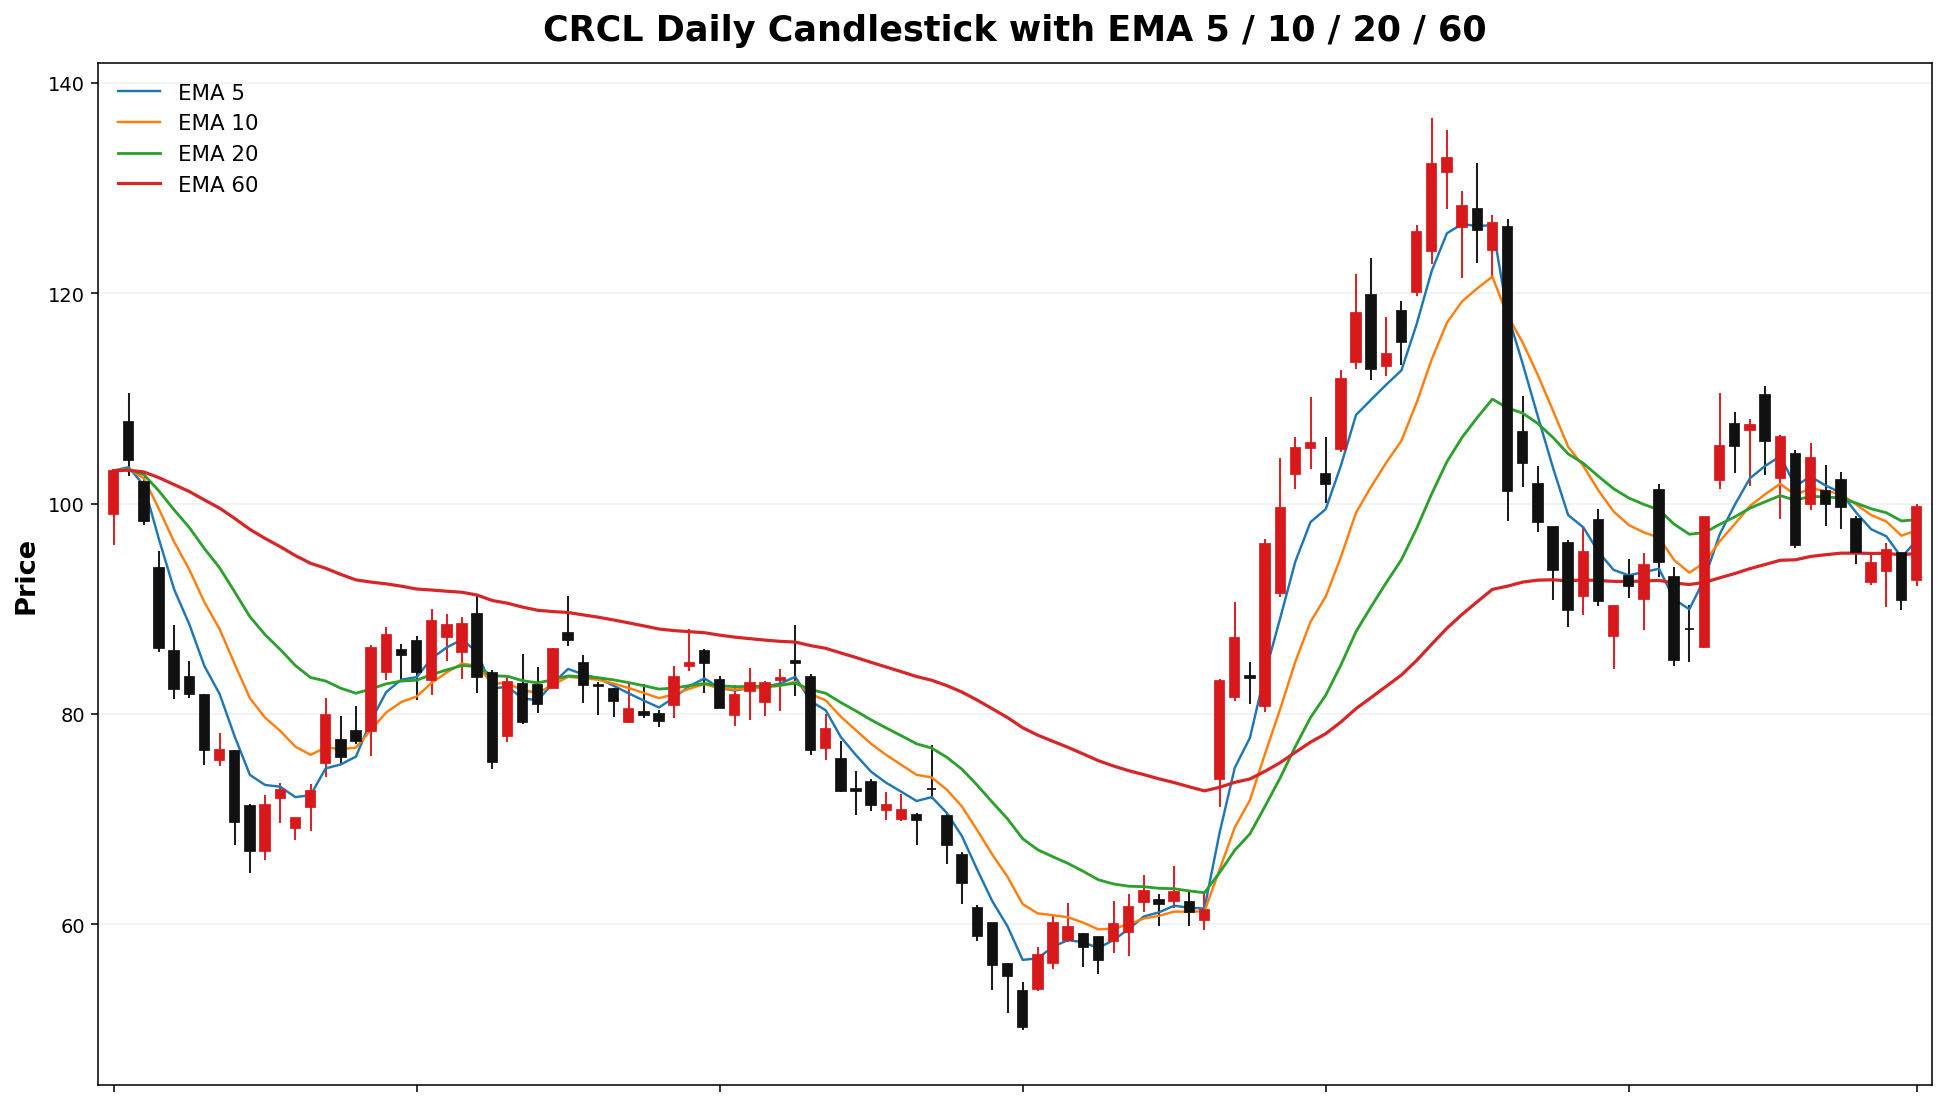
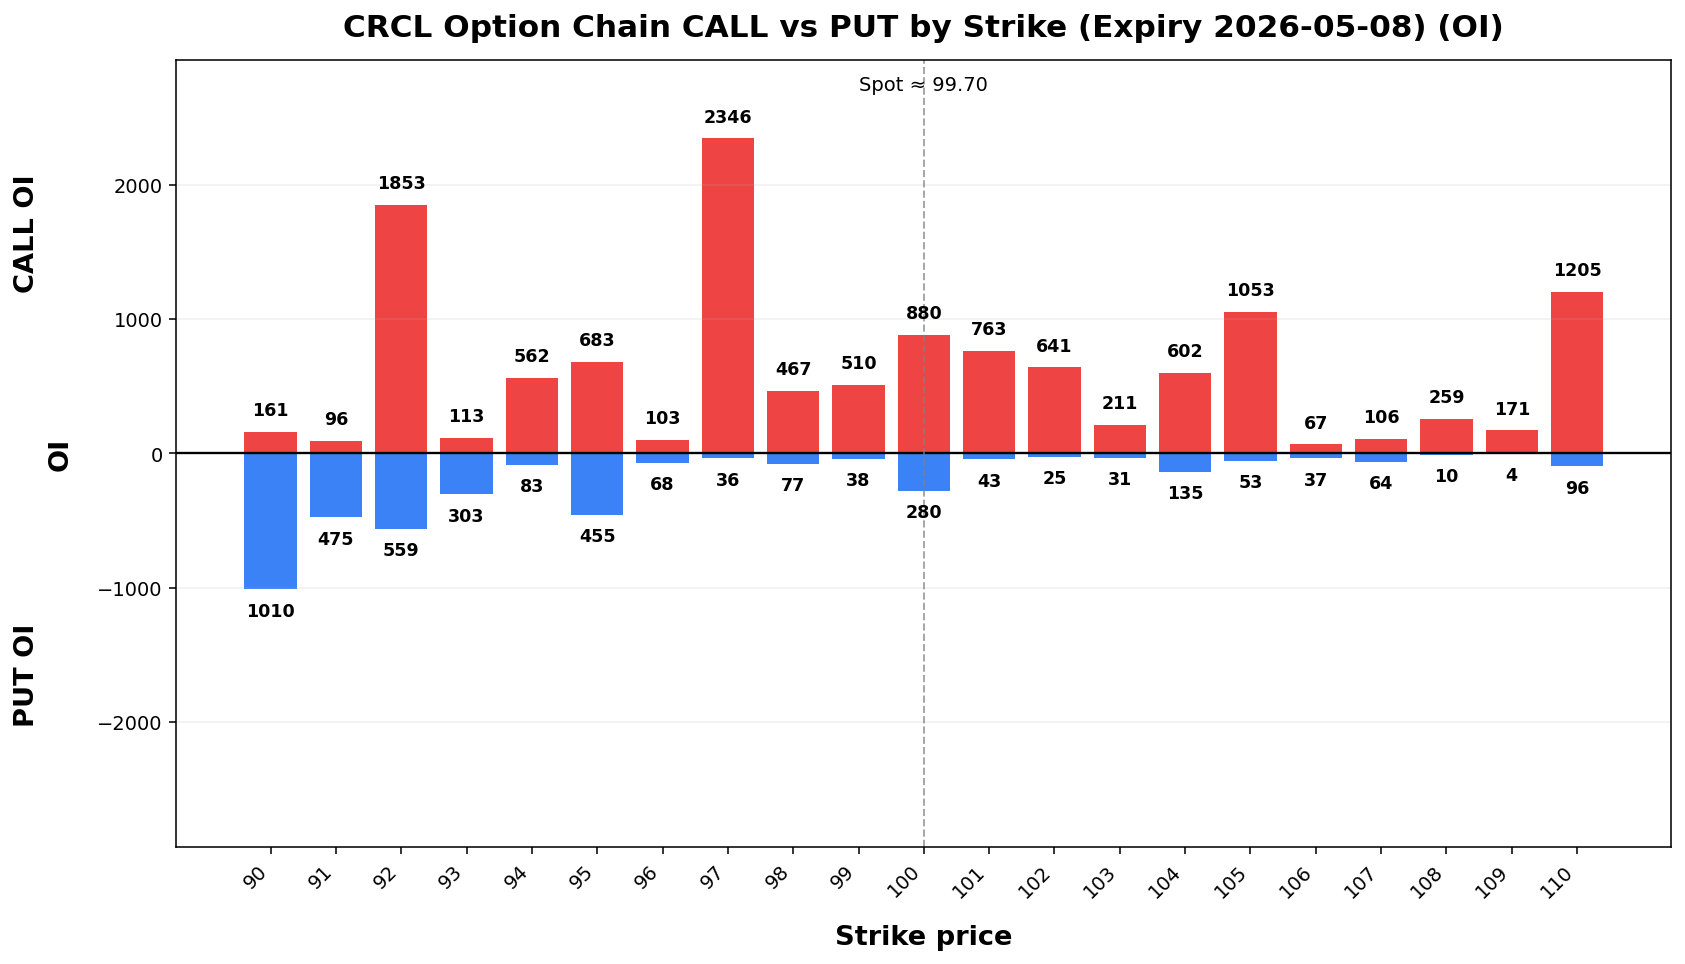
CRCL
Spot: 99.70
Report Time: 2026-05-03 08:48 AM MYT
Regime: TRANSITION
Dealer Gamma: LONG
Term Structure
| Expiry |
DTE |
Forward |
ATM IV |
ATM Straddle |
| 2026-05-08 |
6 |
99.86 |
67.86% |
8.52 |
| 2026-05-15 |
13 |
99.91 |
82.38% |
15.38 |
Weekly Range
| Confidence |
Low |
High |
Width |
| 68% |
89.38 |
110.02 |
20.64 |
| 80% |
86.47 |
112.93 |
26.45 |
| 90% |
82.72 |
116.68 |
33.95 |
| 95% |
79.47 |
119.93 |
40.46 |
Structure & Probabilities
| Support |
Resistance |
Gamma Flip |
Max Pain |
P>Res |
P<Sup |
| 97.00 |
115.00 |
90.38 |
92.00 |
5.6% |
32.4% |
Flow & Skew
| Call Vol |
Put Vol |
Vol P/C |
Call OI |
Put OI |
OI P/C |
Skew |
Skew Bias |
| 21,987 |
10,077 |
0.46 |
20,604 |
22,342 |
1.08 |
-0.54 vol pts |
FLAT |
Tail Risk
| Q10 |
Q50 |
Q90 |
Down Tail |
Up Tail |
Down/Up |
| 81.17 |
94.56 |
112.26 |
18.53 |
12.56 |
1.48 |
Daily Technicals
| EMA20 |
EMA50 |
VWAP20 |
BB Lower |
BB Mid |
BB Upper |
BB Width |
Vol Ratio |
Path |
| 98.48 |
96.54 |
98.29 |
85.04 |
97.96 |
110.88 |
26.38% |
0.94 |
Sideways / Range |
Day Plan
- 97.00-115.00 range: fade extremes
- > 115.00: chase only if hold + vol
- < 97.00: risk expand; reduce size
- Regime: TRANSITION
- Tech: Sideways / Range
Swing Plan
- Accumulate: 97.00-97.00
- Trim: 115.00-115.00
- Add: close > 115.00
- Cut: close < 97.00
- Best for: transition regime
Raw Text Summary
📌 CRCL @ 99.70 (2026-05-03 08:48 AM MYT)

• Current price is **99.70**. Key support is around **97.00**, and resistance is around **115.00**.
• For the next week, the model’s **68% expected range** is roughly **89.38 to 110.02**.
• A wider **90% range** is about **82.72 to 116.68**.
• Dealer positioning looks **LONG gamma**, so the market behavior is classified as **TRANSITION**.
• The estimated **gamma flip** is near **90.38**. Crossing and holding beyond this area can change the trading behavior.
• Approximate breakout odds: **above resistance 5.6%**, **below support 32.4%** by the target horizon.
• Options skew is fairly balanced, so there is **no strong directional bias** from skew alone.
• Near-term implied volatility is lower than the next expiry (**IV1 67.86% vs IV2 82.38%**), which suggests a **contango / calmer front expiry** setup.
• On the daily chart, the stock currently looks like **Sideways / Range**.
• The implied distribution shows **heavier downside tail risk** than upside tail potential.
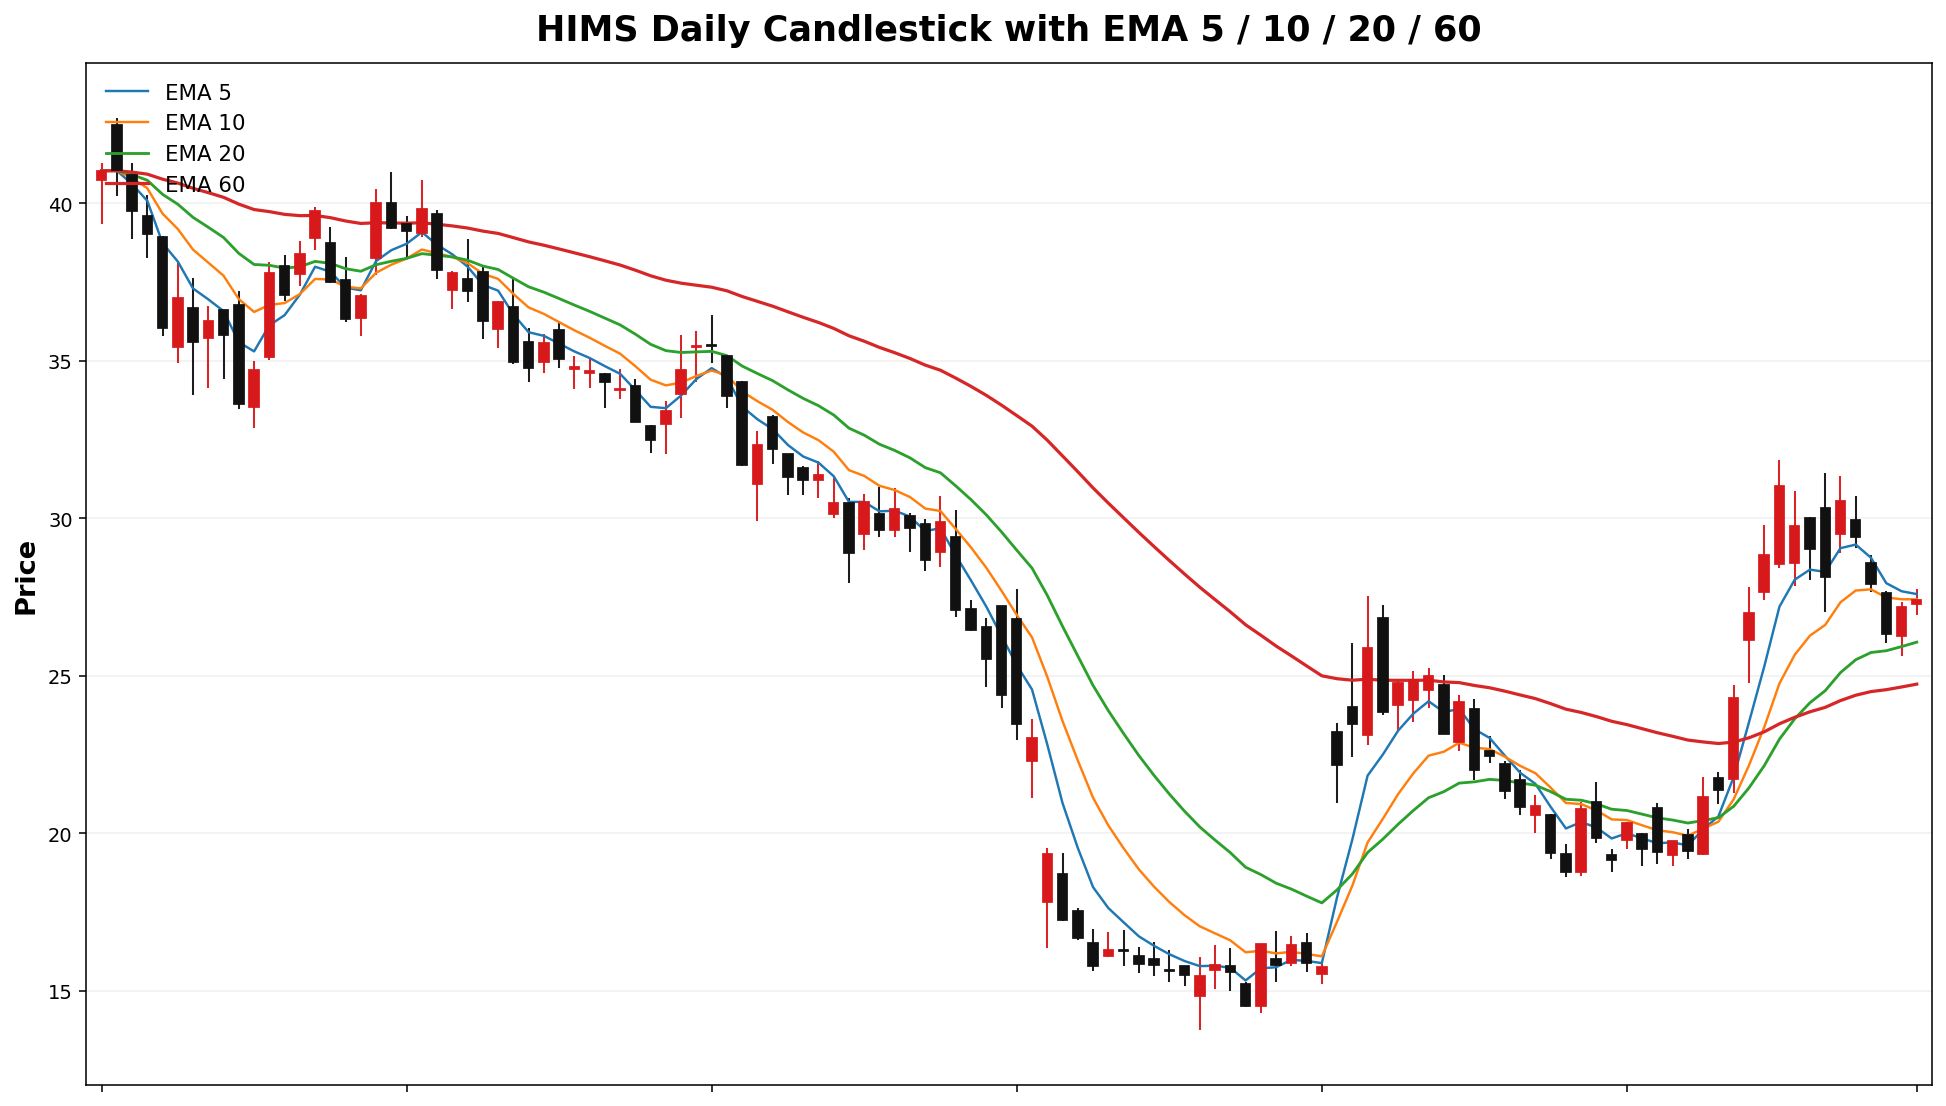
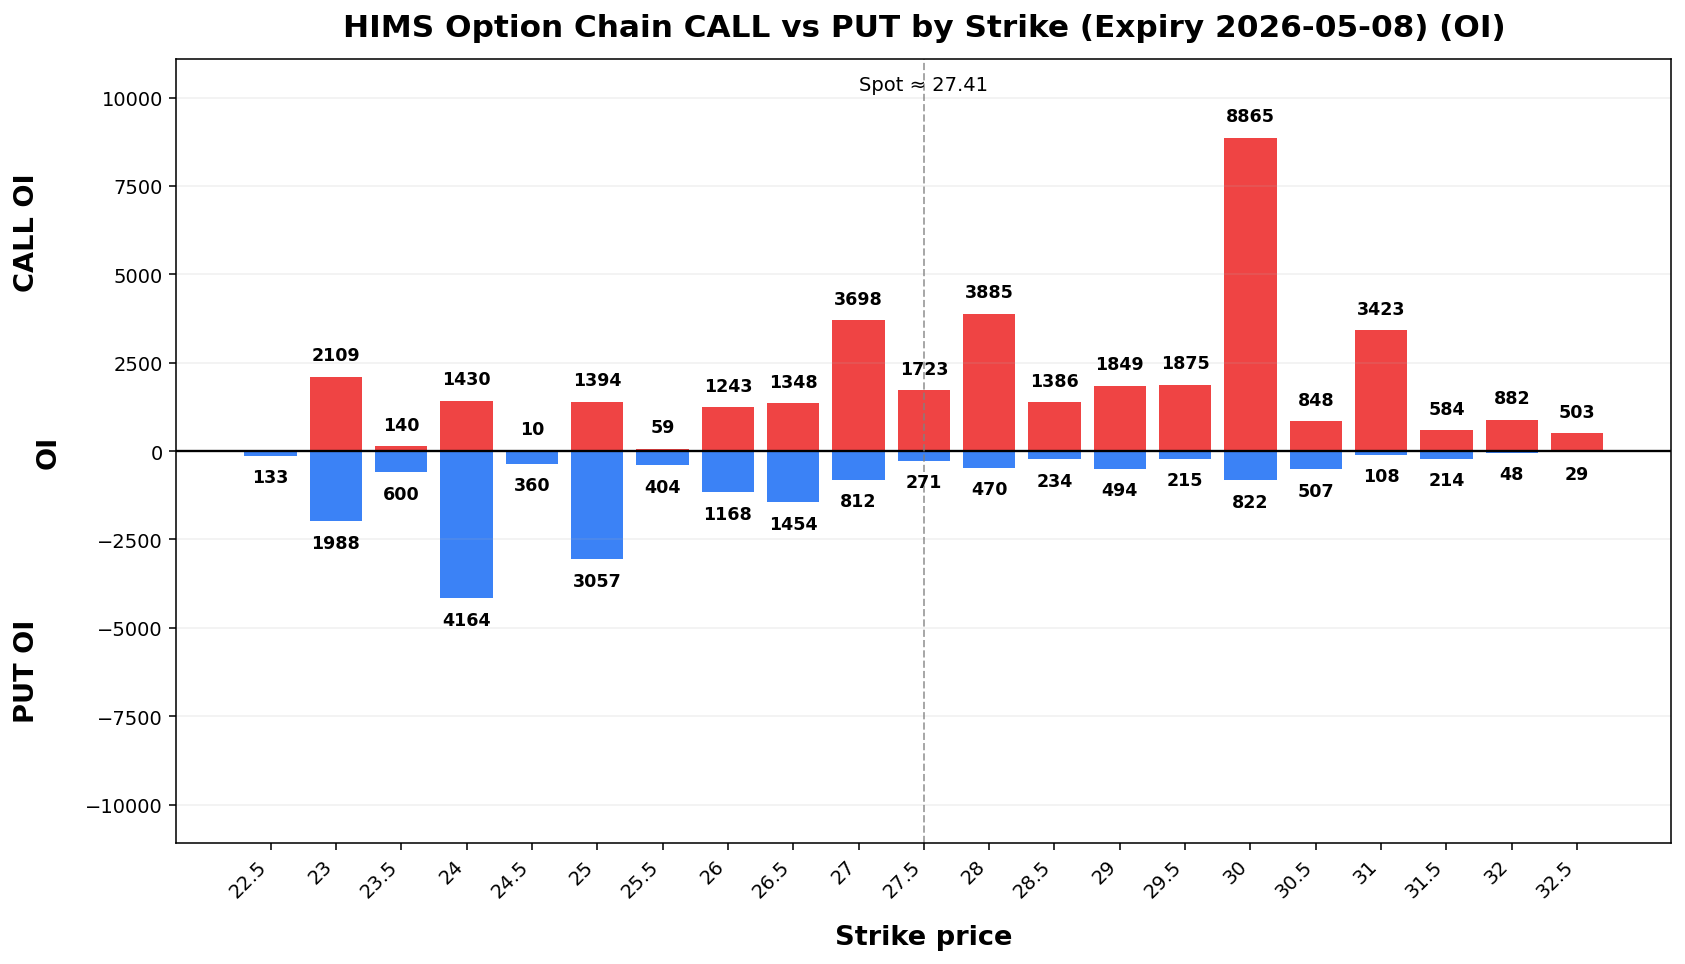
HIMS
Spot: 27.41
Report Time: 2026-05-03 08:48 AM MYT
Regime: TRANSITION
Dealer Gamma: LONG
Term Structure
| Expiry |
DTE |
Forward |
ATM IV |
ATM Straddle |
| 2026-05-08 |
6 |
27.37 |
64.27% |
2.22 |
| 2026-05-15 |
13 |
27.38 |
94.42% |
4.85 |
Weekly Range
| Confidence |
Low |
High |
Width |
| 68% |
24.45 |
30.37 |
5.92 |
| 80% |
23.62 |
31.20 |
7.59 |
| 90% |
22.54 |
32.28 |
9.74 |
| 95% |
21.61 |
33.21 |
11.60 |
Structure & Probabilities
| Support |
Resistance |
Gamma Flip |
Max Pain |
P>Res |
P<Sup |
| 27.00 |
28.00 |
24.13 |
25.00 |
31.9% |
33.8% |
Flow & Skew
| Call Vol |
Put Vol |
Vol P/C |
Call OI |
Put OI |
OI P/C |
Skew |
Skew Bias |
| 23,343 |
14,221 |
0.61 |
50,924 |
55,594 |
1.09 |
-0.10 vol pts |
FLAT |
Tail Risk
| Q10 |
Q50 |
Q90 |
Down Tail |
Up Tail |
Down/Up |
| 23.03 |
27.05 |
31.14 |
4.38 |
3.73 |
1.17 |
Daily Technicals
| EMA20 |
EMA50 |
VWAP20 |
BB Lower |
BB Mid |
BB Upper |
BB Width |
Vol Ratio |
Path |
| 26.07 |
24.62 |
26.58 |
16.90 |
25.39 |
33.87 |
66.85% |
0.44 |
UP trend (expanding) |
Day Plan
- 27.00-28.00 range: fade extremes
- > 28.00: chase only if hold + vol
- < 27.00: risk expand; reduce size
- Regime: TRANSITION
- Tech: UP trend (expanding)
Swing Plan
- Accumulate: 27.00-27.00
- Trim: 28.00-28.00
- Add: close > 28.00
- Cut: close < 27.00
- Best for: transition regime
Raw Text Summary
📌 HIMS @ 27.41 (2026-05-03 08:48 AM MYT)

• Current price is **27.41**. Key support is around **27.00**, and resistance is around **28.00**.
• For the next week, the model’s **68% expected range** is roughly **24.45 to 30.37**.
• A wider **90% range** is about **22.54 to 32.28**.
• Dealer positioning looks **LONG gamma**, so the market behavior is classified as **TRANSITION**.
• The estimated **gamma flip** is near **24.13**. Crossing and holding beyond this area can change the trading behavior.
• Approximate breakout odds: **above resistance 31.9%**, **below support 33.8%** by the target horizon.
• Options skew is fairly balanced, so there is **no strong directional bias** from skew alone.
• Near-term implied volatility is lower than the next expiry (**IV1 64.27% vs IV2 94.42%**), which suggests a **contango / calmer front expiry** setup.
• Recent volume is only **0.44x** the 20-day average, so breakouts may be less reliable unless volume improves.
• On the daily chart, the stock currently looks like **UP trend (expanding)**.
• The implied distribution shows **heavier downside tail risk** than upside tail potential.
IONQ
Spot: 46.20
Report Time: 2026-05-03 08:48 AM MYT
Regime: TRANSITION
Dealer Gamma: LONG
Term Structure
| Expiry |
DTE |
Forward |
ATM IV |
ATM Straddle |
| 2026-05-08 |
6 |
46.11 |
111.22% |
6.47 |
| 2026-05-15 |
13 |
46.12 |
91.34% |
7.90 |
Weekly Range
| Confidence |
Low |
High |
Width |
| 68% |
39.41 |
52.99 |
13.59 |
| 80% |
37.49 |
54.91 |
17.41 |
| 90% |
35.02 |
57.38 |
22.35 |
| 95% |
32.88 |
59.52 |
26.63 |
Structure & Probabilities
| Support |
Resistance |
Gamma Flip |
Max Pain |
P>Res |
P<Sup |
| 45.00 |
50.00 |
39.13 |
40.00 |
23.9% |
35.7% |
Flow & Skew
| Call Vol |
Put Vol |
Vol P/C |
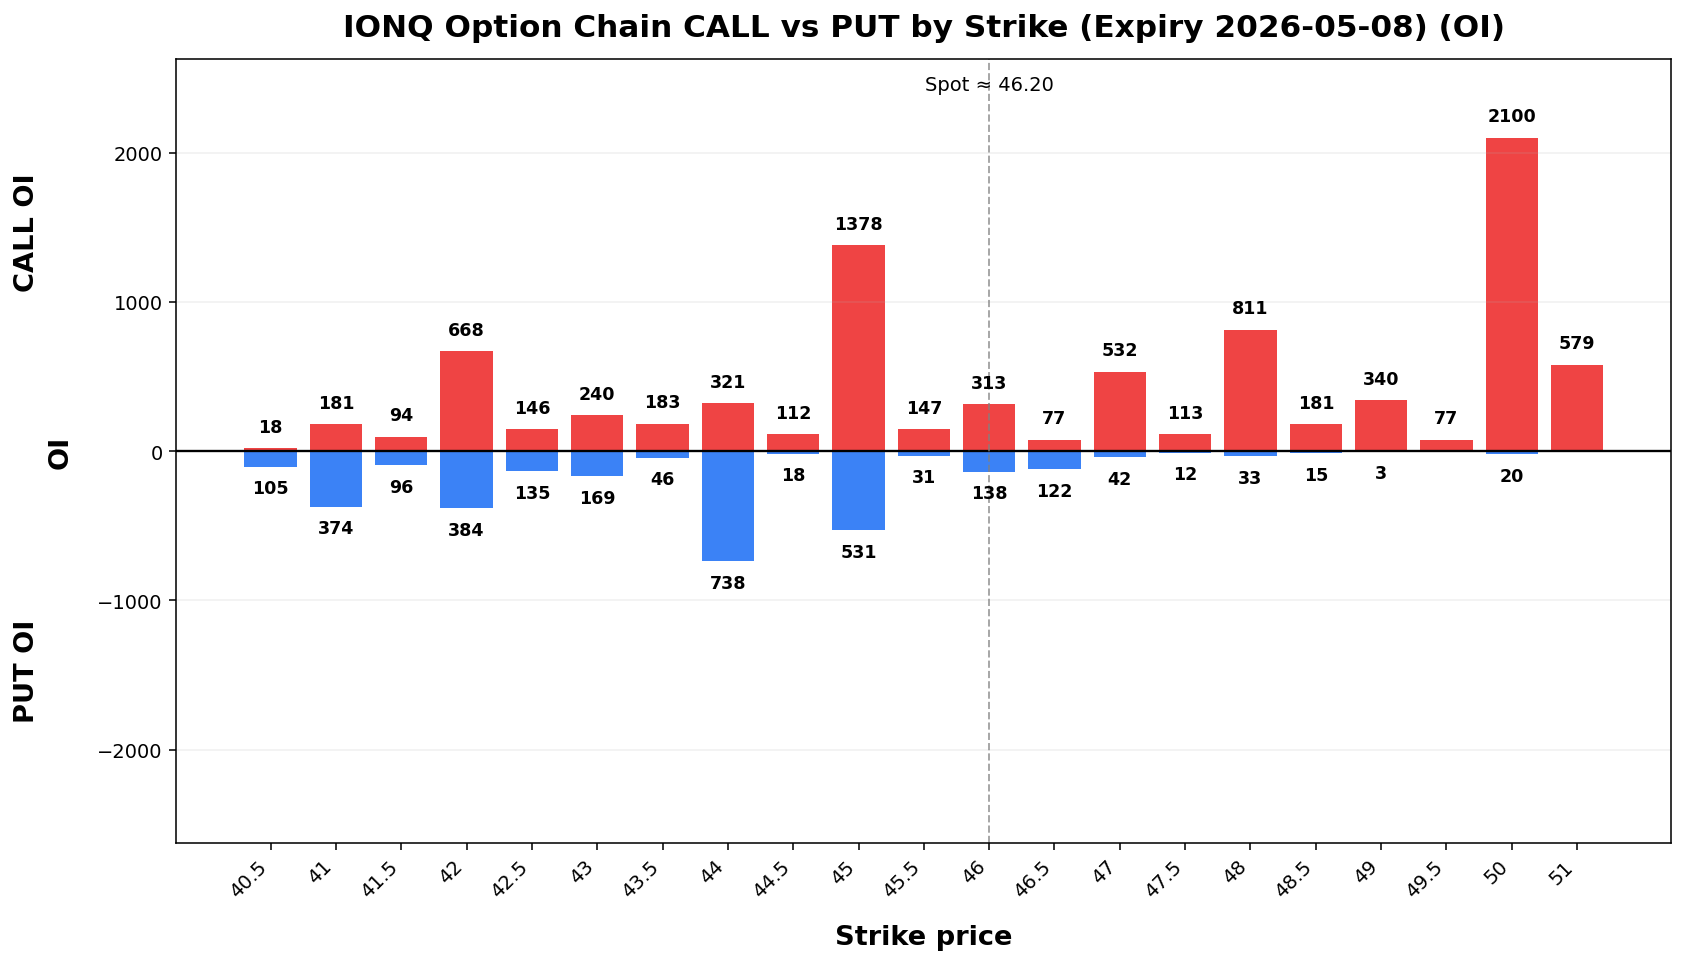
Call OI |
Put OI |
OI P/C |
Skew |
Skew Bias |
| 8,909 |
7,994 |
0.90 |
20,956 |
29,293 |
1.40 |
1.17 vol pts |
PUT_SKEW |
Tail Risk
| Q10 |
Q50 |
Q90 |
Down Tail |
Up Tail |
Down/Up |
| 33.68 |
45.29 |
55.92 |
12.52 |
9.72 |
1.29 |
Daily Technicals
| EMA20 |
EMA50 |
VWAP20 |
BB Lower |
BB Mid |
BB Upper |
BB Width |
Vol Ratio |
Path |
| 40.89 |
38.46 |
41.04 |
24.35 |
39.59 |
54.83 |
76.98% |
0.60 |
UP trend (expanding) |
Day Plan
- 45.00-50.00 range: fade extremes
- > 50.00: chase only if hold + vol
- < 45.00: risk expand; reduce size
- Regime: TRANSITION
- Tech: UP trend (expanding)
Swing Plan
- Accumulate: 45.00-45.00
- Trim: 50.00-50.00
- Add: close > 50.00
- Cut: close < 45.00
- Best for: transition regime
Raw Text Summary
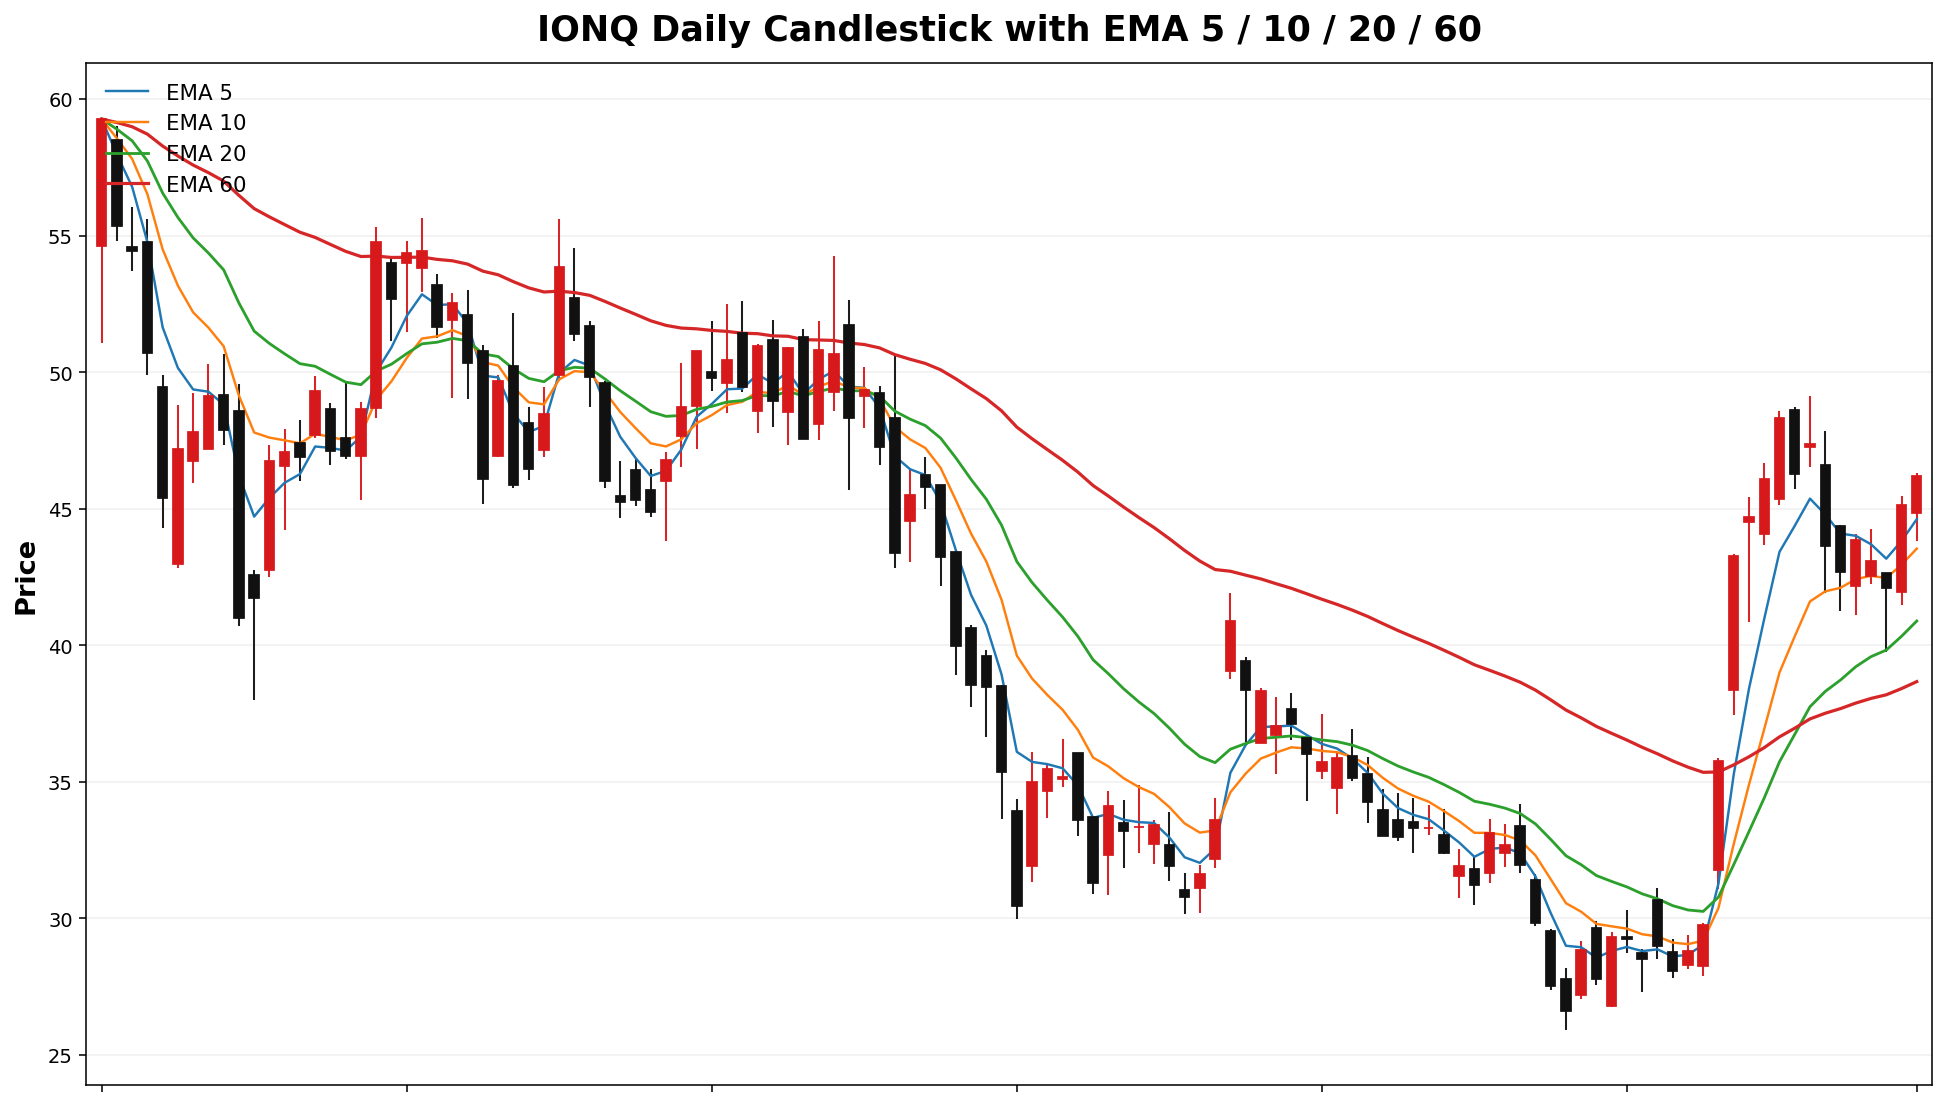
📌 IONQ @ 46.20 (2026-05-03 08:48 AM MYT)

• Current price is **46.20**. Key support is around **45.00**, and resistance is around **50.00**.
• For the next week, the model’s **68% expected range** is roughly **39.41 to 52.99**.
• A wider **90% range** is about **35.02 to 57.38**.
• Dealer positioning looks **LONG gamma**, so the market behavior is classified as **TRANSITION**.
• The estimated **gamma flip** is near **39.13**. Crossing and holding beyond this area can change the trading behavior.
• Approximate breakout odds: **above resistance 23.9%**, **below support 35.7%** by the target horizon.
• Options skew is fairly balanced, so there is **no strong directional bias** from skew alone.
• Near-term implied volatility is higher than the next expiry (**IV1 111.22% vs IV2 91.34%**), which suggests **near-term event stress / backwardation**.
• Recent volume is only **0.60x** the 20-day average, so breakouts may be less reliable unless volume improves.
• On the daily chart, the stock currently looks like **UP trend (expanding)**.
• The implied distribution shows **heavier downside tail risk** than upside tail potential.
AOSL
Spot: 43.08
Report Time: 2026-05-03 08:48 AM MYT
Regime: TRANSITION
Dealer Gamma: LONG
Term Structure
| Expiry |
DTE |
Forward |
ATM IV |
ATM Straddle |
| 2026-05-15 |
13 |
43.05 |
111.60% |
9.00 |
| 2026-06-18 |
47 |
43.20 |
86.57% |
13.35 |
Weekly Range
| Confidence |
Low |
High |
Width |
| 68% |
35.01 |
51.15 |
16.14 |
| 80% |
32.74 |
53.42 |
20.68 |
| 90% |
29.81 |
56.35 |
26.55 |
| 95% |
27.26 |
58.90 |
31.63 |
Structure & Probabilities
| Support |
Resistance |
Gamma Flip |
Max Pain |
P>Res |
P<Sup |
| 40.00 |
45.00 |
27.86 |
35.00 |
44.6% |
32.3% |
Flow & Skew
| Call Vol |
Put Vol |
Vol P/C |
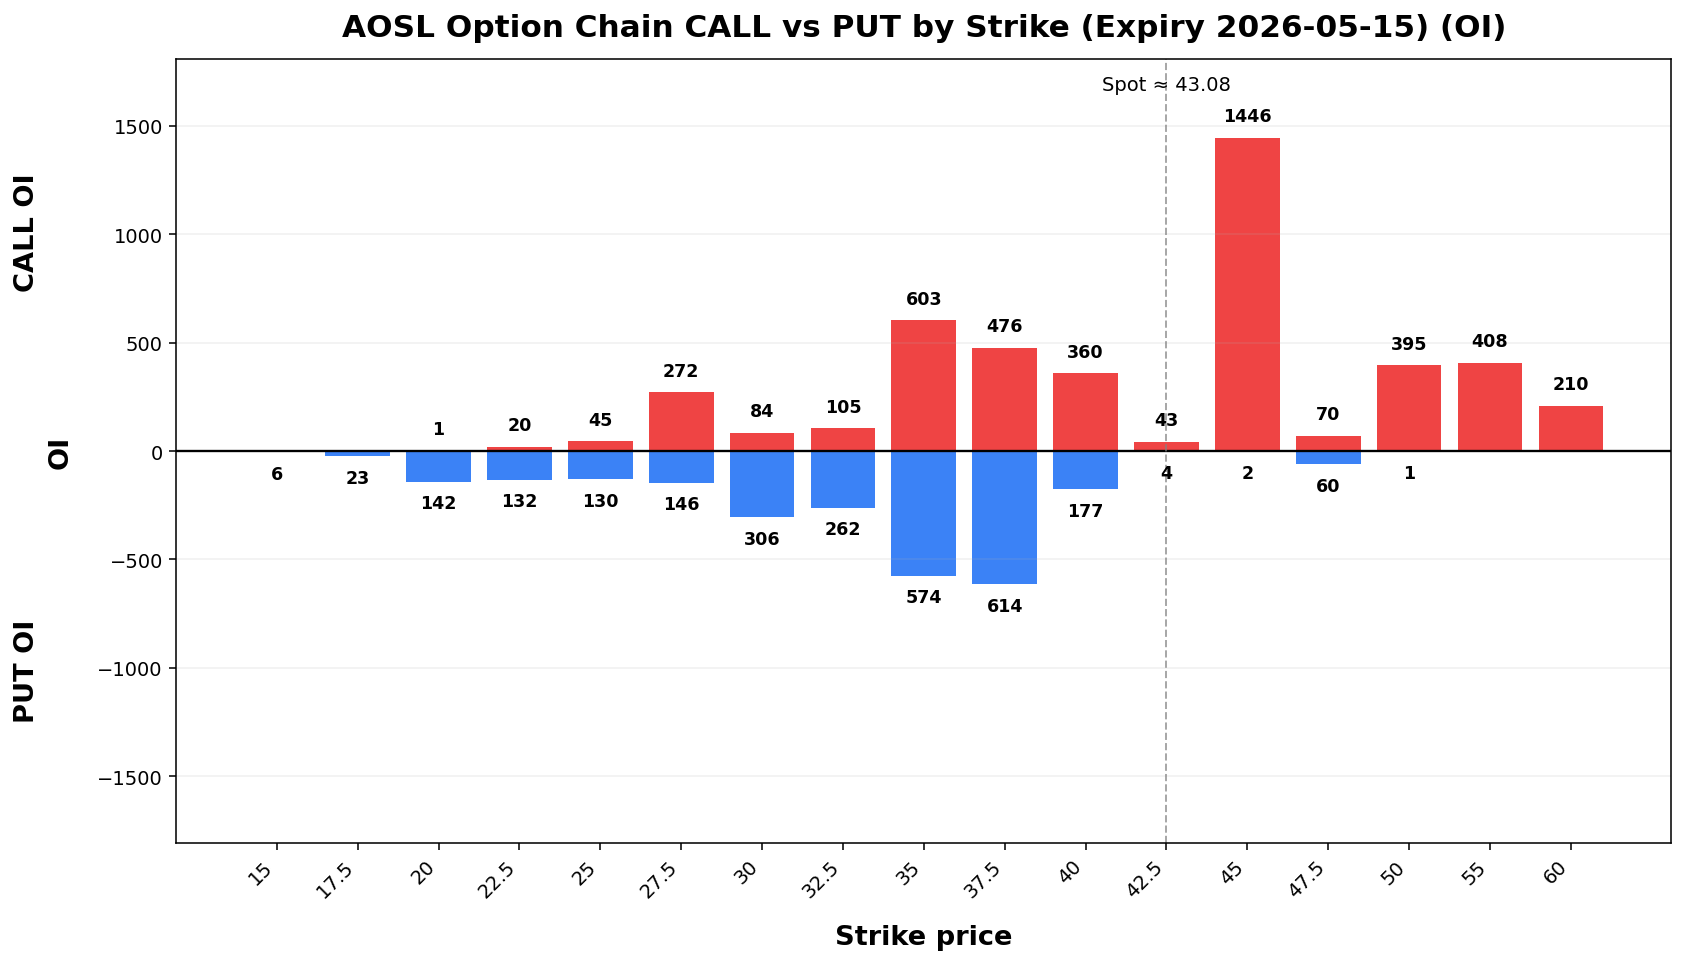
Call OI |
Put OI |
OI P/C |
Skew |
Skew Bias |
| 754 |
813 |
1.08 |
4,538 |
2,579 |
0.57 |
-5.66 vol pts |
CALL_SKEW |
Tail Risk
| Q10 |
Q50 |
Q90 |
Down Tail |
Up Tail |
Down/Up |
| 27.68 |
39.28 |
50.35 |
15.40 |
7.27 |
2.12 |
Daily Technicals
| EMA20 |
EMA50 |
VWAP20 |
BB Lower |
BB Mid |
BB Upper |
BB Width |
Vol Ratio |
Path |
| 35.86 |
29.60 |
37.85 |
19.23 |
34.42 |
49.62 |
88.27% |
1.67 |
UP trend (expanding) |
Day Plan
- 40.00-45.00 range: fade extremes
- > 45.00: chase only if hold + vol
- < 40.00: risk expand; reduce size
- Regime: TRANSITION
- Tech: UP trend (expanding)
Swing Plan
- Accumulate: 40.00-40.00
- Trim: 45.00-45.00
- Add: close > 45.00
- Cut: close < 40.00
- Best for: transition regime
Raw Text Summary
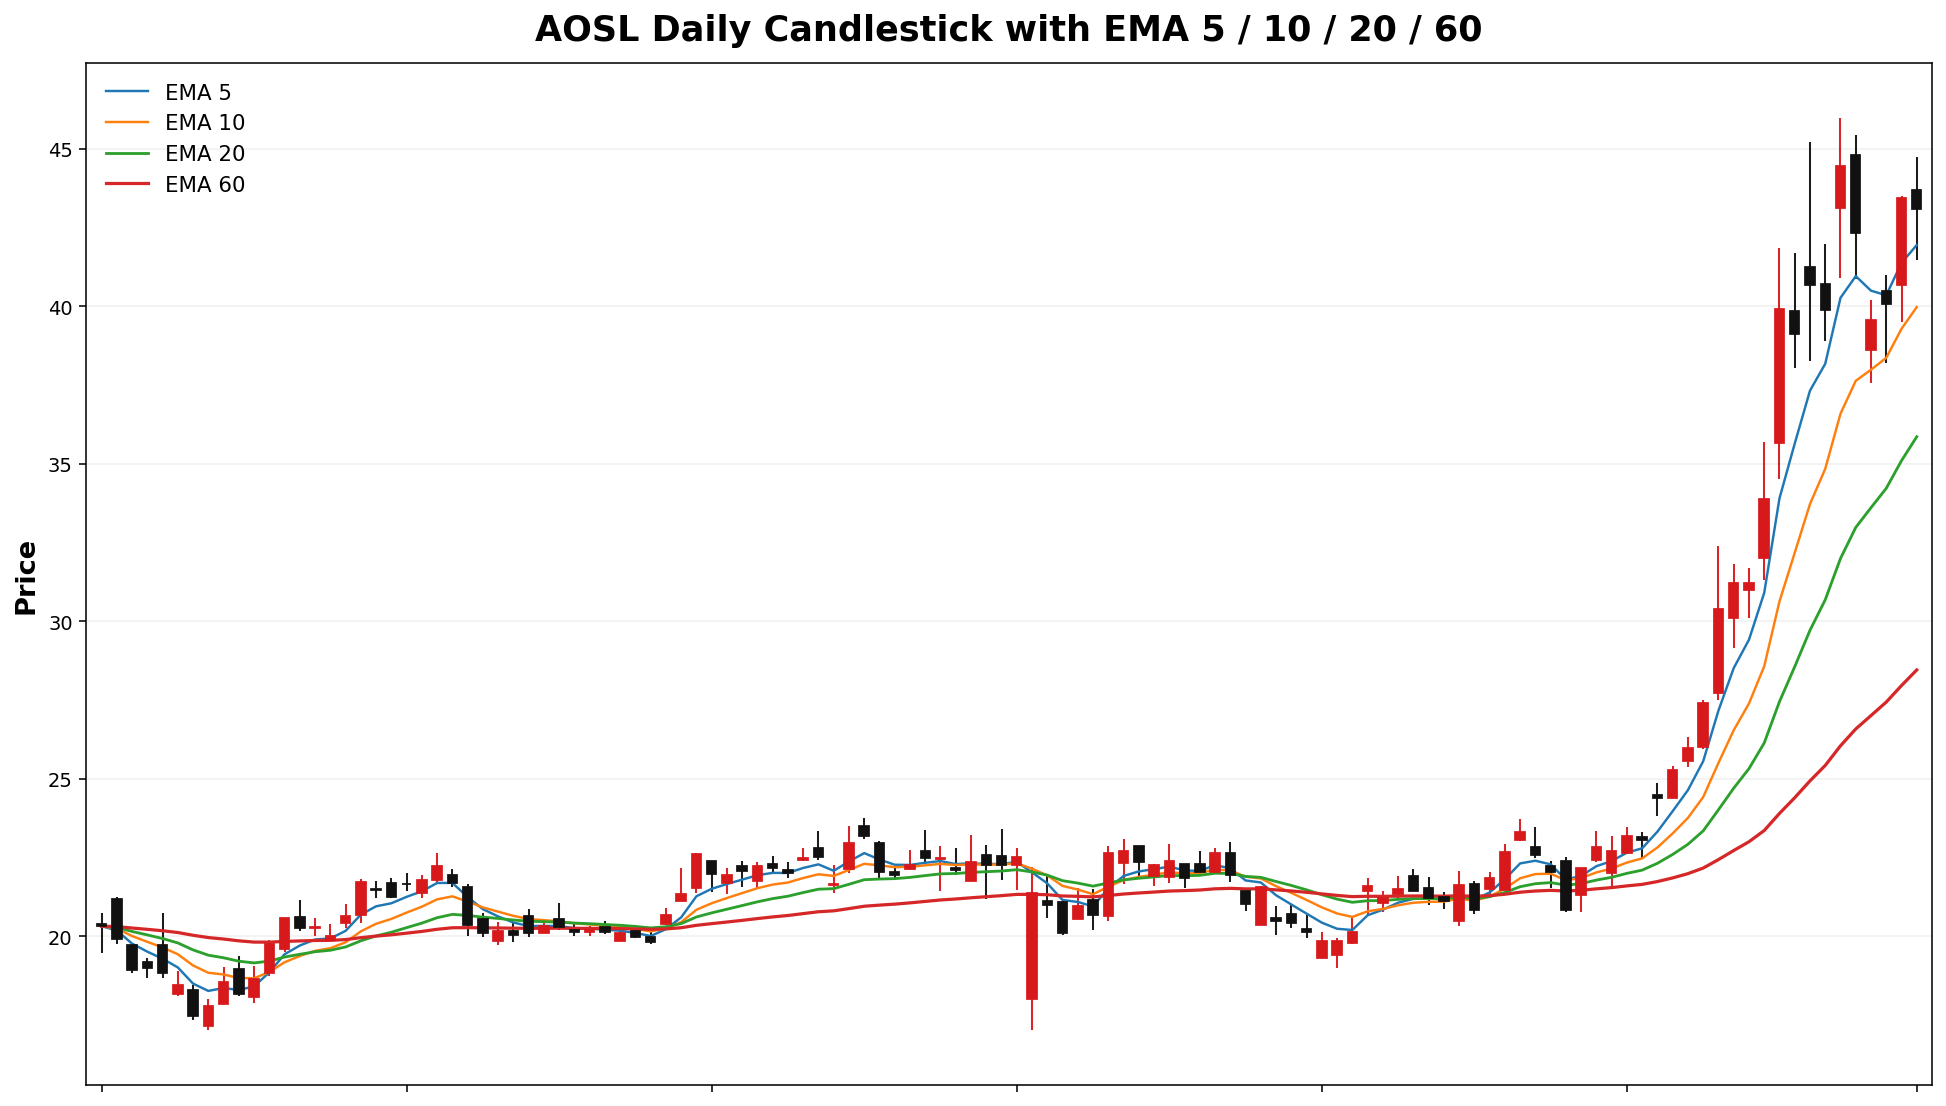
📌 AOSL @ 43.08 (2026-05-03 08:48 AM MYT)

• Current price is **43.08**. Key support is around **40.00**, and resistance is around **45.00**.
• For the next week, the model’s **68% expected range** is roughly **35.01 to 51.15**.
• A wider **90% range** is about **29.81 to 56.35**.
• Dealer positioning looks **LONG gamma**, so the market behavior is classified as **TRANSITION**.
• The estimated **gamma flip** is near **27.86**. Crossing and holding beyond this area can change the trading behavior.
• Approximate breakout odds: **above resistance 44.6%**, **below support 32.3%** by the target horizon.
• Options skew is tilted toward **calls**, which suggests upside speculation is relatively stronger.
• Near-term implied volatility is higher than the next expiry (**IV1 111.60% vs IV2 86.57%**), which suggests **near-term event stress / backwardation**.
• Recent volume is **1.67x** the 20-day average, which supports stronger continuation or breakout follow-through.
• On the daily chart, the stock currently looks like **UP trend (expanding)**.
• The implied distribution shows **heavier downside tail risk** than upside tail potential.
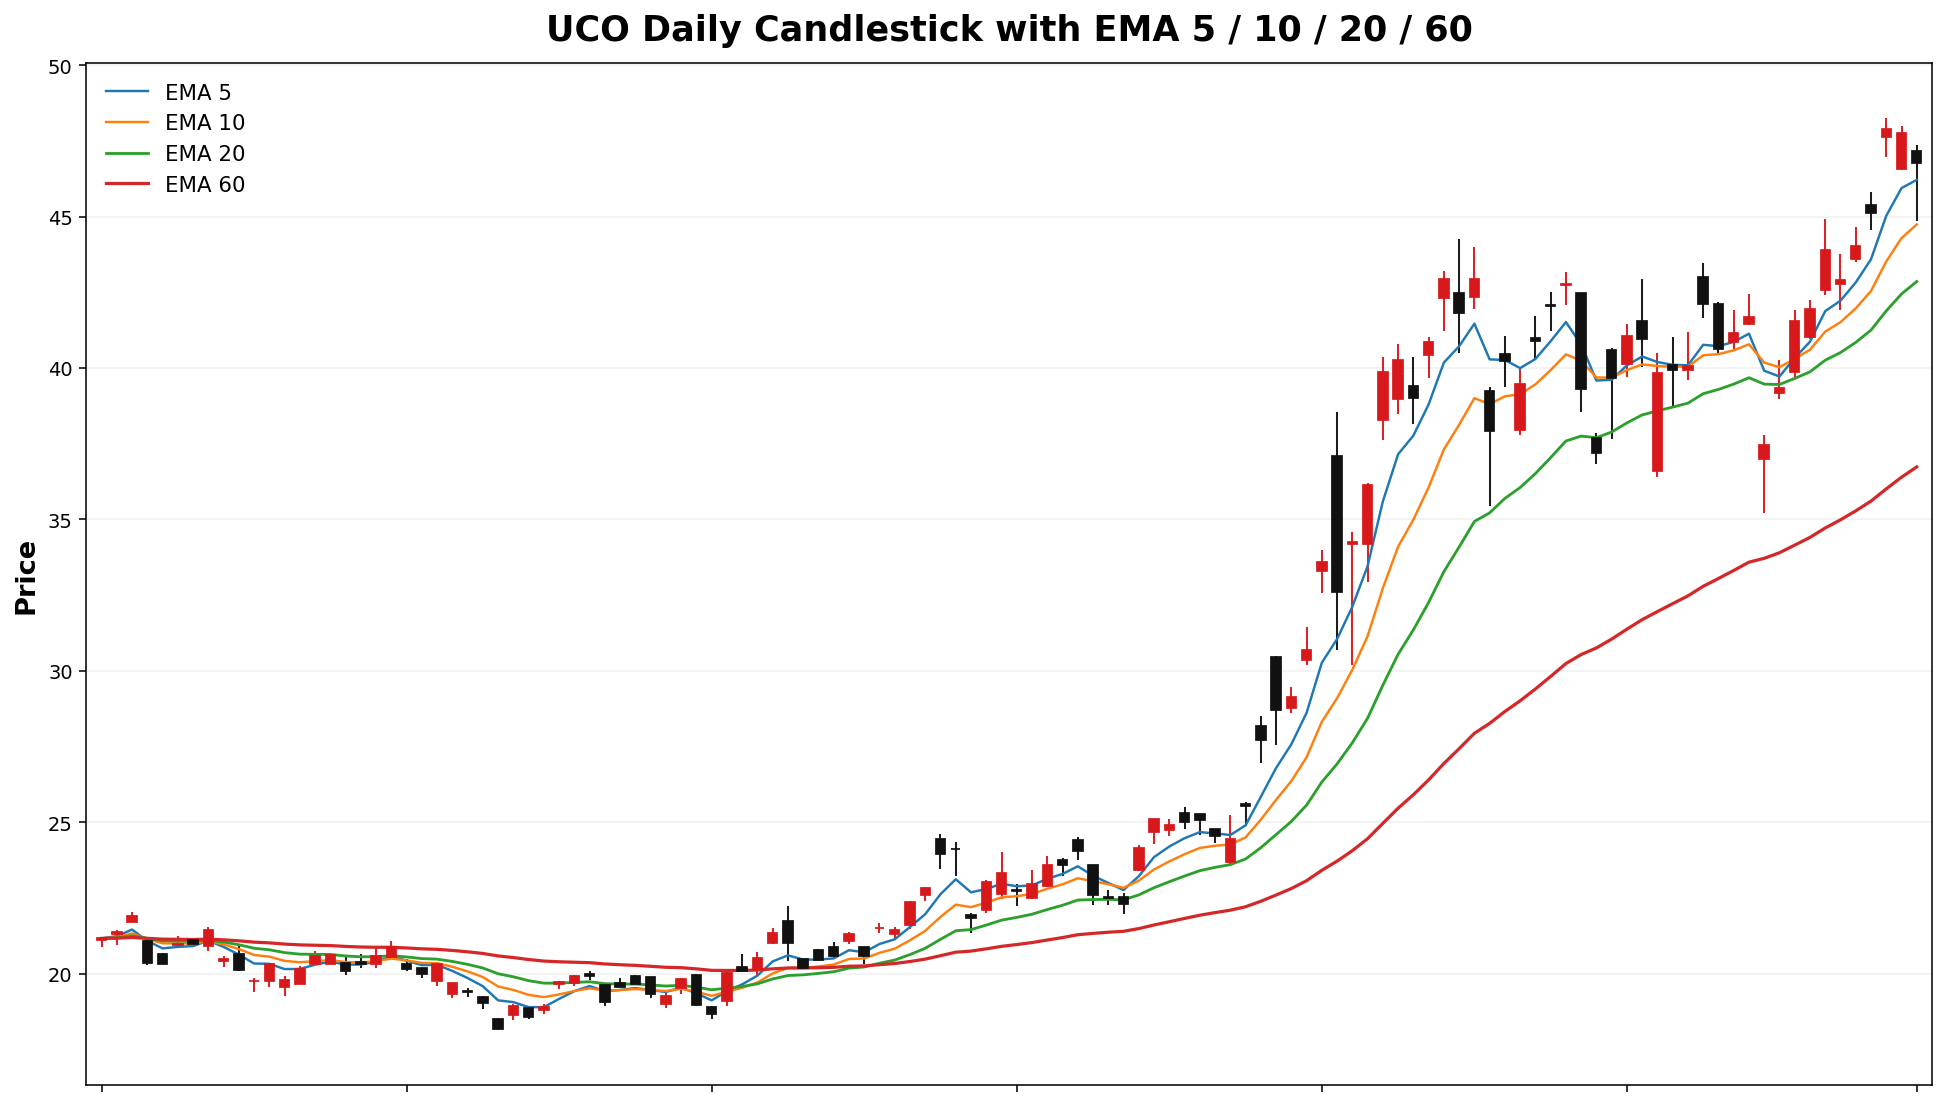
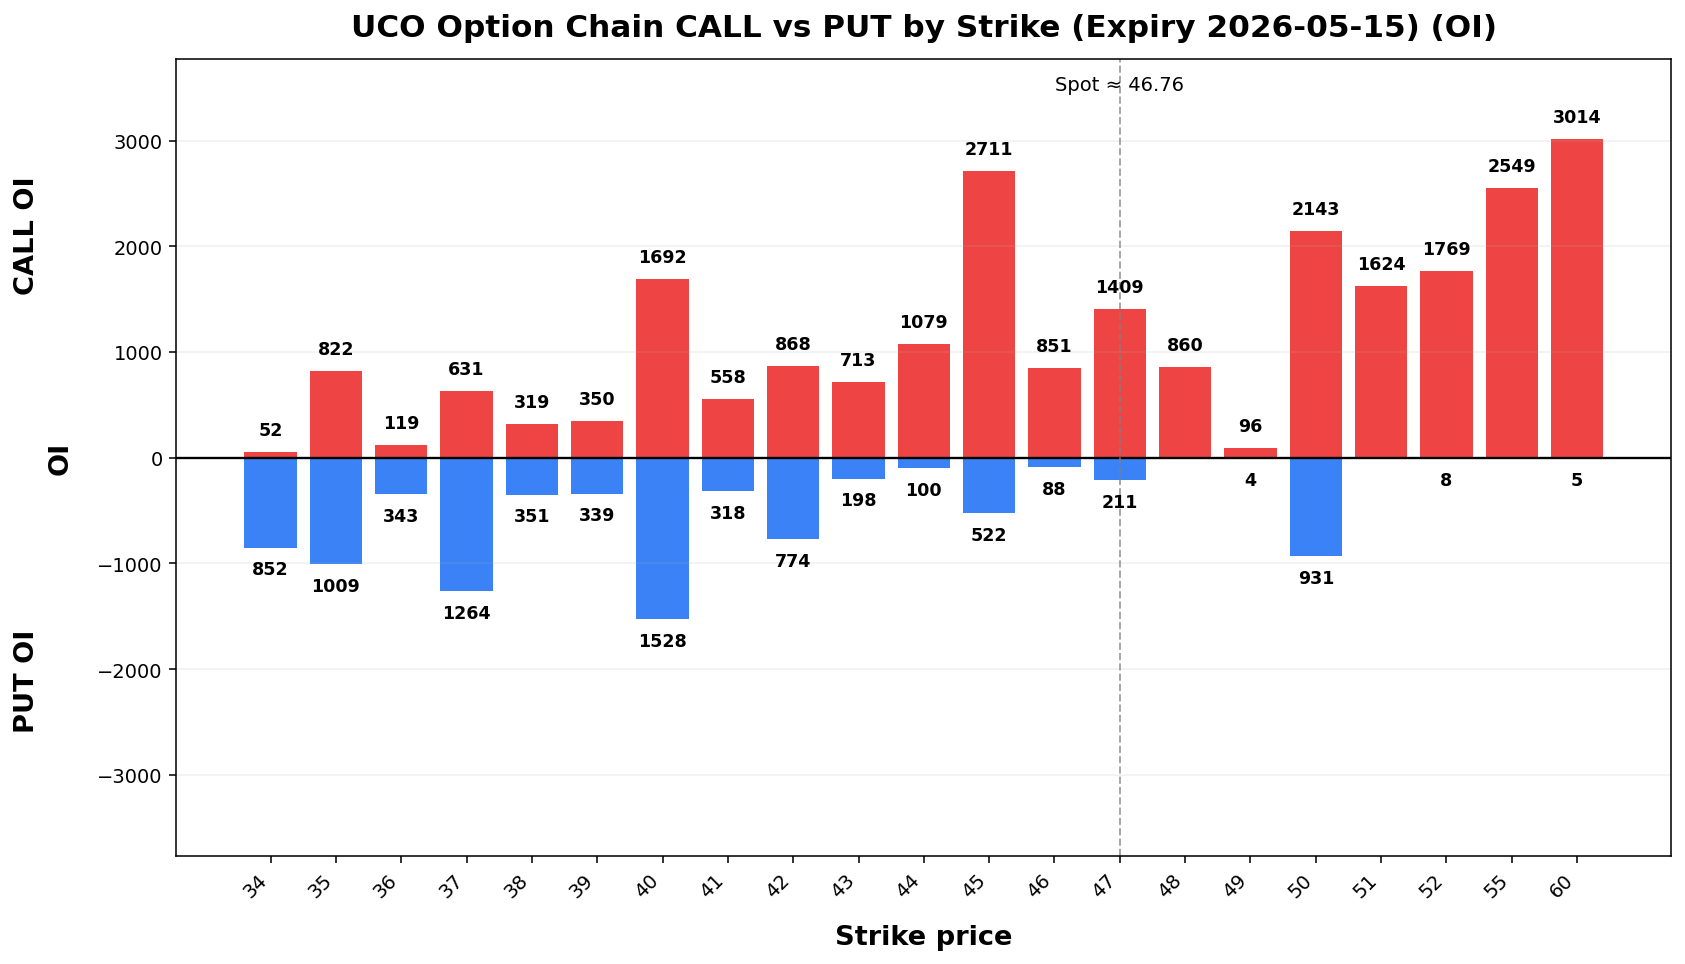
UCO
Spot: 46.76
Report Time: 2026-05-03 08:48 AM MYT
Regime: TRANSITION
Dealer Gamma: LONG
Term Structure
| Expiry |
DTE |
Forward |
ATM IV |
ATM Straddle |
| 2026-05-15 |
13 |
46.74 |
83.40% |
7.30 |
| 2026-06-18 |
47 |
46.64 |
73.78% |
12.35 |
Weekly Range
| Confidence |
Low |
High |
Width |
| 68% |
40.67 |
52.85 |
12.18 |
| 80% |
38.96 |
54.56 |
15.61 |
| 90% |
36.74 |
56.78 |
20.03 |
| 95% |
34.82 |
58.70 |
23.87 |
Structure & Probabilities
| Support |
Resistance |
Gamma Flip |
Max Pain |
P>Res |
P<Sup |
| 45.00 |
50.00 |
35.40 |
40.00 |
29.2% |
31.7% |
Flow & Skew
| Call Vol |
Put Vol |
Vol P/C |
Call OI |
Put OI |
OI P/C |
Skew |
Skew Bias |
| 2,382 |
910 |
0.38 |
24,927 |
17,553 |
0.70 |
-4.79 vol pts |
CALL_SKEW |
Tail Risk
| Q10 |
Q50 |
Q90 |
Down Tail |
Up Tail |
Down/Up |
| 36.04 |
43.53 |
51.33 |
10.72 |
4.57 |
2.35 |
Daily Technicals
| EMA20 |
EMA50 |
VWAP20 |
BB Lower |
BB Mid |
BB Upper |
BB Width |
Vol Ratio |
Path |
| 42.86 |
38.09 |
41.63 |
36.64 |
42.30 |
47.97 |
26.80% |
0.83 |
UP trend (expanding) |
Day Plan
- 45.00-50.00 range: fade extremes
- > 50.00: chase only if hold + vol
- < 45.00: risk expand; reduce size
- Regime: TRANSITION
- Tech: UP trend (expanding)
Swing Plan
- Accumulate: 45.00-45.00
- Trim: 50.00-50.00
- Add: close > 50.00
- Cut: close < 45.00
- Best for: transition regime
Raw Text Summary
📌 UCO @ 46.76 (2026-05-03 08:48 AM MYT)

• Current price is **46.76**. Key support is around **45.00**, and resistance is around **50.00**.
• For the next week, the model’s **68% expected range** is roughly **40.67 to 52.85**.
• A wider **90% range** is about **36.74 to 56.78**.
• Dealer positioning looks **LONG gamma**, so the market behavior is classified as **TRANSITION**.
• The estimated **gamma flip** is near **35.40**. Crossing and holding beyond this area can change the trading behavior.
• Approximate breakout odds: **above resistance 29.2%**, **below support 31.7%** by the target horizon.
• Options skew is tilted toward **calls**, which suggests upside speculation is relatively stronger.
• Near-term implied volatility is higher than the next expiry (**IV1 83.40% vs IV2 73.78%**), which suggests **near-term event stress / backwardation**.
• On the daily chart, the stock currently looks like **UP trend (expanding)**.
• The implied distribution shows **heavier downside tail risk** than upside tail potential.
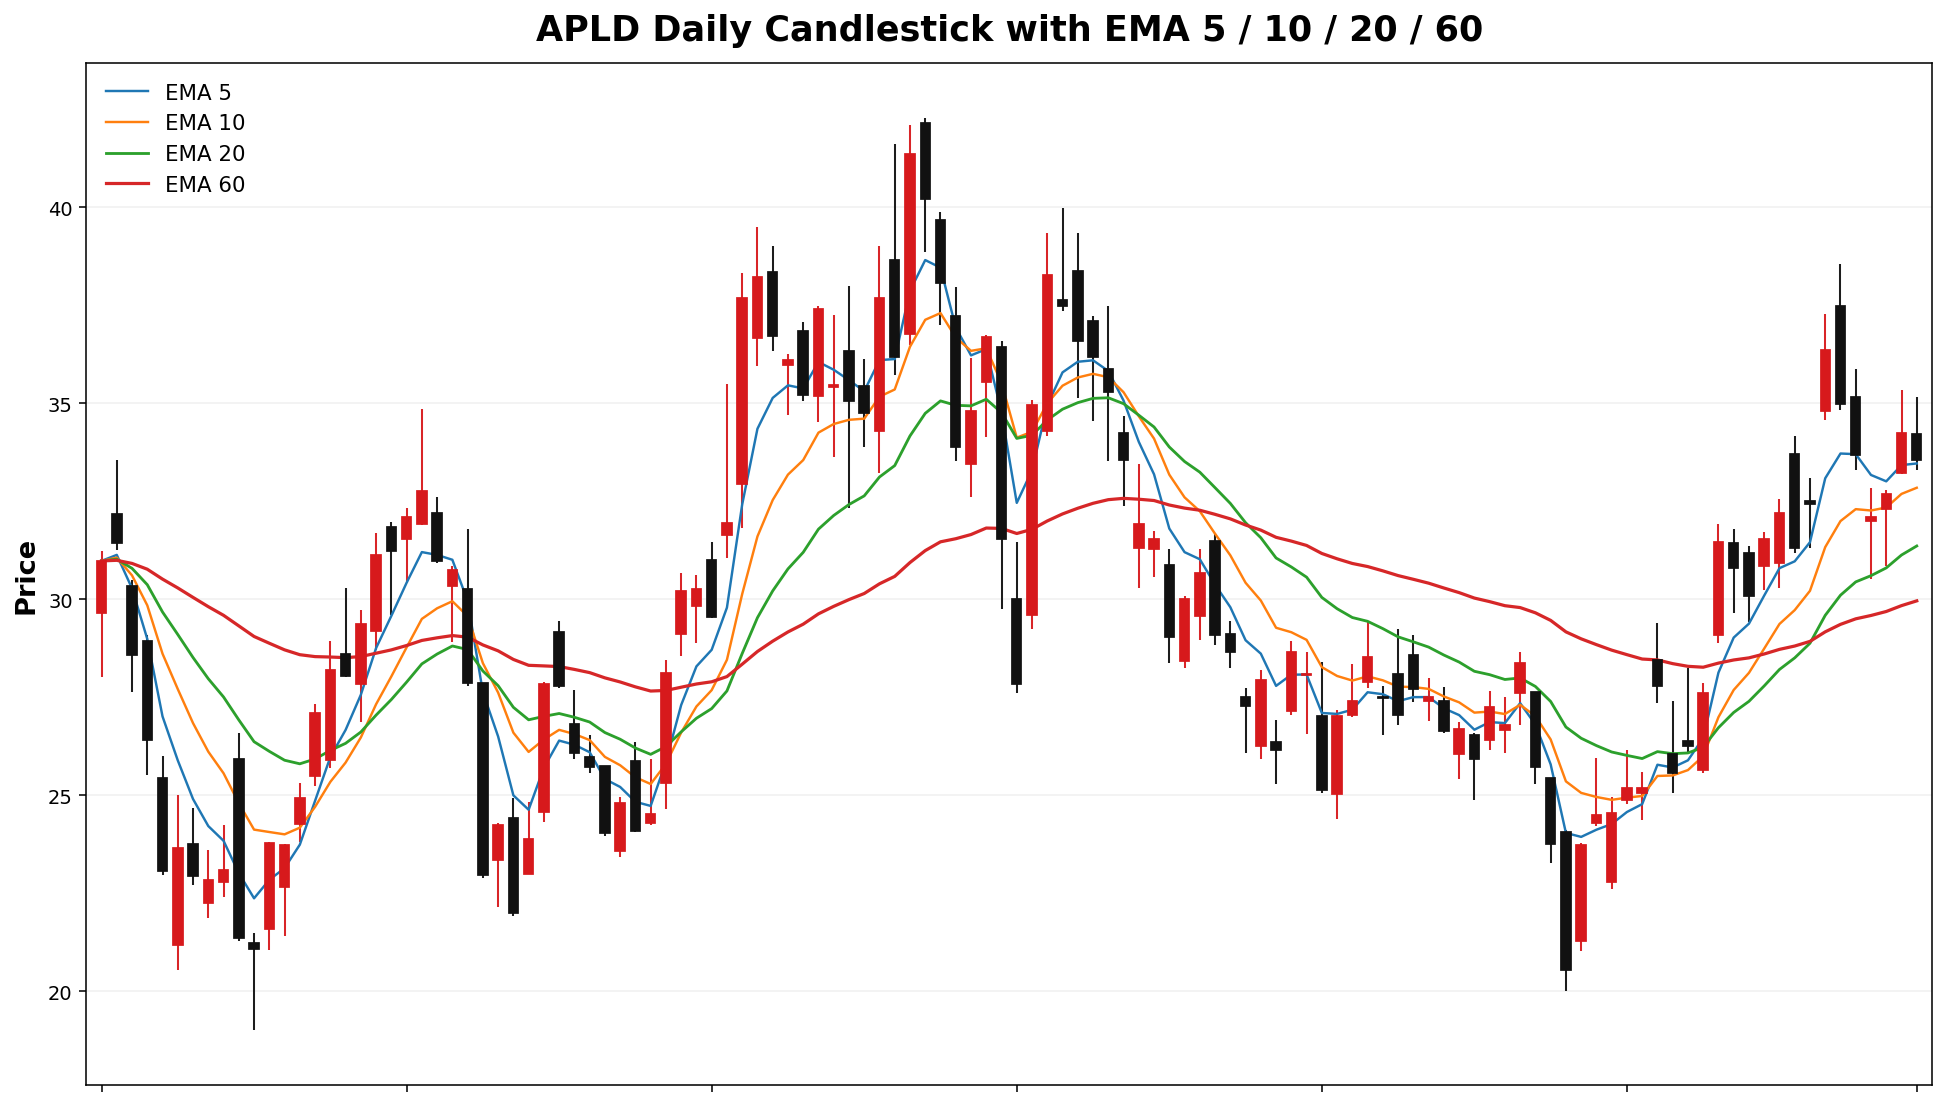
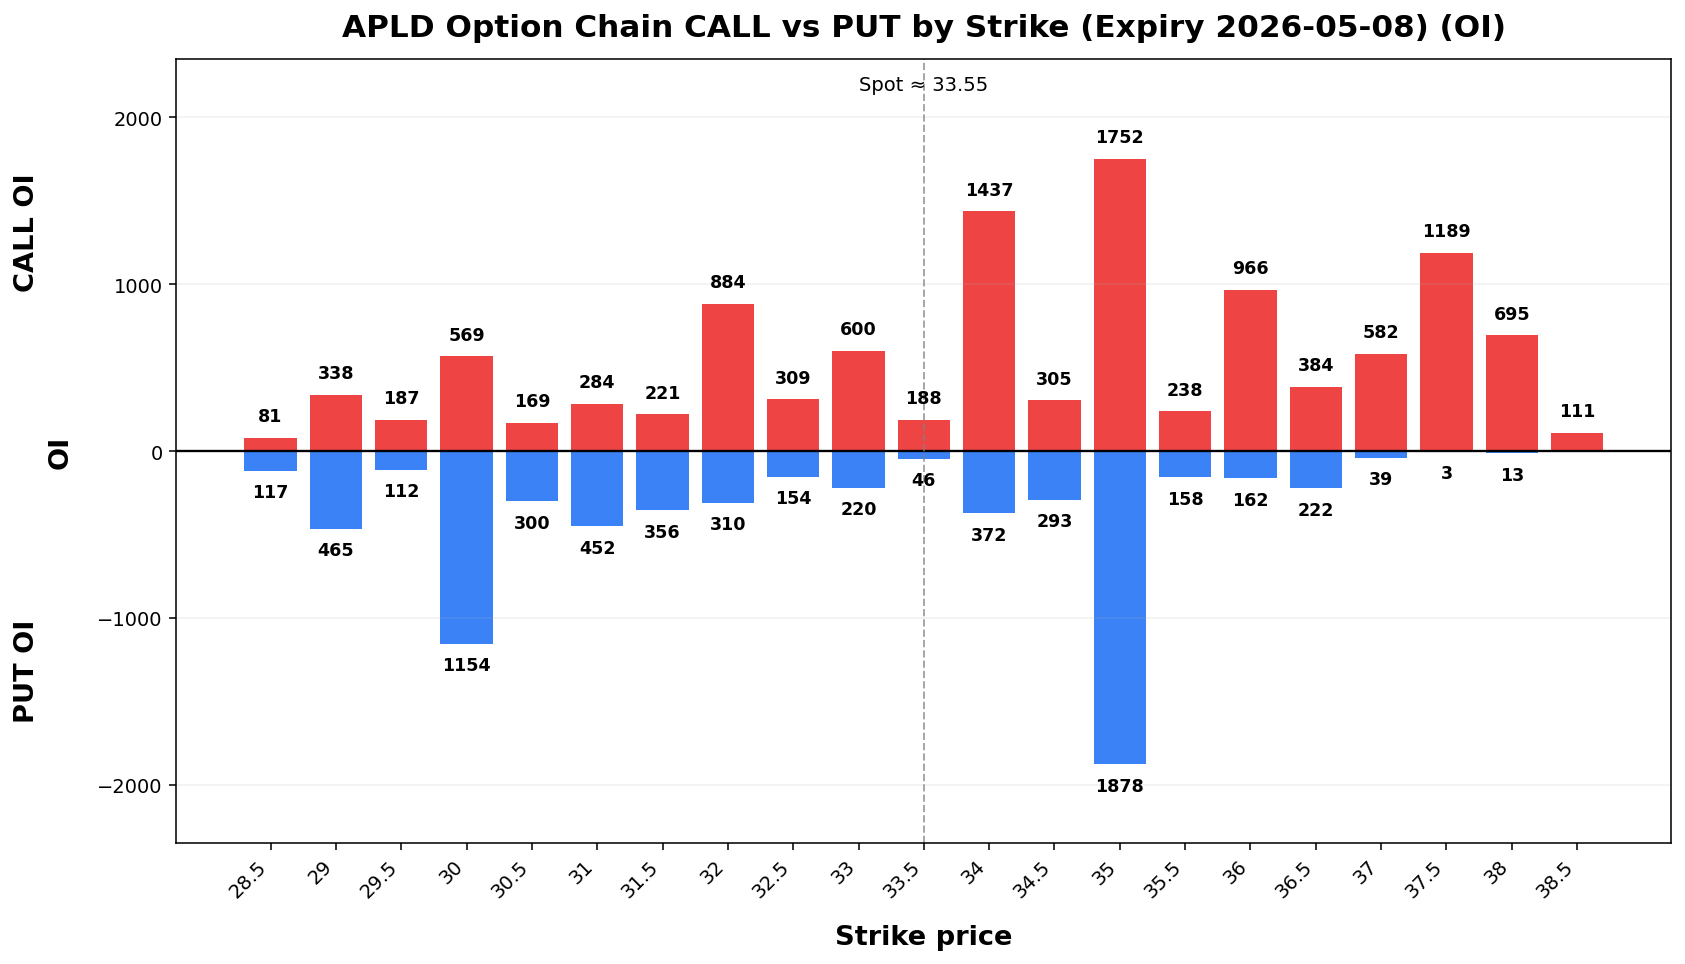
APLD
Spot: 33.55
Report Time: 2026-05-03 08:48 AM MYT
Regime: TRANSITION
Dealer Gamma: LONG
Term Structure
| Expiry |
DTE |
Forward |
ATM IV |
ATM Straddle |
| 2026-05-08 |
6 |
33.61 |
89.53% |
3.78 |
| 2026-05-15 |
13 |
33.59 |
86.46% |
5.43 |
Weekly Range
| Confidence |
Low |
High |
Width |
| 68% |
29.37 |
37.73 |
8.36 |
| 80% |
28.19 |
38.91 |
10.71 |
| 90% |
26.68 |
40.42 |
13.75 |
| 95% |
25.36 |
41.74 |
16.38 |
Structure & Probabilities
| Support |
Resistance |
Gamma Flip |
Max Pain |
P>Res |
P<Sup |
| 27.00 |
34.00 |
32.23 |
32.00 |
34.9% |
5.3% |
Flow & Skew
| Call Vol |
Put Vol |
Vol P/C |
Call OI |
Put OI |
OI P/C |
Skew |
Skew Bias |
| 15,229 |
14,799 |
0.97 |
19,177 |
29,403 |
1.53 |
5.66 vol pts |
PUT_SKEW |
Tail Risk
| Q10 |
Q50 |
Q90 |
Down Tail |
Up Tail |
Down/Up |
| 28.67 |
33.81 |
39.09 |
4.88 |
5.54 |
0.88 |
Daily Technicals
| EMA20 |
EMA50 |
VWAP20 |
BB Lower |
BB Mid |
BB Upper |
BB Width |
Vol Ratio |
Path |
| 31.36 |
30.00 |
31.06 |
23.98 |
30.75 |
37.52 |
44.05% |
0.66 |
UP trend (expanding) |
Day Plan
- 27.00-34.00 range: fade extremes
- > 34.00: chase only if hold + vol
- < 27.00: risk expand; reduce size
- Regime: TRANSITION
- Tech: UP trend (expanding)
Swing Plan
- Accumulate: 27.00-27.00
- Trim: 34.00-34.00
- Add: close > 34.00
- Cut: close < 27.00
- Best for: transition regime
Raw Text Summary
📌 APLD @ 33.55 (2026-05-03 08:48 AM MYT)

• Current price is **33.55**. Key support is around **27.00**, and resistance is around **34.00**.
• For the next week, the model’s **68% expected range** is roughly **29.37 to 37.73**.
• A wider **90% range** is about **26.68 to 40.42**.
• Dealer positioning looks **LONG gamma**, so the market behavior is classified as **TRANSITION**.
• The estimated **gamma flip** is near **32.23**. Crossing and holding beyond this area can change the trading behavior.
• Approximate breakout odds: **above resistance 34.9%**, **below support 5.3%** by the target horizon.
• Options skew is tilted toward **puts**, which suggests traders are paying more for downside protection.
• Near-term implied volatility is higher than the next expiry (**IV1 89.53% vs IV2 86.46%**), which suggests **near-term event stress / backwardation**.
• Recent volume is only **0.66x** the 20-day average, so breakouts may be less reliable unless volume improves.
• On the daily chart, the stock currently looks like **UP trend (expanding)**.
• The implied distribution shows **more upside tail potential** than downside tail risk.
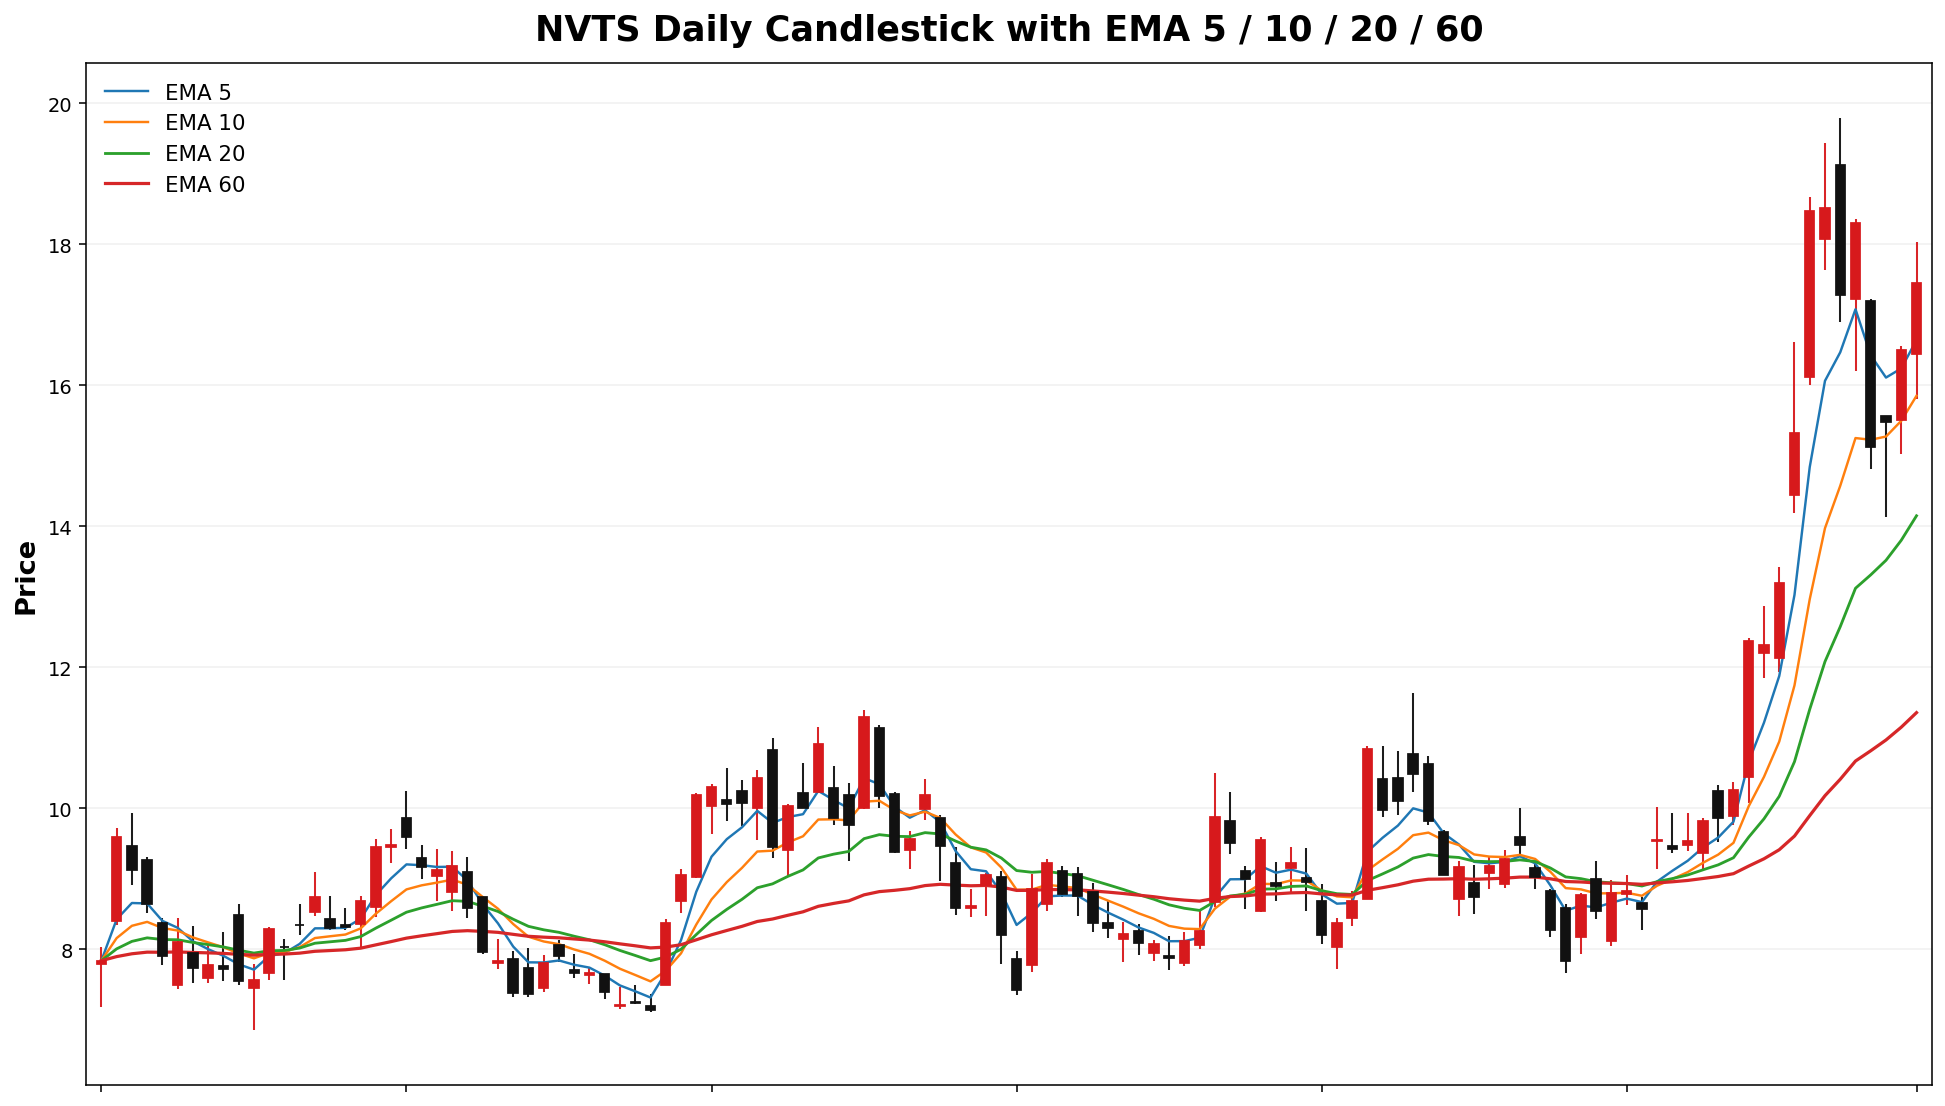
NVTS
Spot: 17.45
Report Time: 2026-05-03 08:48 AM MYT
Regime: TRANSITION
Dealer Gamma: LONG
Term Structure
| Expiry |
DTE |
Forward |
ATM IV |
ATM Straddle |
| 2026-05-08 |
6 |
17.44 |
146.90% |
3.23 |
| 2026-05-15 |
13 |
17.45 |
122.91% |
4.02 |
Weekly Range
| Confidence |
Low |
High |
Width |
| 68% |
14.04 |
20.86 |
6.81 |
| 80% |
13.08 |
21.82 |
8.73 |
| 90% |
11.85 |
23.05 |
11.21 |
| 95% |
10.77 |
24.13 |
13.36 |
Structure & Probabilities
| Support |
Resistance |
Gamma Flip |
Max Pain |
P>Res |
P<Sup |
| 17.00 |
17.50 |
12.37 |
12.00 |
48.5% |
36.7% |
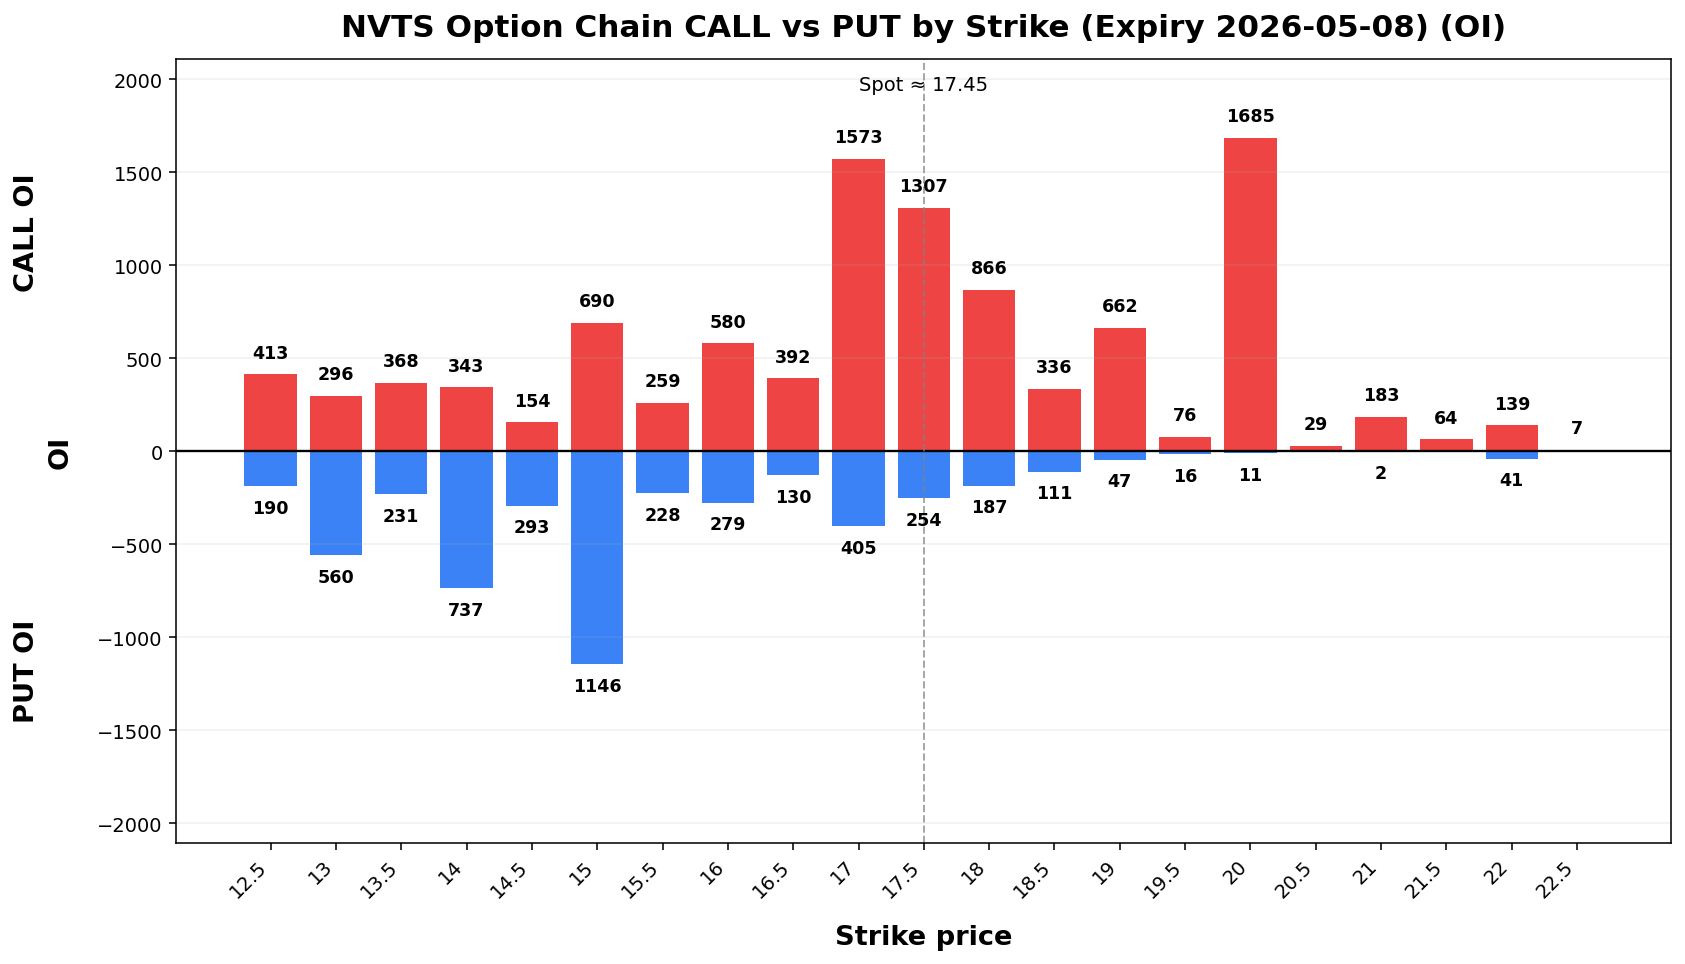
Flow & Skew
| Call Vol |
Put Vol |
Vol P/C |
Call OI |
Put OI |
OI P/C |
Skew |
Skew Bias |
| 11,454 |
7,044 |
0.61 |
18,303 |
15,184 |
0.83 |
-11.91 vol pts |
CALL_SKEW |
Tail Risk
| Q10 |
Q50 |
Q90 |
Down Tail |
Up Tail |
Down/Up |
| 8.97 |
16.89 |
23.27 |
8.48 |
5.82 |
1.46 |
Daily Technicals
| EMA20 |
EMA50 |
VWAP20 |
BB Lower |
BB Mid |
BB Upper |
BB Width |
Vol Ratio |
Path |
| 14.15 |
11.77 |
14.62 |
5.98 |
13.31 |
20.63 |
110.07% |
0.89 |
UP trend (expanding) |
Day Plan
- 17.00-17.50 range: fade extremes
- > 17.50: chase only if hold + vol
- < 17.00: risk expand; reduce size
- Regime: TRANSITION
- Tech: UP trend (expanding)
Swing Plan
- Accumulate: 17.00-17.00
- Trim: 17.50-17.50
- Add: close > 17.50
- Cut: close < 17.00
- Best for: transition regime
Raw Text Summary
📌 NVTS @ 17.45 (2026-05-03 08:48 AM MYT)

• Current price is **17.45**. Key support is around **17.00**, and resistance is around **17.50**.
• For the next week, the model’s **68% expected range** is roughly **14.04 to 20.86**.
• A wider **90% range** is about **11.85 to 23.05**.
• Dealer positioning looks **LONG gamma**, so the market behavior is classified as **TRANSITION**.
• The estimated **gamma flip** is near **12.37**. Crossing and holding beyond this area can change the trading behavior.
• Approximate breakout odds: **above resistance 48.5%**, **below support 36.7%** by the target horizon.
• Options skew is tilted toward **calls**, which suggests upside speculation is relatively stronger.
• Near-term implied volatility is higher than the next expiry (**IV1 146.90% vs IV2 122.91%**), which suggests **near-term event stress / backwardation**.
• On the daily chart, the stock currently looks like **UP trend (expanding)**.
• The implied distribution shows **heavier downside tail risk** than upside tail potential.
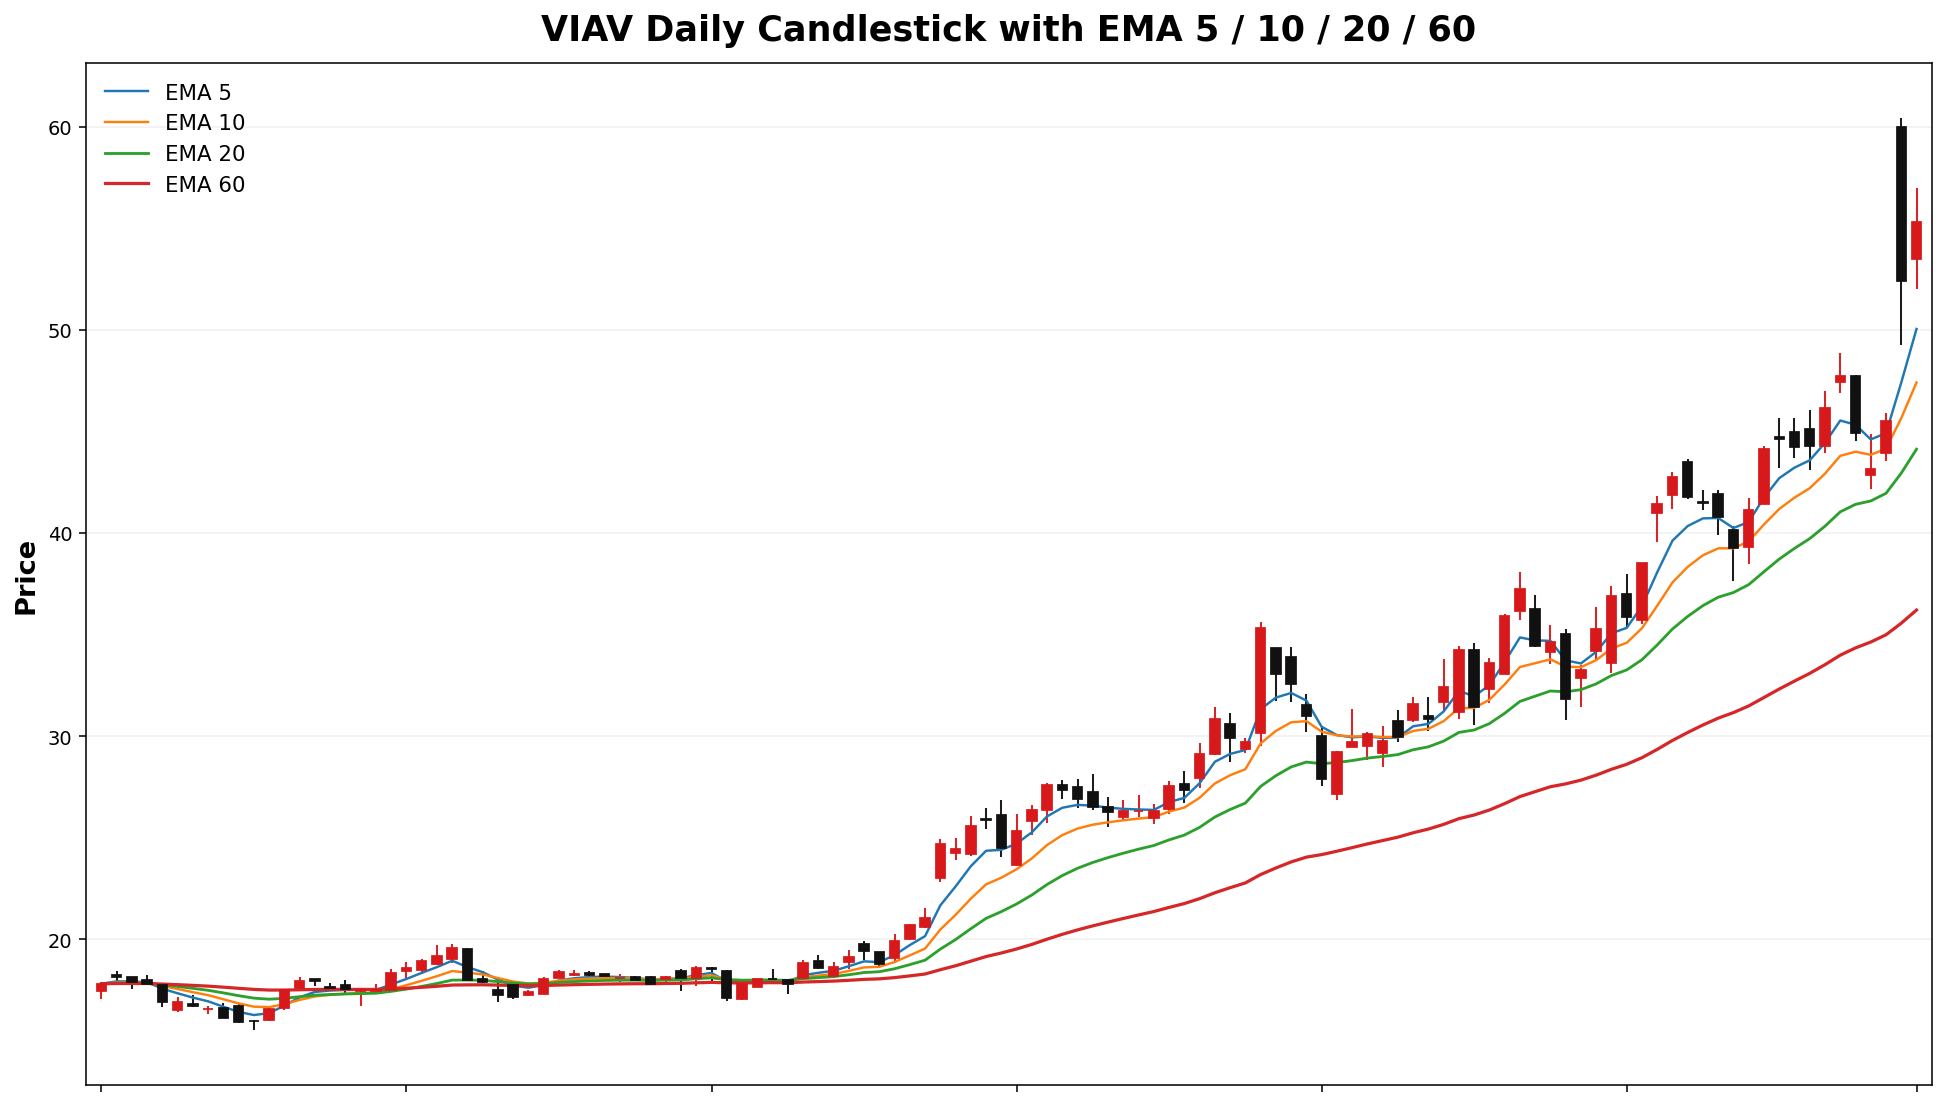
VIAV
Spot: 55.33
Report Time: 2026-05-03 08:48 AM MYT
Regime: TRANSITION
Dealer Gamma: LONG
Term Structure
| Expiry |
DTE |
Forward |
ATM IV |
ATM Straddle |
| 2026-05-15 |
13 |
55.82 |
85.20% |
8.82 |
| 2026-06-18 |
47 |
55.87 |
69.43% |
13.75 |
Weekly Range
| Confidence |
Low |
High |
Width |
| 68% |
47.60 |
63.06 |
15.46 |
| 80% |
45.43 |
65.23 |
19.81 |
| 90% |
42.62 |
68.04 |
25.42 |
| 95% |
40.18 |
70.48 |
30.29 |
Structure & Probabilities
| Support |
Resistance |
Gamma Flip |
Max Pain |
P>Res |
P<Sup |
| 55.00 |
60.00 |
43.33 |
42.00 |
26.8% |
39.7% |
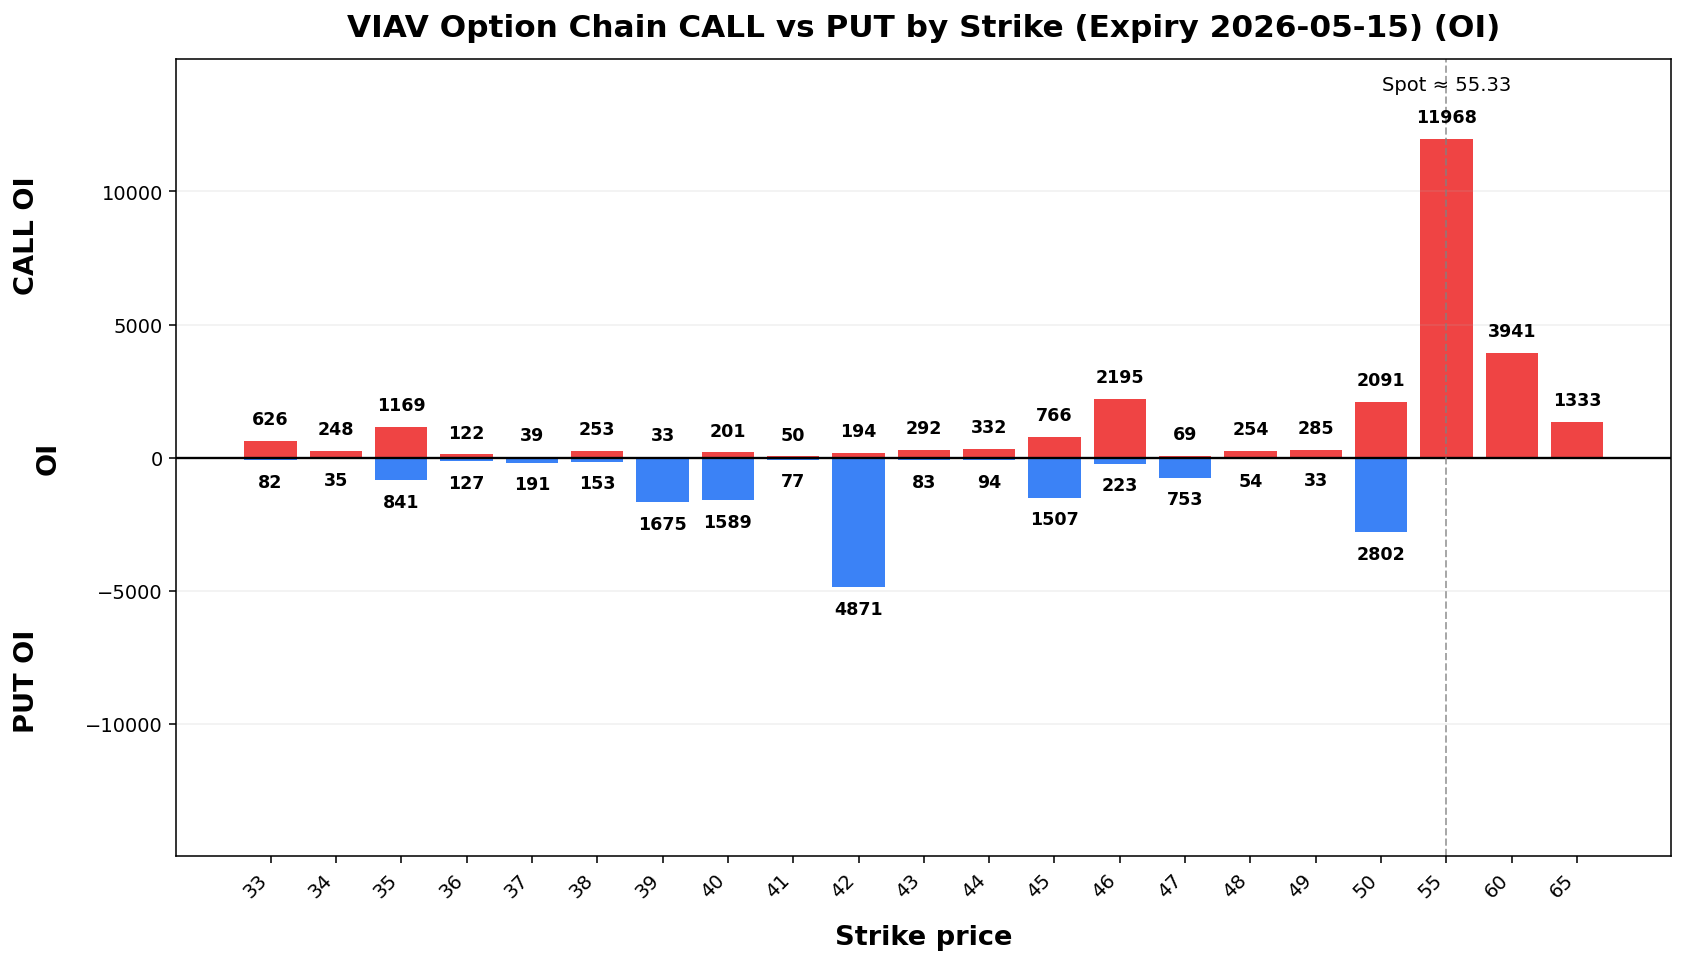
Flow & Skew
| Call Vol |
Put Vol |
Vol P/C |
Call OI |
Put OI |
OI P/C |
Skew |
Skew Bias |
| 7,375 |
2,635 |
0.36 |
29,548 |
18,498 |
0.63 |
-3.37 vol pts |
CALL_SKEW |
Tail Risk
| Q10 |
Q50 |
Q90 |
Down Tail |
Up Tail |
Down/Up |
| 9.47 |
51.37 |
60.19 |
45.86 |
4.86 |
9.44 |
Daily Technicals
| EMA20 |
EMA50 |
VWAP20 |
BB Lower |
BB Mid |
BB Upper |
BB Width |
Vol Ratio |
Path |
| 44.13 |
37.72 |
45.23 |
34.87 |
43.78 |
52.69 |
40.72% |
1.48 |
UP trend (expanding) |
Day Plan
- 55.00-60.00 range: fade extremes
- > 60.00: chase only if hold + vol
- < 55.00: risk expand; reduce size
- Regime: TRANSITION
- Tech: UP trend (expanding)
Swing Plan
- Accumulate: 55.00-55.00
- Trim: 60.00-60.00
- Add: close > 60.00
- Cut: close < 55.00
- Best for: transition regime
Raw Text Summary
📌 VIAV @ 55.33 (2026-05-03 08:48 AM MYT)

• Current price is **55.33**. Key support is around **55.00**, and resistance is around **60.00**.
• For the next week, the model’s **68% expected range** is roughly **47.60 to 63.06**.
• A wider **90% range** is about **42.62 to 68.04**.
• Dealer positioning looks **LONG gamma**, so the market behavior is classified as **TRANSITION**.
• The estimated **gamma flip** is near **43.33**. Crossing and holding beyond this area can change the trading behavior.
• Approximate breakout odds: **above resistance 26.8%**, **below support 39.7%** by the target horizon.
• Options skew is tilted toward **calls**, which suggests upside speculation is relatively stronger.
• Near-term implied volatility is higher than the next expiry (**IV1 85.20% vs IV2 69.43%**), which suggests **near-term event stress / backwardation**.
• On the daily chart, the stock currently looks like **UP trend (expanding)**.
• The implied distribution shows **heavier downside tail risk** than upside tail potential.
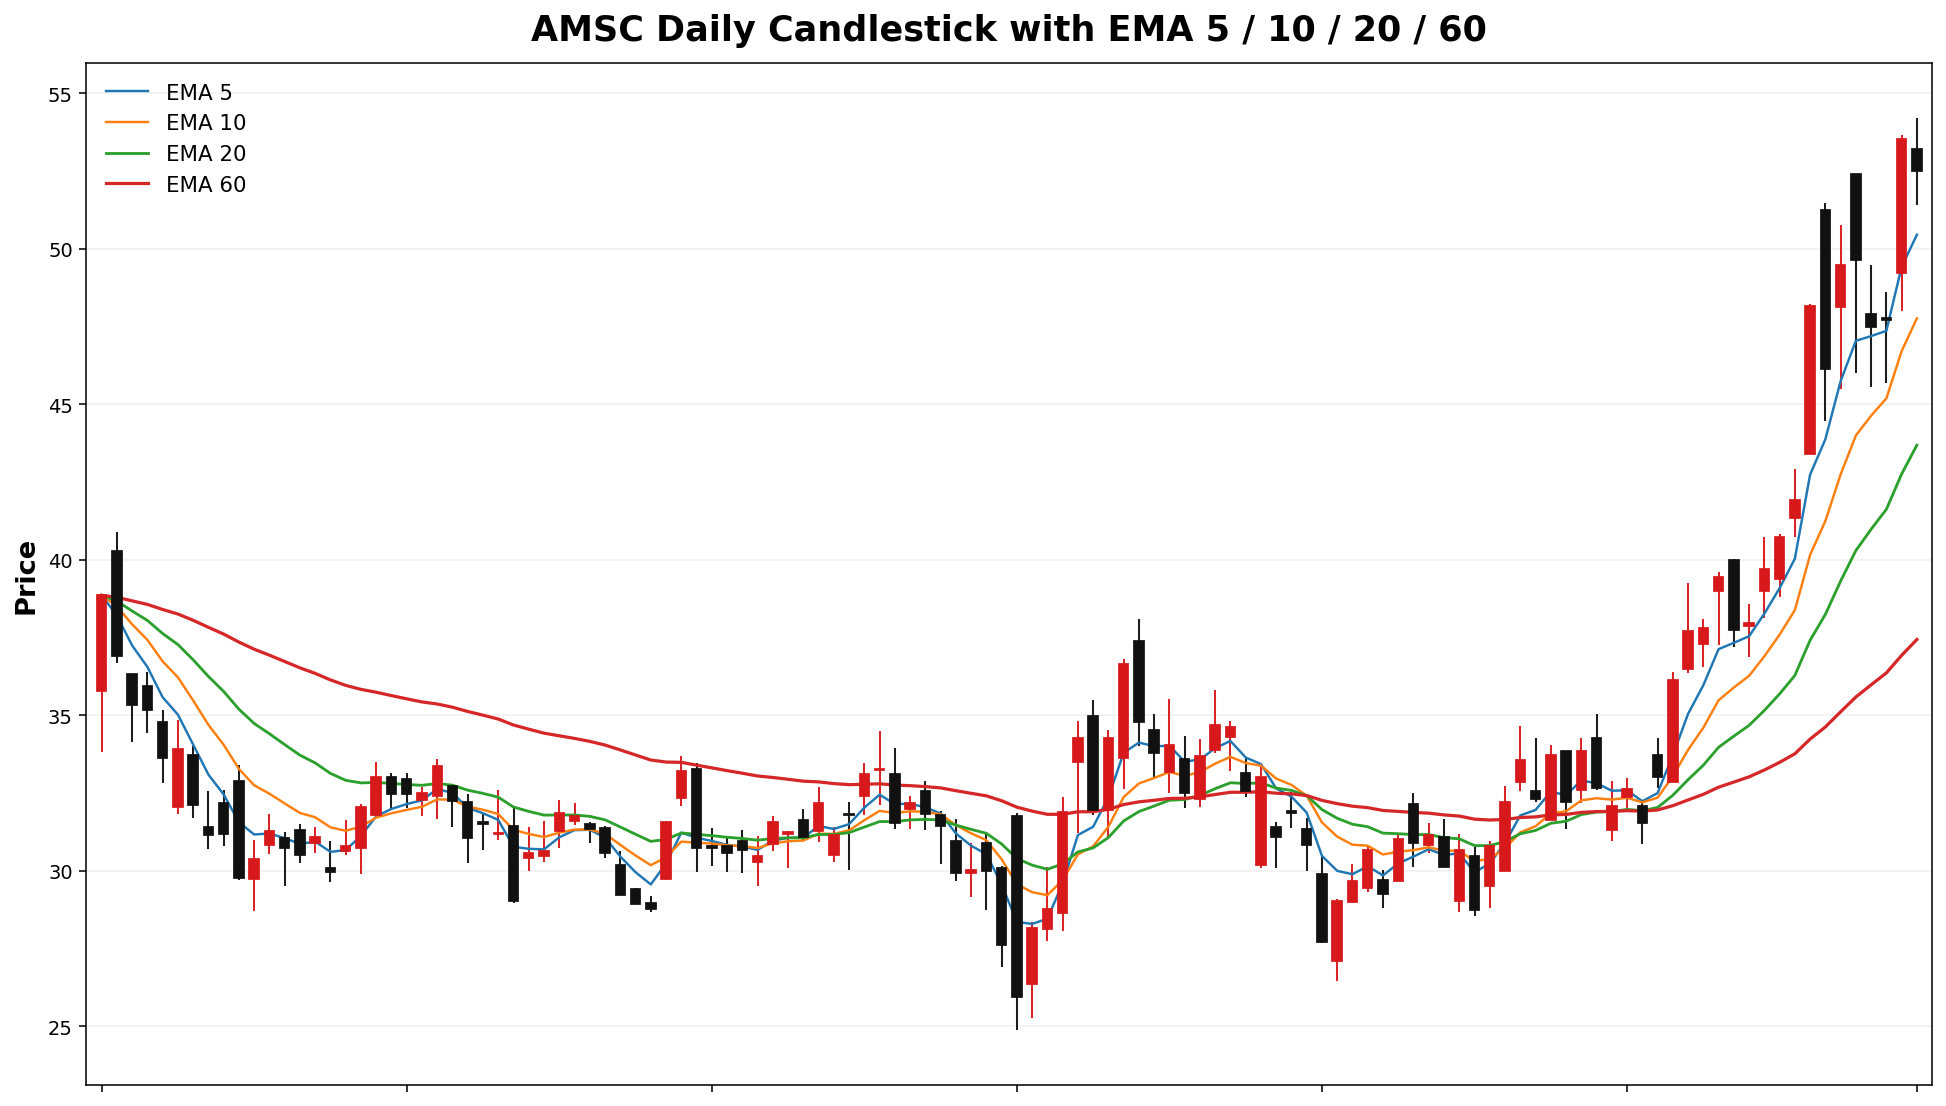
AMSC
Spot: 52.51
Report Time: 2026-05-03 08:49 AM MYT
Regime: TRANSITION
Dealer Gamma: LONG
Term Structure
| Expiry |
DTE |
Forward |
ATM IV |
ATM Straddle |
| 2026-05-15 |
13 |
52.67 |
89.02% |
8.75 |
| 2026-06-18 |
47 |
52.75 |
90.18% |
16.95 |
Weekly Range
| Confidence |
Low |
High |
Width |
| 68% |
46.02 |
59.00 |
12.98 |
| 80% |
44.19 |
60.83 |
16.64 |
| 90% |
41.83 |
63.19 |
21.36 |
| 95% |
39.79 |
65.23 |
25.45 |
Structure & Probabilities
| Support |
Resistance |
Gamma Flip |
Max Pain |
P>Res |
P<Sup |
| 50.00 |
55.00 |
NA |
42.00 |
32.8% |
27.3% |
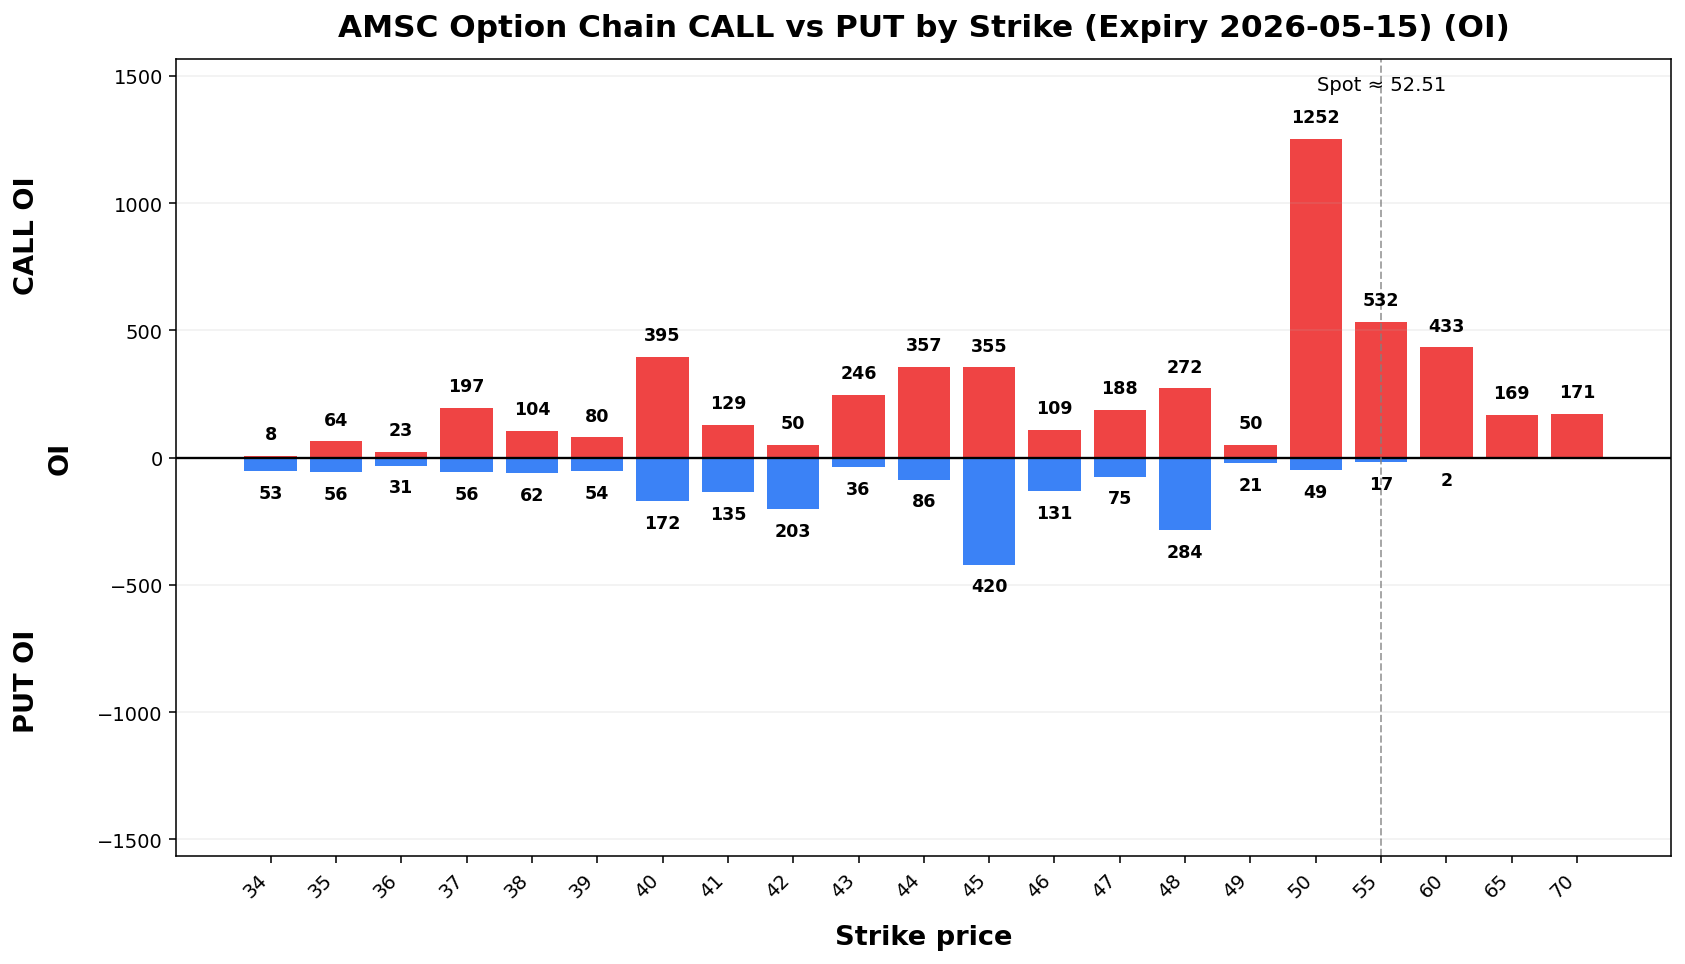
Flow & Skew
| Call Vol |
Put Vol |
Vol P/C |
Call OI |
Put OI |
OI P/C |
Skew |
Skew Bias |
| 739 |
212 |
0.29 |
5,371 |
2,131 |
0.40 |
-4.54 vol pts |
CALL_SKEW |
Tail Risk
| Q10 |
Q50 |
Q90 |
Down Tail |
Up Tail |
Down/Up |
| 38.78 |
50.04 |
62.68 |
13.73 |
10.17 |
1.35 |
Daily Technicals
| EMA20 |
EMA50 |
VWAP20 |
BB Lower |
BB Mid |
BB Upper |
BB Width |
Vol Ratio |
Path |
| 43.69 |
38.40 |
44.00 |
28.51 |
42.05 |
55.60 |
64.42% |
0.92 |
UP trend (expanding) |
Day Plan
- 50.00-55.00 range: fade extremes
- > 55.00: chase only if hold + vol
- < 50.00: risk expand; reduce size
- Regime: TRANSITION
- Tech: UP trend (expanding)
Swing Plan
- Accumulate: 50.00-50.00
- Trim: 55.00-55.00
- Add: close > 55.00
- Cut: close < 50.00
- Best for: transition regime
Raw Text Summary
📌 AMSC @ 52.51 (2026-05-03 08:49 AM MYT)

• Current price is **52.51**. Key support is around **50.00**, and resistance is around **55.00**.
• For the next week, the model’s **68% expected range** is roughly **46.02 to 59.00**.
• A wider **90% range** is about **41.83 to 63.19**.
• Dealer positioning looks **LONG gamma**, so the market behavior is classified as **TRANSITION**.
• Approximate breakout odds: **above resistance 32.8%**, **below support 27.3%** by the target horizon.
• Options skew is tilted toward **calls**, which suggests upside speculation is relatively stronger.
• Near-term implied volatility is lower than the next expiry (**IV1 89.02% vs IV2 90.18%**), which suggests a **contango / calmer front expiry** setup.
• On the daily chart, the stock currently looks like **UP trend (expanding)**.
• The implied distribution shows **heavier downside tail risk** than upside tail potential.
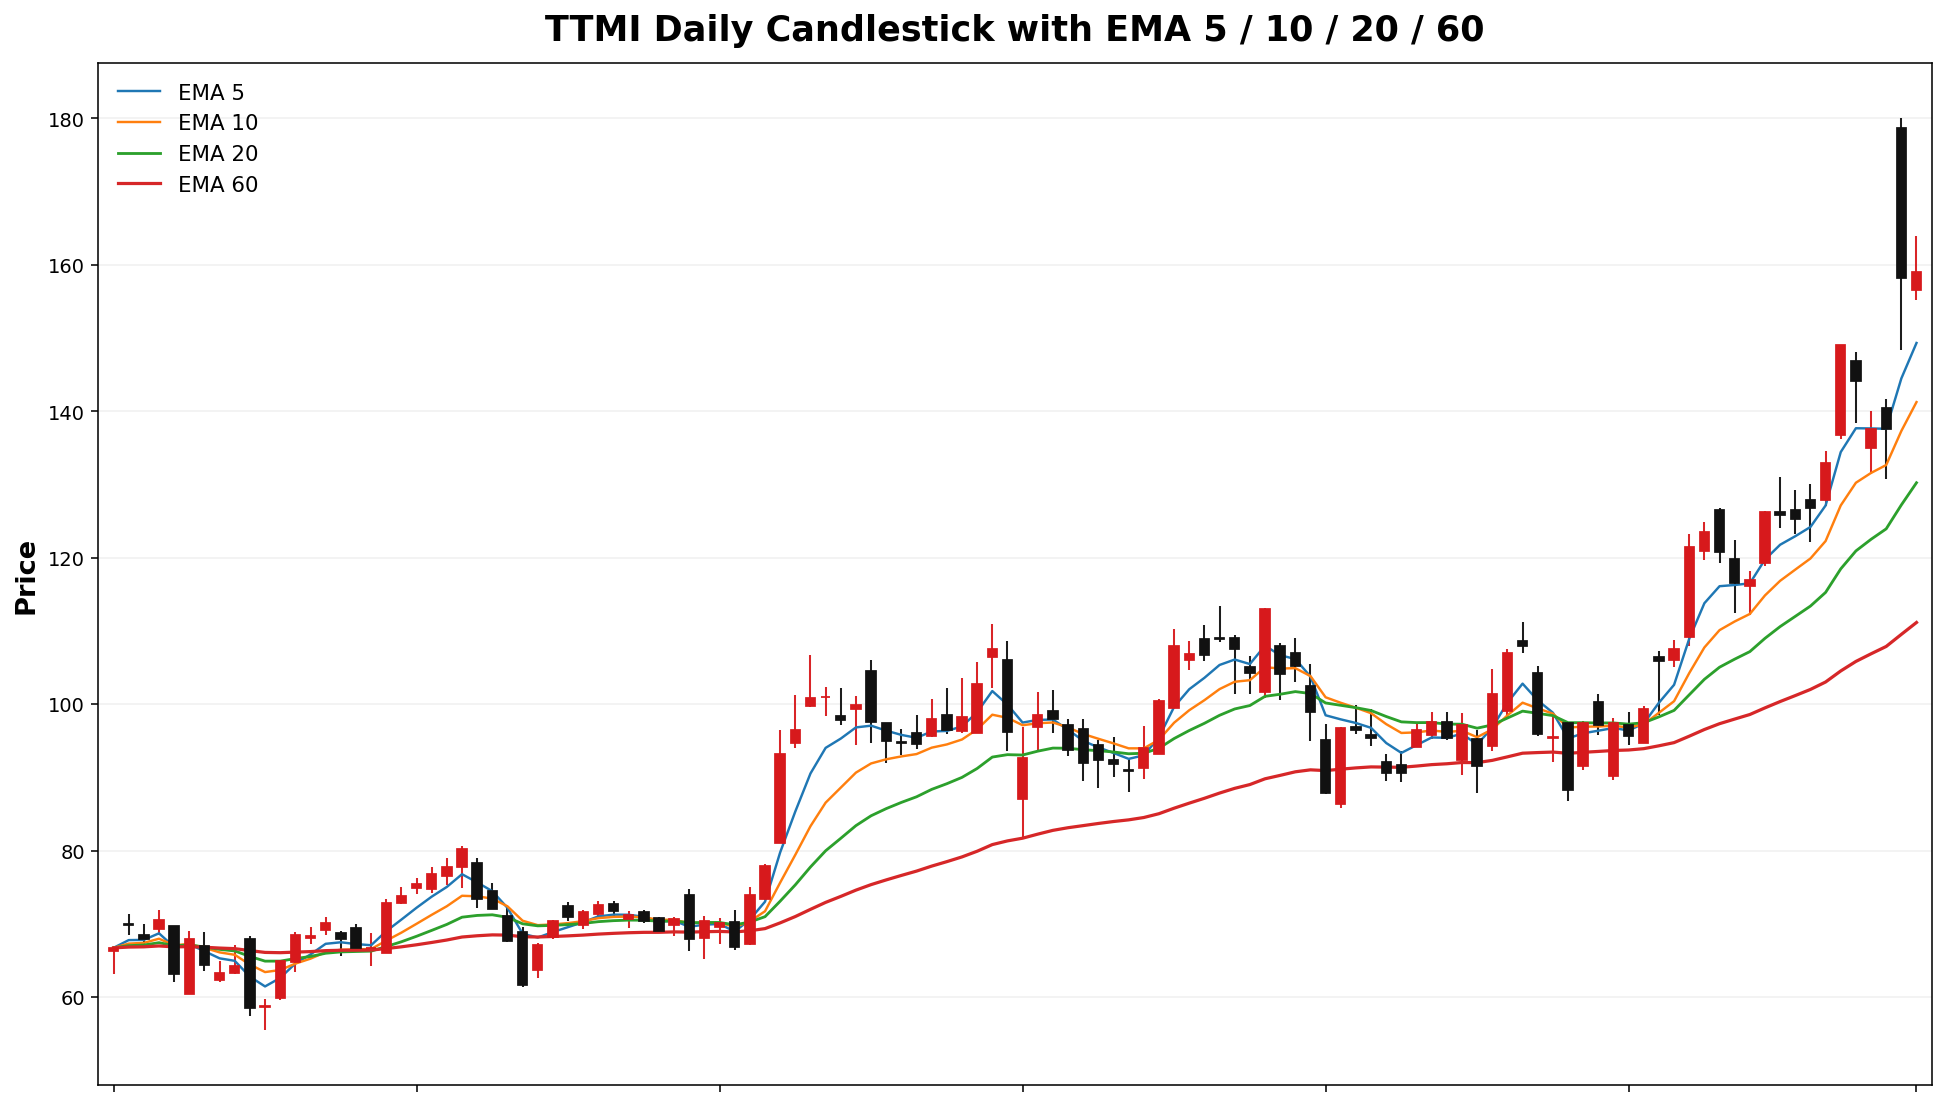
TTMI
Spot: 158.99
Report Time: 2026-05-03 08:49 AM MYT
Regime: TRANSITION
Dealer Gamma: LONG
Term Structure
| Expiry |
DTE |
Forward |
ATM IV |
ATM Straddle |
| 2026-05-15 |
13 |
159.12 |
68.54% |
20.40 |
| 2026-06-18 |
47 |
159.39 |
63.87% |
36.35 |
Weekly Range
| Confidence |
Low |
High |
Width |
| 68% |
142.61 |
175.37 |
32.76 |
| 80% |
138.00 |
179.98 |
41.99 |
| 90% |
132.05 |
185.93 |
53.89 |
| 95% |
126.88 |
191.10 |
64.21 |
Structure & Probabilities
| Support |
Resistance |
Gamma Flip |
Max Pain |
P>Res |
P<Sup |
| 150.00 |
160.00 |
130.61 |
130.00 |
42.4% |
26.0% |
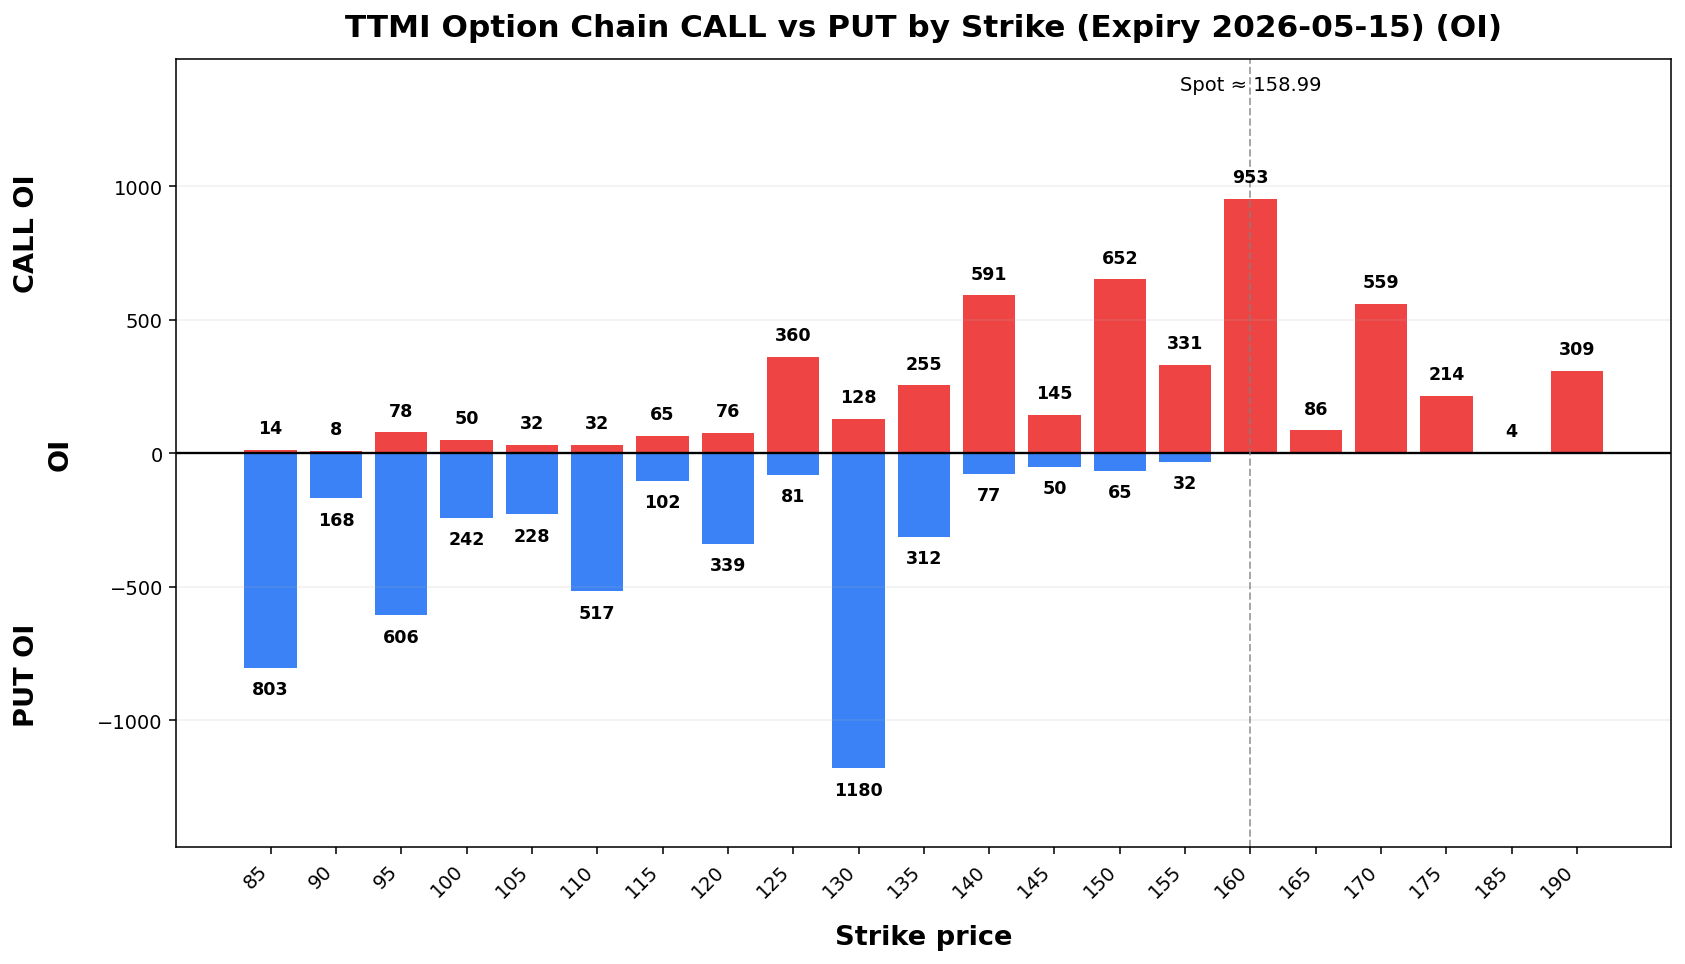
Flow & Skew
| Call Vol |
Put Vol |
Vol P/C |
Call OI |
Put OI |
OI P/C |
Skew |
Skew Bias |
| 558 |
1,021 |
1.83 |
4,948 |
8,861 |
1.79 |
-0.61 vol pts |
FLAT |
Tail Risk
| Q10 |
Q50 |
Q90 |
Down Tail |
Up Tail |
Down/Up |
| 127.50 |
156.56 |
183.73 |
31.49 |
24.74 |
1.27 |
Daily Technicals
| EMA20 |
EMA50 |
VWAP20 |
BB Lower |
BB Mid |
BB Upper |
BB Width |
Vol Ratio |
Path |
| 130.22 |
114.32 |
132.16 |
91.26 |
126.50 |
161.75 |
55.72% |
1.25 |
UP trend (expanding) |
Day Plan
- 150.00-160.00 range: fade extremes
- > 160.00: chase only if hold + vol
- < 150.00: risk expand; reduce size
- Regime: TRANSITION
- Tech: UP trend (expanding)
Swing Plan
- Accumulate: 150.00-150.00
- Trim: 160.00-160.00
- Add: close > 160.00
- Cut: close < 150.00
- Best for: transition regime
Raw Text Summary
📌 TTMI @ 158.99 (2026-05-03 08:49 AM MYT)

• Current price is **158.99**. Key support is around **150.00**, and resistance is around **160.00**.
• For the next week, the model’s **68% expected range** is roughly **142.61 to 175.37**.
• A wider **90% range** is about **132.05 to 185.93**.
• Dealer positioning looks **LONG gamma**, so the market behavior is classified as **TRANSITION**.
• The estimated **gamma flip** is near **130.61**. Crossing and holding beyond this area can change the trading behavior.
• Approximate breakout odds: **above resistance 42.4%**, **below support 26.0%** by the target horizon.
• Options skew is fairly balanced, so there is **no strong directional bias** from skew alone.
• Near-term implied volatility is higher than the next expiry (**IV1 68.54% vs IV2 63.87%**), which suggests **near-term event stress / backwardation**.
• On the daily chart, the stock currently looks like **UP trend (expanding)**.
• The implied distribution shows **heavier downside tail risk** than upside tail potential.
RDDT
Spot: 166.48
Report Time: 2026-05-03 08:49 AM MYT
Regime: TREND
Dealer Gamma: SHORT
Term Structure
| Expiry |
DTE |
Forward |
ATM IV |
ATM Straddle |
| 2026-05-08 |
6 |
166.63 |
61.85% |
12.98 |
| 2026-05-15 |
13 |
166.83 |
56.88% |
17.73 |
Weekly Range
| Confidence |
Low |
High |
Width |
| 68% |
152.39 |
180.57 |
28.18 |
| 80% |
148.42 |
184.54 |
36.11 |
| 90% |
143.30 |
189.66 |
46.35 |
| 95% |
138.87 |
194.09 |
55.23 |
Structure & Probabilities
| Support |
Resistance |
Gamma Flip |
Max Pain |
P>Res |
P<Sup |
| 165.00 |
170.00 |
140.77 |
150.00 |
54.3% |
62.0% |
Flow & Skew
| Call Vol |
Put Vol |
Vol P/C |
Call OI |
Put OI |
OI P/C |
Skew |
Skew Bias |
| 32,351 |
11,445 |
0.35 |
10,340 |
4,957 |
0.48 |
-1.54 vol pts |
CALL_SKEW |
Tail Risk
| Q10 |
Q50 |
Q90 |
Down Tail |
Up Tail |
Down/Up |
| 149.81 |
167.08 |
186.36 |
16.67 |
19.88 |
0.84 |
Daily Technicals
| EMA20 |
EMA50 |
VWAP20 |
BB Lower |
BB Mid |
BB Upper |
BB Width |
Vol Ratio |
Path |
| 152.34 |
153.71 |
153.84 |
133.87 |
152.80 |
171.74 |
24.78% |
3.11 |
Sideways / Range |
Day Plan
- 165.00-170.00 range: fade extremes
- > 170.00: chase only if hold + vol
- < 165.00: risk expand; reduce size
- Regime: TREND
- Tech: Sideways / Range
Swing Plan
- Accumulate: 165.00-165.00
- Trim: 170.00-170.00
- Add: close > 170.00
- Cut: close < 165.00
- Best for: trend regime
- Bias: downside break risk elevated
Raw Text Summary
📌 RDDT @ 166.48 (2026-05-03 08:49 AM MYT)
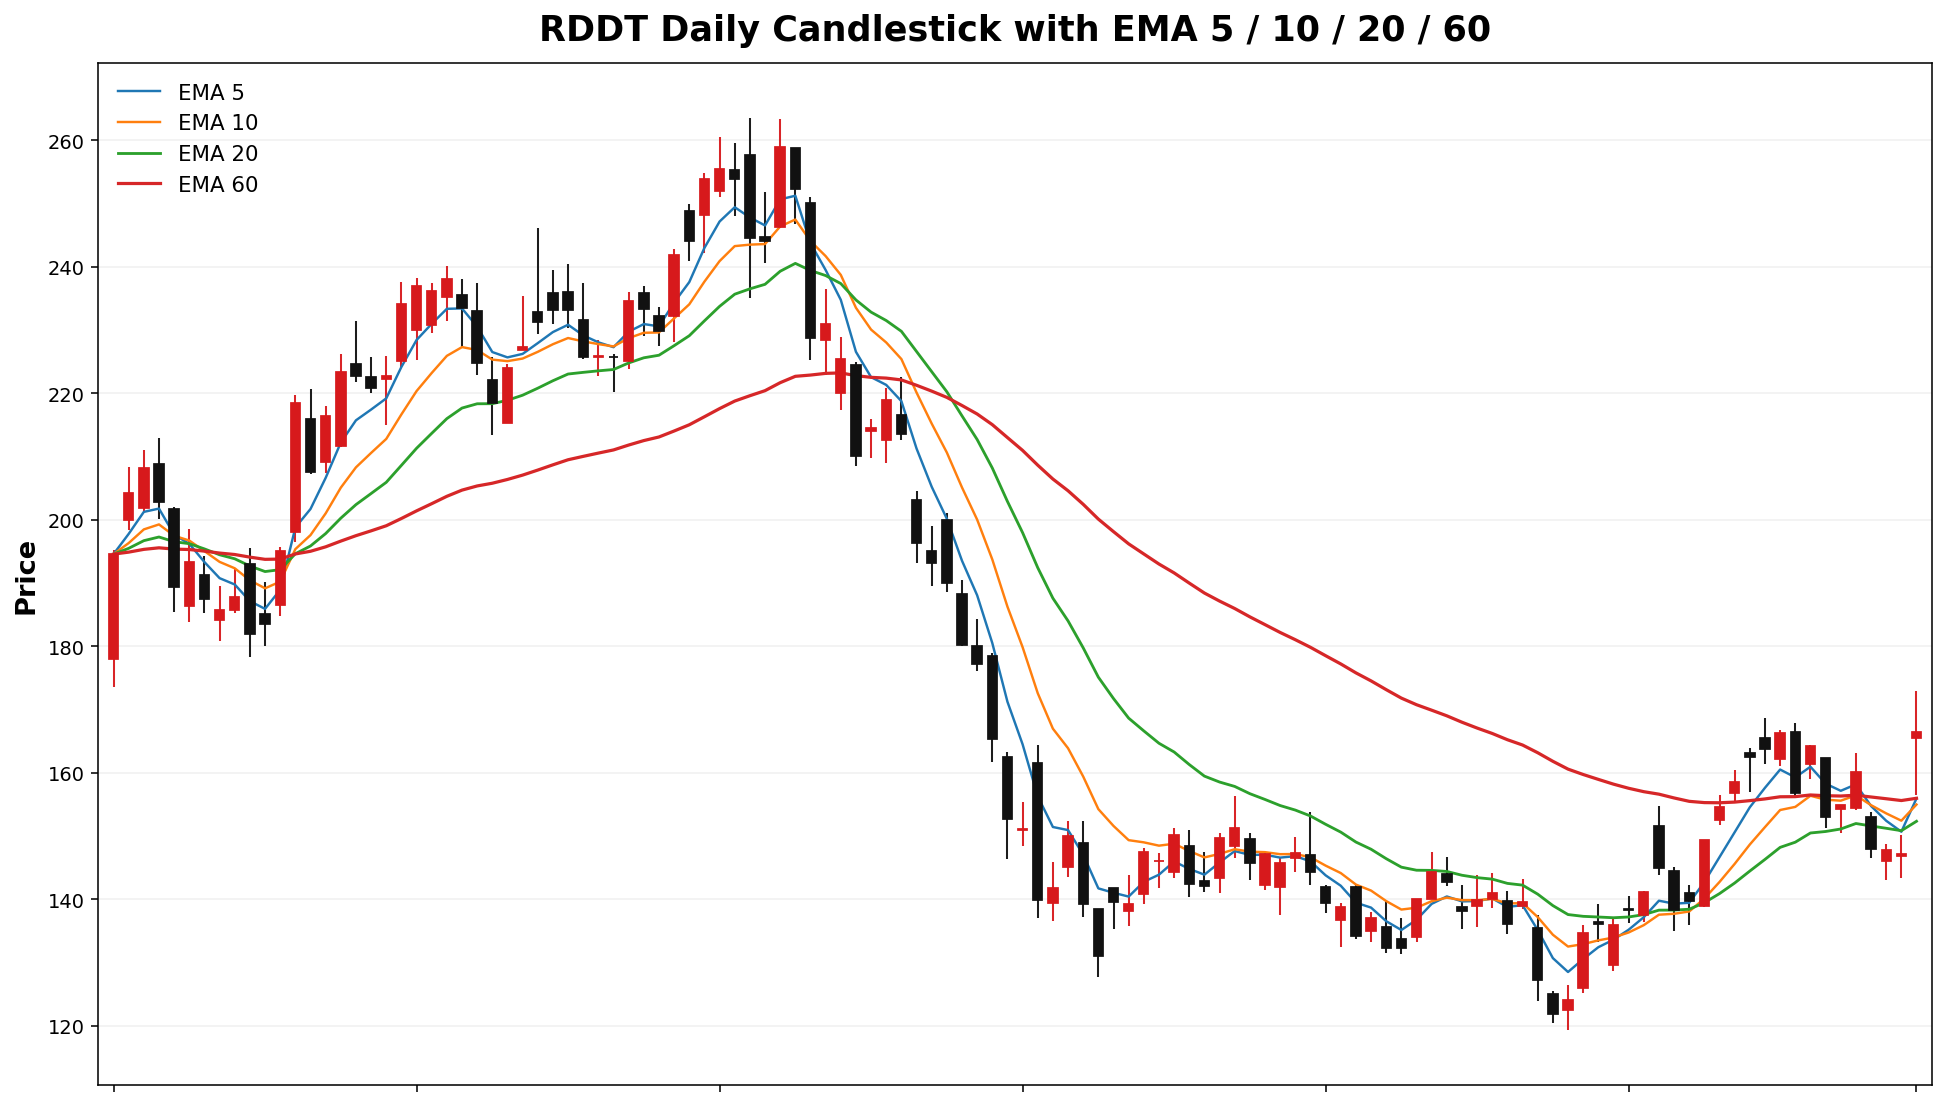
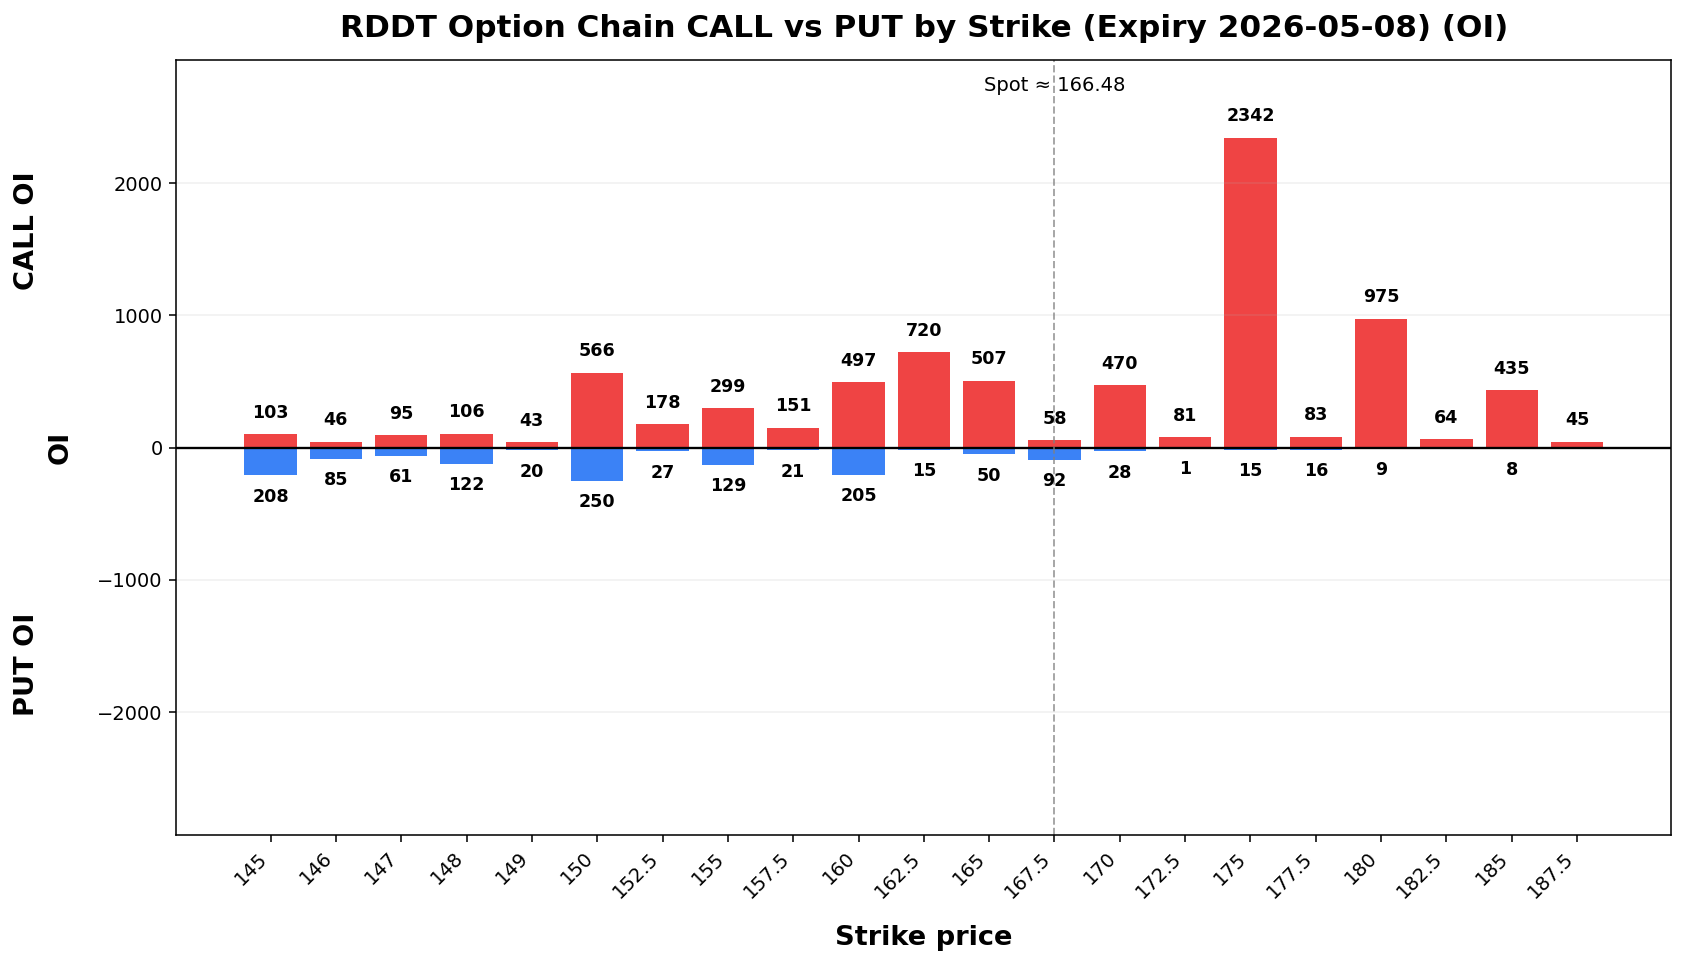
• Current price is **166.48**. Key support is around **165.00**, and resistance is around **170.00**.
• For the next week, the model’s **68% expected range** is roughly **152.39 to 180.57**.
• A wider **90% range** is about **143.30 to 189.66**.
• Dealer positioning looks **SHORT gamma**, so the market behavior is classified as **TREND**.
• The estimated **gamma flip** is near **140.77**. Crossing and holding beyond this area can change the trading behavior.
• Approximate breakout odds: **above resistance 54.3%**, **below support 62.0%** by the target horizon.
• Options skew is fairly balanced, so there is **no strong directional bias** from skew alone.
• Near-term implied volatility is higher than the next expiry (**IV1 61.85% vs IV2 56.88%**), which suggests **near-term event stress / backwardation**.
• Recent volume is **3.11x** the 20-day average, which supports stronger continuation or breakout follow-through.
• On the daily chart, the stock currently looks like **Sideways / Range**.
• The implied distribution shows **more upside tail potential** than downside tail risk.
FSLY
Spot: 28.07
Report Time: 2026-05-03 08:49 AM MYT
Regime: TRANSITION
Dealer Gamma: LONG
Term Structure
| Expiry |
DTE |
Forward |
ATM IV |
ATM Straddle |
| 2026-05-08 |
6 |
28.20 |
166.10% |
5.88 |
| 2026-05-15 |
13 |
28.06 |
133.22% |
7.00 |
Weekly Range
| Confidence |
Low |
High |
Width |
| 68% |
21.95 |
34.19 |
12.25 |
| 80% |
20.22 |
35.92 |
15.70 |
| 90% |
18.00 |
38.14 |
20.15 |
| 95% |
16.07 |
40.07 |
24.01 |
Structure & Probabilities
| Support |
Resistance |
Gamma Flip |
Max Pain |
P>Res |
P<Sup |
| 27.00 |
30.00 |
22.11 |
25.00 |
28.7% |
39.3% |
Flow & Skew
| Call Vol |
Put Vol |
Vol P/C |
Call OI |
Put OI |
OI P/C |
Skew |
Skew Bias |
| 8,867 |
1,205 |
0.14 |
7,361 |
5,521 |
0.75 |
3.71 vol pts |
PUT_SKEW |
Tail Risk
| Q10 |
Q50 |
Q90 |
Down Tail |
Up Tail |
Down/Up |
| 19.77 |
25.91 |
36.55 |
8.30 |
8.48 |
0.98 |
Daily Technicals
| EMA20 |
EMA50 |
VWAP20 |
BB Lower |
BB Mid |
BB Upper |
BB Width |
Vol Ratio |
Path |
| 25.85 |
23.72 |
26.14 |
19.96 |
26.13 |
32.29 |
47.19% |
0.72 |
UP trend (expanding) |
Day Plan
- 27.00-30.00 range: fade extremes
- > 30.00: chase only if hold + vol
- < 27.00: risk expand; reduce size
- Regime: TRANSITION
- Tech: UP trend (expanding)
Swing Plan
- Accumulate: 27.00-27.00
- Trim: 30.00-30.00
- Add: close > 30.00
- Cut: close < 27.00
- Best for: transition regime
Raw Text Summary
📌 FSLY @ 28.07 (2026-05-03 08:49 AM MYT)
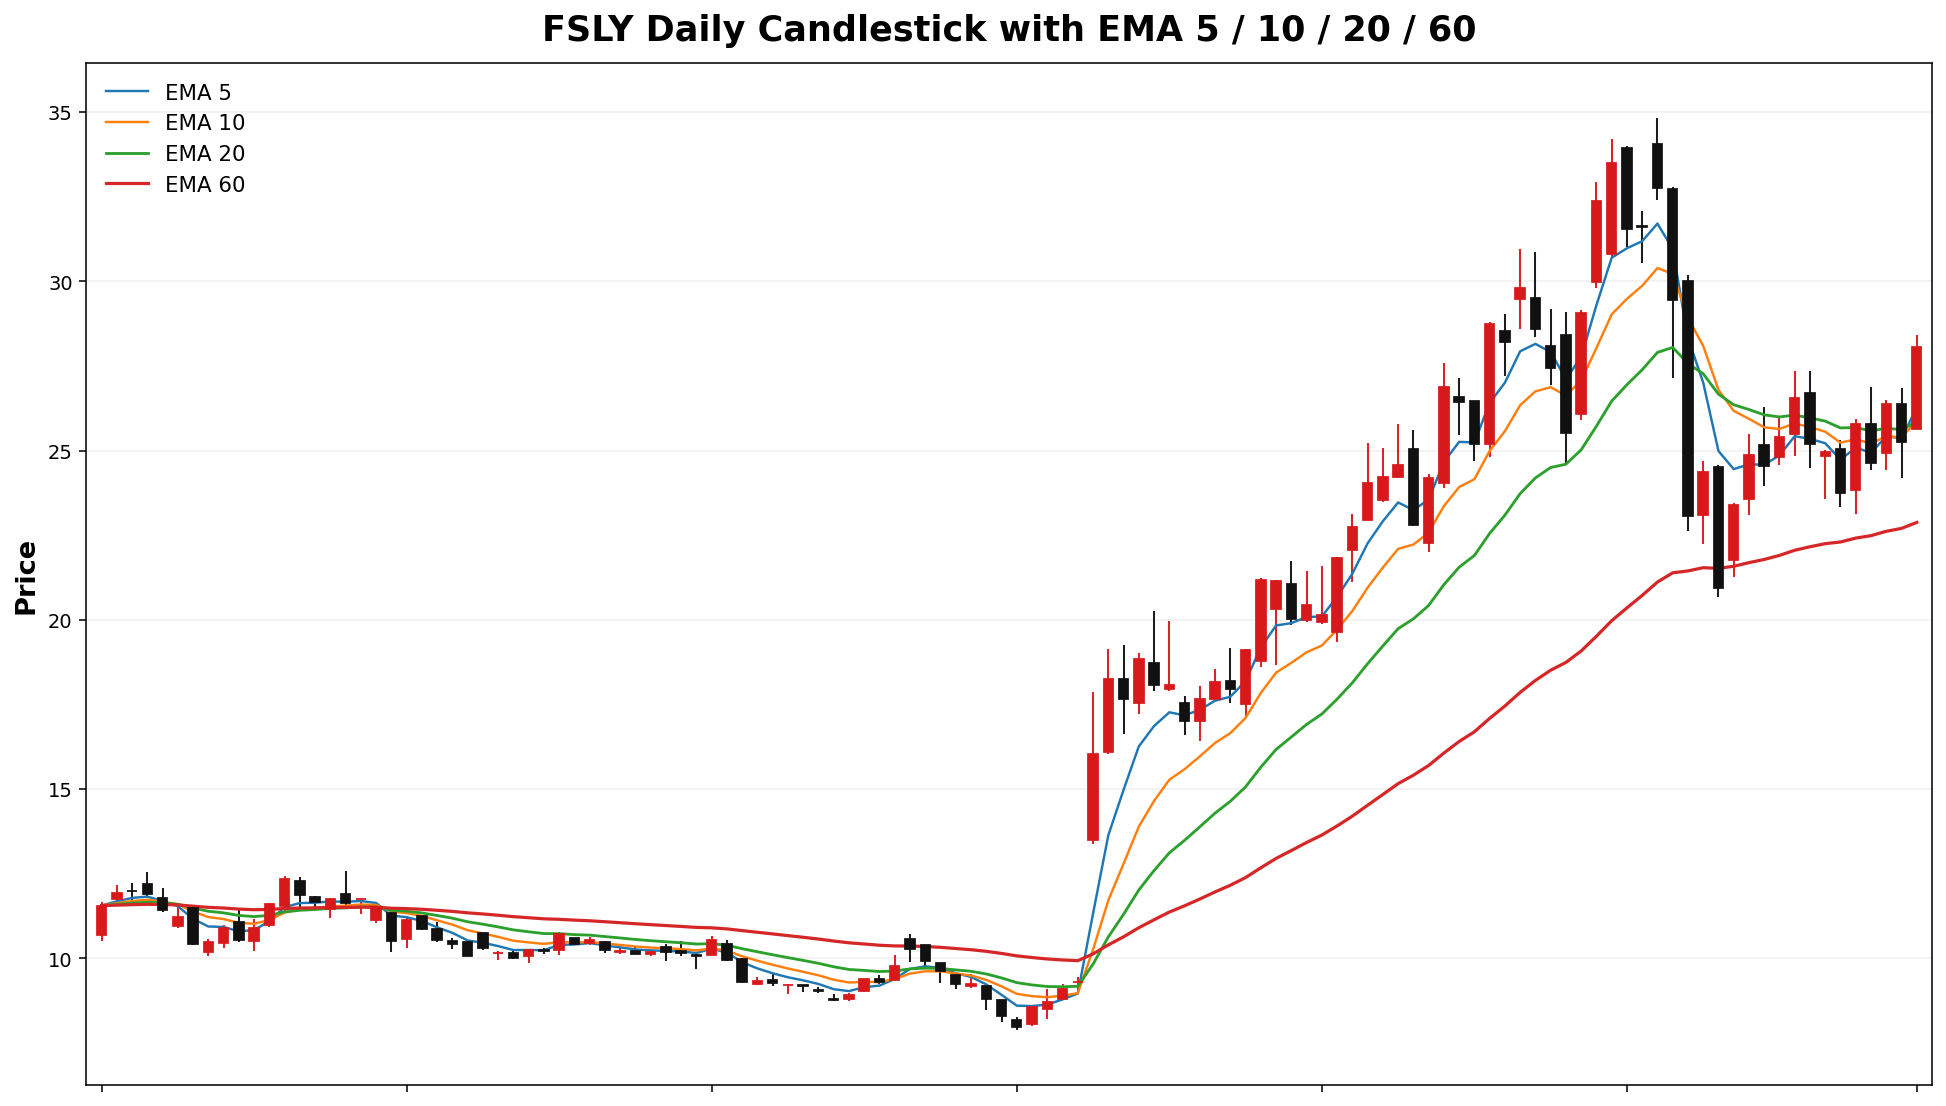
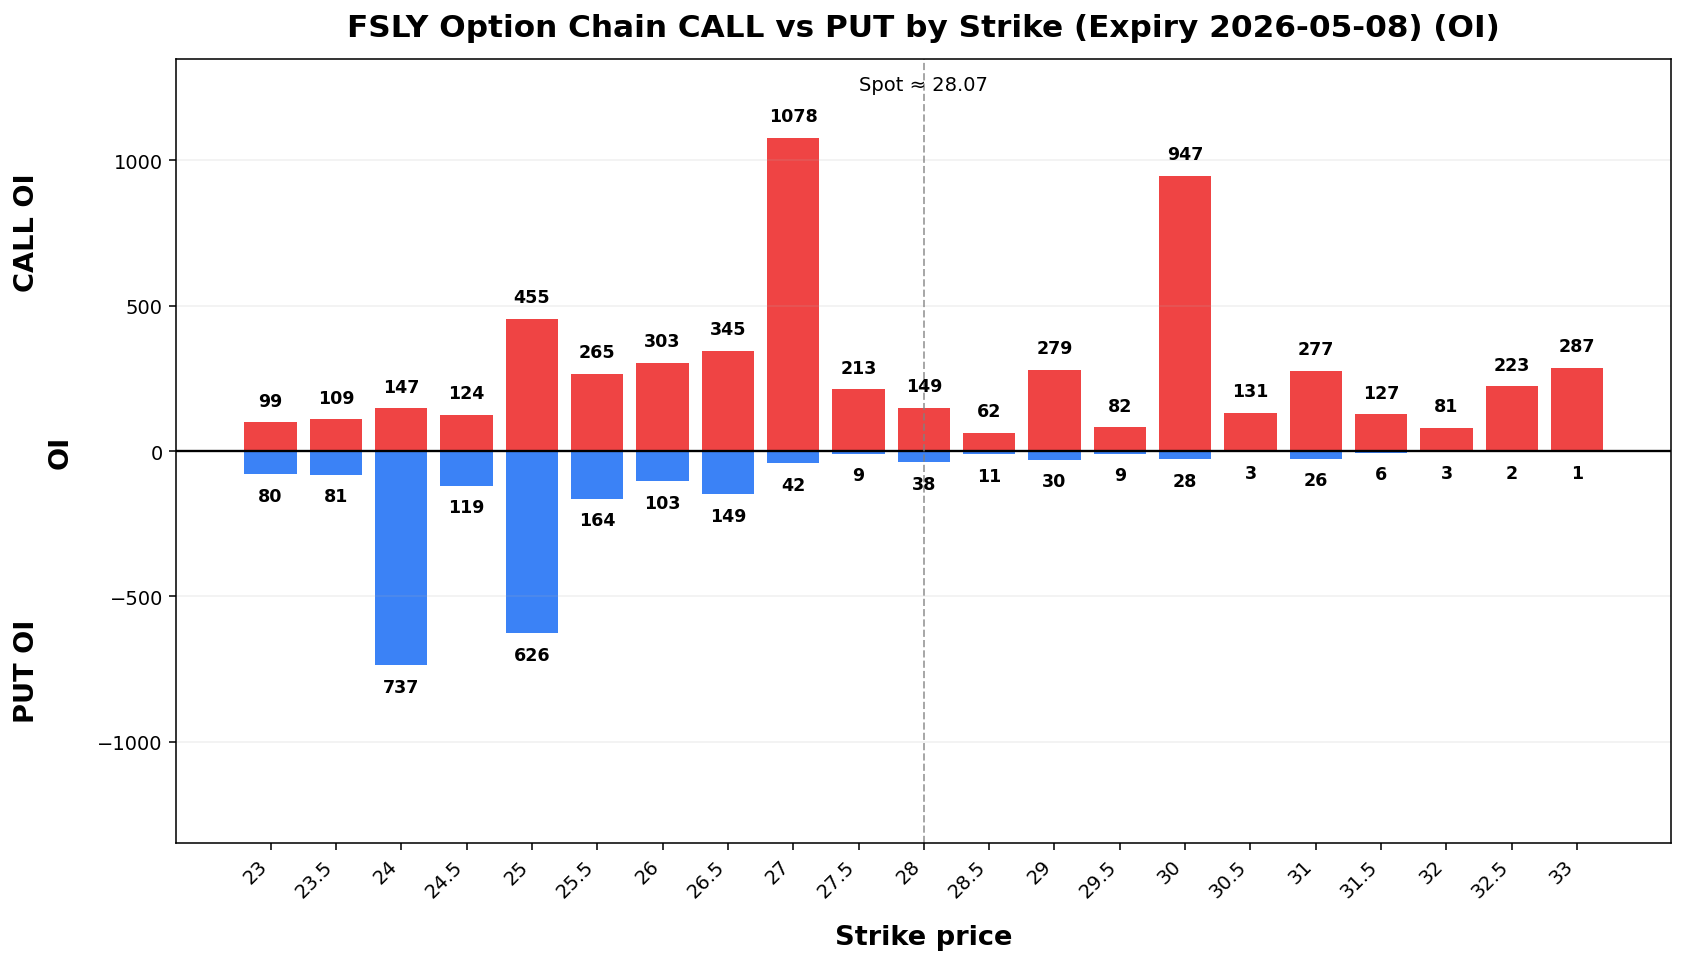
• Current price is **28.07**. Key support is around **27.00**, and resistance is around **30.00**.
• For the next week, the model’s **68% expected range** is roughly **21.95 to 34.19**.
• A wider **90% range** is about **18.00 to 38.14**.
• Dealer positioning looks **LONG gamma**, so the market behavior is classified as **TRANSITION**.
• The estimated **gamma flip** is near **22.11**. Crossing and holding beyond this area can change the trading behavior.
• Approximate breakout odds: **above resistance 28.7%**, **below support 39.3%** by the target horizon.
• Options skew is tilted toward **puts**, which suggests traders are paying more for downside protection.
• Near-term implied volatility is higher than the next expiry (**IV1 166.10% vs IV2 133.22%**), which suggests **near-term event stress / backwardation**.
• Recent volume is only **0.72x** the 20-day average, so breakouts may be less reliable unless volume improves.
• On the daily chart, the stock currently looks like **UP trend (expanding)**.
• The implied distribution is **fairly balanced** between upside and downside tails.
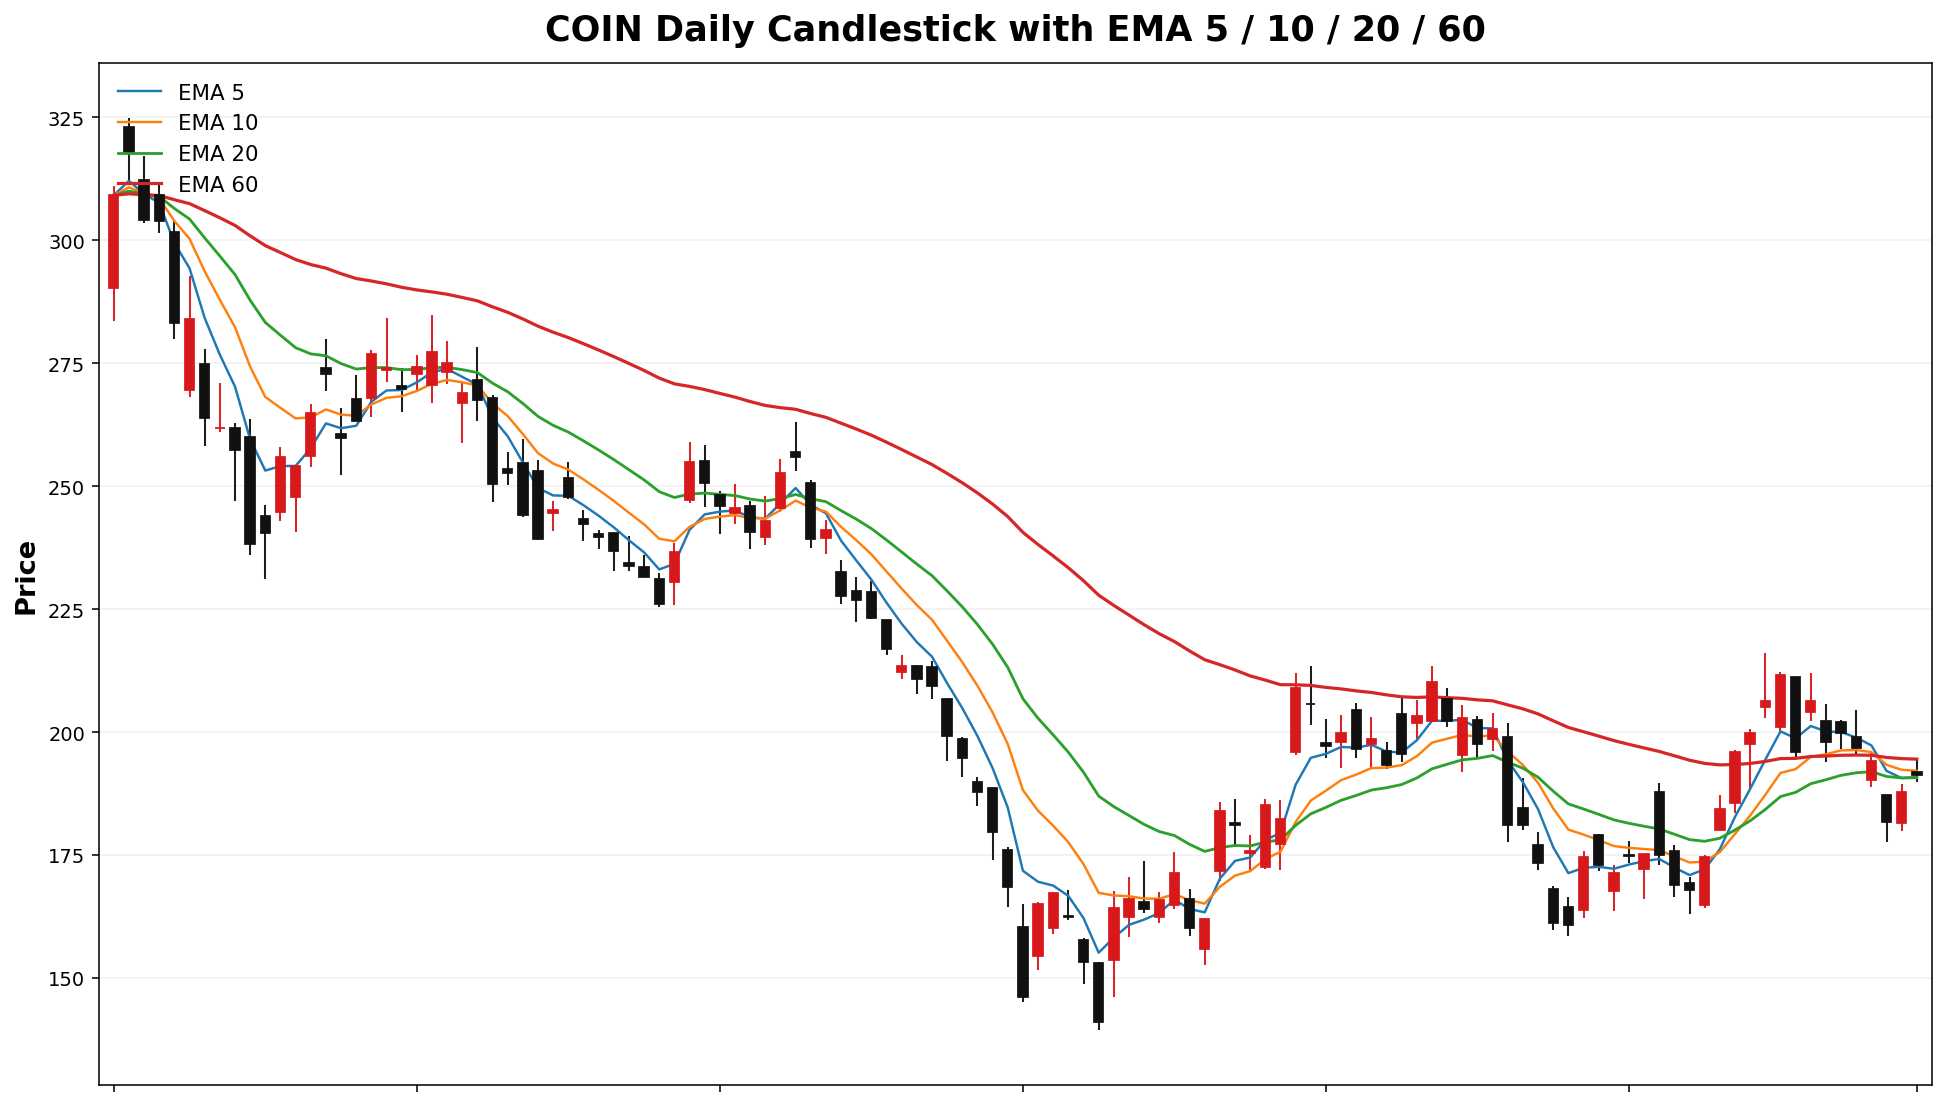
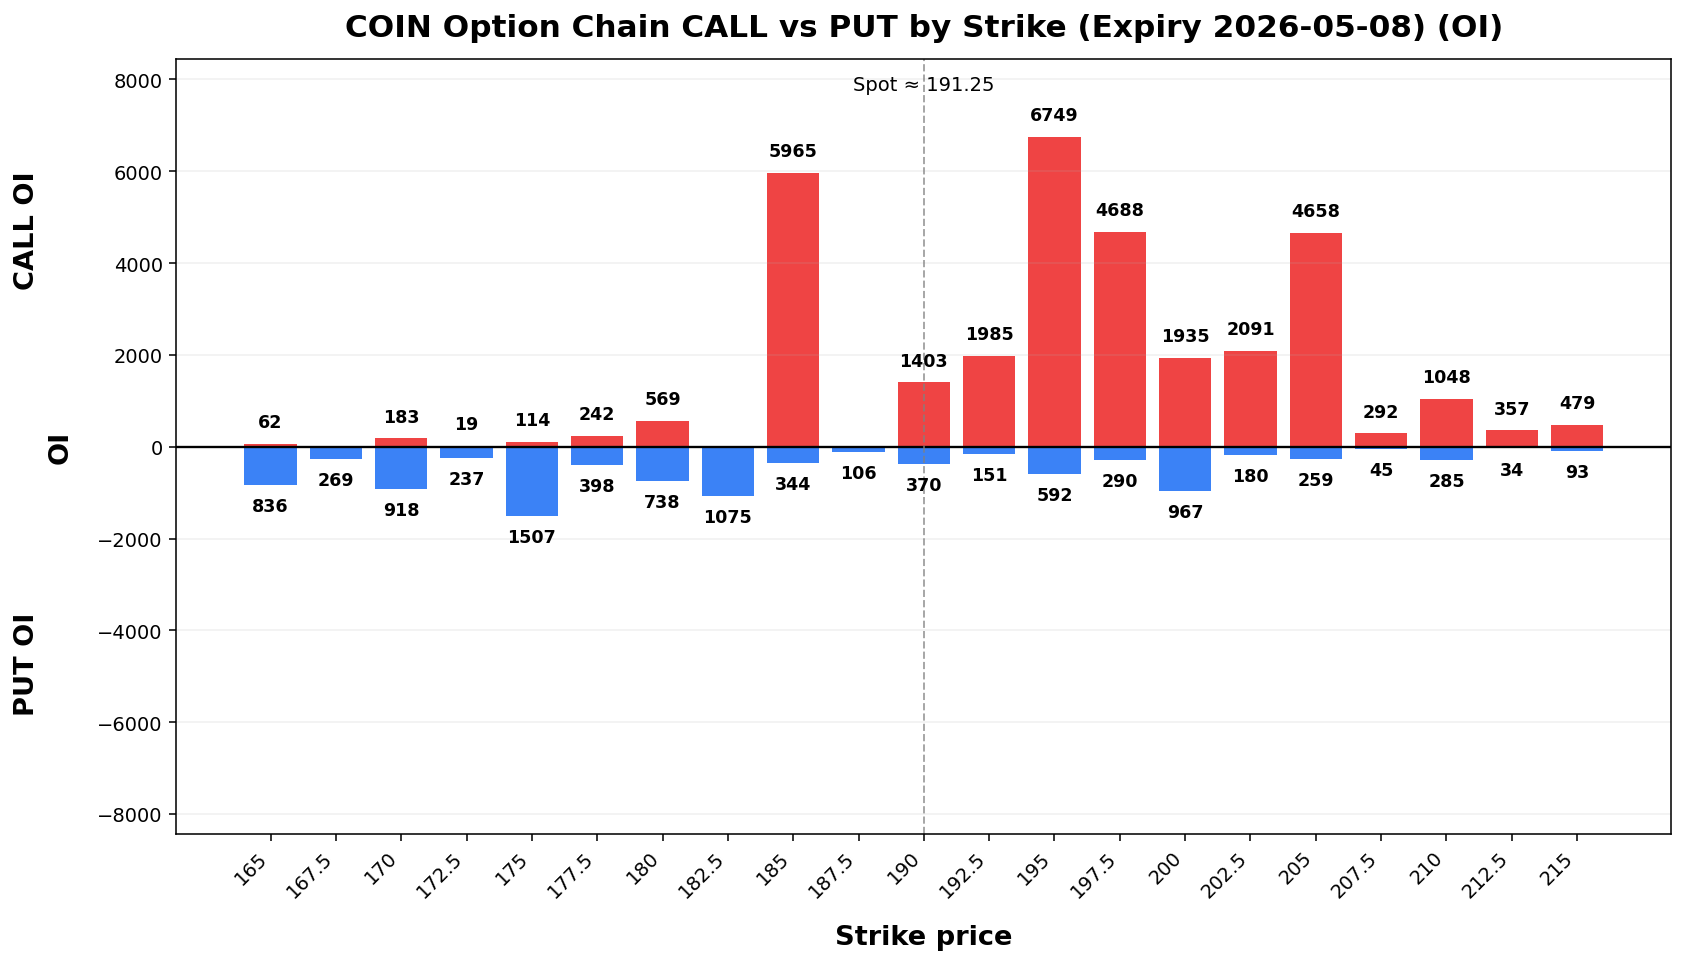
COIN
Spot: 191.25
Report Time: 2026-05-03 08:49 AM MYT
Regime: TRANSITION
Dealer Gamma: LONG
Term Structure
| Expiry |
DTE |
Forward |
ATM IV |
ATM Straddle |
| 2026-05-08 |
6 |
191.37 |
75.63% |
18.23 |
| 2026-05-15 |
13 |
191.47 |
65.57% |
23.48 |
Weekly Range
| Confidence |
Low |
High |
Width |
| 68% |
171.82 |
210.68 |
38.86 |
| 80% |
166.35 |
216.15 |
49.80 |
| 90% |
159.29 |
223.21 |
63.91 |
| 95% |
153.17 |
229.33 |
76.16 |
Structure & Probabilities
| Support |
Resistance |
Gamma Flip |
Max Pain |
P>Res |
P<Sup |
| 185.00 |
192.50 |
157.23 |
185.00 |
43.3% |
28.5% |
Flow & Skew
| Call Vol |
Put Vol |
Vol P/C |
Call OI |
Put OI |
OI P/C |
Skew |
Skew Bias |
| 23,273 |
8,494 |
0.36 |
49,281 |
18,332 |
0.37 |
-2.64 vol pts |
CALL_SKEW |
Tail Risk
| Q10 |
Q50 |
Q90 |
Down Tail |
Up Tail |
Down/Up |
| 160.40 |
189.51 |
219.60 |
30.85 |
28.35 |
1.09 |
Daily Technicals
| EMA20 |
EMA50 |
VWAP20 |
BB Lower |
BB Mid |
BB Upper |
BB Width |
Vol Ratio |
Path |
| 190.74 |
192.19 |
190.47 |
162.84 |
189.30 |
215.75 |
27.95% |
0.69 |
DOWN trend (expanding) |
Day Plan
- 185.00-192.50 range: fade extremes
- > 192.50: chase only if hold + vol
- < 185.00: risk expand; reduce size
- Regime: TRANSITION
- Tech: DOWN trend (expanding)
Swing Plan
- Accumulate: 185.00-185.00
- Trim: 192.50-192.50
- Add: close > 192.50
- Cut: close < 185.00
- Best for: transition regime
Raw Text Summary
📌 COIN @ 191.25 (2026-05-03 08:49 AM MYT)

• Current price is **191.25**. Key support is around **185.00**, and resistance is around **192.50**.
• For the next week, the model’s **68% expected range** is roughly **171.82 to 210.68**.
• A wider **90% range** is about **159.29 to 223.21**.
• Dealer positioning looks **LONG gamma**, so the market behavior is classified as **TRANSITION**.
• The estimated **gamma flip** is near **157.23**. Crossing and holding beyond this area can change the trading behavior.
• Approximate breakout odds: **above resistance 43.3%**, **below support 28.5%** by the target horizon.
• Options skew is tilted toward **calls**, which suggests upside speculation is relatively stronger.
• Near-term implied volatility is higher than the next expiry (**IV1 75.63% vs IV2 65.57%**), which suggests **near-term event stress / backwardation**.
• Recent volume is only **0.69x** the 20-day average, so breakouts may be less reliable unless volume improves.
• On the daily chart, the stock currently looks like **DOWN trend (expanding)**.
• The implied distribution is **fairly balanced** between upside and downside tails.
SYM
Spot: 58.89
Report Time: 2026-05-03 08:49 AM MYT
Regime: TRANSITION
Dealer Gamma: LONG
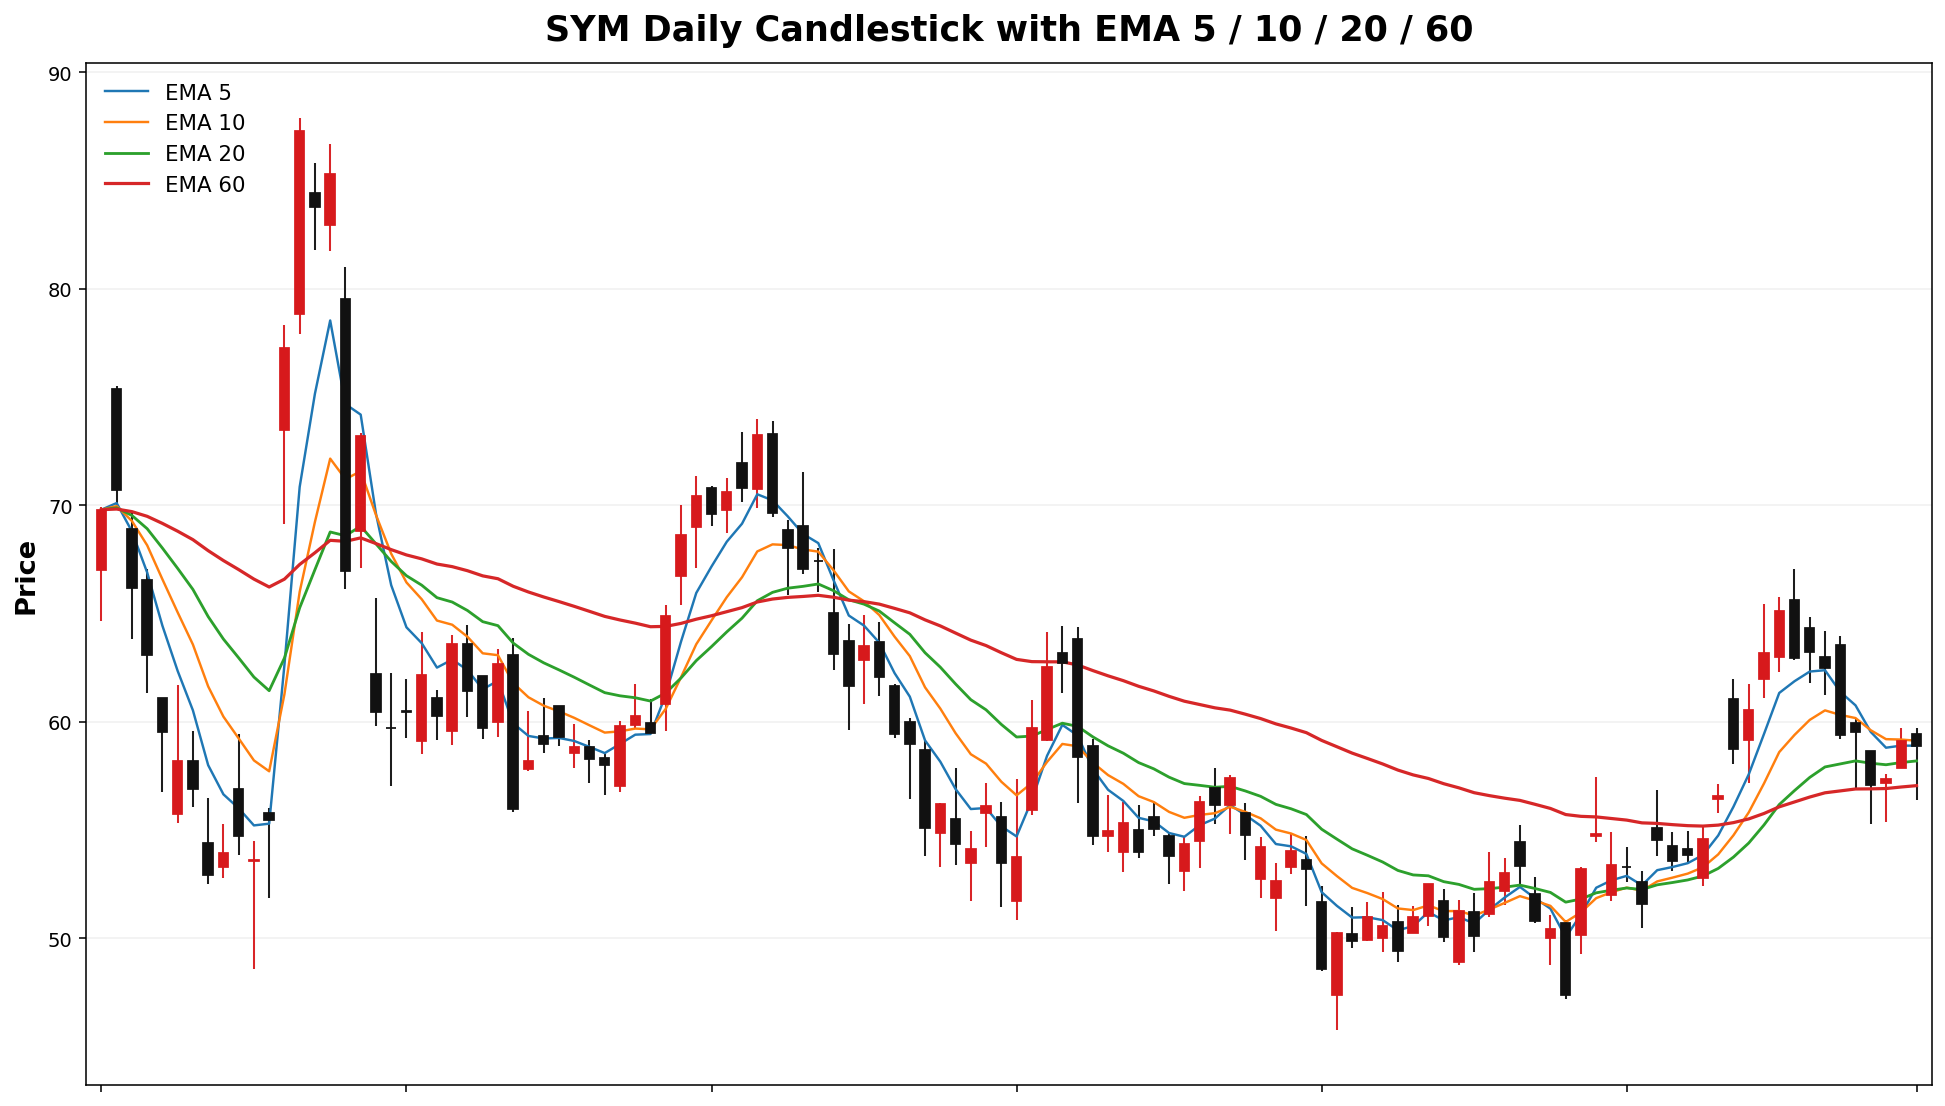
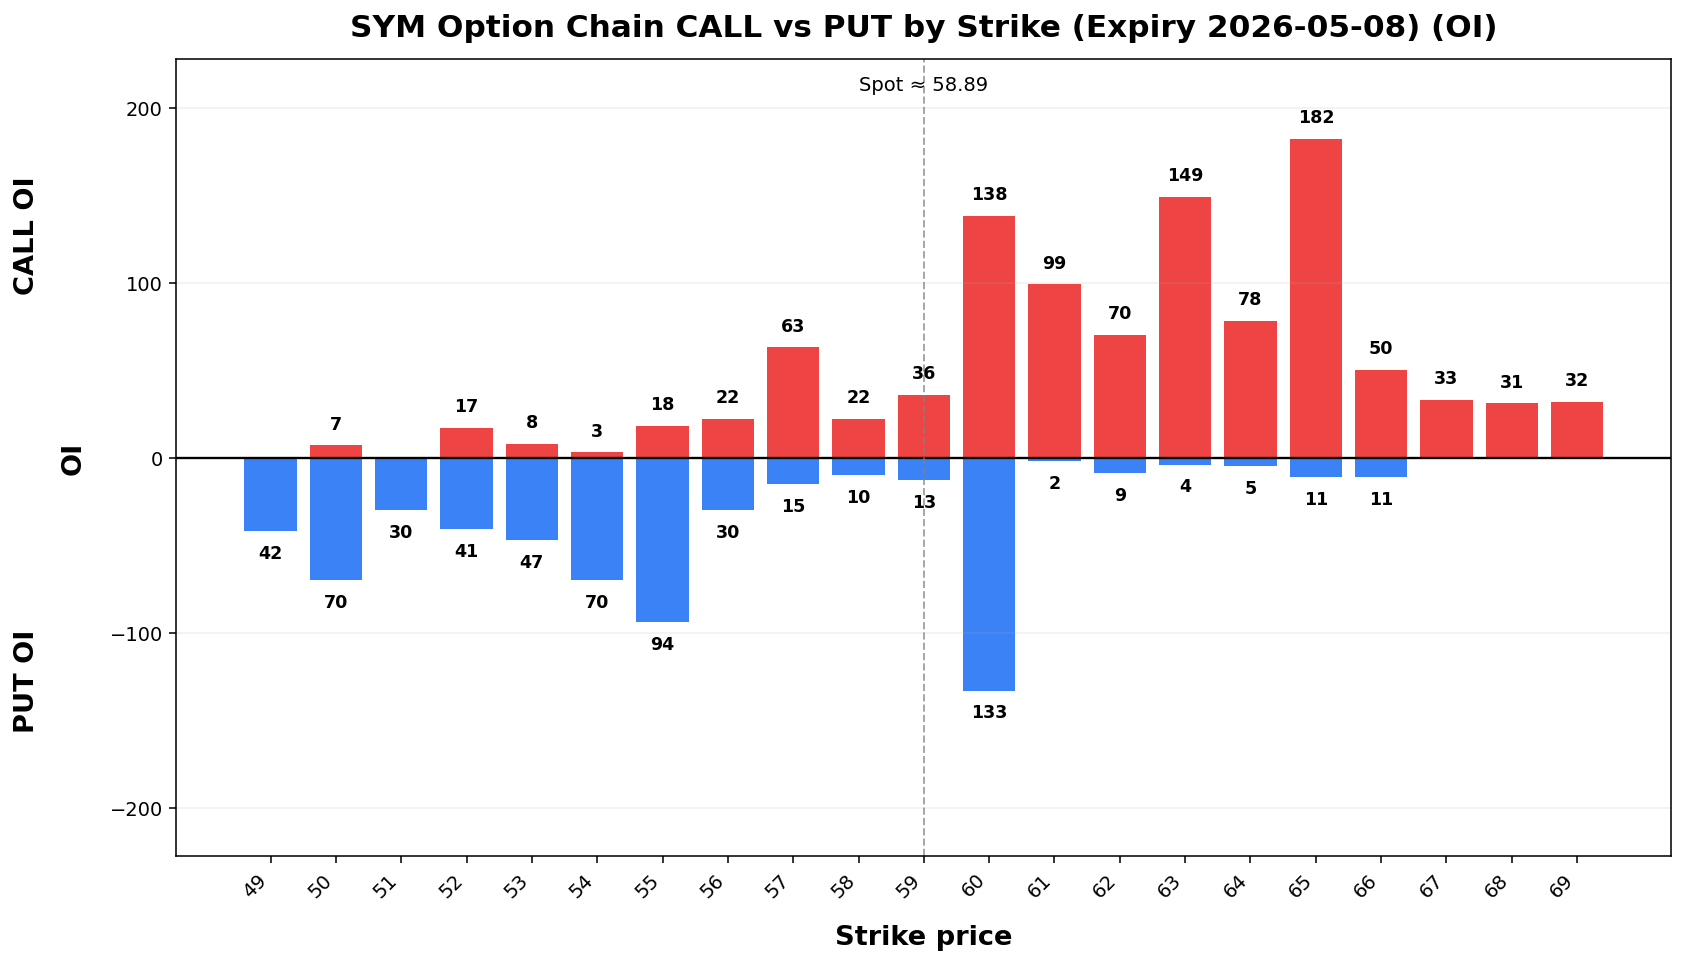
Term Structure
| Expiry |
DTE |
Forward |
ATM IV |
ATM Straddle |
| 2026-05-08 |
6 |
58.82 |
137.46% |
10.20 |
| 2026-05-15 |
13 |
58.91 |
102.05% |
11.25 |
Weekly Range
| Confidence |
Low |
High |
Width |
| 68% |
48.46 |
69.32 |
20.85 |
| 80% |
45.53 |
72.25 |
26.72 |
| 90% |
41.74 |
76.04 |
34.30 |
| 95% |
38.46 |
79.32 |
40.87 |
Structure & Probabilities
| Support |
Resistance |
Gamma Flip |
Max Pain |
P>Res |
P<Sup |
| 45.00 |
60.00 |
50.54 |
58.00 |
44.9% |
7.5% |
Flow & Skew
| Call Vol |
Put Vol |
Vol P/C |
Call OI |
Put OI |
OI P/C |
Skew |
Skew Bias |
| 543 |
543 |
1.00 |
2,261 |
1,283 |
0.57 |
-2.44 vol pts |
CALL_SKEW |
Tail Risk
| Q10 |
Q50 |
Q90 |
Down Tail |
Up Tail |
Down/Up |
| 44.56 |
56.89 |
70.15 |
14.33 |
11.26 |
1.27 |
Daily Technicals
| EMA20 |
EMA50 |
VWAP20 |
BB Lower |
BB Mid |
BB Upper |
BB Width |
Vol Ratio |
Path |
| 58.20 |
56.86 |
59.03 |
50.49 |
58.28 |
66.07 |
26.74% |
0.85 |
UP trend (expanding) |
Day Plan
- 45.00-60.00 range: fade extremes
- > 60.00: chase only if hold + vol
- < 45.00: risk expand; reduce size
- Regime: TRANSITION
- Tech: UP trend (expanding)
Swing Plan
- Accumulate: 45.00-45.00
- Trim: 60.00-60.00
- Add: close > 60.00
- Cut: close < 45.00
- Best for: transition regime
Raw Text Summary
📌 SYM @ 58.89 (2026-05-03 08:49 AM MYT)

• Current price is **58.89**. Key support is around **45.00**, and resistance is around **60.00**.
• For the next week, the model’s **68% expected range** is roughly **48.46 to 69.32**.
• A wider **90% range** is about **41.74 to 76.04**.
• Dealer positioning looks **LONG gamma**, so the market behavior is classified as **TRANSITION**.
• The estimated **gamma flip** is near **50.54**. Crossing and holding beyond this area can change the trading behavior.
• Approximate breakout odds: **above resistance 44.9%**, **below support 7.5%** by the target horizon.
• Options skew is tilted toward **calls**, which suggests upside speculation is relatively stronger.
• Near-term implied volatility is higher than the next expiry (**IV1 137.46% vs IV2 102.05%**), which suggests **near-term event stress / backwardation**.
• On the daily chart, the stock currently looks like **UP trend (expanding)**.
• The implied distribution shows **heavier downside tail risk** than upside tail potential.
MSTX
Spot: 36.60
Report Time: 2026-05-03 08:49 AM MYT
Regime: TRANSITION
Dealer Gamma: LONG
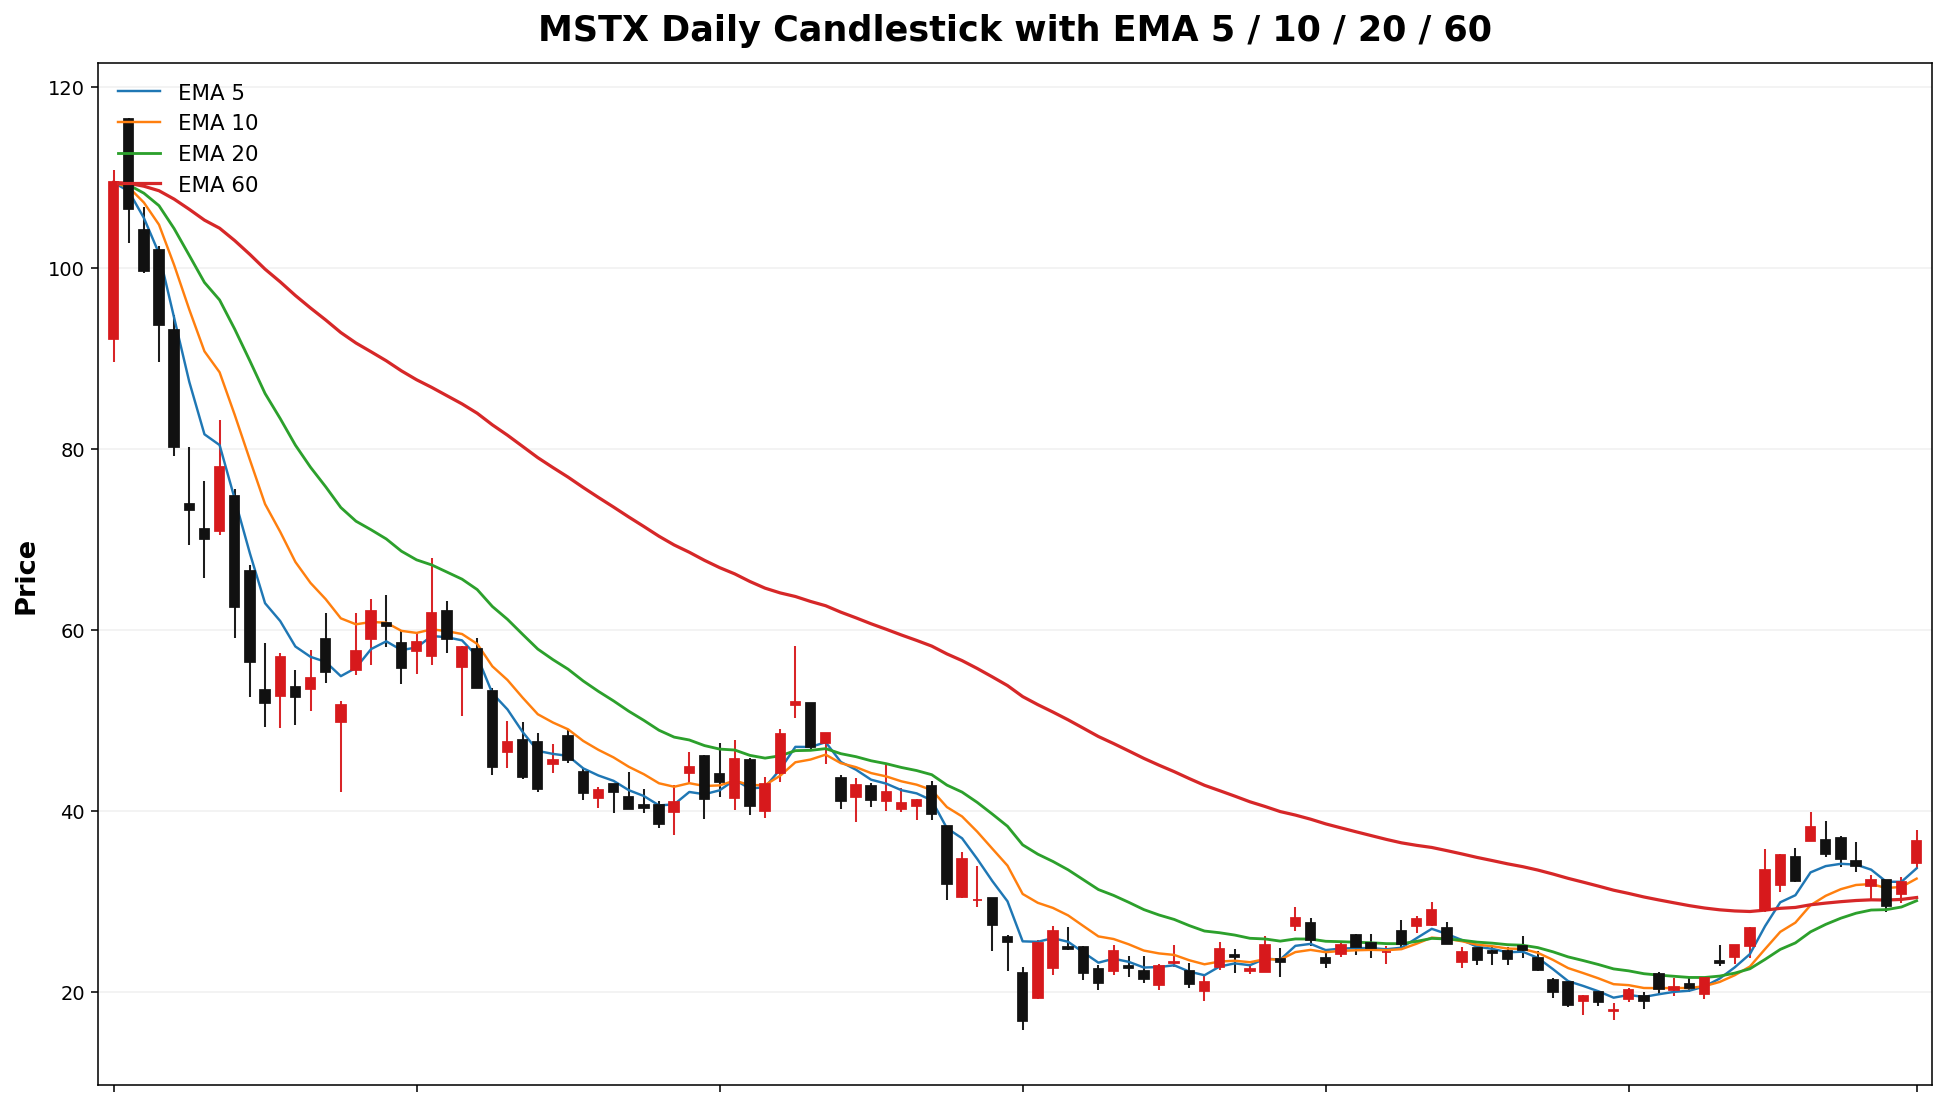
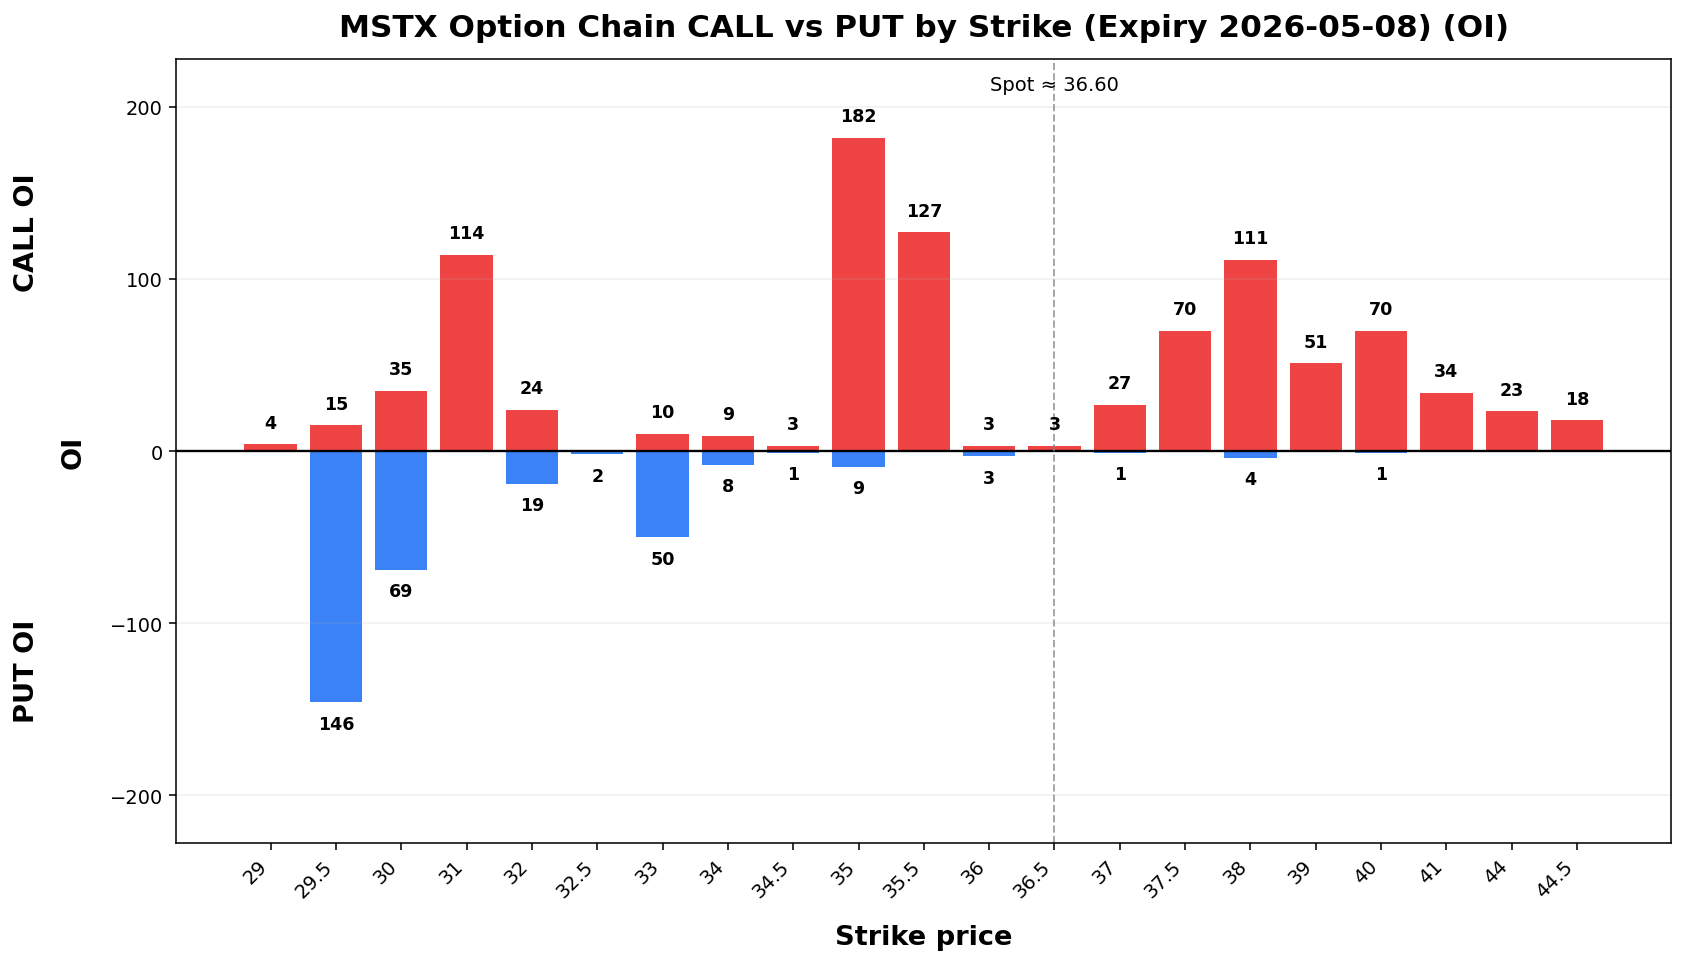
Term Structure
| Expiry |
DTE |
Forward |
ATM IV |
ATM Straddle |
| 2026-05-08 |
6 |
36.65 |
130.32% |
6.01 |
| 2026-05-15 |
13 |
36.55 |
121.15% |
8.30 |
Weekly Range
| Confidence |
Low |
High |
Width |
| 68% |
30.05 |
43.15 |
13.10 |
| 80% |
28.21 |
44.99 |
16.79 |
| 90% |
25.83 |
47.37 |
21.55 |
| 95% |
23.76 |
49.44 |
25.67 |
Structure & Probabilities
| Support |
Resistance |
Gamma Flip |
Max Pain |
P>Res |
P<Sup |
| 35.50 |
37.50 |
27.28 |
30.00 |
40.7% |
33.1% |
Flow & Skew
| Call Vol |
Put Vol |
Vol P/C |
Call OI |
Put OI |
OI P/C |
Skew |
Skew Bias |
| 967 |
430 |
0.44 |
1,090 |
697 |
0.64 |
-11.23 vol pts |
CALL_SKEW |
Tail Risk
| Q10 |
Q50 |
Q90 |
Down Tail |
Up Tail |
Down/Up |
| 27.29 |
35.11 |
45.72 |
9.31 |
9.12 |
1.02 |
Daily Technicals
| EMA20 |
EMA50 |
VWAP20 |
BB Lower |
BB Mid |
BB Upper |
BB Width |
Vol Ratio |
Path |
| 30.03 |
29.92 |
28.49 |
15.31 |
28.52 |
41.74 |
92.67% |
0.76 |
UP trend (expanding) |
Day Plan
- 35.50-37.50 range: fade extremes
- > 37.50: chase only if hold + vol
- < 35.50: risk expand; reduce size
- Regime: TRANSITION
- Tech: UP trend (expanding)
Swing Plan
- Accumulate: 35.50-35.50
- Trim: 37.50-37.50
- Add: close > 37.50
- Cut: close < 35.50
- Best for: transition regime
Raw Text Summary
📌 MSTX @ 36.60 (2026-05-03 08:49 AM MYT)

• Current price is **36.60**. Key support is around **35.50**, and resistance is around **37.50**.
• For the next week, the model’s **68% expected range** is roughly **30.05 to 43.15**.
• A wider **90% range** is about **25.83 to 47.37**.
• Dealer positioning looks **LONG gamma**, so the market behavior is classified as **TRANSITION**.
• The estimated **gamma flip** is near **27.28**. Crossing and holding beyond this area can change the trading behavior.
• Approximate breakout odds: **above resistance 40.7%**, **below support 33.1%** by the target horizon.
• Options skew is tilted toward **calls**, which suggests upside speculation is relatively stronger.
• Near-term implied volatility is higher than the next expiry (**IV1 130.32% vs IV2 121.15%**), which suggests **near-term event stress / backwardation**.
• Recent volume is only **0.76x** the 20-day average, so breakouts may be less reliable unless volume improves.
• On the daily chart, the stock currently looks like **UP trend (expanding)**.
• The implied distribution is **fairly balanced** between upside and downside tails.
U
Spot: 27.13
Report Time: 2026-05-03 08:49 AM MYT
Regime: TRANSITION
Dealer Gamma: LONG
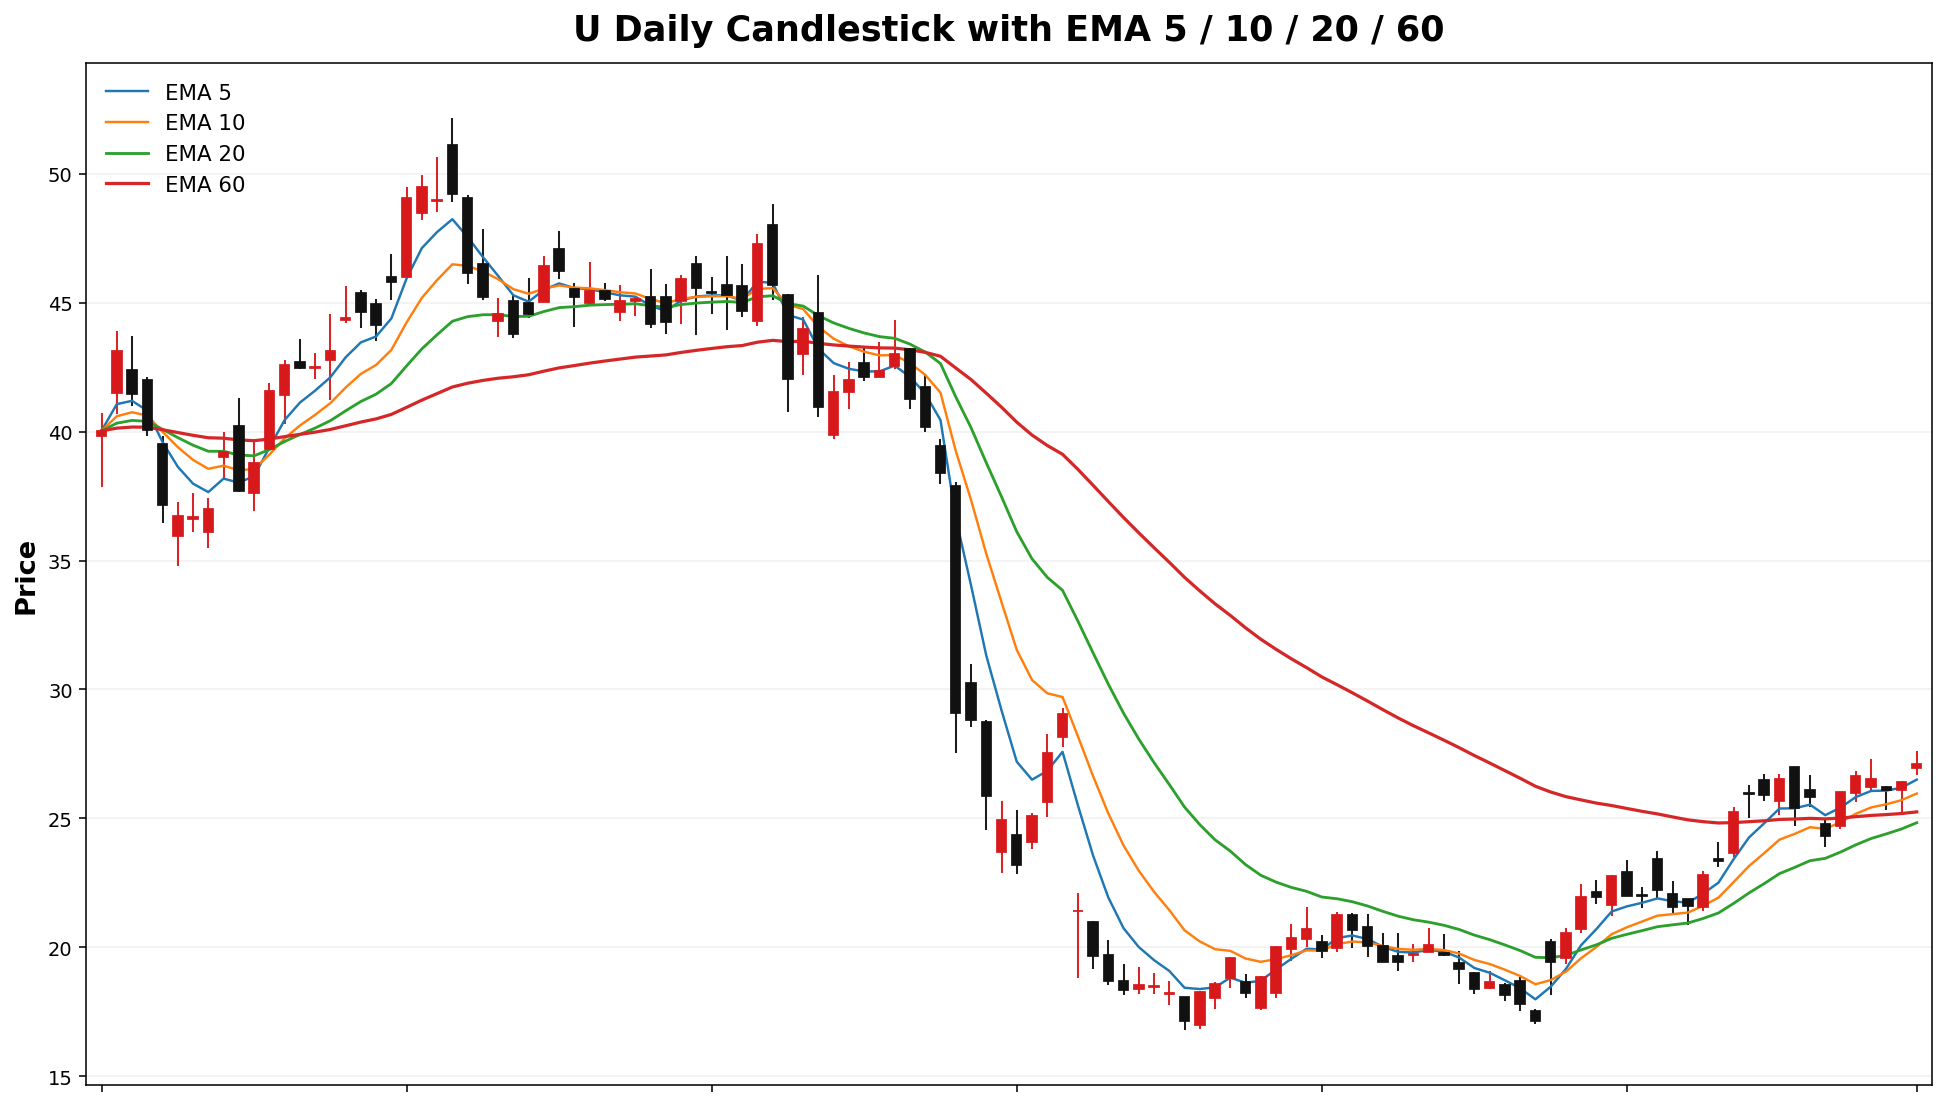
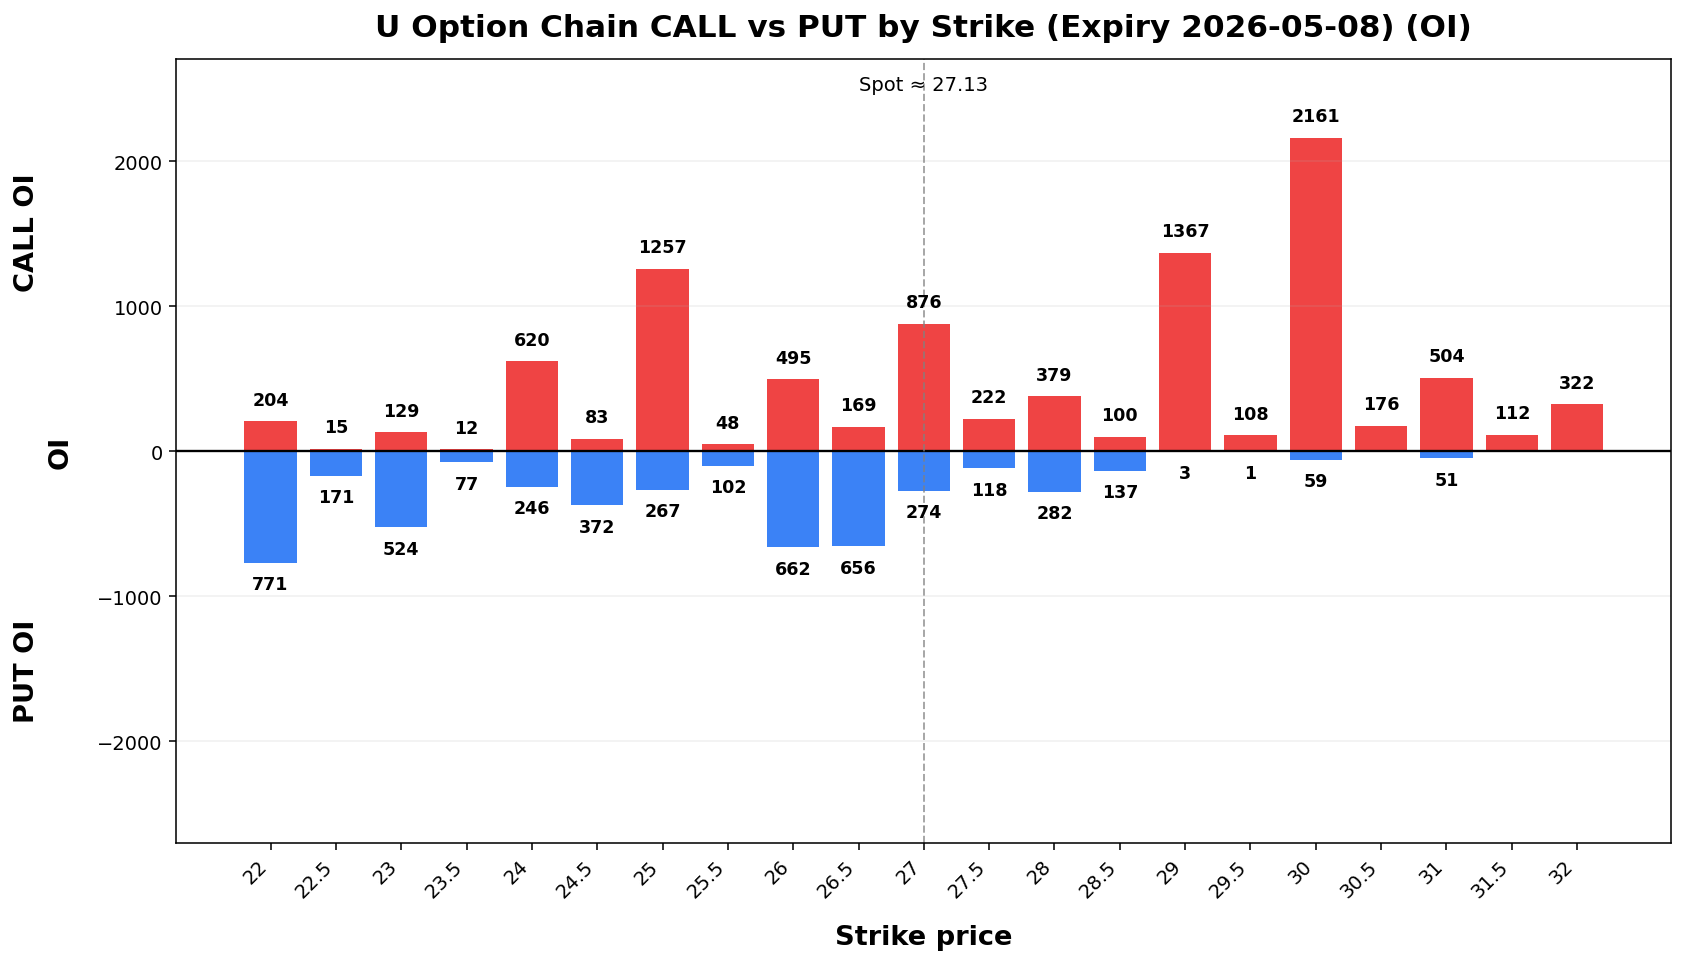
Term Structure
| Expiry |
DTE |
Forward |
ATM IV |
ATM Straddle |
| 2026-05-08 |
6 |
27.14 |
112.92% |
3.86 |
| 2026-05-15 |
13 |
27.11 |
88.81% |
4.51 |
Weekly Range
| Confidence |
Low |
High |
Width |
| 68% |
23.13 |
31.13 |
8.01 |
| 80% |
22.00 |
32.26 |
10.26 |
| 90% |
20.55 |
33.71 |
13.17 |
| 95% |
19.28 |
34.98 |
15.69 |
Structure & Probabilities
| Support |
Resistance |
Gamma Flip |
Max Pain |
P>Res |
P<Sup |
| 27.00 |
29.00 |
21.69 |
25.00 |
31.4% |
40.0% |
Flow & Skew
| Call Vol |
Put Vol |
Vol P/C |
Call OI |
Put OI |
OI P/C |
Skew |
Skew Bias |
| 5,857 |
4,233 |
0.72 |
10,633 |
5,907 |
0.56 |
-2.73 vol pts |
CALL_SKEW |
Tail Risk
| Q10 |
Q50 |
Q90 |
Down Tail |
Up Tail |
Down/Up |
| 20.52 |
25.90 |
32.71 |
6.61 |
5.58 |
1.18 |
Daily Technicals
| EMA20 |
EMA50 |
VWAP20 |
BB Lower |
BB Mid |
BB Upper |
BB Width |
Vol Ratio |
Path |
| 24.83 |
24.63 |
24.54 |
20.74 |
24.68 |
28.62 |
31.91% |
0.88 |
UP trend (expanding) |
Day Plan
- 27.00-29.00 range: fade extremes
- > 29.00: chase only if hold + vol
- < 27.00: risk expand; reduce size
- Regime: TRANSITION
- Tech: UP trend (expanding)
Swing Plan
- Accumulate: 27.00-27.00
- Trim: 29.00-29.00
- Add: close > 29.00
- Cut: close < 27.00
- Best for: transition regime
Raw Text Summary
📌 U @ 27.13 (2026-05-03 08:49 AM MYT)

• Current price is **27.13**. Key support is around **27.00**, and resistance is around **29.00**.
• For the next week, the model’s **68% expected range** is roughly **23.13 to 31.13**.
• A wider **90% range** is about **20.55 to 33.71**.
• Dealer positioning looks **LONG gamma**, so the market behavior is classified as **TRANSITION**.
• The estimated **gamma flip** is near **21.69**. Crossing and holding beyond this area can change the trading behavior.
• Approximate breakout odds: **above resistance 31.4%**, **below support 40.0%** by the target horizon.
• Options skew is tilted toward **calls**, which suggests upside speculation is relatively stronger.
• Near-term implied volatility is higher than the next expiry (**IV1 112.92% vs IV2 88.81%**), which suggests **near-term event stress / backwardation**.
• On the daily chart, the stock currently looks like **UP trend (expanding)**.
• The implied distribution shows **heavier downside tail risk** than upside tail potential.
CAMT
Spot: 186.62
Report Time: 2026-05-03 08:49 AM MYT
Regime: TRANSITION
Dealer Gamma: LONG
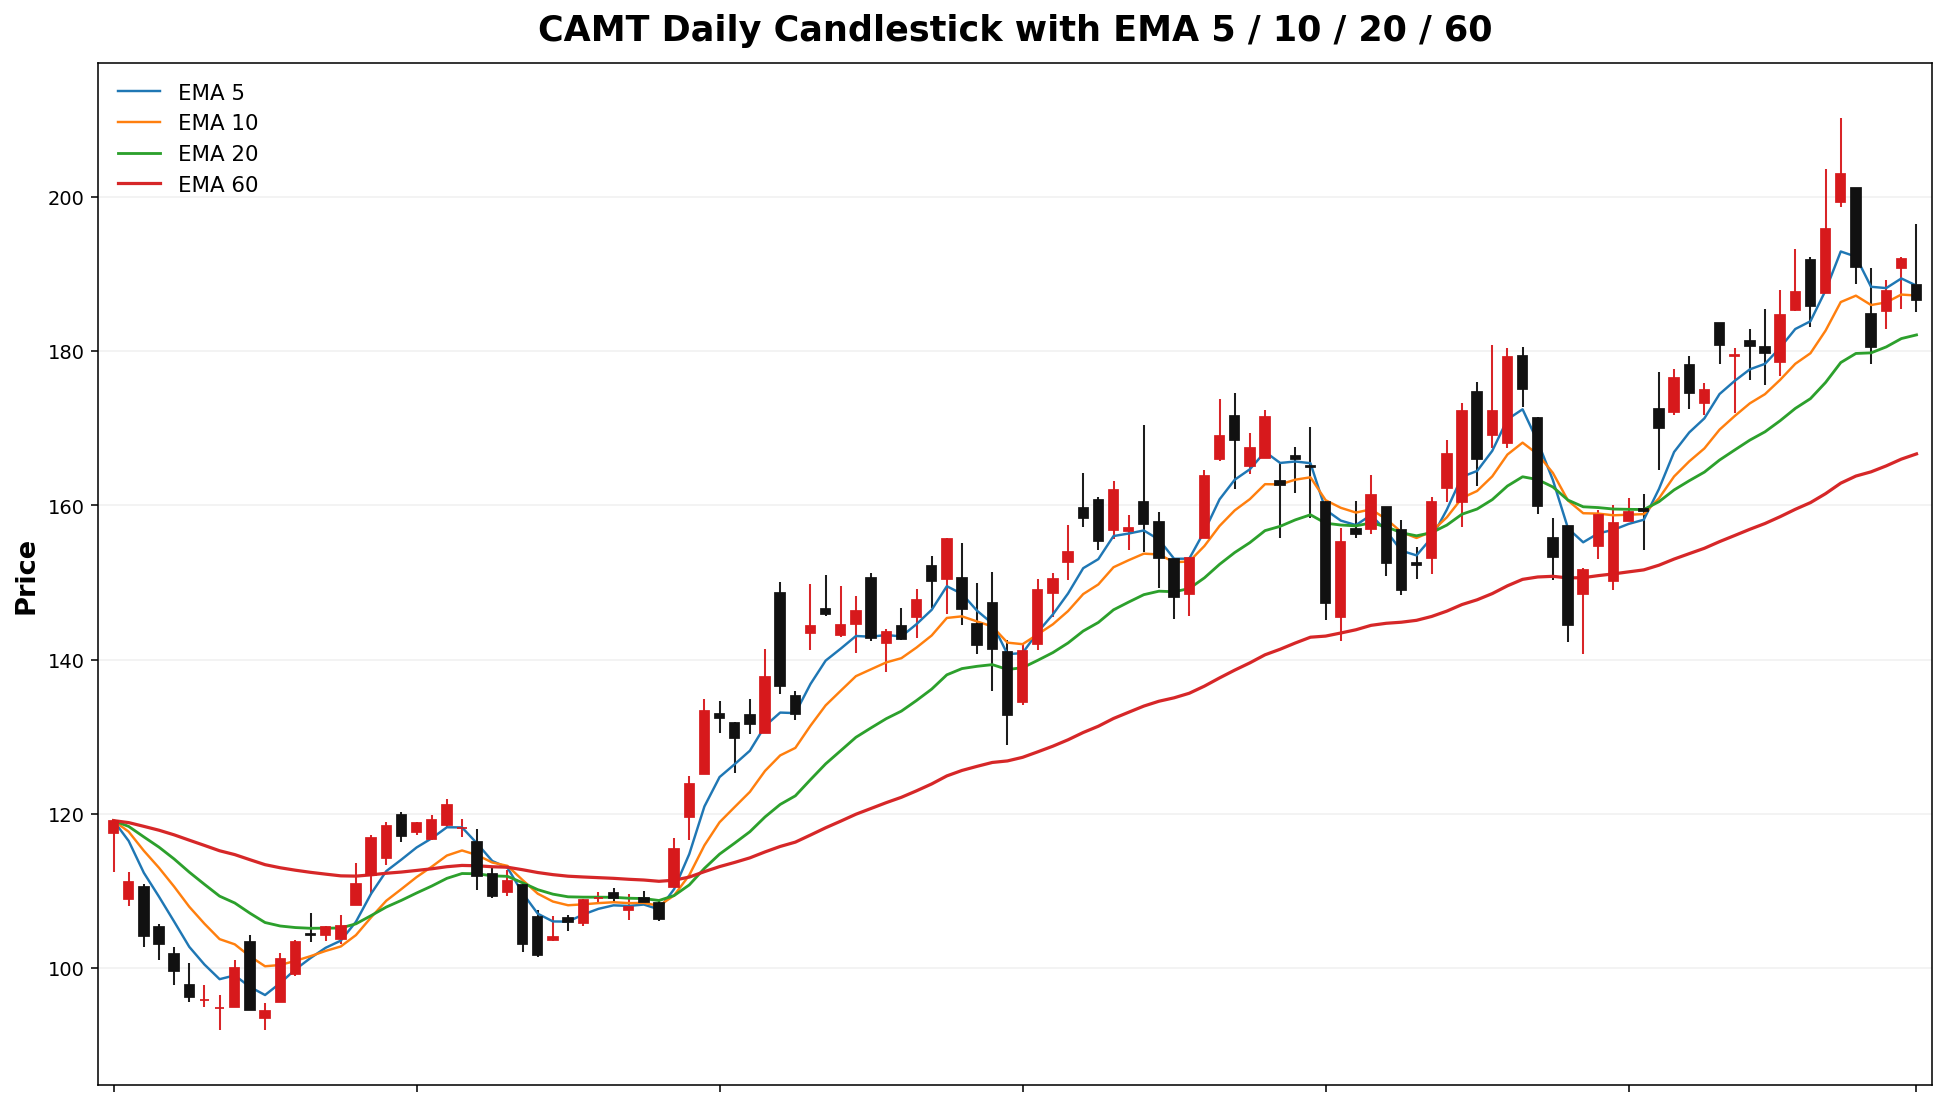
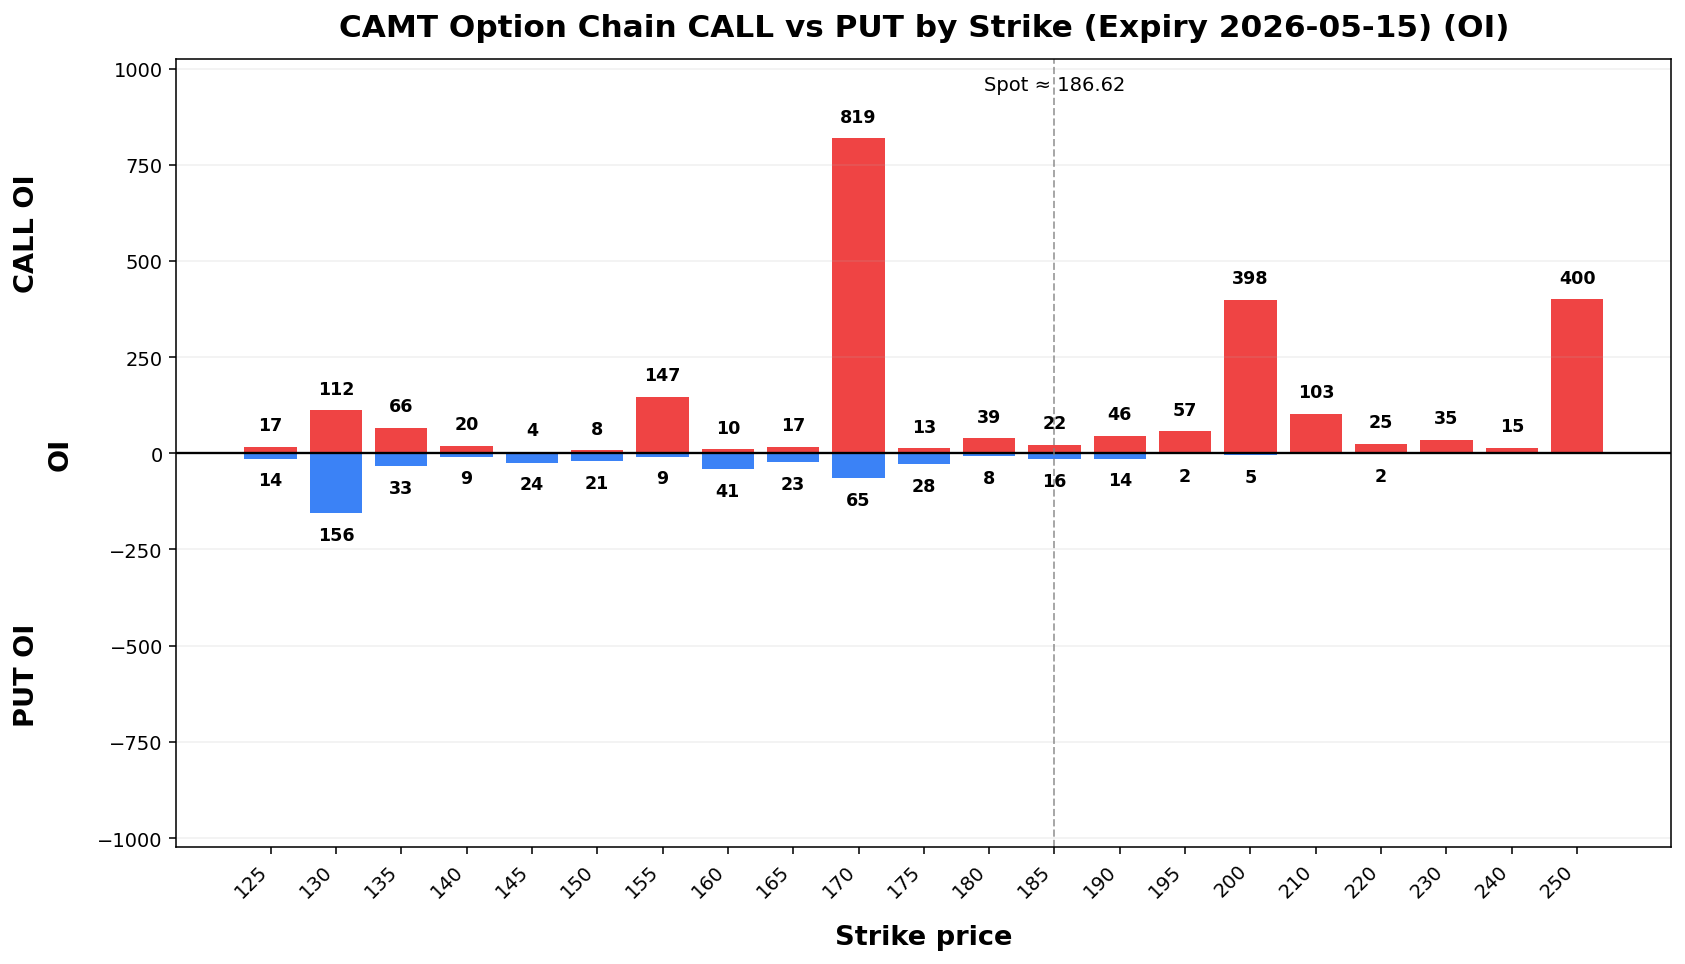
Term Structure
| Expiry |
DTE |
Forward |
ATM IV |
ATM Straddle |
| 2026-05-15 |
13 |
186.93 |
70.71% |
24.70 |
| 2026-06-18 |
47 |
187.53 |
58.76% |
39.25 |
Weekly Range
| Confidence |
Low |
High |
Width |
| 68% |
165.22 |
208.02 |
42.81 |
| 80% |
159.19 |
214.05 |
54.86 |
| 90% |
151.41 |
221.83 |
70.41 |
| 95% |
144.67 |
228.57 |
83.90 |
Structure & Probabilities
| Support |
Resistance |
Gamma Flip |
Max Pain |
P>Res |
P<Sup |
| 170.00 |
200.00 |
96.17 |
95.00 |
23.7% |
19.5% |
Flow & Skew
| Call Vol |
Put Vol |
Vol P/C |
Call OI |
Put OI |
OI P/C |
Skew |
Skew Bias |
| 1,824 |
1,721 |
0.94 |
4,334 |
1,932 |
0.45 |
1.37 vol pts |
PUT_SKEW |
Tail Risk
| Q10 |
Q50 |
Q90 |
Down Tail |
Up Tail |
Down/Up |
| 76.66 |
83.29 |
217.73 |
109.96 |
31.11 |
3.53 |
Daily Technicals
| EMA20 |
EMA50 |
VWAP20 |
BB Lower |
BB Mid |
BB Upper |
BB Width |
Vol Ratio |
Path |
| 182.10 |
169.91 |
183.45 |
159.72 |
181.50 |
203.28 |
24.00% |
1.06 |
UP trend (expanding) |
Day Plan
- 170.00-200.00 range: fade extremes
- > 200.00: chase only if hold + vol
- < 170.00: risk expand; reduce size
- Regime: TRANSITION
- Tech: UP trend (expanding)
Swing Plan
- Accumulate: 170.00-170.00
- Trim: 200.00-200.00
- Add: close > 200.00
- Cut: close < 170.00
- Best for: transition regime
Raw Text Summary
📌 CAMT @ 186.62 (2026-05-03 08:49 AM MYT)

• Current price is **186.62**. Key support is around **170.00**, and resistance is around **200.00**.
• For the next week, the model’s **68% expected range** is roughly **165.22 to 208.02**.
• A wider **90% range** is about **151.41 to 221.83**.
• Dealer positioning looks **LONG gamma**, so the market behavior is classified as **TRANSITION**.
• The estimated **gamma flip** is near **96.17**. Crossing and holding beyond this area can change the trading behavior.
• Approximate breakout odds: **above resistance 23.7%**, **below support 19.5%** by the target horizon.
• Options skew is fairly balanced, so there is **no strong directional bias** from skew alone.
• Near-term implied volatility is higher than the next expiry (**IV1 70.71% vs IV2 58.76%**), which suggests **near-term event stress / backwardation**.
• On the daily chart, the stock currently looks like **UP trend (expanding)**.
• The implied distribution shows **heavier downside tail risk** than upside tail potential.
CELC
Spot: 125.65
Report Time: 2026-05-03 08:49 AM MYT
Regime: TRANSITION
Dealer Gamma: LONG
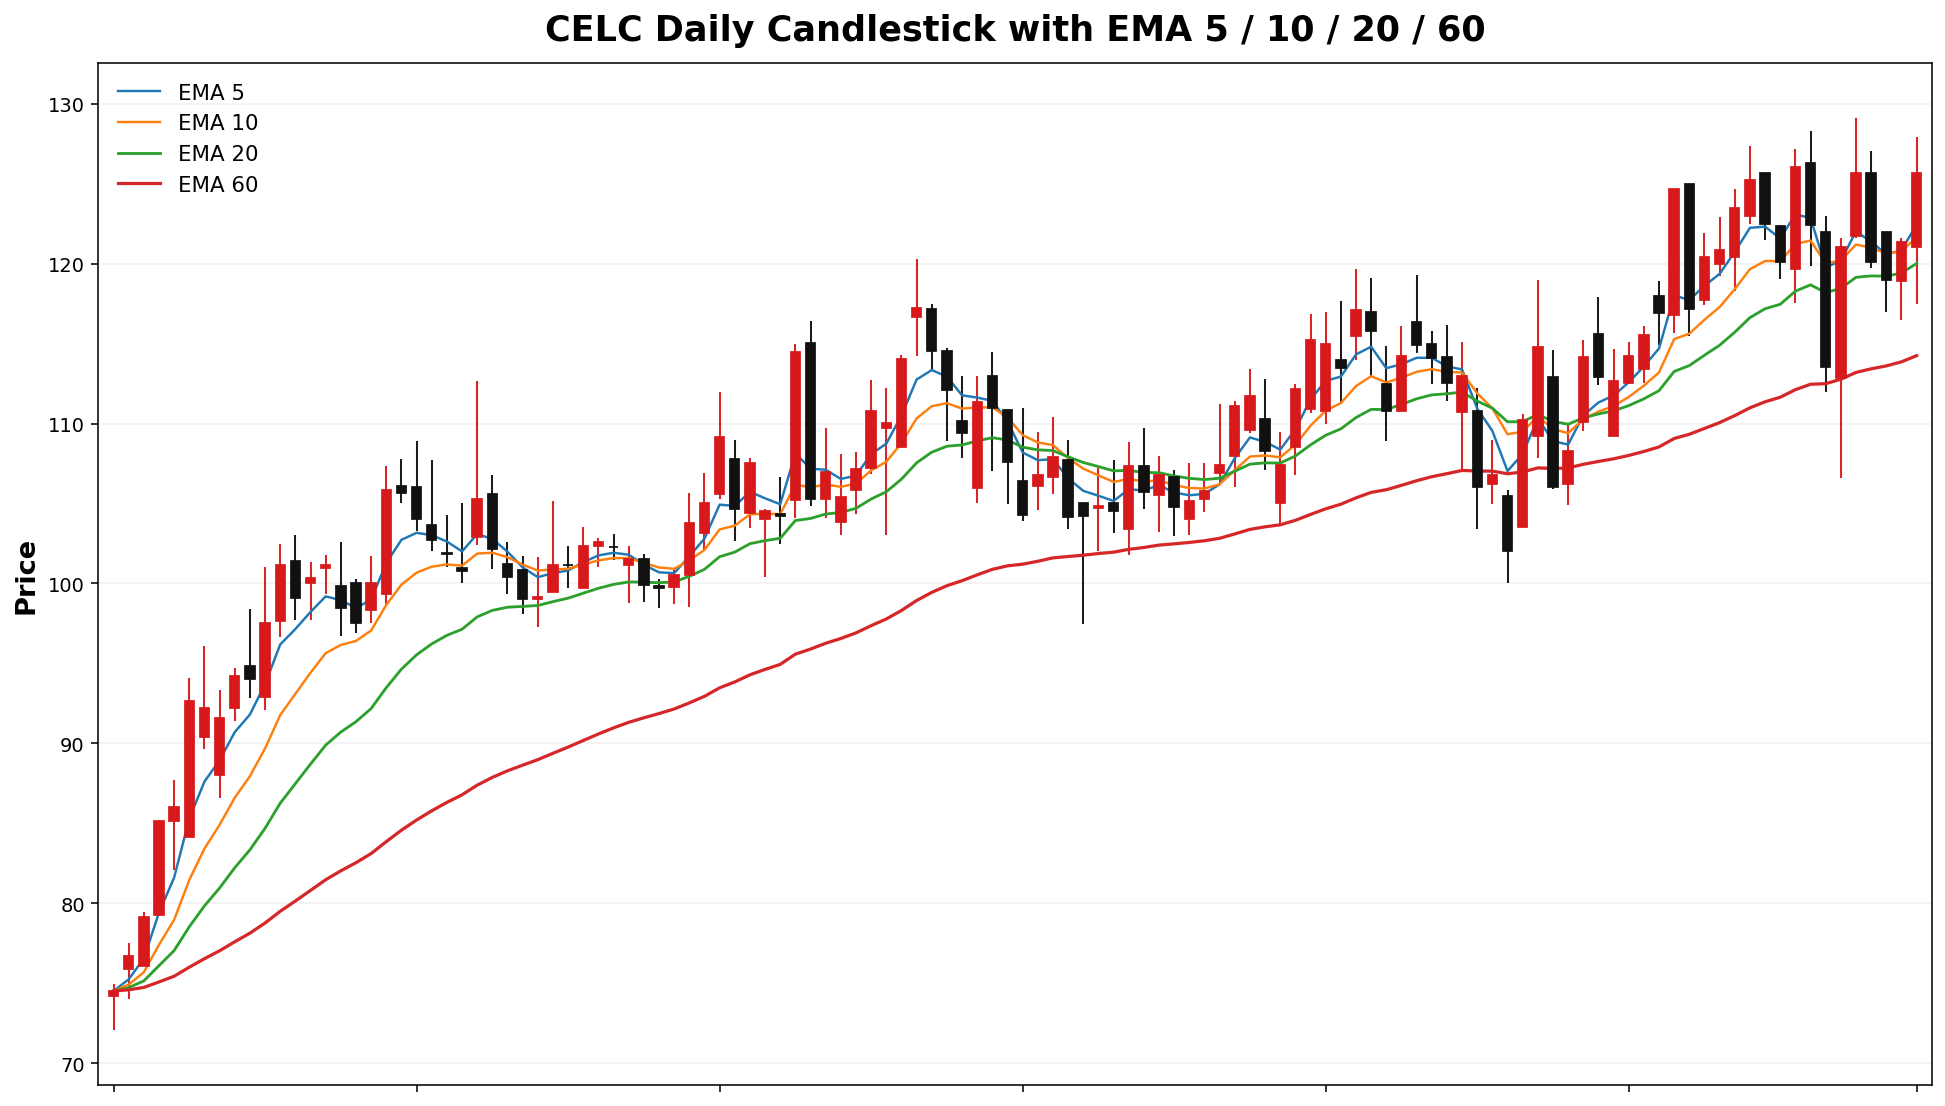
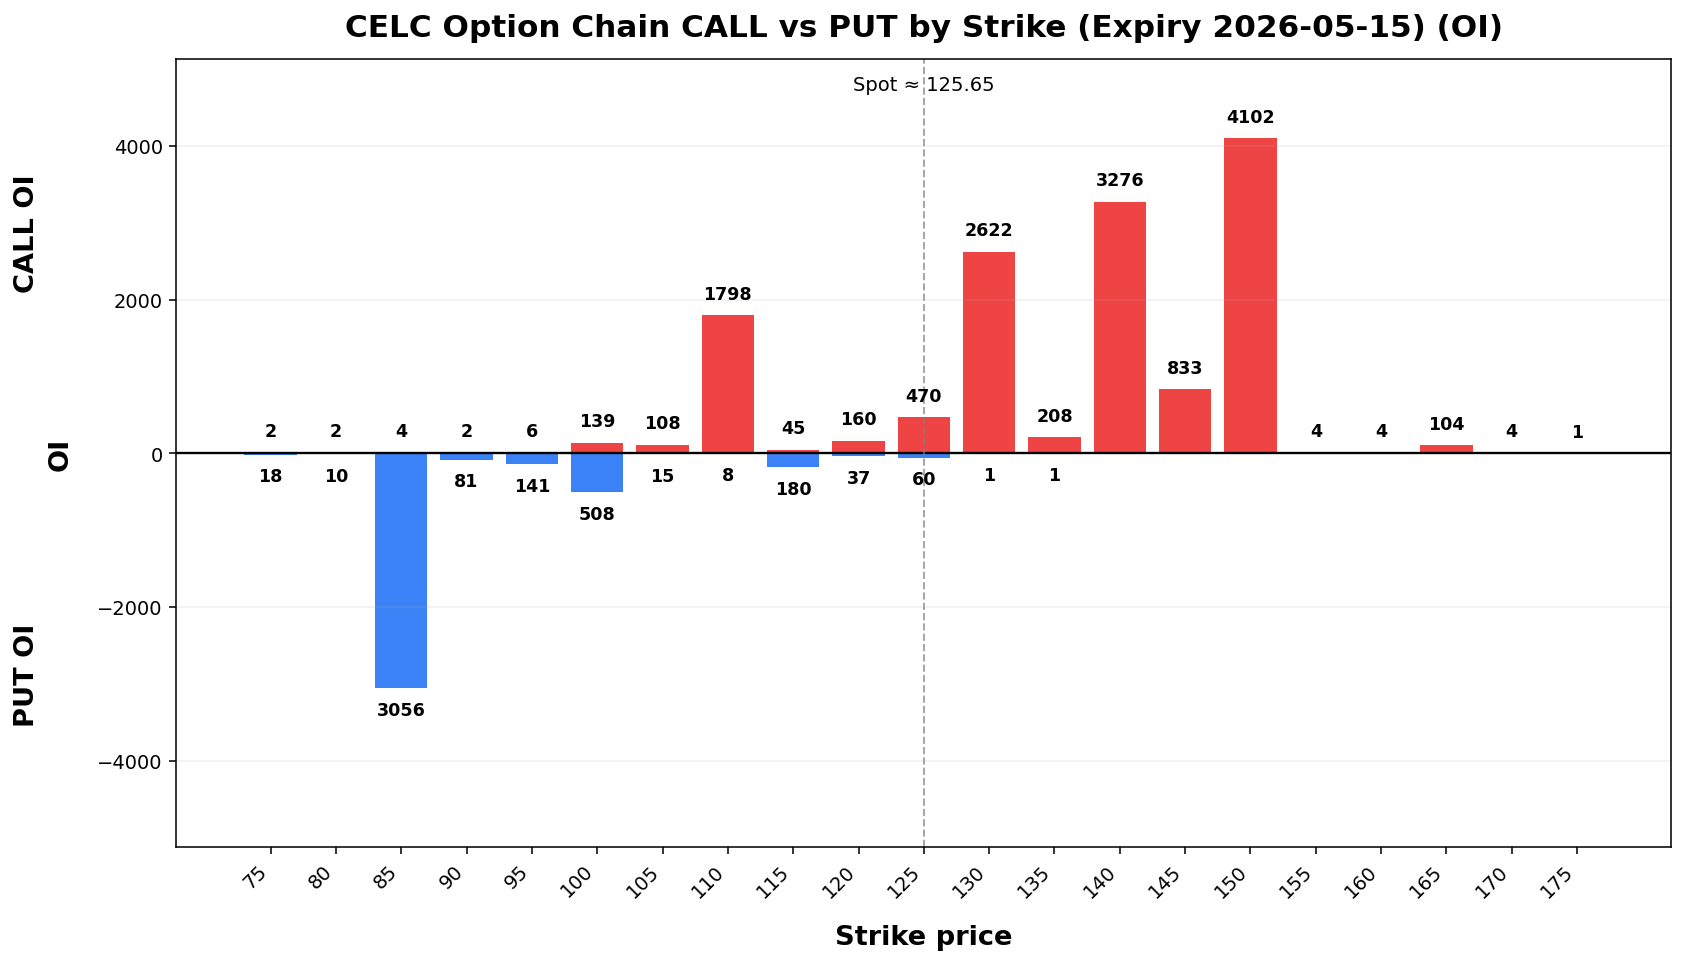
Term Structure
| Expiry |
DTE |
Forward |
ATM IV |
ATM Straddle |
| 2026-05-15 |
13 |
125.84 |
64.84% |
15.25 |
| 2026-06-18 |
47 |
125.99 |
73.48% |
33.05 |
Weekly Range
| Confidence |
Low |
High |
Width |
| 68% |
116.05 |
135.25 |
19.20 |
| 80% |
113.35 |
137.95 |
24.61 |
| 90% |
109.86 |
141.44 |
31.58 |
| 95% |
106.83 |
144.47 |
37.64 |
Structure & Probabilities
| Support |
Resistance |
Gamma Flip |
Max Pain |
P>Res |
P<Sup |
| 125.00 |
130.00 |
95.58 |
110.00 |
27.3% |
47.6% |
Flow & Skew
| Call Vol |
Put Vol |
Vol P/C |
Call OI |
Put OI |
OI P/C |
Skew |
Skew Bias |
| 2,903 |
1,487 |
0.51 |
13,899 |
4,186 |
0.30 |
15.62 vol pts |
PUT_SKEW |
Tail Risk
| Q10 |
Q50 |
Q90 |
Down Tail |
Up Tail |
Down/Up |
| 54.36 |
126.02 |
149.30 |
71.29 |
23.65 |
3.01 |
Daily Technicals
| EMA20 |
EMA50 |
VWAP20 |
BB Lower |
BB Mid |
BB Upper |
BB Width |
Vol Ratio |
Path |
| 120.01 |
115.45 |
120.75 |
113.14 |
120.79 |
128.45 |
12.68% |
2.48 |
UP bias |
Day Plan
- 125.00-130.00 range: fade extremes
- > 130.00: chase only if hold + vol
- < 125.00: risk expand; reduce size
- Regime: TRANSITION
- Tech: UP bias
Swing Plan
- Accumulate: 125.00-125.00
- Trim: 130.00-130.00
- Add: close > 130.00
- Cut: close < 125.00
- Best for: transition regime
Raw Text Summary
📌 CELC @ 125.65 (2026-05-03 08:49 AM MYT)

• Current price is **125.65**. Key support is around **125.00**, and resistance is around **130.00**.
• For the next week, the model’s **68% expected range** is roughly **116.05 to 135.25**.
• A wider **90% range** is about **109.86 to 141.44**.
• Dealer positioning looks **LONG gamma**, so the market behavior is classified as **TRANSITION**.
• The estimated **gamma flip** is near **95.58**. Crossing and holding beyond this area can change the trading behavior.
• Approximate breakout odds: **above resistance 27.3%**, **below support 47.6%** by the target horizon.
• Options skew is tilted toward **puts**, which suggests traders are paying more for downside protection.
• Near-term implied volatility is lower than the next expiry (**IV1 64.84% vs IV2 73.48%**), which suggests a **contango / calmer front expiry** setup.
• Recent volume is **2.48x** the 20-day average, which supports stronger continuation or breakout follow-through.
• On the daily chart, the stock currently looks like **UP bias**.
• The implied distribution shows **heavier downside tail risk** than upside tail potential.
PL
Spot: 36.90
Report Time: 2026-05-03 08:50 AM MYT
Regime: TRANSITION
Dealer Gamma: LONG
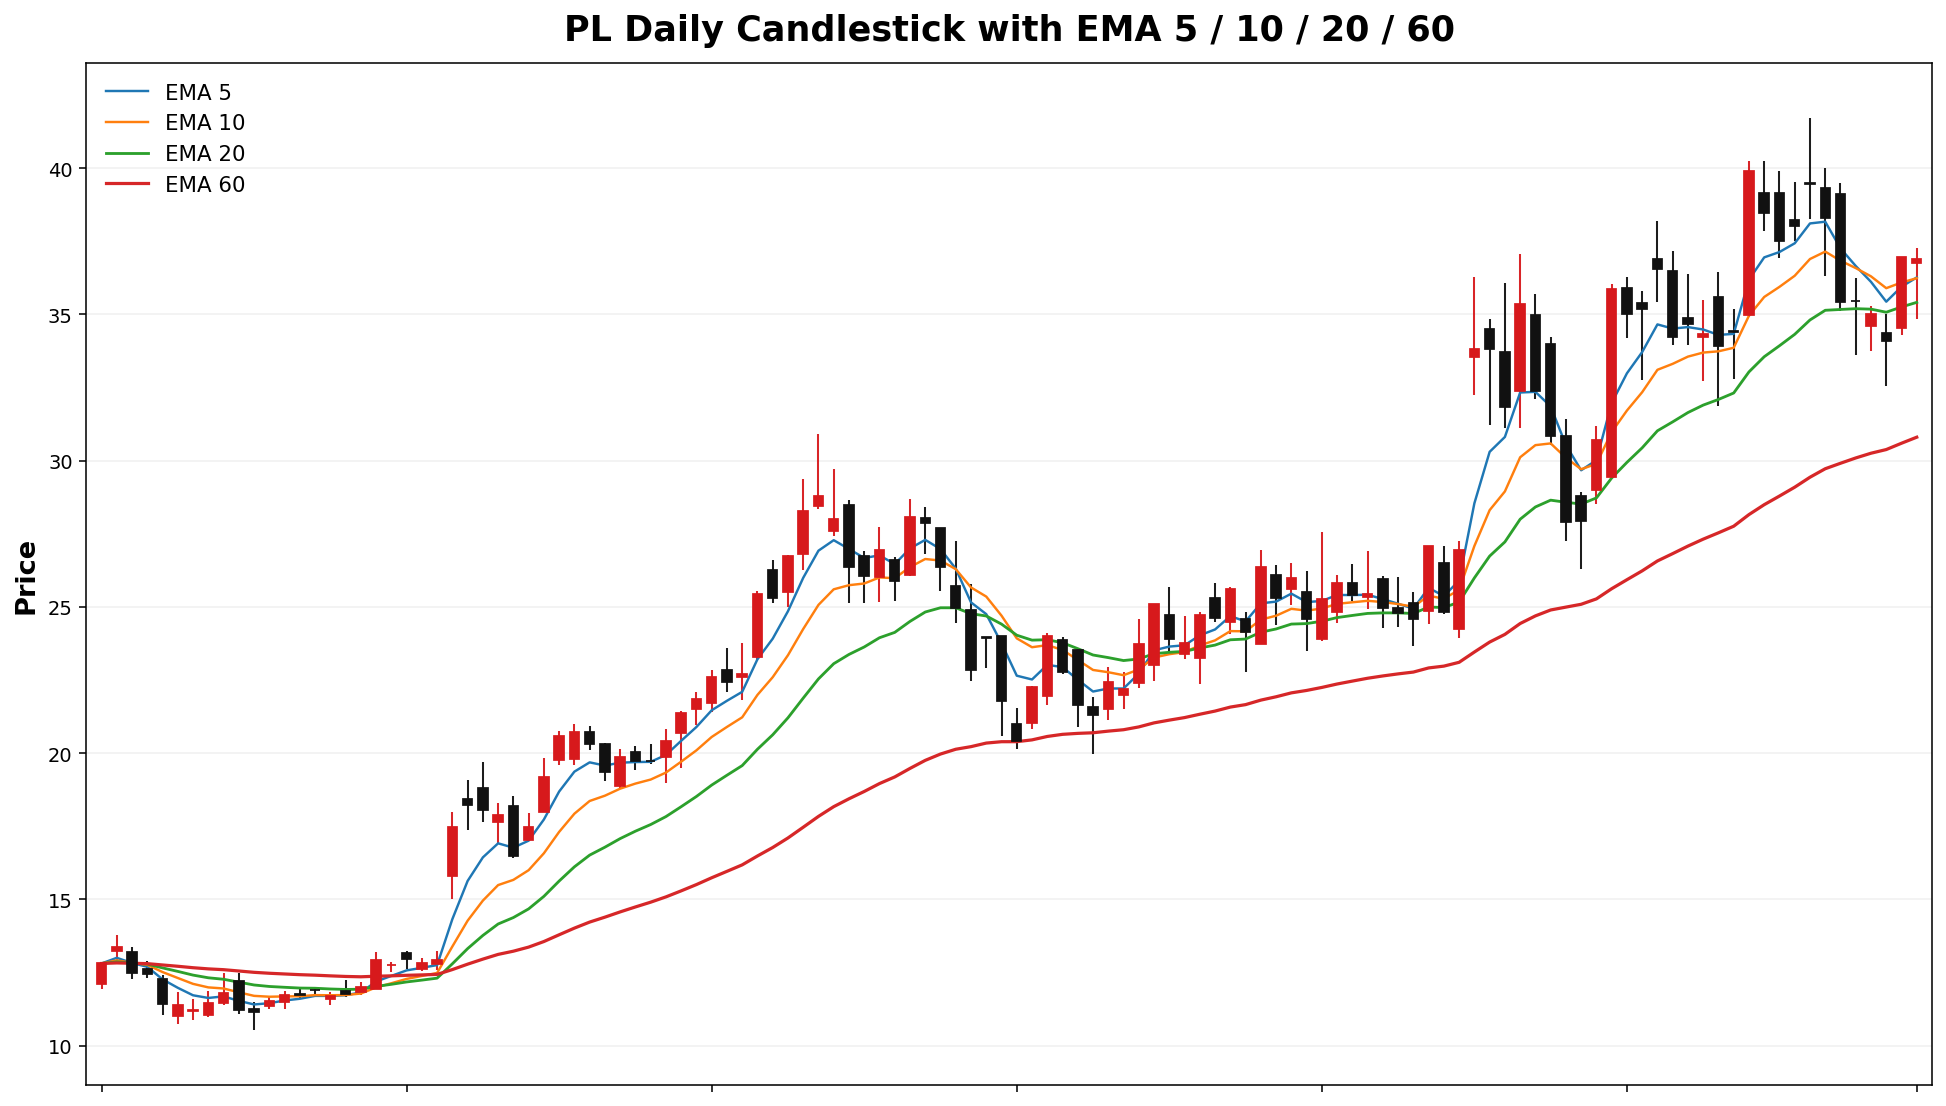
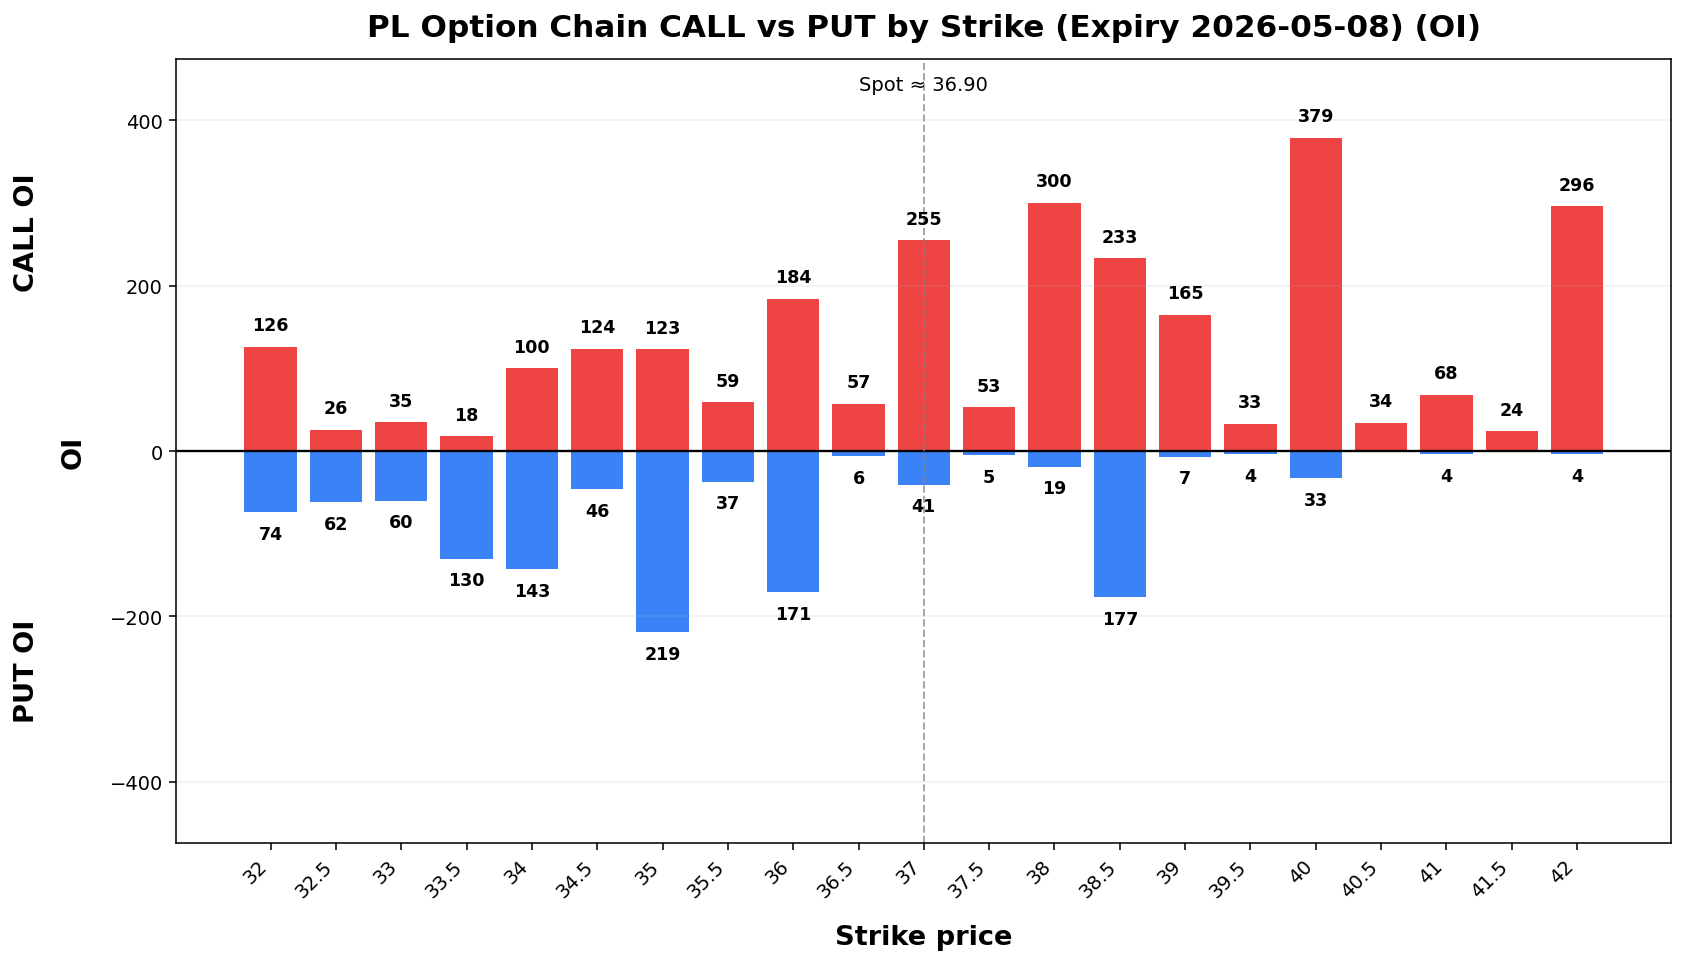
Term Structure
| Expiry |
DTE |
Forward |
ATM IV |
ATM Straddle |
| 2026-05-08 |
6 |
36.86 |
78.51% |
3.65 |
| 2026-05-15 |
13 |
36.86 |
76.73% |
5.30 |
Weekly Range
| Confidence |
Low |
High |
Width |
| 68% |
32.85 |
40.95 |
8.09 |
| 80% |
31.71 |
42.09 |
10.37 |
| 90% |
30.24 |
43.56 |
13.31 |
| 95% |
28.97 |
44.83 |
15.86 |
Structure & Probabilities
| Support |
Resistance |
Gamma Flip |
Max Pain |
P>Res |
P<Sup |
| 35.00 |
37.00 |
33.20 |
34.50 |
40.7% |
26.5% |
Flow & Skew
| Call Vol |
Put Vol |
Vol P/C |
Call OI |
Put OI |
OI P/C |
Skew |
Skew Bias |
| 2,252 |
1,849 |
0.82 |
3,515 |
4,980 |
1.42 |
0.49 vol pts |
FLAT |
Tail Risk
| Q10 |
Q50 |
Q90 |
Down Tail |
Up Tail |
Down/Up |
| 21.66 |
35.98 |
41.98 |
15.24 |
5.08 |
3.00 |
Daily Technicals
| EMA20 |
EMA50 |
VWAP20 |
BB Lower |
BB Mid |
BB Upper |
BB Width |
Vol Ratio |
Path |
| 35.41 |
31.84 |
36.29 |
32.42 |
36.19 |
39.97 |
20.86% |
0.80 |
UP trend (expanding) |
Day Plan
- 35.00-37.00 range: fade extremes
- > 37.00: chase only if hold + vol
- < 35.00: risk expand; reduce size
- Regime: TRANSITION
- Tech: UP trend (expanding)
Swing Plan
- Accumulate: 35.00-35.00
- Trim: 37.00-37.00
- Add: close > 37.00
- Cut: close < 35.00
- Best for: transition regime
Raw Text Summary
📌 PL @ 36.90 (2026-05-03 08:50 AM MYT)

• Current price is **36.90**. Key support is around **35.00**, and resistance is around **37.00**.
• For the next week, the model’s **68% expected range** is roughly **32.85 to 40.95**.
• A wider **90% range** is about **30.24 to 43.56**.
• Dealer positioning looks **LONG gamma**, so the market behavior is classified as **TRANSITION**.
• The estimated **gamma flip** is near **33.20**. Crossing and holding beyond this area can change the trading behavior.
• Approximate breakout odds: **above resistance 40.7%**, **below support 26.5%** by the target horizon.
• Options skew is fairly balanced, so there is **no strong directional bias** from skew alone.
• Near-term implied volatility is higher than the next expiry (**IV1 78.51% vs IV2 76.73%**), which suggests **near-term event stress / backwardation**.
• Recent volume is only **0.80x** the 20-day average, so breakouts may be less reliable unless volume improves.
• On the daily chart, the stock currently looks like **UP trend (expanding)**.
• The implied distribution shows **heavier downside tail risk** than upside tail potential.
DUOL
Spot: 111.25
Report Time: 2026-05-03 08:50 AM MYT
Regime: TRANSITION
Dealer Gamma: LONG
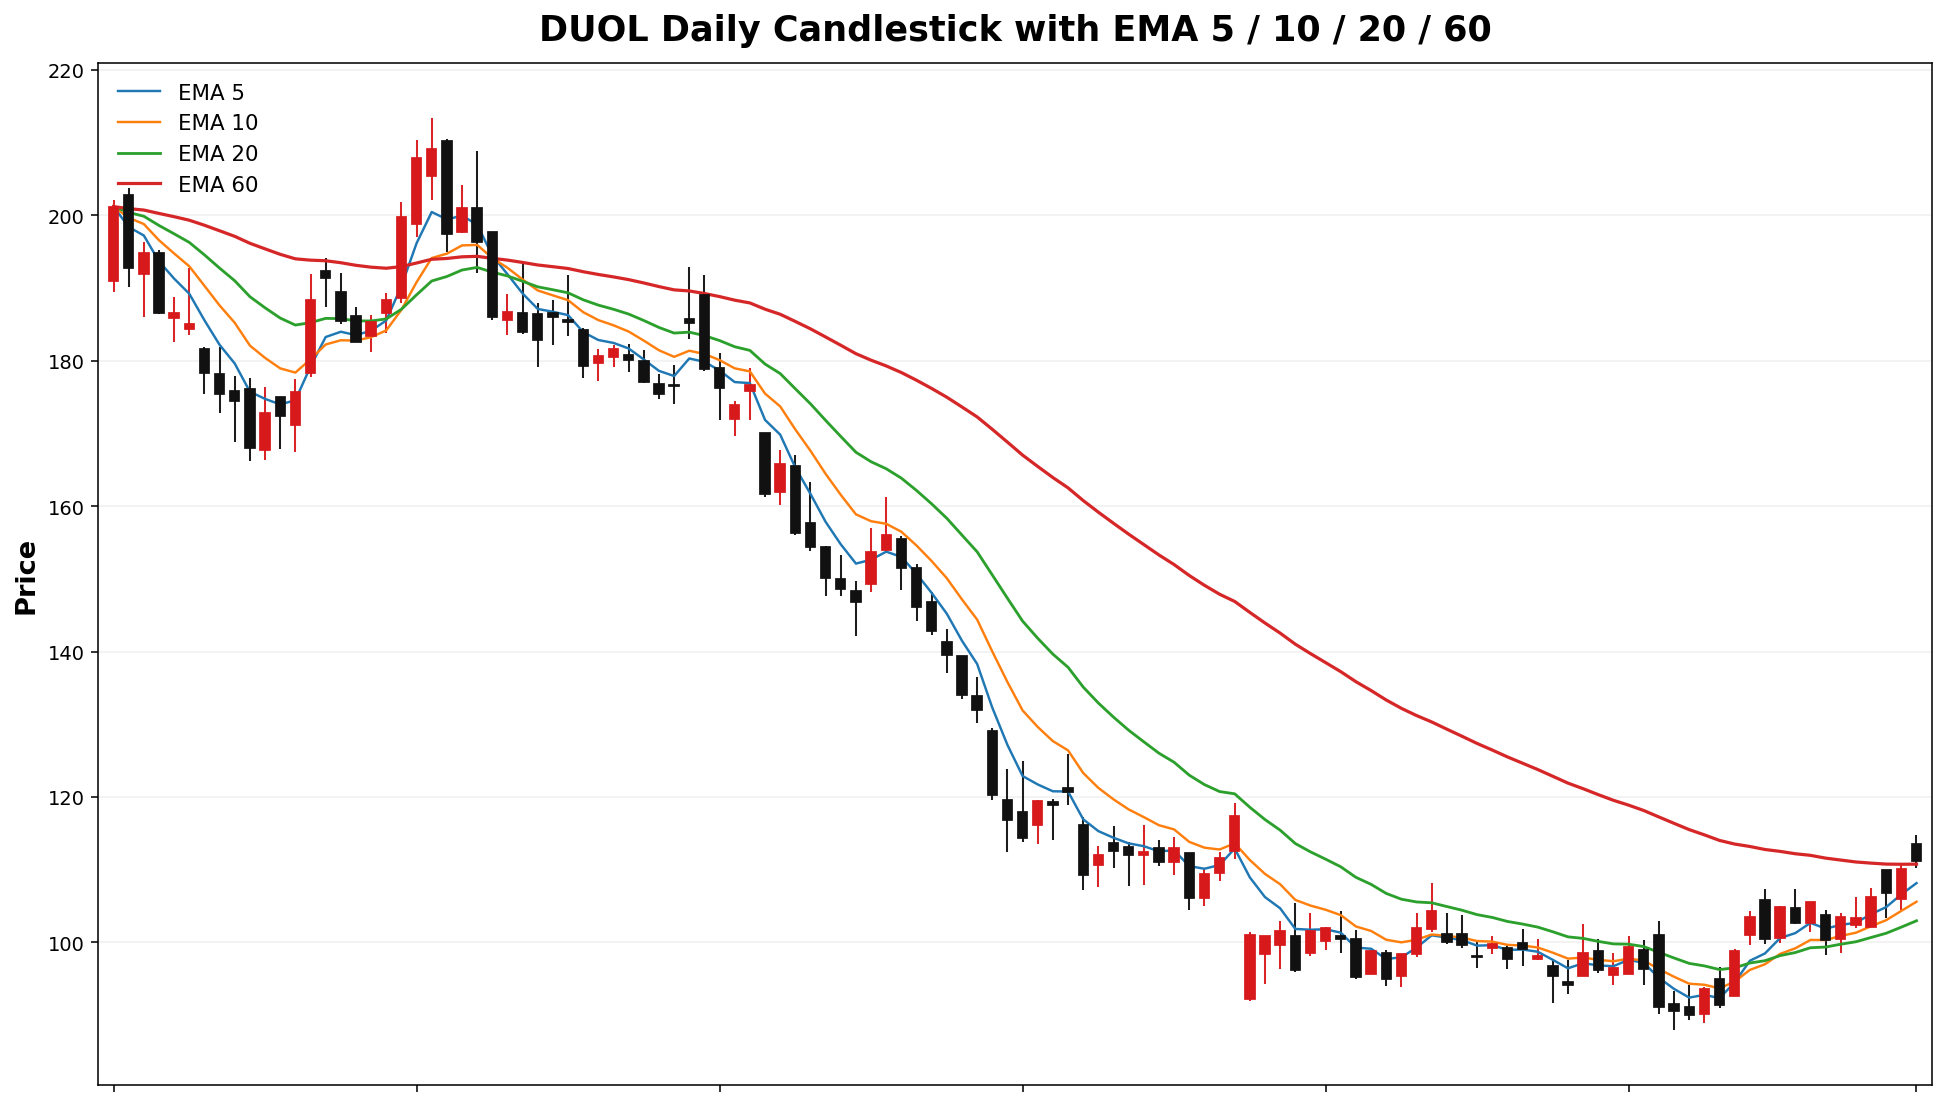
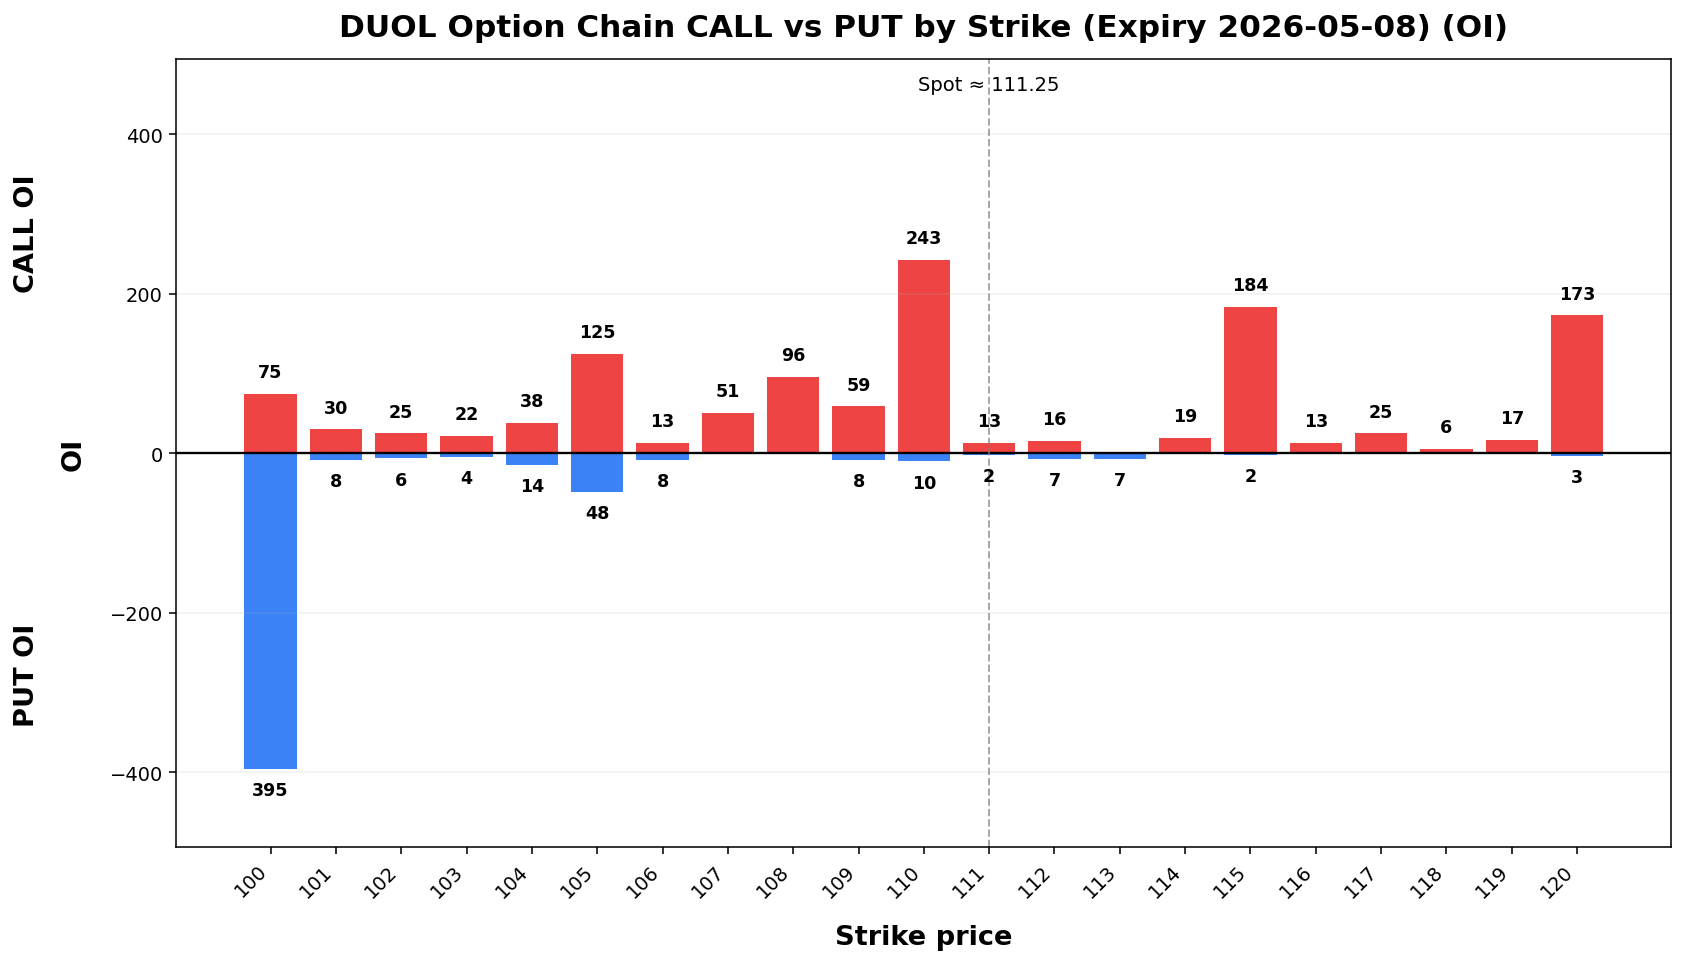
Term Structure
| Expiry |
DTE |
Forward |
ATM IV |
ATM Straddle |
| 2026-05-08 |
6 |
111.54 |
147.32% |
20.65 |
| 2026-05-15 |
13 |
111.85 |
107.32% |
22.35 |
Weekly Range
| Confidence |
Low |
High |
Width |
| 68% |
90.24 |
132.26 |
42.03 |
| 80% |
84.32 |
138.18 |
53.86 |
| 90% |
76.69 |
145.81 |
69.13 |
| 95% |
70.07 |
152.43 |
82.37 |
Structure & Probabilities
| Support |
Resistance |
Gamma Flip |
Max Pain |
P>Res |
P<Sup |
| 110.00 |
125.00 |
98.84 |
100.00 |
21.1% |
46.8% |
Flow & Skew
| Call Vol |
Put Vol |
Vol P/C |
Call OI |
Put OI |
OI P/C |
Skew |
Skew Bias |
| 1,066 |
4,681 |
4.39 |
2,818 |
2,860 |
1.01 |
3.52 vol pts |
PUT_SKEW |
Tail Risk
| Q10 |
Q50 |
Q90 |
Down Tail |
Up Tail |
Down/Up |
| 81.81 |
109.29 |
141.76 |
29.44 |
30.51 |
0.97 |
Daily Technicals
| EMA20 |
EMA50 |
VWAP20 |
BB Lower |
BB Mid |
BB Upper |
BB Width |
Vol Ratio |
Path |
| 102.98 |
108.27 |
99.98 |
87.46 |
100.47 |
113.49 |
25.91% |
1.09 |
Sideways / Range |
Day Plan
- 110.00-125.00 range: fade extremes
- > 125.00: chase only if hold + vol
- < 110.00: risk expand; reduce size
- Regime: TRANSITION
- Tech: Sideways / Range
Swing Plan
- Accumulate: 110.00-110.00
- Trim: 125.00-125.00
- Add: close > 125.00
- Cut: close < 110.00
- Best for: transition regime
Raw Text Summary
📌 DUOL @ 111.25 (2026-05-03 08:50 AM MYT)

• Current price is **111.25**. Key support is around **110.00**, and resistance is around **125.00**.
• For the next week, the model’s **68% expected range** is roughly **90.24 to 132.26**.
• A wider **90% range** is about **76.69 to 145.81**.
• Dealer positioning looks **LONG gamma**, so the market behavior is classified as **TRANSITION**.
• The estimated **gamma flip** is near **98.84**. Crossing and holding beyond this area can change the trading behavior.
• Approximate breakout odds: **above resistance 21.1%**, **below support 46.8%** by the target horizon.
• Options skew is tilted toward **puts**, which suggests traders are paying more for downside protection.
• Near-term implied volatility is higher than the next expiry (**IV1 147.32% vs IV2 107.32%**), which suggests **near-term event stress / backwardation**.
• On the daily chart, the stock currently looks like **Sideways / Range**.
• The implied distribution is **fairly balanced** between upside and downside tails.