Analysis Report
Updated: 2026-03-12 19:34:0321:29:20 MYT
Source File: combined-summary-20260312-191635.212718.md
Screening Source:
screen-report-20260312-154220.mdExtracted Symbols: AXTI, AAOI
US Stocks Screening Report (2 symbols)
Generated: 2026-03-12 07:16 PM MYT
Topline Summary
| Symbol | Spot | Support | Resistance | Flip | Regime | P>Res | P<Sup | 68% Range | 90% Range |
|---|---|---|---|---|---|---|---|---|---|
| AXTI | 47.36 | 45.00 | TREND | 53. |
37. |
31. |
|||
| AAOI | 127.01 | TREND | 105. |
91. |
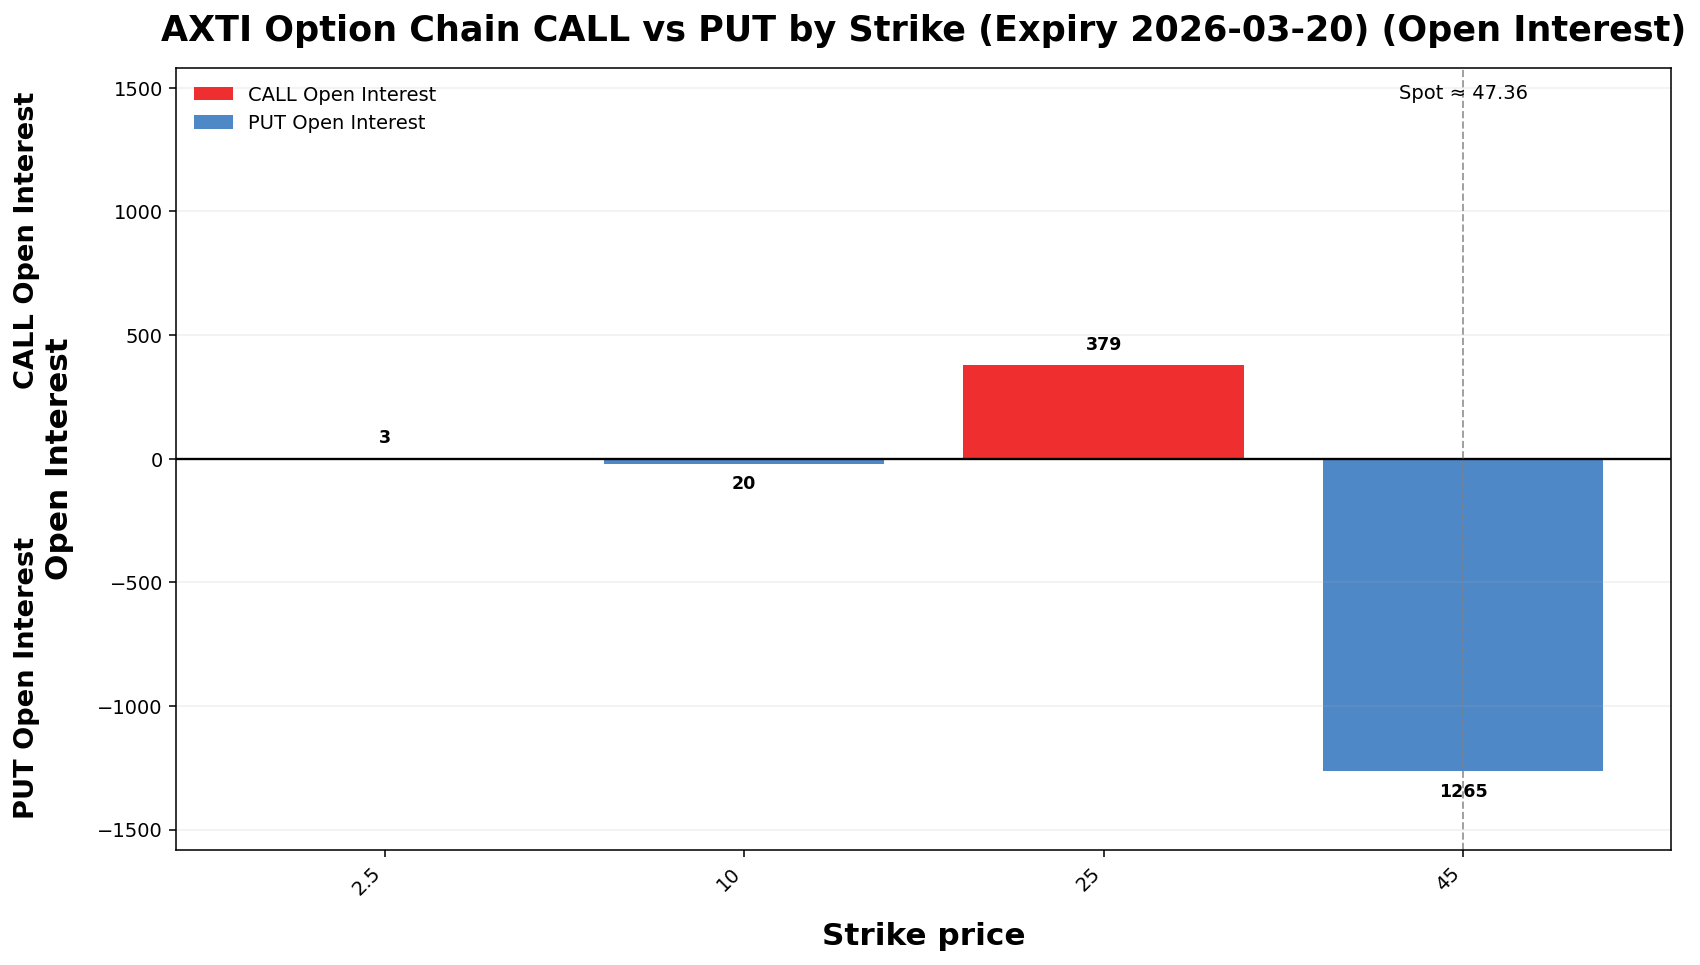
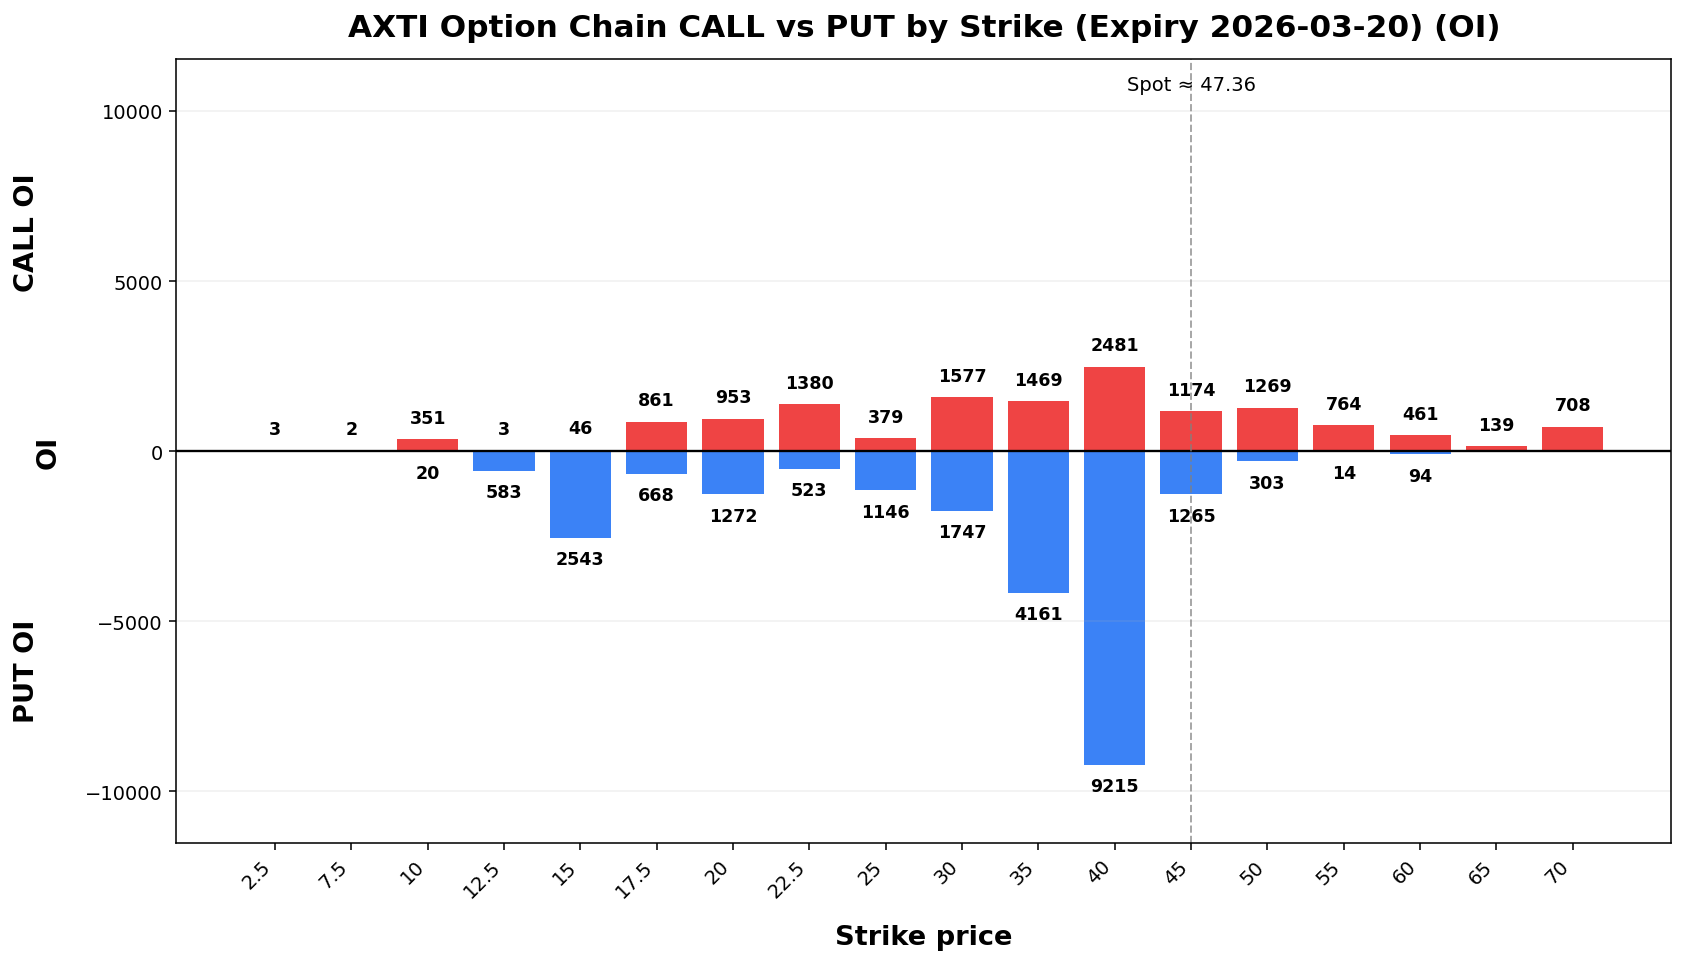
AXTI
Spot: 47.36
Report Time: 2026-03-12 07:1609:27 PM MYT
Regime: TREND
Dealer Gamma: SHORT
Term Structure
| Expiry | DTE | Forward | ATM IV | ATM Straddle |
|---|---|---|---|---|
| 2026-03-20 | 9 | 47.29 | 10.00 | |
| 2026-04-17 | 37 | 46.72 | 128. |
19.20 |
Weekly Range
| Confidence | Low | High | Width |
|---|---|---|---|
| 68% | 37. |
56. |
18. |
| 80% | 35. |
59. |
24. |
| 90% | 31. |
62. |
31. |
| 95% | 28. |
65. |
37. |
Structure & Probabilities
| Support | Resistance | Gamma Flip | Max Pain | P>Res | P<Sup | ||
|---|---|---|---|---|---|---|---|
| 45.00 | 40.00 | 43.4% | 53. |
Flow & Skew
| Call Vol | Put Vol | Vol P/C | Call OI | Put OI | OI P/C | Skew | Skew Bias |
|---|---|---|---|---|---|---|---|
| 4,006 | 11,789 | 2.94 | 37.50 vol pts | PUT_SKEW |
Tail Risk
| Q10 | Q50 | Q90 | Down Tail | Up Tail | Down/Up |
|---|---|---|---|---|---|
| 5.62 | 8.09 | 55.48 | 41.74 | 8.12 | 5.14 |
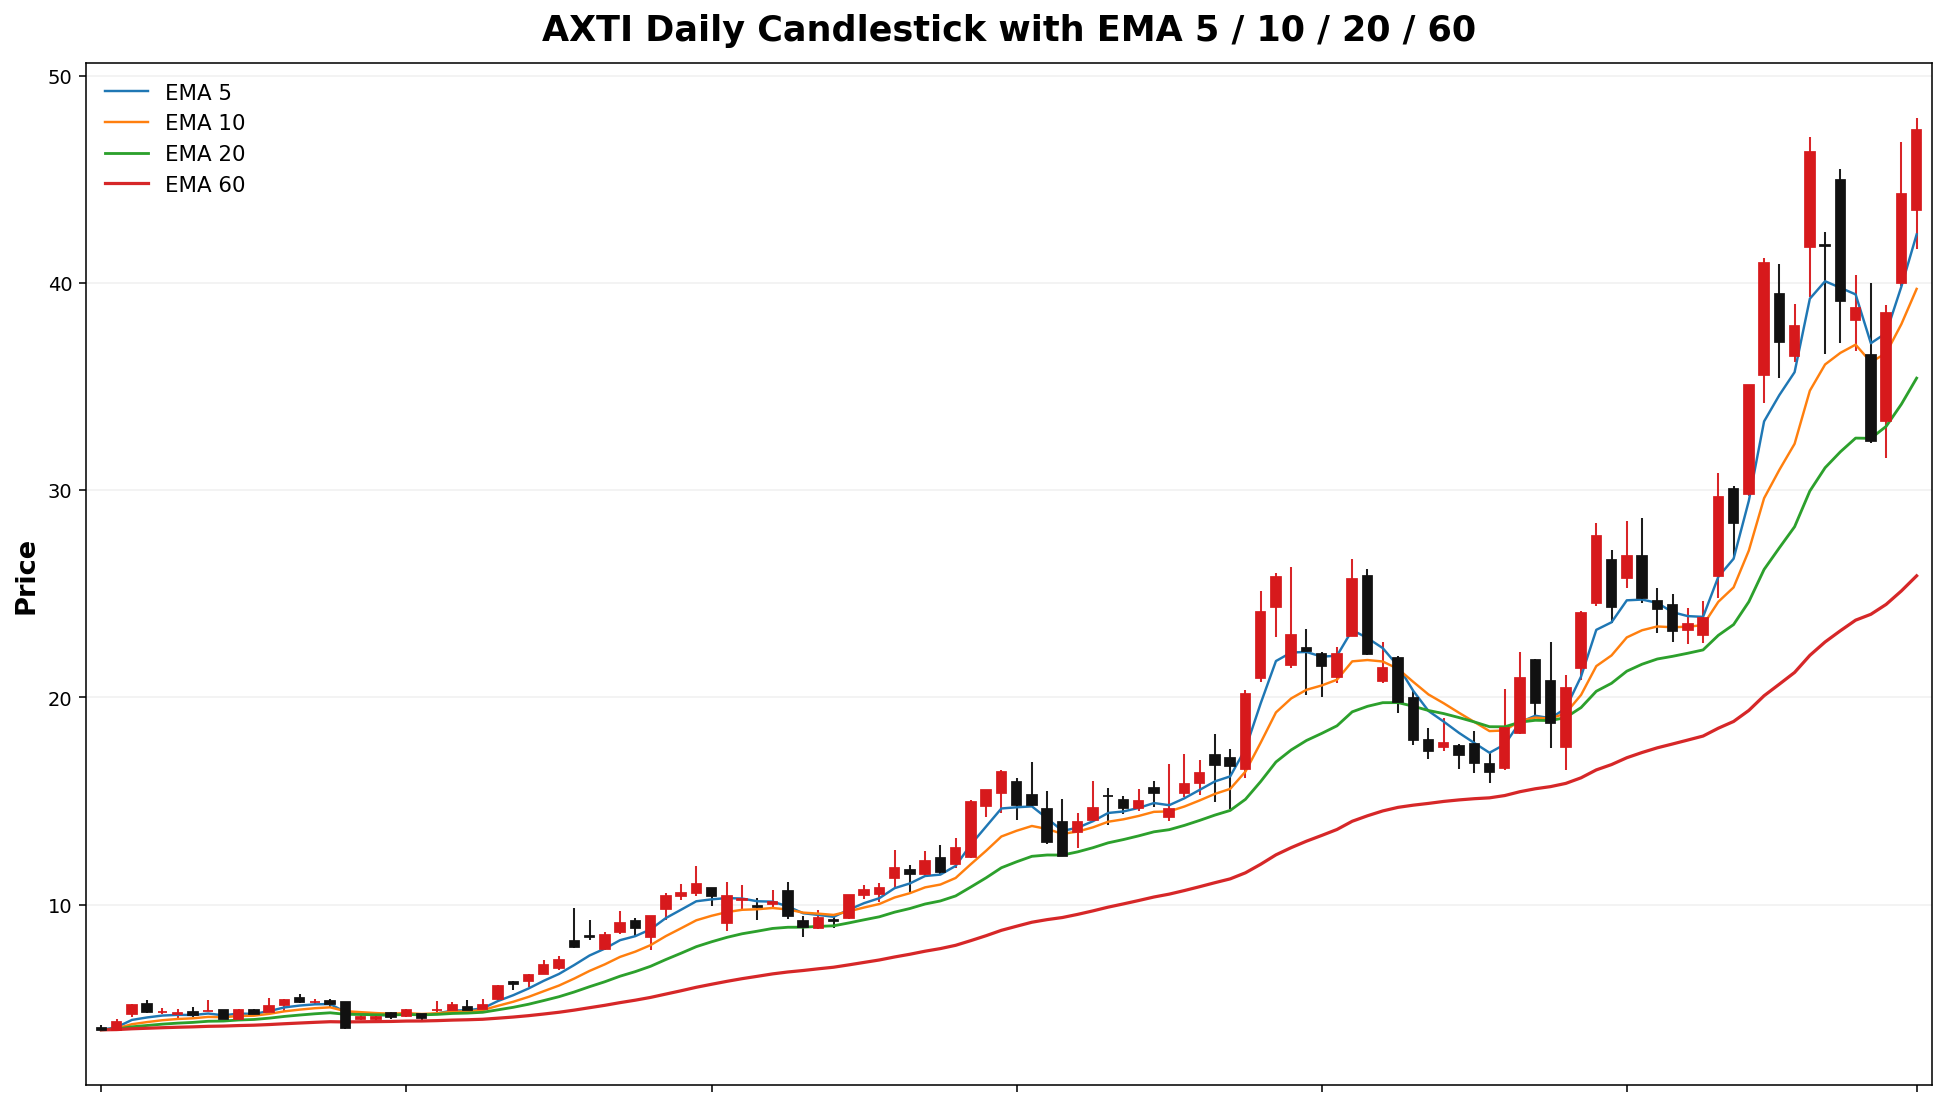
Daily Technicals
| EMA20 | EMA50 | VWAP20 | BB Lower | BB Mid | BB Upper | BB Width | Vol Ratio | Path |
|---|---|---|---|---|---|---|---|---|
| 35.40 | 27.59 | 35.97 | 17.96 | 34.21 | 50.46 | 95.01% | 1.26 | UP trend (expanding) |
Day Plan
- 45.00-
56.8150.00 range: fade extremes - >
56.81:50.00: chase only if hold + vol - < 45.00: risk expand; reduce size
- Regime: TREND
- Tech: UP trend (expanding)
Swing Plan
- Accumulate: 45.00-45.00
- Trim:
56.81-56.8150.00-50.00 - Add: close >
56.8150.00 - Cut: close < 45.00
- Best for: trend regime
Raw Text Summary
📌 AXTI @ 47.36 (2026-03-12 07:1609:27 PM MYT)

• Current price is **47.36**. Key support is around **45.00**, and resistance is around **56.81*50.00**.
• For the next week, the model’s **68% expected range** is roughly **37.9186 to 56.81*86**.
• A wider **90% range** is about **31.8274 to 62.90*98**.
• Dealer positioning looks **SHORT gamma**, so the market behavior is classified as **TREND**.
• The estimated **gamma flip** is near **46.70**. Crossing and holding beyond this area can change the trading behavior.
• Approximate breakout odds: **above resistance 17.6%43.4%**, **below support 53.3%4%** by the target horizon.
• Options skew is tilted toward **puts**, which suggests traders are paying more for downside protection.
• Near-term implied volatility is higher than the next expiry (**IV1 139.54%140.30% vs IV2 128.48%65%**), which suggests **near-term event stress / backwardation**.
• On the daily chart, the stock currently looks like **UP trend (expanding)**.
• The implied distribution shows **heavier downside tail risk** than upside tail potential.
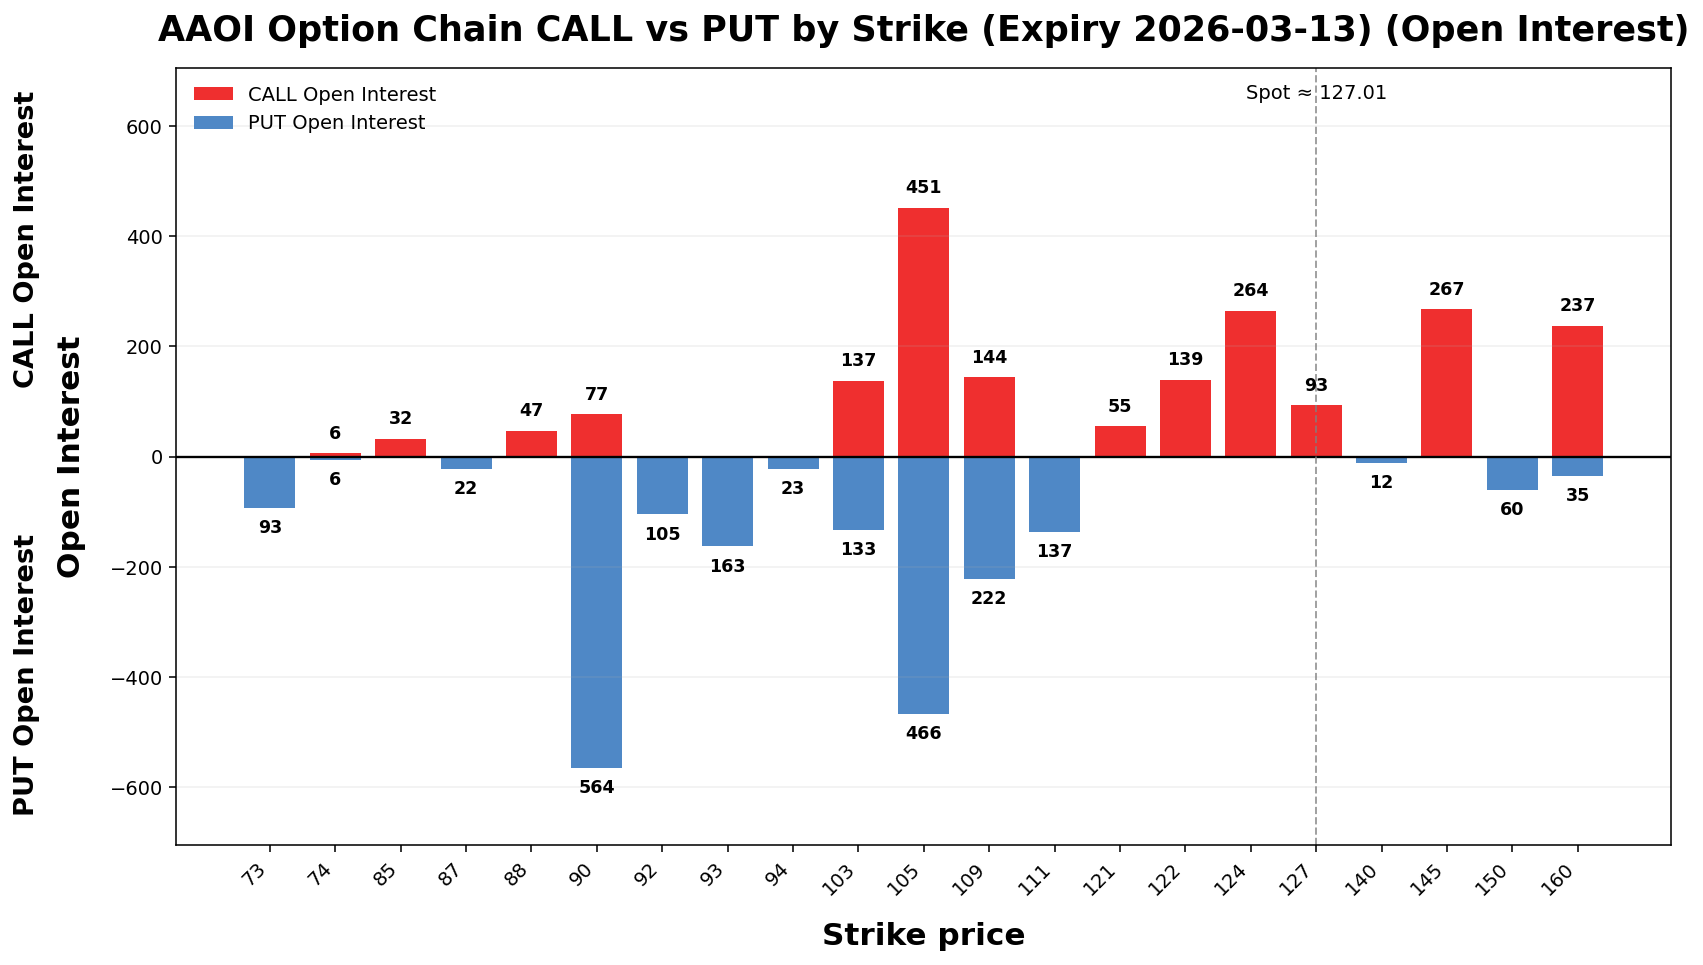
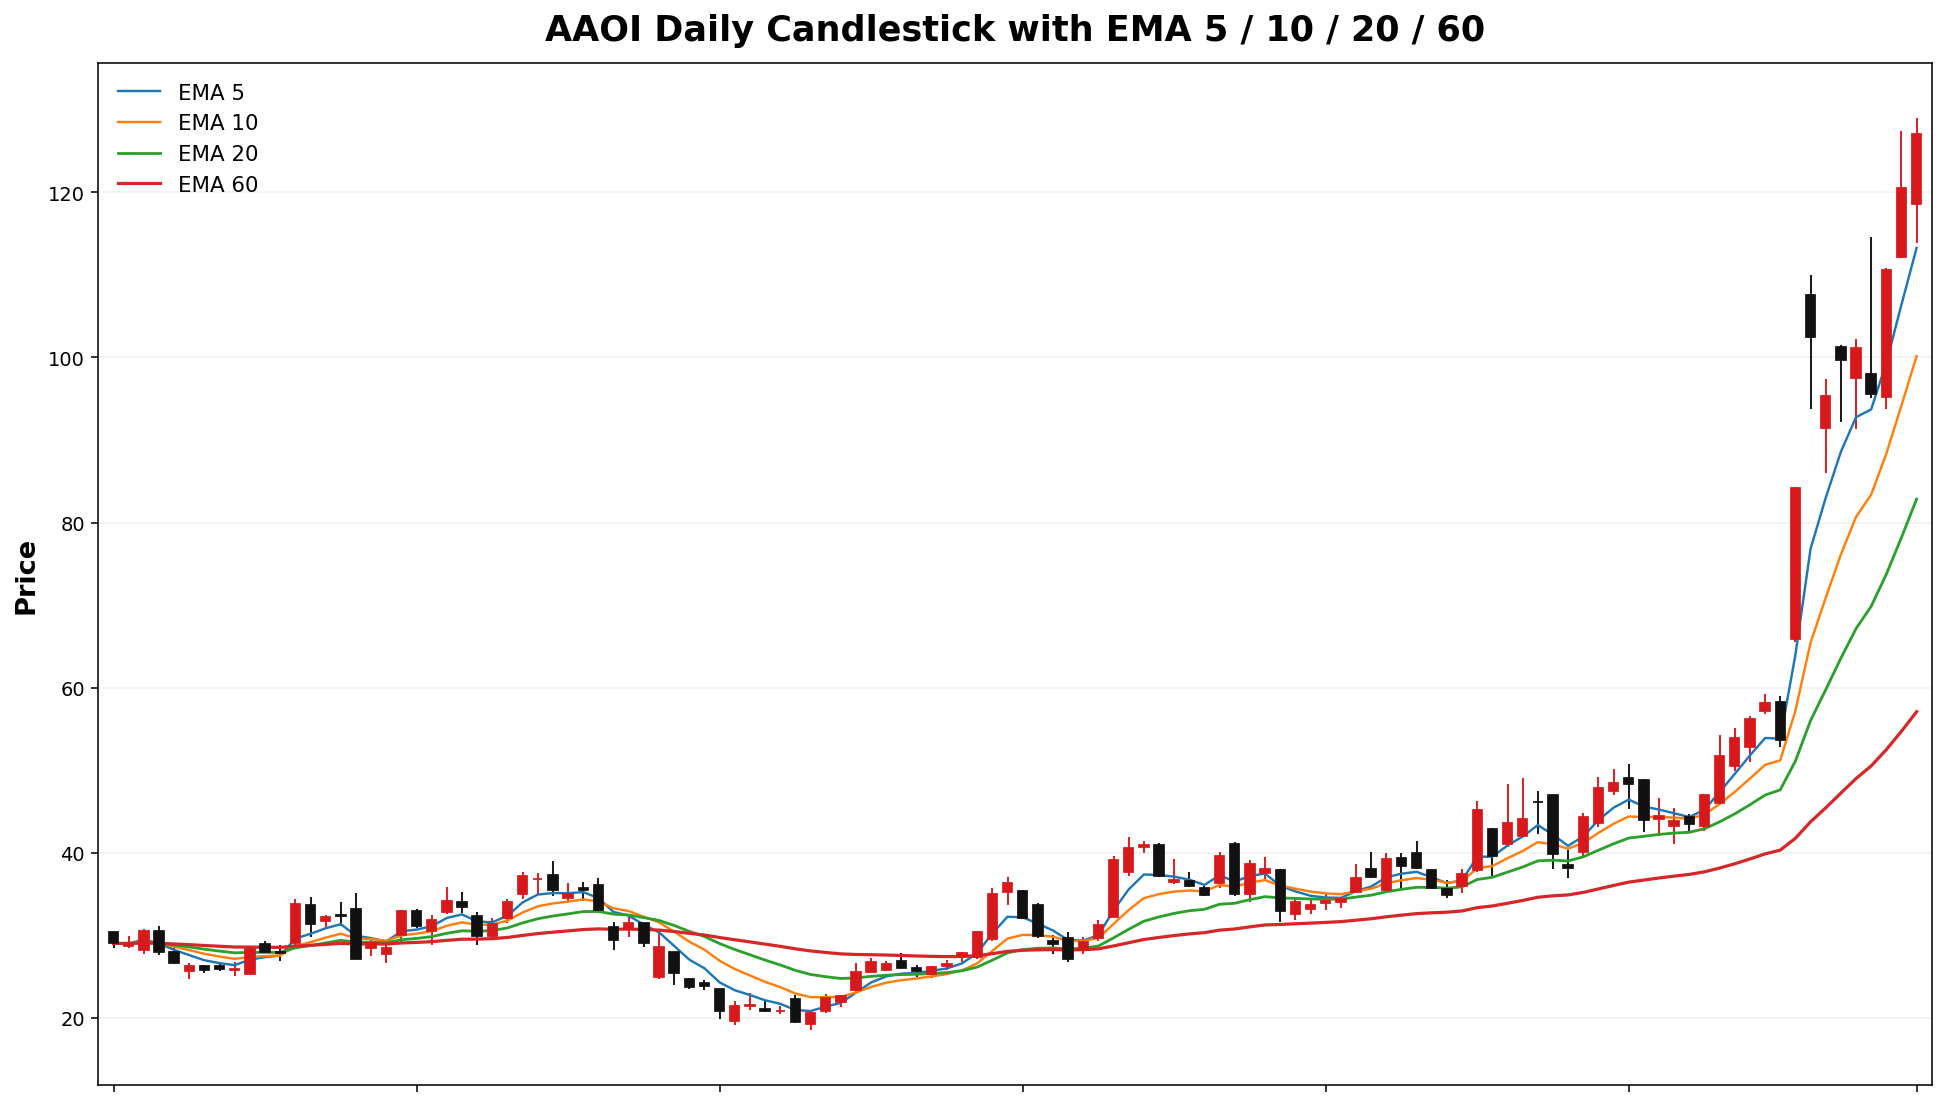
AAOI
Spot: 127.01
Report Time: 2026-03-12 07:1609:27 PM MYT
Regime: TREND
Dealer Gamma: SHORT
Term Structure
| Expiry | DTE | Forward | ATM IV | ATM Straddle |
|---|---|---|---|---|
| 2026-03-13 | 2 | 125.95 | 11.65 | |
| 2026-03-20 | 9 | 125.84 | 119. |
22.90 |
Weekly Range
| Confidence | Low | High | Width |
|---|---|---|---|
| 68% | 105. |
148. |
43. |
| 80% | 99. |
154. |
55. |
| 90% | 91. |
162. |
|
| 95% | 84. |
169. |
84. |
Structure & Probabilities
| Support | Resistance | Gamma Flip | Max Pain | P>Res | P<Sup |
|---|---|---|---|---|---|
| 19.00 |
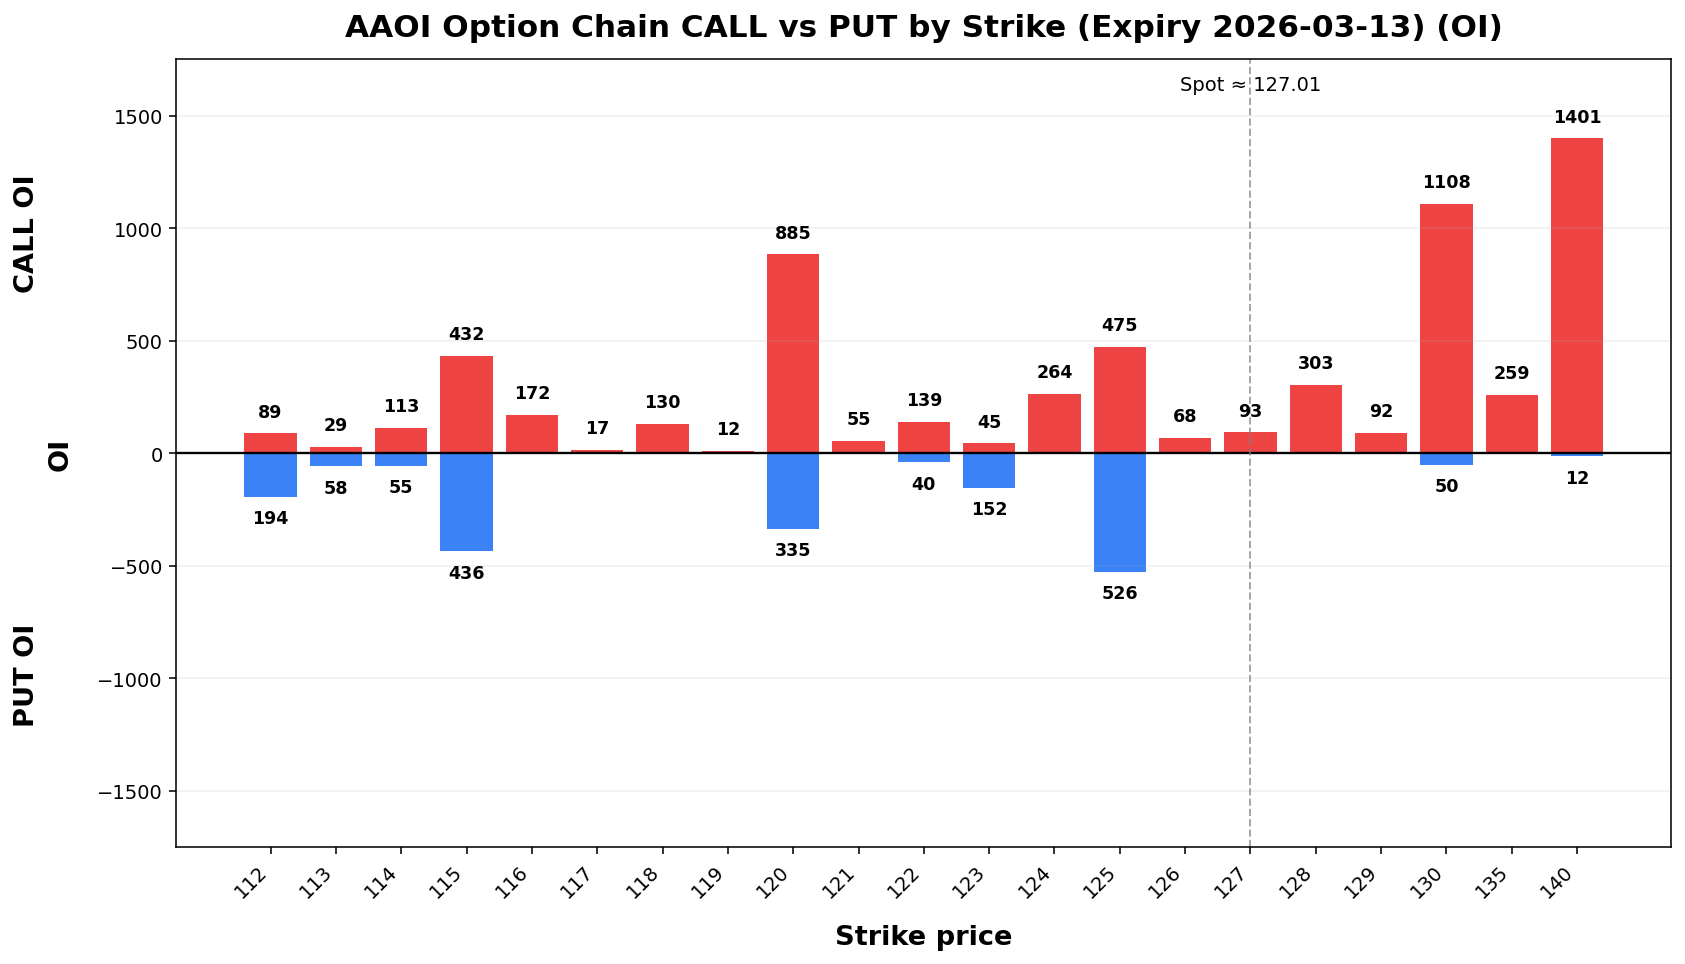
Flow & Skew
| Call Vol | Put Vol | Vol P/C | Call OI | Put OI | OI P/C | Skew | Skew Bias |
|---|---|---|---|---|---|---|---|
| 9,982 | 5,929 | 0.59 | 1. |
263.23 vol pts | PUT_SKEW |
Tail Risk
| Q10 | Q50 | Q90 | Down Tail | Up Tail | Down/Up |
|---|---|---|---|---|---|
| 40.74 | 65.94 | 129.97 | 86.27 | 2.96 | 29.13 |
Daily Technicals
| EMA20 | EMA50 | VWAP20 | BB Lower | BB Mid | BB Upper | BB Width | Vol Ratio | Path |
|---|---|---|---|---|---|---|---|---|
| 82.84 | 60.79 | 87.54 | 15.27 | 74.08 | 132.88 | 158.77% | 1.08 | UP trend (expanding) |
Day Plan
124.125.00-145.130.00 range: fade extremes- >
145.130.00: chase only if hold + vol - <
124.125.00: risk expand; reduce size - Regime: TREND
- Tech: UP trend (expanding)
Swing Plan
- Accumulate:
124.125.00-124.125.00 - Trim:
145.130.00-145.130.00 - Add: close >
145.130.00 - Cut: close <
124.125.00 - Best for: trend regime
- Bias: downside break risk elevated
Raw Text Summary
📌 AAOI @ 127.01 (2026-03-12 07:1609:27 PM MYT)

• Current price is **127.01**. Key support is around **124.125.00**, and resistance is around **145.130.00**.
• For the next week, the model’s **68% expected range** is roughly **105.5139 to 148.51*63**.
• A wider **90% range** is about **91.6445 to 162.38*57**.
• Dealer positioning looks **SHORT gamma**, so the market behavior is classified as **TREND**.
• The estimated **gamma flip** is near **126.54*127.01**. Crossing and holding beyond this area can change the trading behavior.
• Approximate breakout odds: **above resistance 22.49.4%**, **below support 59.0%61.5%** by the target horizon.
• Options skew is tilted toward **puts**, which suggests traders are paying more for downside protection.
• Near-term implied volatility is higher than the next expiry (**IV1 150.13%155.39% vs IV2 119.15%80%**), which suggests **near-term event stress / backwardation**.
• On the daily chart, the stock currently looks like **UP trend (expanding)**.
• The implied distribution shows **heavier downside tail risk** than upside tail potential.