Analysis Report
Updated: 2026-03-1315 15:42:3908:43:34 MYT
Source File: combined-summary-20260313-154239.20260315-084334.md
Screening Source: screen-report-20260313-154225.20260315-084243.md
Extracted Symbols: MULL, AAOI, UCO, CRCA, UVXY, AXTI, AAOIUSO, TERN
Topline Summary
| Symbol |
Spot |
Support |
Resistance |
Flip |
Regime |
P>Res |
P<Sup |
68% Range |
90% Range |
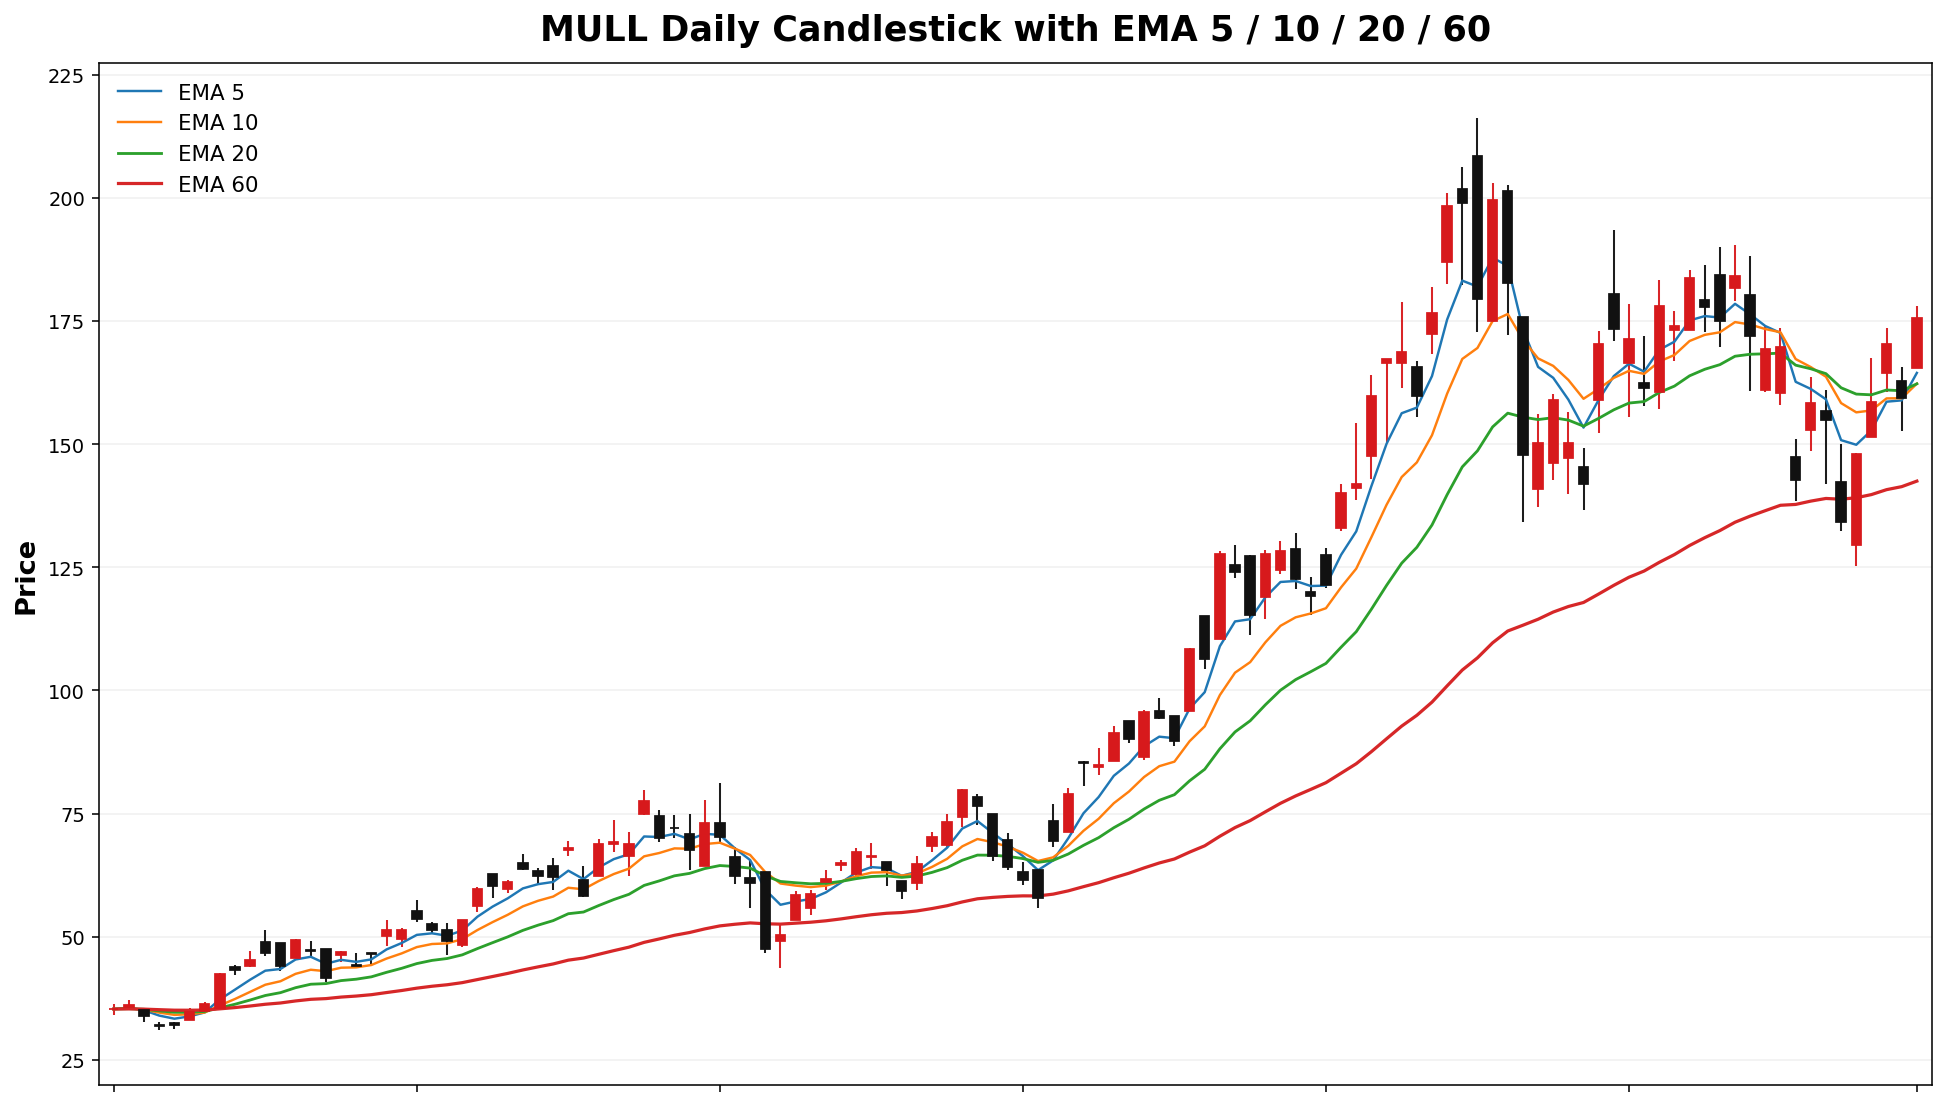
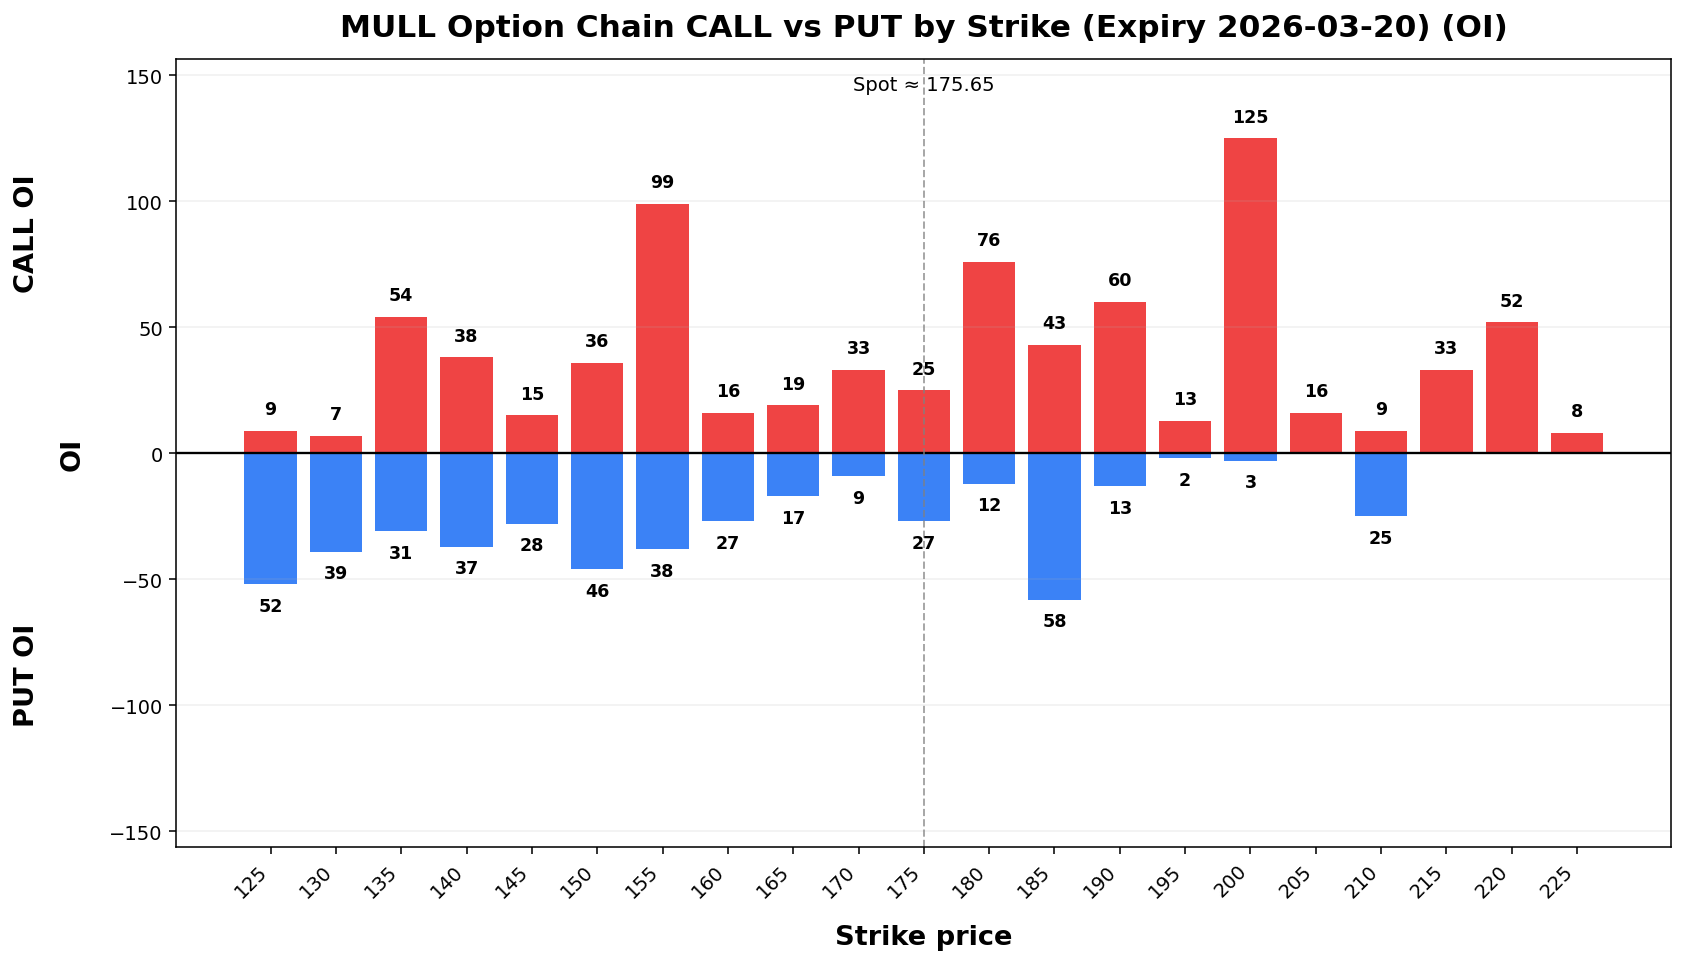
AXTIMULL |
46.73175.65 |
37.56155.00 |
55.90180.00 |
23.36137.70 |
TRANSITIONTREND |
16.7%50.5% |
16.7%39.0% |
37.56137.64 - 55.90213.66 |
31.65113.14 - 61.81238.16 |
| AAOI |
106.1996.81 |
90.00 |
120.00 |
85.59 |
TREND |
9.3% |
45.5% |
80.5604 - 113.58 |
131.8269.23 - 124.39 |
| UCO |
53.1040.26 |
40.00 |
45.00 |
20.31 |
TRANSITION |
15.29.6% |
40.1% |
31.14 - 49.38 |
25.25 - 55.27 |
| CRCA |
67.11 |
20.00 |
70.00 |
42.11 |
TRANSITION |
31.1% |
0.0% |
54.76 - 79.46 |
46.80 - 87.42 |
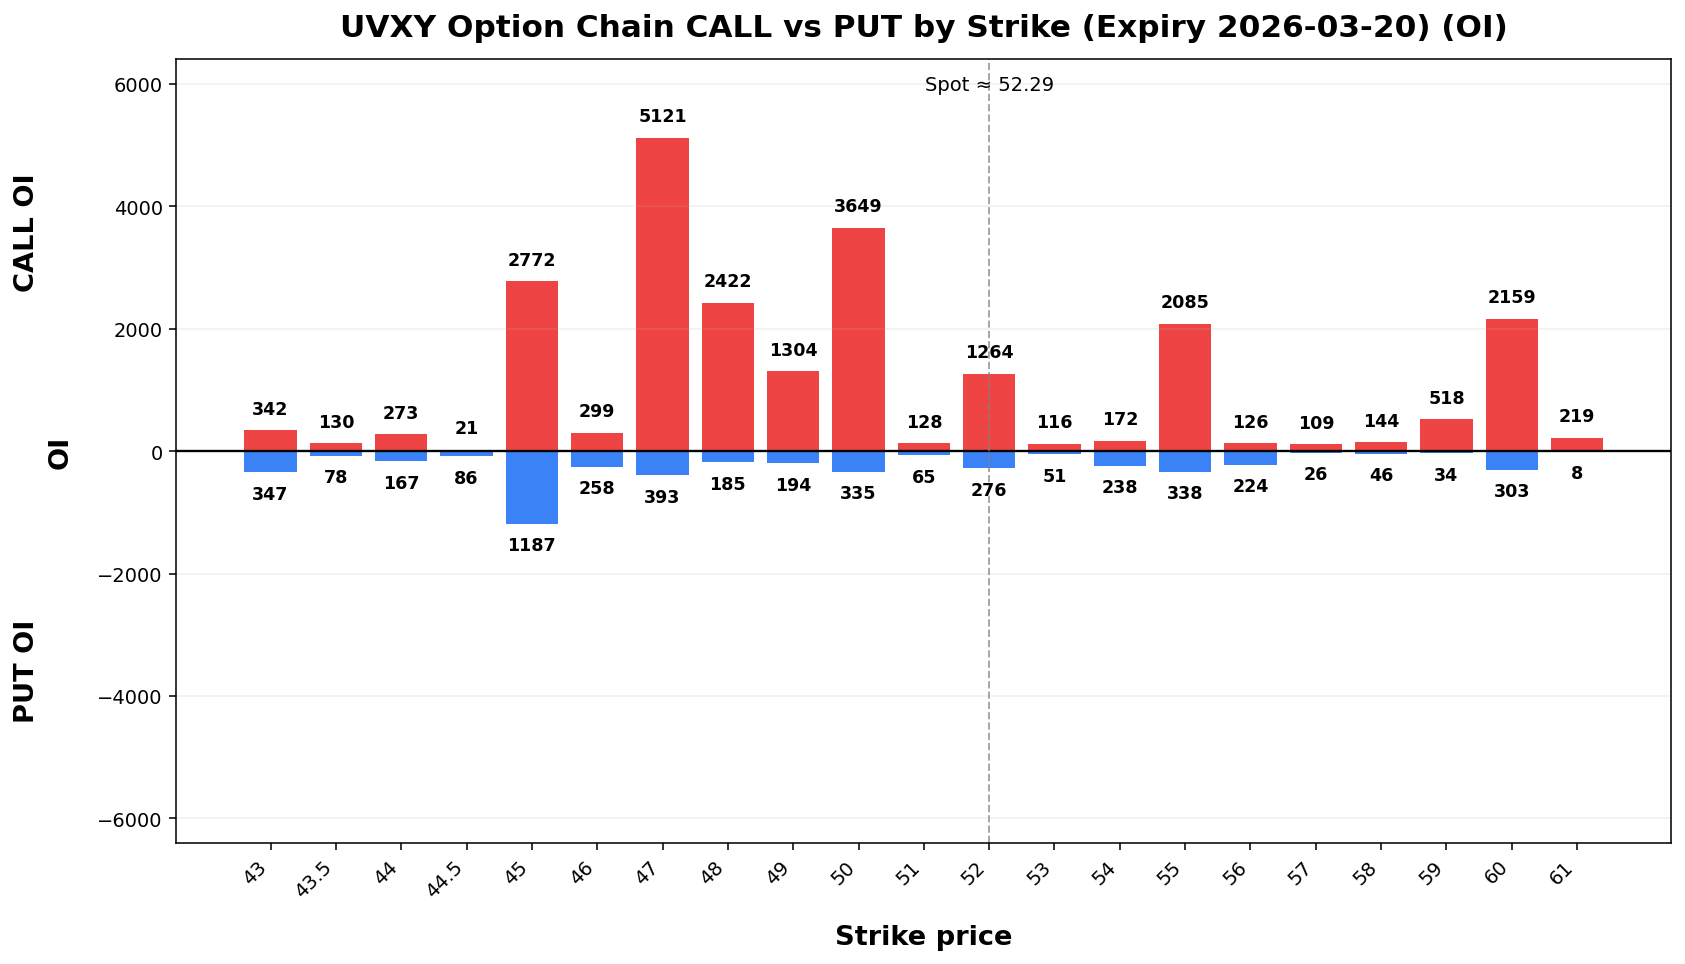
| UVXY |
52.29 |
50.00 |
55.00 |
33.64 |
TRANSITION |
32.6% |
28.5% |
42.50 - 62.08 |
36.19 - 68.39 |
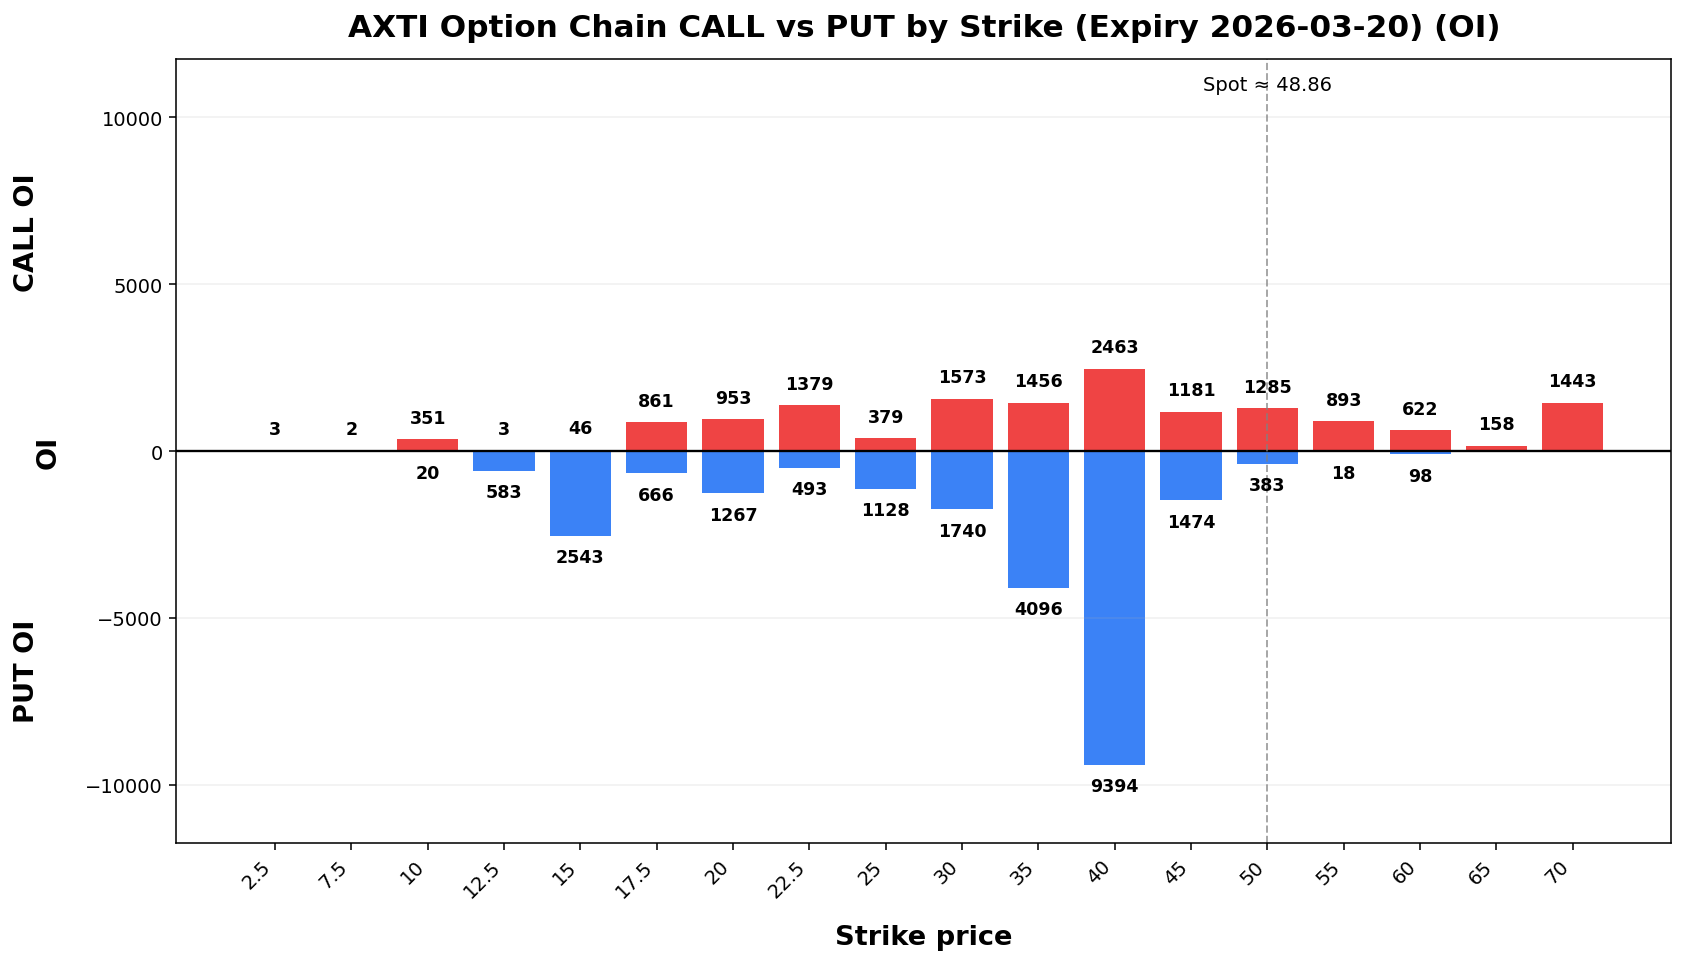
| AXTI |
48.86 |
45.00 |
50.00 |
53.12 |
TRANSITION |
44.5% |
28.3% |
39.20 - 58.52 |
32.98 - 64.74 |
| USO |
119.89 |
112.00 |
125.00 |
108.70 |
TRANSITION |
29.7% |
18.30.7% |
100.48 - 139.30 |
87.96 - 151.82 |
| TERN |
46.52 |
45.00 |
55.00 |
44.71 |
TRANSITION |
11.8% |
80.5646.1% |
39.05 - 131.8253.99 |
64.0334.23 - 148.3558.81 |
AXTIMULL
Spot: 46.73175.65
Report Time: 2026-03-1315 03:08:42 PMAM MYT
Regime: TRANSITIONTREND
Dealer Gamma: NEUTRALSHORT
Term Structure
| Expiry |
DTE |
Forward |
ATM IV |
ATM Straddle |
| 2026-03-20 |
86 |
47.05174.85 |
138.77%164.40% |
9.3036.40 |
| 2026-04-17 |
3634 |
46.66174.56 |
127.51%112.94% |
18.5860.35 |
Weekly Range
| Confidence |
Low |
High |
Width |
| 68% |
37.56137.64 |
55.90213.66 |
18.3376.01 |
| 80% |
34.98126.94 |
58.48224.36 |
23.5097.41 |
| 90% |
31.65113.14 |
61.81238.16 |
30.16125.03 |
| 95% |
28.76101.16 |
64.70250.14 |
35.94148.98 |
Structure & Probabilities
| Support |
Resistance |
Gamma Flip |
Max Pain |
P>Res |
P<Sup |
37.56155.00 |
55.90180.00 |
23.36137.70 |
2.509.65 |
16.7%50.5% |
16.7%39.0% |
Flow & Skew
| Call Vol |
Put Vol |
Vol P/C |
Call OI |
Put OI |
OI P/C |
Skew |
Skew Bias |
5,269938 |
2,864598 |
0.5464 |
01,702 |
0 |
NA1,329 |
0.0078 |
21.83 vol pts |
FLATPUT_SKEW |
Tail Risk
| Q10 |
Q50 |
Q90 |
Down Tail |
Up Tail |
Down/Up |
5.639.75 |
8.1710.16 |
54.7210.57 |
41.10165.90 |
7.990.00 |
5.14NA |
Daily Technicals
| EMA20 |
EMA50 |
VWAP20 |
BB Lower |
BB Mid |
BB Upper |
BB Width |
Vol Ratio |
Path |
36.48162.27 |
28.34148.39 |
37.18164.47 |
18.43139.03 |
35.21165.97 |
51.98192.90 |
95.29%32.46% |
1.330.96 |
UP trend (expanding) |
Day Plan
37.56-55.90155.00-180.00 range: fade extremes- >
55.90:180.00: chase only if hold + vol
- <
37.56:155.00: risk expand; reduce size
- Regime:
TRANSITIONTREND
- Tech: UP trend (expanding)
Swing Plan
- Accumulate:
37.56-37.56155.00-155.00
- Trim:
55.90-55.90180.00-180.00
- Add: close >
55.90180.00
- Cut: close <
37.56155.00
- Best for:
transitiontrend regime
Raw Text Summary
📌 AXTIMULL @ 46.73175.65 (2026-03-1315 03:08:42 PMAM MYT)

• Current price is **46.73*175.65**. Key support is around **37.56*155.00**, and resistance is around **55.90*180.00**.
• For the next week, the model’s **68% expected range** is roughly **37.56137.64 to 55.90*213.66**.
• A wider **90% range** is about **31.65113.14 to 61.81*238.16**.
• Dealer positioning looks **NEUTRALSHORT gamma**, so the market behavior is classified as **TRANSITION*TREND**.
• The estimated **gamma flip** is near **23.36*137.70**. Crossing and holding beyond this area can change the trading behavior.
• Approximate breakout odds: **above resistance 16.7%50.5%**, **below support 16.7%39.0%** by the target horizon.
• Options skew is fairlytilted balanced, so there istoward **noputs**, strongwhich directionalsuggests bias**traders fromare skewpaying alone.more for downside protection.
• Near-term implied volatility is higher than the next expiry (**IV1 138.77%164.40% vs IV2 112.94%**), which suggests **near-term event stress / backwardation**.
• On the daily chart, the stock currently looks like **UP trend (expanding)**.
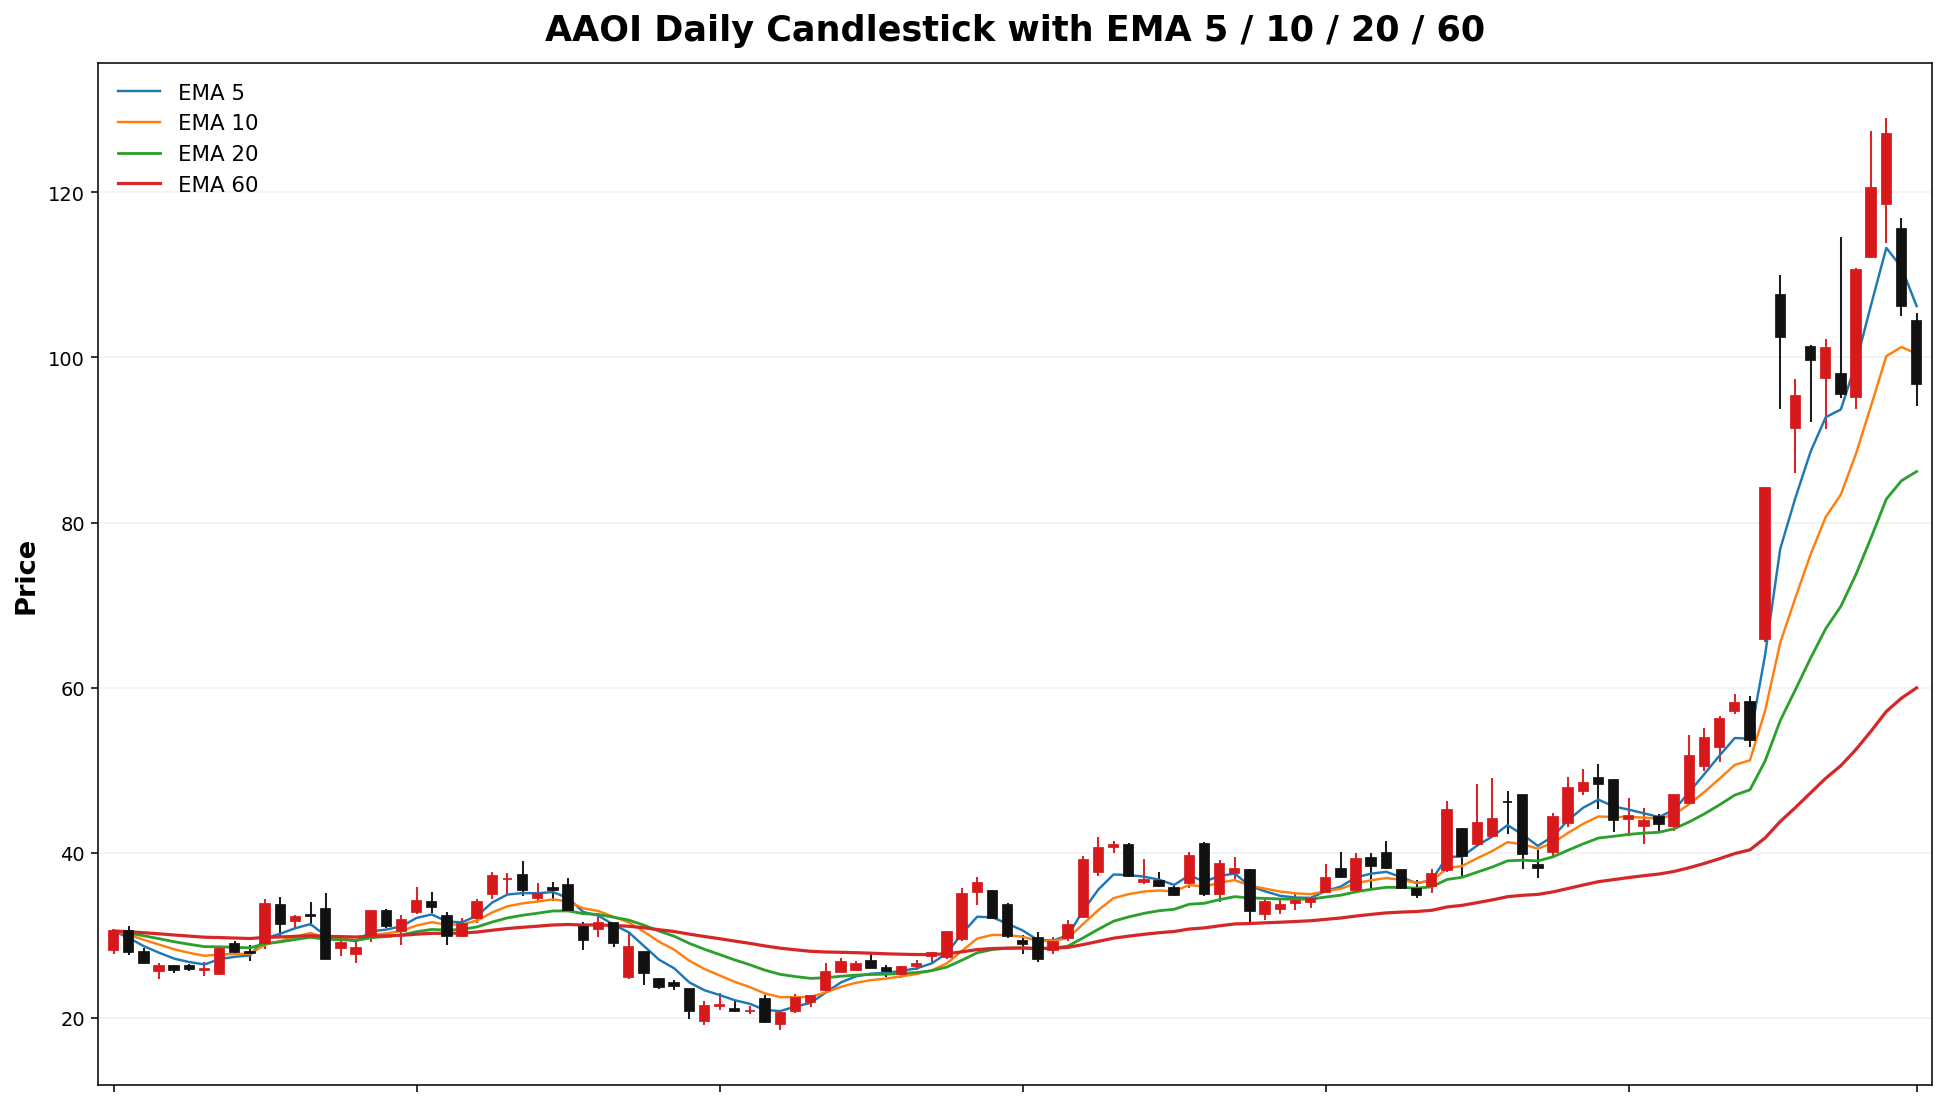
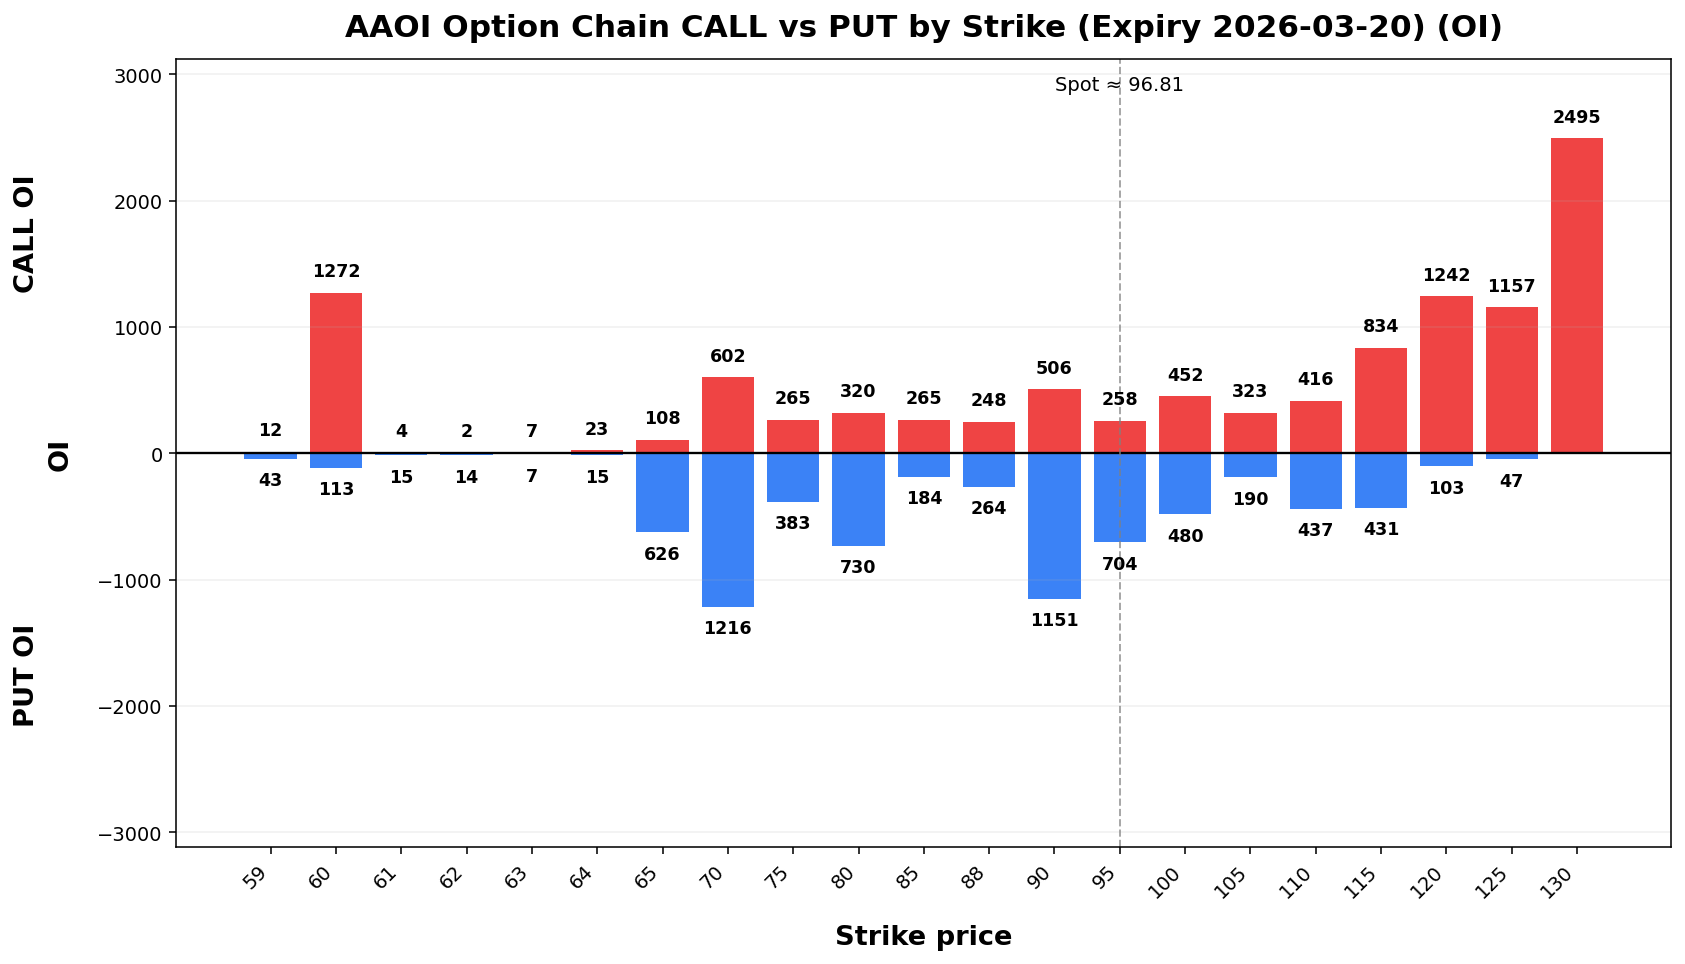
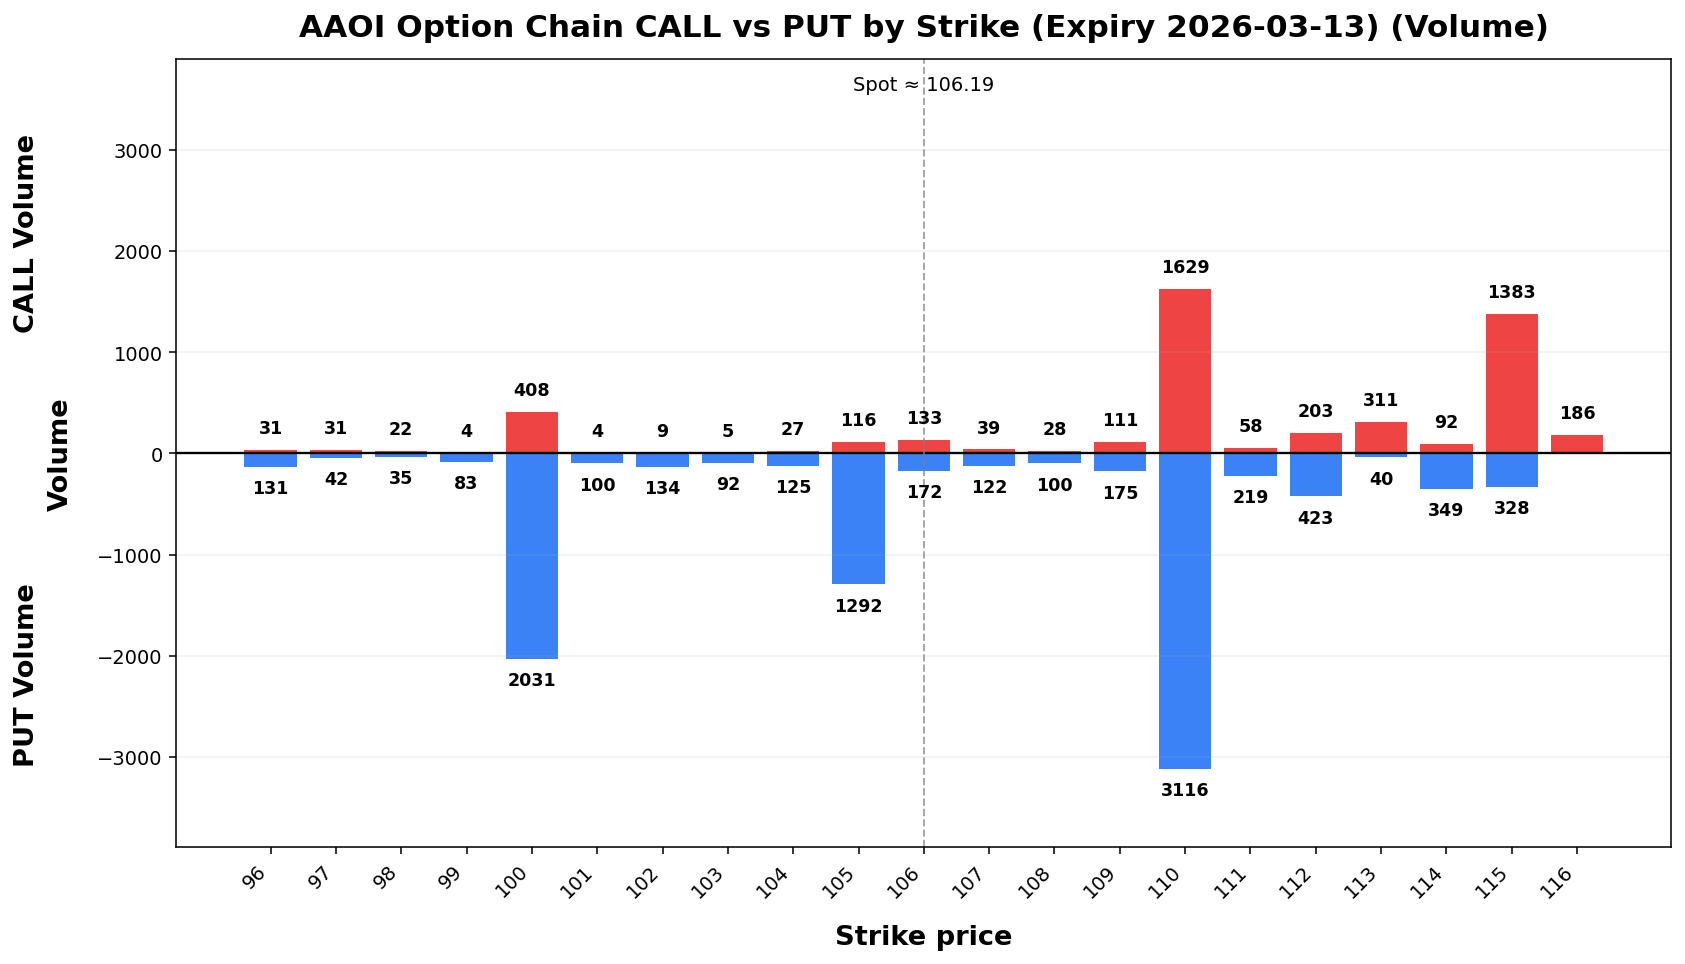
AAOI
Spot: 96.81
Report Time: 2026-03-15 08:42 AM MYT
Regime: TREND
Dealer Gamma: SHORT
Term Structure
| Expiry |
DTE |
Forward |
ATM IV |
ATM Straddle |
| 2026-03-20 |
6 |
104.50 |
130.29% |
15.90 |
| 2026-03-27 |
13 |
99.63 |
108.96% |
19.75 |
Weekly Range
| Confidence |
Low |
High |
Width |
| 68% |
80.04 |
113.58 |
33.53 |
| 80% |
75.32 |
118.30 |
42.97 |
| 90% |
69.23 |
124.39 |
55.16 |
| 95% |
63.95 |
129.67 |
65.72 |
Structure & Probabilities
| Support |
Resistance |
Gamma Flip |
Max Pain |
P>Res |
P<Sup |
| 90.00 |
120.00 |
85.59 |
1.00 |
9.3% |
45.5% |
Flow & Skew
| Call Vol |
Put Vol |
Vol P/C |
Call OI |
Put OI |
OI P/C |
Skew |
Skew Bias |
| 11,537 |
4,641 |
0.40 |
30,176 |
26,709 |
0.89 |
12.79 vol pts |
PUT_SKEW |
Tail Risk
| Q10 |
Q50 |
Q90 |
Down Tail |
Up Tail |
Down/Up |
| 12.34 |
13.71 |
127.51%14 |
84.47 |
30.33 |
2.79 |
Daily Technicals
| EMA20 |
EMA50 |
VWAP20 |
BB Lower |
BB Mid |
BB Upper |
BB Width |
Vol Ratio |
Path |
| 86.18 |
63.92 |
91.43 |
21.94 |
79.61 |
137.28 |
144.88% |
1.40 |
UP trend (expanding) |
Day Plan
- 90.00-120.00 range: fade extremes
- > 120.00: chase only if hold + vol
- < 90.00: risk expand; reduce size
- Regime: TREND
- Tech: UP trend (expanding)
Swing Plan
- Accumulate: 90.00-90.00
- Trim: 120.00-120.00
- Add: close > 120.00
- Cut: close < 90.00
- Best for: trend regime
Raw Text Summary
📌 AAOI @ 96.81 (2026-03-15 08:42 AM MYT)

• Current price is **96.81**. Key support is around **90.00**, and resistance is around **120.00**.
• For the next week, the model’s **68% expected range** is roughly **80.04 to 113.58**.
• A wider **90% range** is about **69.23 to 124.39**.
• Dealer positioning looks **SHORT gamma**, so the market behavior is classified as **TREND**.
• The estimated **gamma flip** is near **85.59**. Crossing and holding beyond this area can change the trading behavior.
• Approximate breakout odds: **above resistance 9.3%**, **below support 45.5%** by the target horizon.
• Options skew is tilted toward **puts**, which suggests traders are paying more for downside protection.
• Near-term implied volatility is higher than the next expiry (**IV1 130.29% vs IV2 108.96%**), which suggests **near-term event stress / backwardation**.
• On the daily chart, the stock currently looks like **UP trend (expanding)**.
• The implied distribution shows **heavier downside tail risk** than upside tail potential.
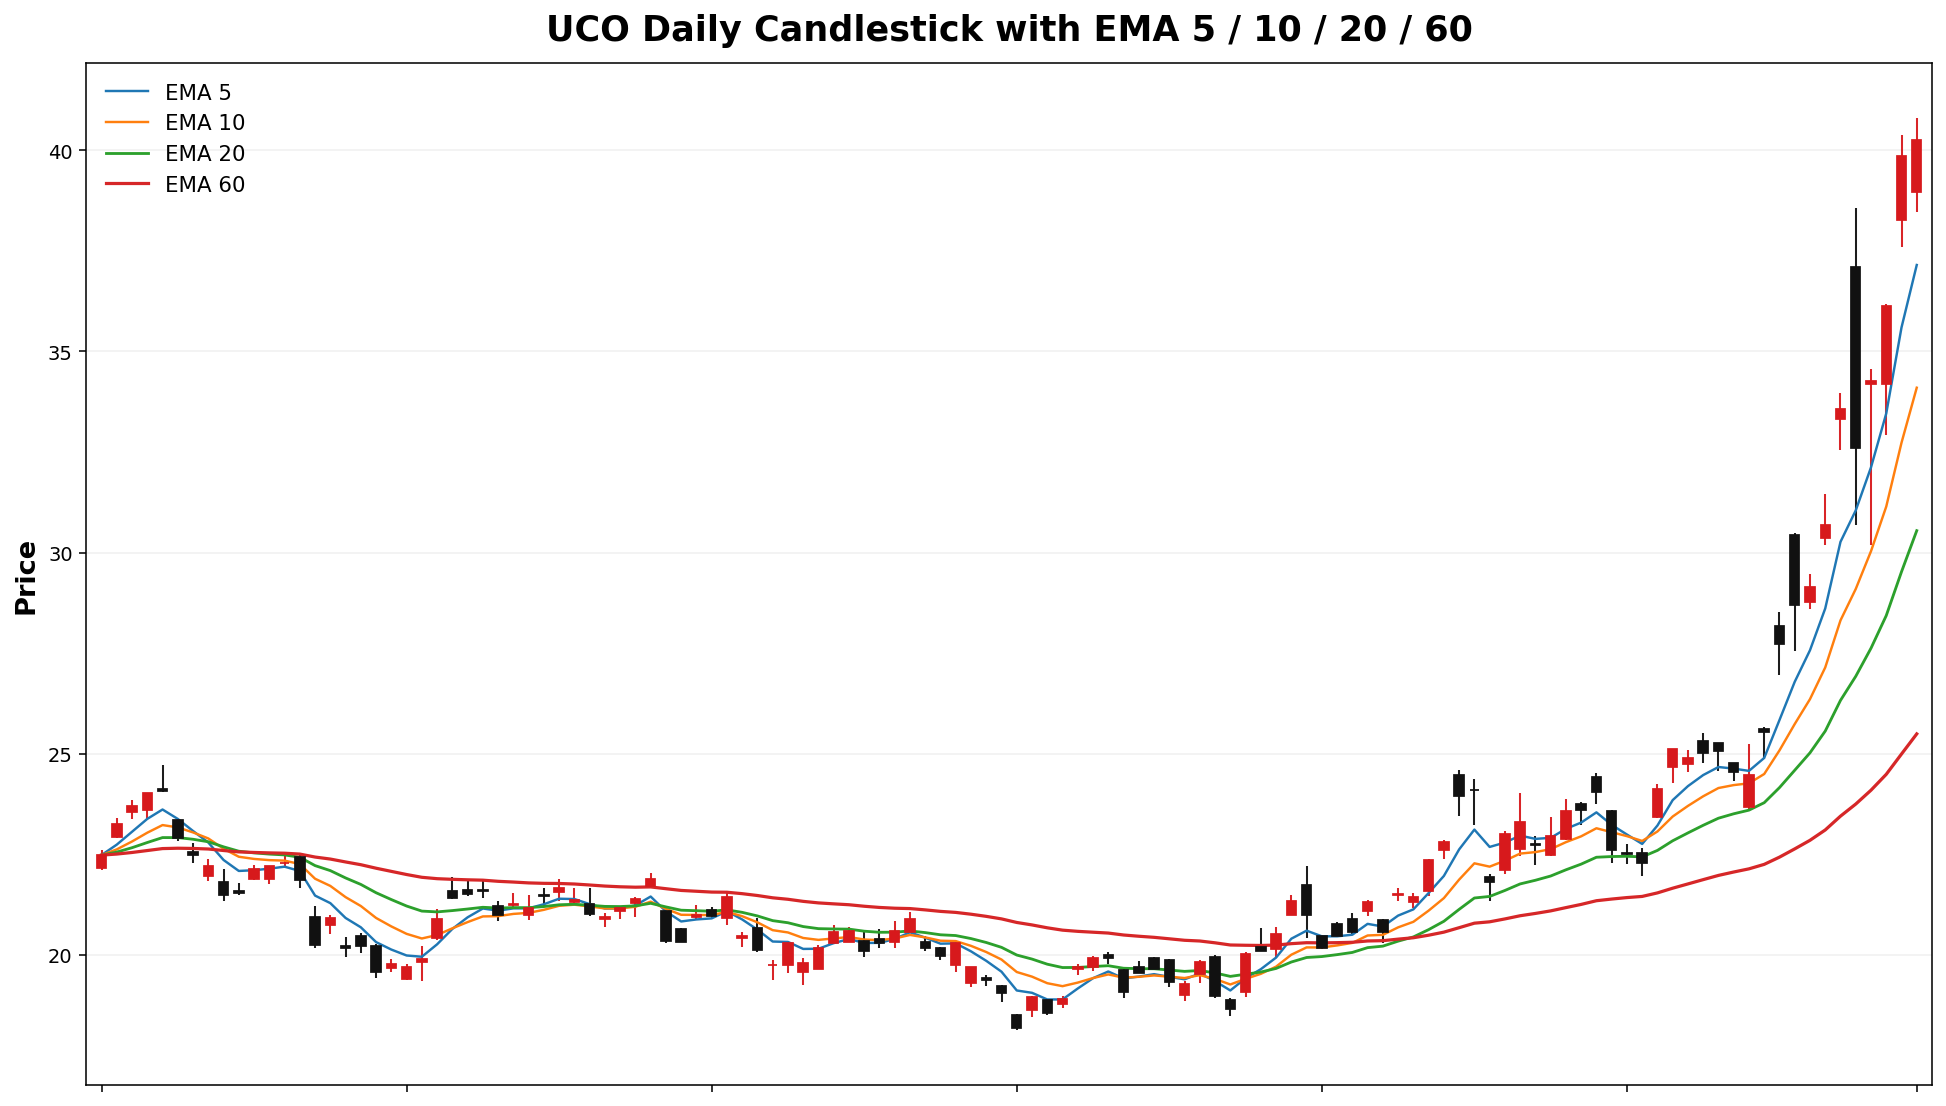
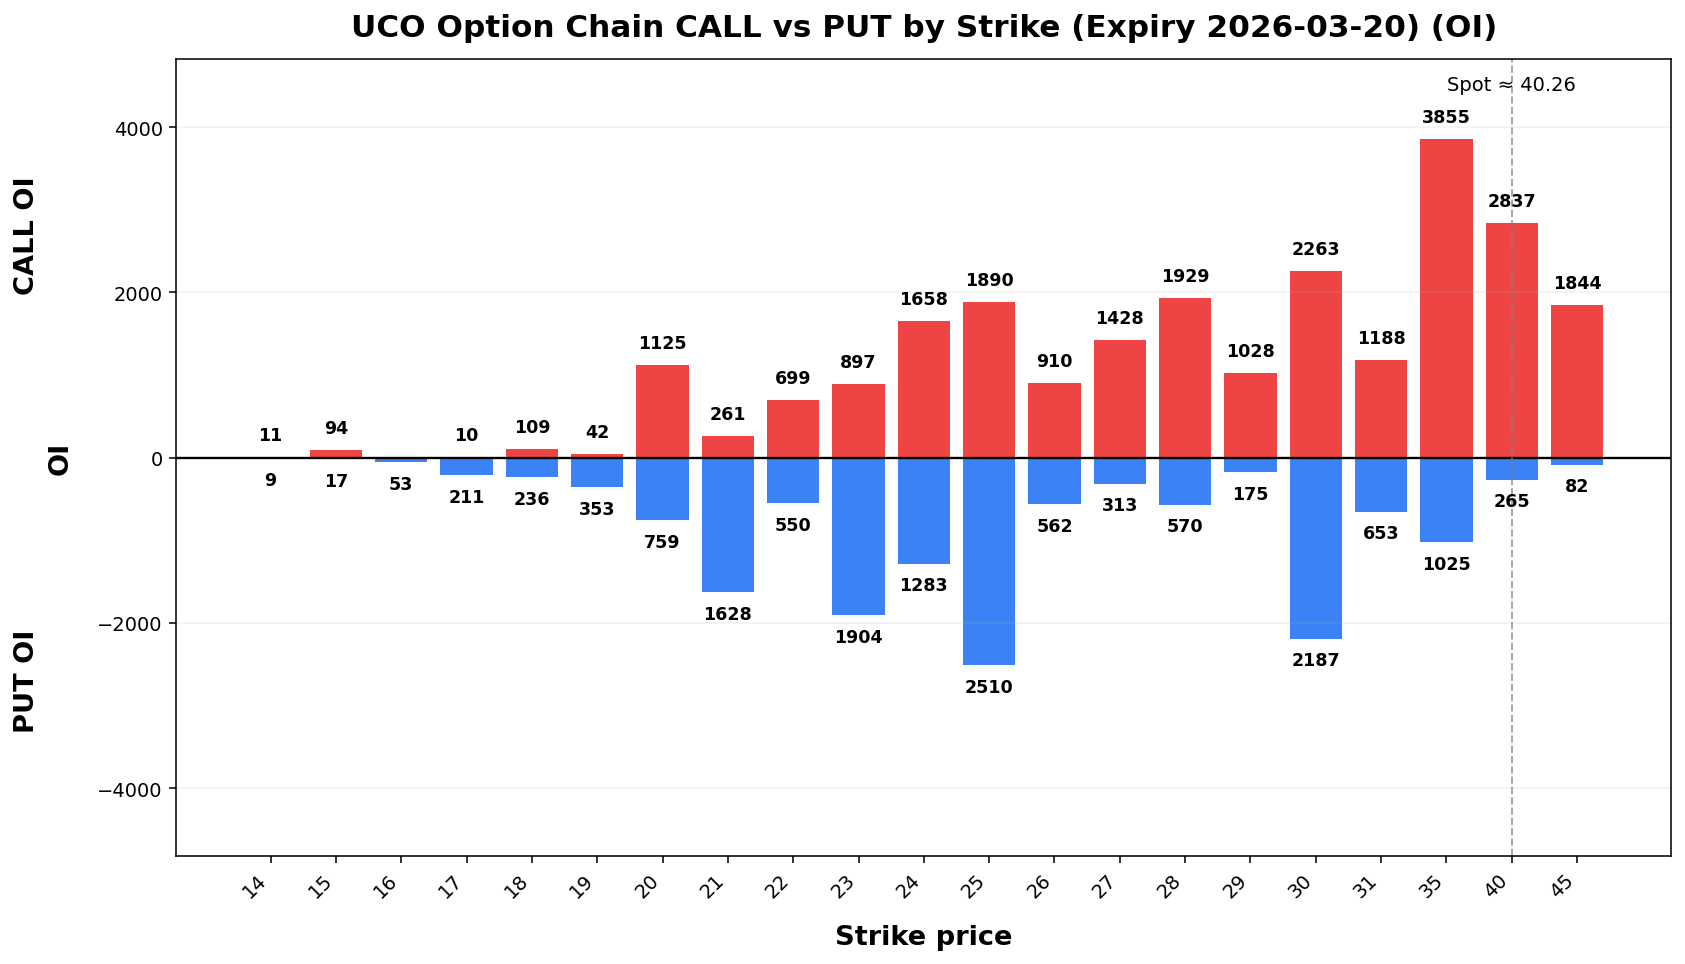
AAOIUCO
Spot: 106.1940.26
Report Time: 2026-03-1315 03:4208:43 PMAM MYT
Regime: TRANSITION
Dealer Gamma: NEUTRALLONG
Term Structure
| Expiry |
DTE |
Forward |
ATM IV |
ATM Straddle |
2026-03-1320 |
16 |
106.9440.34 |
167.51%49% |
6.668.50 |
2026-03-2004-17 |
834 |
119.1940.02 |
171.38%137.98% |
26.1016.90 |
Weekly Range
| Confidence |
Low |
High |
Width |
| 68% |
80.5631.14 |
131.8249.38 |
51.2718.25 |
| 80% |
73.3428.57 |
139.0451.95 |
65.7023.39 |
| 90% |
64.0325.25 |
148.3555.27 |
84.3330.02 |
| 95% |
55.9522.38 |
156.4358.14 |
100.4835.77 |
Structure & Probabilities
| Support |
Resistance |
Gamma Flip |
Max Pain |
P>Res |
P<Sup |
80.56 |
131.82 |
53.10 |
19.40.00 |
15.7%45.00 |
18.8%20.31 |
11.00 |
29.6% |
40.1% |
Flow & Skew
| Call Vol |
Put Vol |
Vol P/C |
Call OI |
Put OI |
OI P/C |
Skew |
Skew Bias |
13,4383,468 |
10,4533,613 |
1.04 |
24,083 |
15,404 |
0.7864 |
0 |
0 |
NA |
1373.44-37.77 vol pts |
PUT_SKEWCALL_SKEW |
Tail Risk
| Q10 |
Q50 |
Q90 |
Down Tail |
Up Tail |
Down/Up |
22.4227.89 |
41.6138.06 |
111.5952.25 |
83.7712.37 |
5.4011.99 |
15.511.03 |
Daily Technicals
| EMA20 |
EMA50 |
VWAP20 |
BB Lower |
BB Mid |
BB Upper |
BB Width |
Vol Ratio |
Path |
85.0630.55 |
62.5726.20 |
89.9132.39 |
17.8070 |
76.9728.83 |
136.1439.95 |
153.76%77.20% |
1.5220 |
UP trend (expanding) |
Day Plan
80.56-131.8240.00-45.00 range: fade extremes- >
131.82:45.00: chase only if hold + vol
- <
80.56:40.00: risk expand; reduce size
- Regime: TRANSITION
- Tech: UP trend (expanding)
Swing Plan
- Accumulate:
80.56-80.5640.00-40.00
- Trim:
131.82-131.8245.00-45.00
- Add: close >
131.8245.00
- Cut: close <
80.5640.00
- Best for: transition regime
Raw Text Summary
📌 AAOIUCO @ 106.1940.26 (2026-03-1315 03:4208:43 PMAM MYT)

• Current price is **106.19*40.26**. Key support is around **80.56*40.00**, and resistance is around **131.82*45.00**.
• For the next week, the model’s **68% expected range** is roughly **80.5631.14 to 131.82*49.38**.
• A wider **90% range** is about **64.0325.25 to 148.35*55.27**.
• Dealer positioning looks **NEUTRALLONG gamma**, so the market behavior is classified as **TRANSITION**.
• The estimated **gamma flip** is near **20.31**. Crossing and holding beyond this area can change the trading behavior.
• Approximate breakout odds: **above resistance 29.6%**, **below support 40.1%** by the target horizon.
• Options skew is tilted toward **calls**, which suggests upside speculation is relatively stronger.
• Near-term implied volatility is higher than the next expiry (**IV1 167.49% vs IV2 137.98%**), which suggests **near-term event stress / backwardation**.
• On the daily chart, the stock currently looks like **UP trend (expanding)**.
• The implied distribution is **fairly balanced** between upside and downside tails.
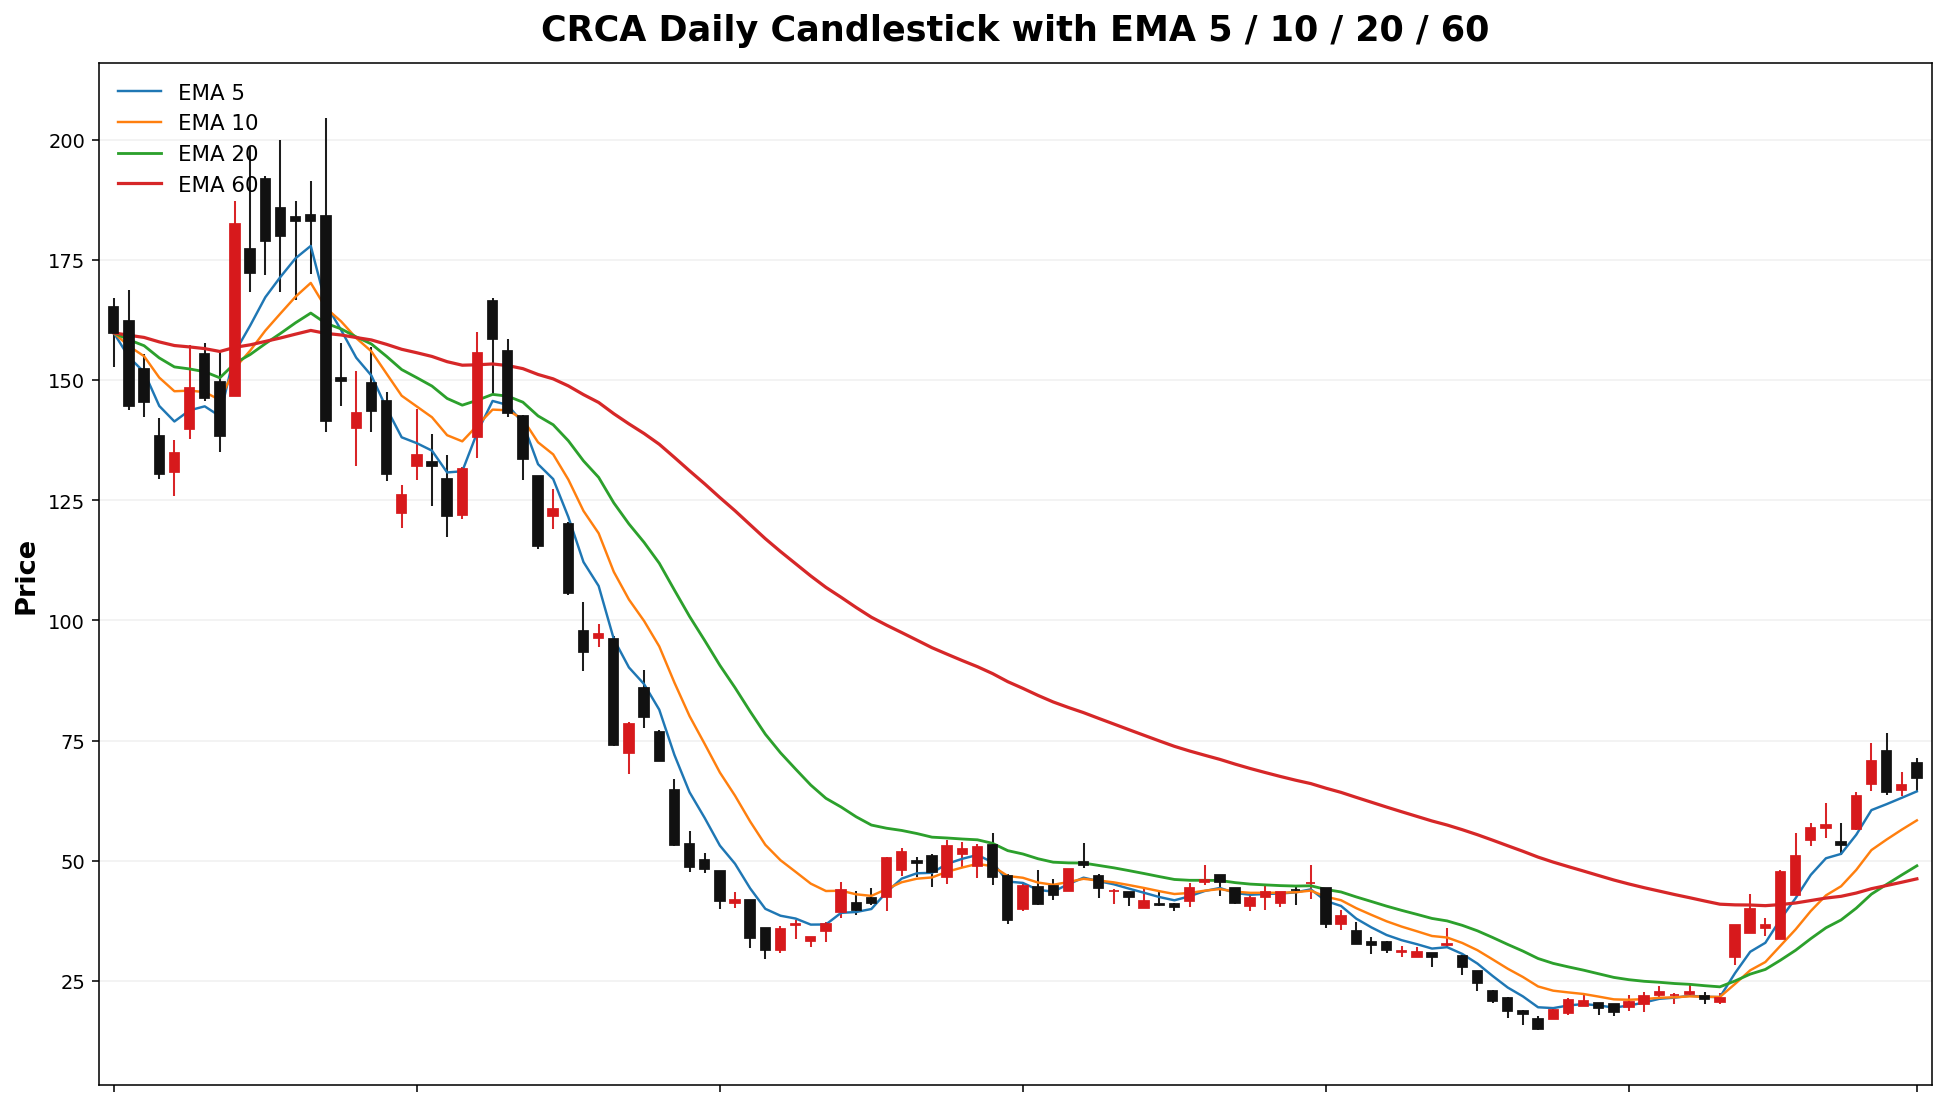
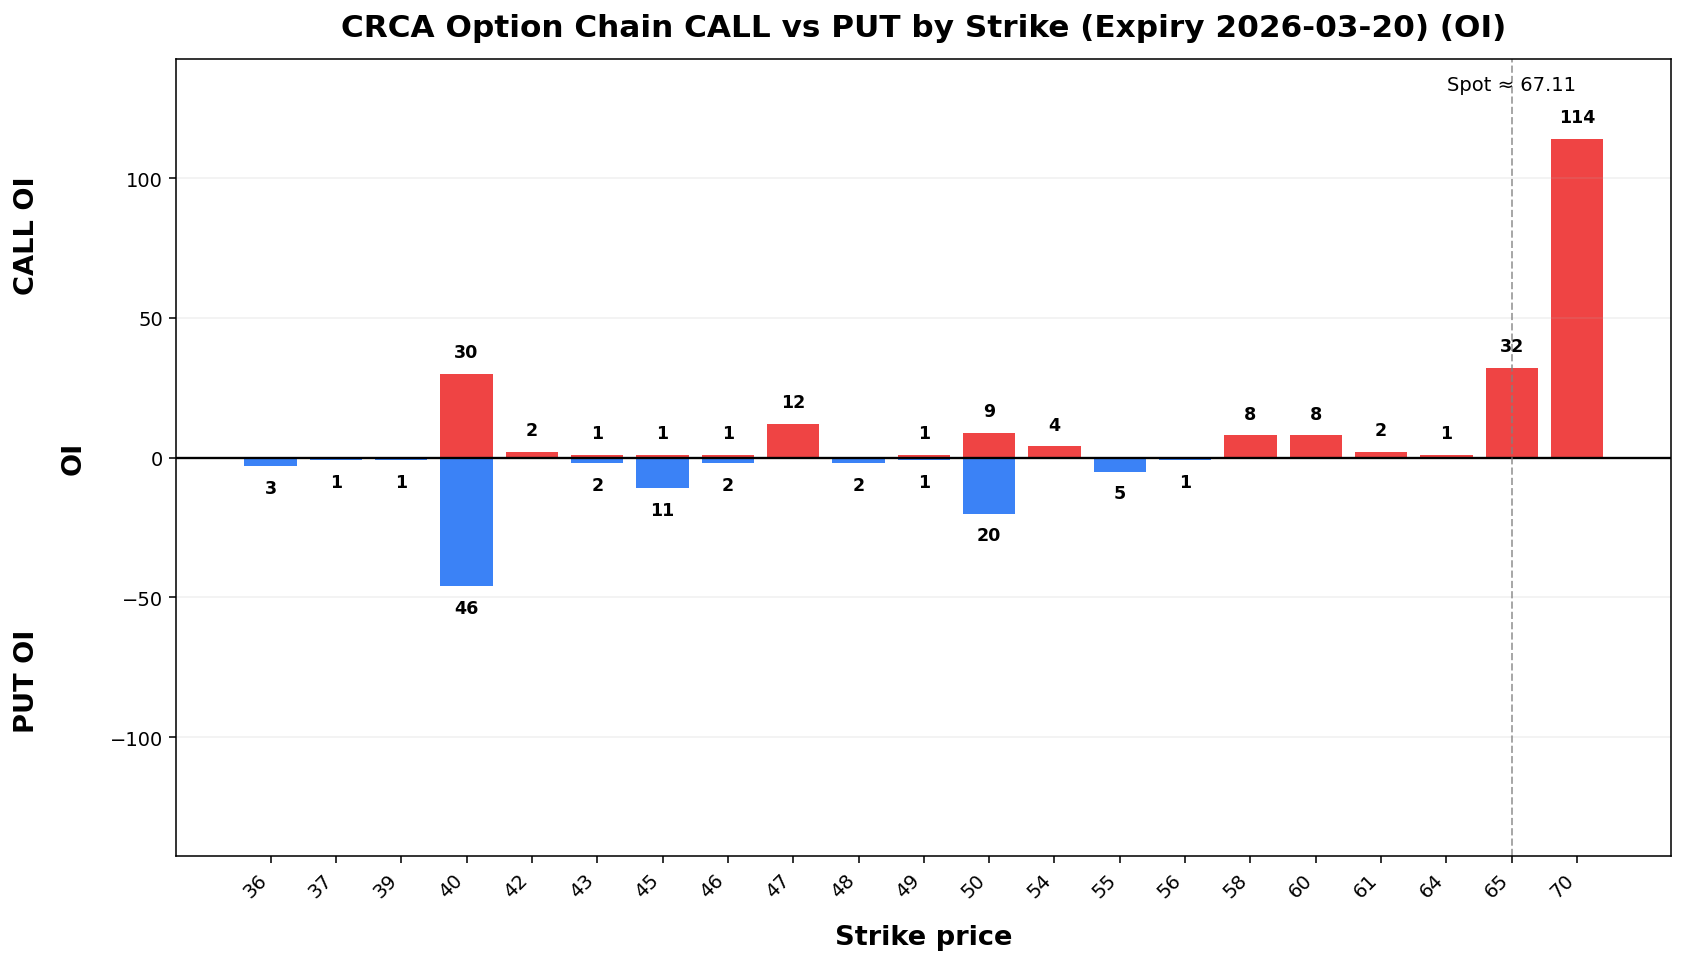
CRCA
Spot: 67.11
Report Time: 2026-03-15 08:43 AM MYT
Regime: TRANSITION
Dealer Gamma: LONG
Term Structure
| Expiry |
DTE |
Forward |
ATM IV |
ATM Straddle |
| 2026-03-20 |
6 |
63.33 |
132.99% |
11.25 |
| 2026-04-17 |
34 |
66.27 |
122.94% |
25.10 |
Weekly Range
| Confidence |
Low |
High |
Width |
| 68% |
54.76 |
79.46 |
24.70 |
| 80% |
51.28 |
82.94 |
31.65 |
| 90% |
46.80 |
87.42 |
40.63 |
| 95% |
42.90 |
91.32 |
48.41 |
Structure & Probabilities
| Support |
Resistance |
Gamma Flip |
Max Pain |
P>Res |
P<Sup |
| 20.00 |
70.00 |
42.11 |
1.00 |
31.1% |
0.0% |
Flow & Skew
| Call Vol |
Put Vol |
Vol P/C |
Call OI |
Put OI |
OI P/C |
Skew |
Skew Bias |
| 1,225 |
275 |
0.22 |
5,792 |
598 |
0.10 |
70.02 vol pts |
PUT_SKEW |
Tail Risk
| Q10 |
Q50 |
Q90 |
Down Tail |
Up Tail |
Down/Up |
| 23.17 |
25.25 |
54.25 |
43.94 |
0.00 |
NA |
Daily Technicals
| EMA20 |
EMA50 |
VWAP20 |
BB Lower |
BB Mid |
BB Upper |
BB Width |
Vol Ratio |
Path |
| 48.95 |
44.28 |
39.42 |
6.02 |
43.16 |
80.31 |
172.11% |
0.48 |
UP trend (expanding) |
Day Plan
- 20.00-70.00 range: fade extremes
- > 70.00: chase only if hold + vol
- < 20.00: risk expand; reduce size
- Regime: TRANSITION
- Tech: UP trend (expanding)
Swing Plan
- Accumulate: 20.00-20.00
- Trim: 70.00-70.00
- Add: close > 70.00
- Cut: close < 20.00
- Best for: transition regime
Raw Text Summary
📌 CRCA @ 67.11 (2026-03-15 08:43 AM MYT)

• Current price is **67.11**. Key support is around **20.00**, and resistance is around **70.00**.
• For the next week, the model’s **68% expected range** is roughly **54.76 to 79.46**.
• A wider **90% range** is about **46.80 to 87.42**.
• Dealer positioning looks **LONG gamma**, so the market behavior is classified as **TRANSITION**.
• The estimated **gamma flip** is near **42.11**. Crossing and holding beyond this area can change the trading behavior.
• Approximate breakout odds: **above resistance 31.1%**, **below support 0.0%** by the target horizon.
• Options skew is tilted toward **puts**, which suggests traders are paying more for downside protection.
• Near-term implied volatility is higher than the next expiry (**IV1 132.99% vs IV2 122.94%**), which suggests **near-term event stress / backwardation**.
• Recent volume is only **0.48x** the 20-day average, so breakouts may be less reliable unless volume improves.
• On the daily chart, the stock currently looks like **UP trend (expanding)**.
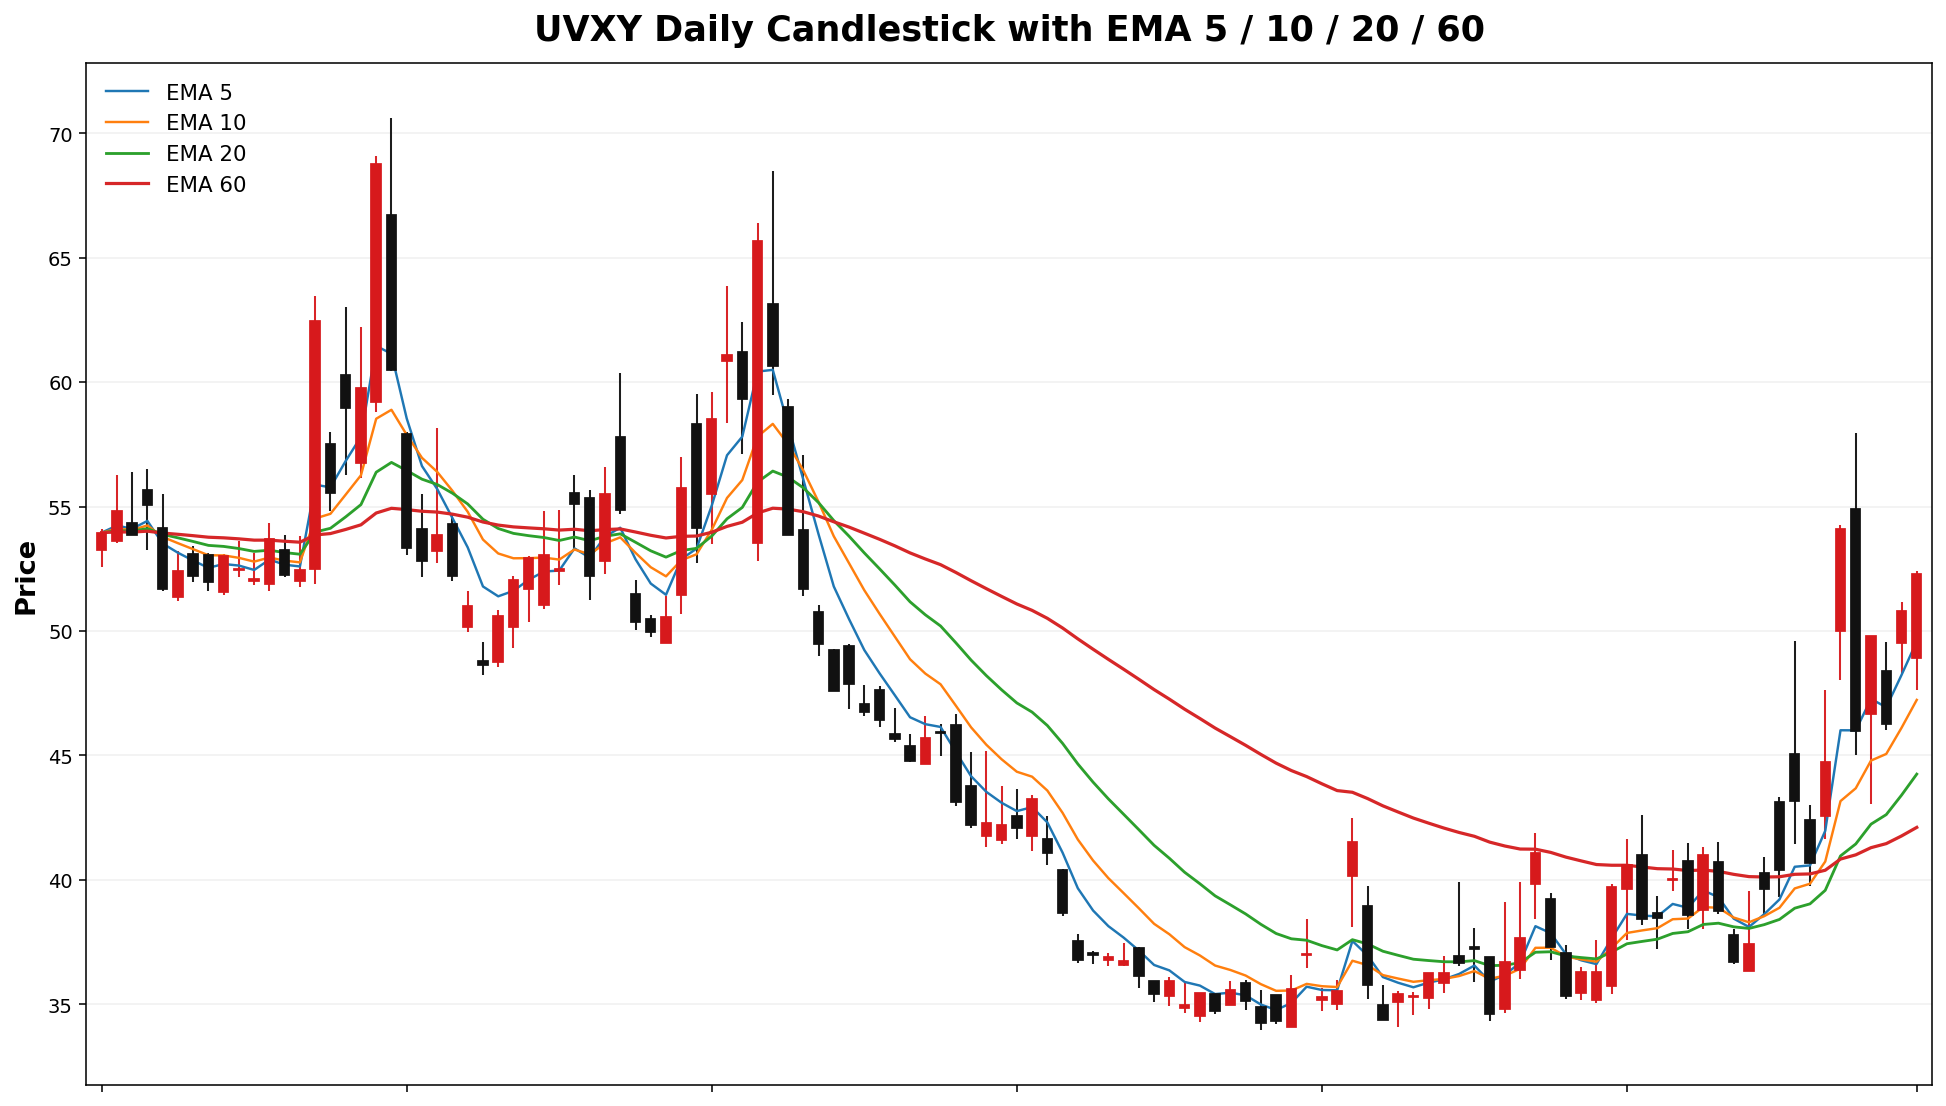
UVXY
Spot: 52.29
Report Time: 2026-03-15 08:43 AM MYT
Regime: TRANSITION
Dealer Gamma: LONG
Term Structure
| Expiry |
DTE |
Forward |
ATM IV |
ATM Straddle |
| 2026-03-20 |
6 |
51.73 |
132.75% |
8.75 |
| 2026-03-27 |
13 |
51.52 |
133.09% |
13.03 |
Weekly Range
| Confidence |
Low |
High |
Width |
| 68% |
42.50 |
62.08 |
19.57 |
| 80% |
39.75 |
64.83 |
25.09 |
| 90% |
36.19 |
68.39 |
32.20 |
| 95% |
33.11 |
71.47 |
38.36 |
Structure & Probabilities
| Support |
Resistance |
Gamma Flip |
Max Pain |
P>Res |
P<Sup |
| 50.00 |
55.00 |
33.64 |
1.00 |
32.6% |
28.5% |
Flow & Skew
| Call Vol |
Put Vol |
Vol P/C |
Call OI |
Put OI |
OI P/C |
Skew |
Skew Bias |
| 15,366 |
8,517 |
0.55 |
56,103 |
24,092 |
0.43 |
-51.56 vol pts |
CALL_SKEW |
Tail Risk
| Q10 |
Q50 |
Q90 |
Down Tail |
Up Tail |
Down/Up |
| 12.26 |
13.28 |
49.90 |
40.03 |
0.00 |
NA |
Daily Technicals
| EMA20 |
EMA50 |
VWAP20 |
BB Lower |
BB Mid |
BB Upper |
BB Width |
Vol Ratio |
Path |
| 44.25 |
42.08 |
43.37 |
32.32 |
42.89 |
53.46 |
49.28% |
0.63 |
UP trend (expanding) |
Day Plan
- 50.00-55.00 range: fade extremes
- > 55.00: chase only if hold + vol
- < 50.00: risk expand; reduce size
- Regime: TRANSITION
- Tech: UP trend (expanding)
Swing Plan
- Accumulate: 50.00-50.00
- Trim: 55.00-55.00
- Add: close > 55.00
- Cut: close < 50.00
- Best for: transition regime
Raw Text Summary
📌 UVXY @ 52.29 (2026-03-15 08:43 AM MYT)

• Current price is **52.29**. Key support is around **50.00**, and resistance is around **55.00**.
• For the next week, the model’s **68% expected range** is roughly **42.50 to 62.08**.
• A wider **90% range** is about **36.19 to 68.39**.
• Dealer positioning looks **LONG gamma**, so the market behavior is classified as **TRANSITION**.
• The estimated **gamma flip** is near **33.64**. Crossing and holding beyond this area can change the trading behavior.
• Approximate breakout odds: **above resistance 32.6%**, **below support 28.5%** by the target horizon.
• Options skew is tilted toward **calls**, which suggests upside speculation is relatively stronger.
• Near-term implied volatility is lower than the next expiry (**IV1 132.75% vs IV2 133.09%**), which suggests a **contango / calmer front expiry** setup.
• Recent volume is only **0.63x** the 20-day average, so breakouts may be less reliable unless volume improves.
• On the daily chart, the stock currently looks like **UP trend (expanding)**.
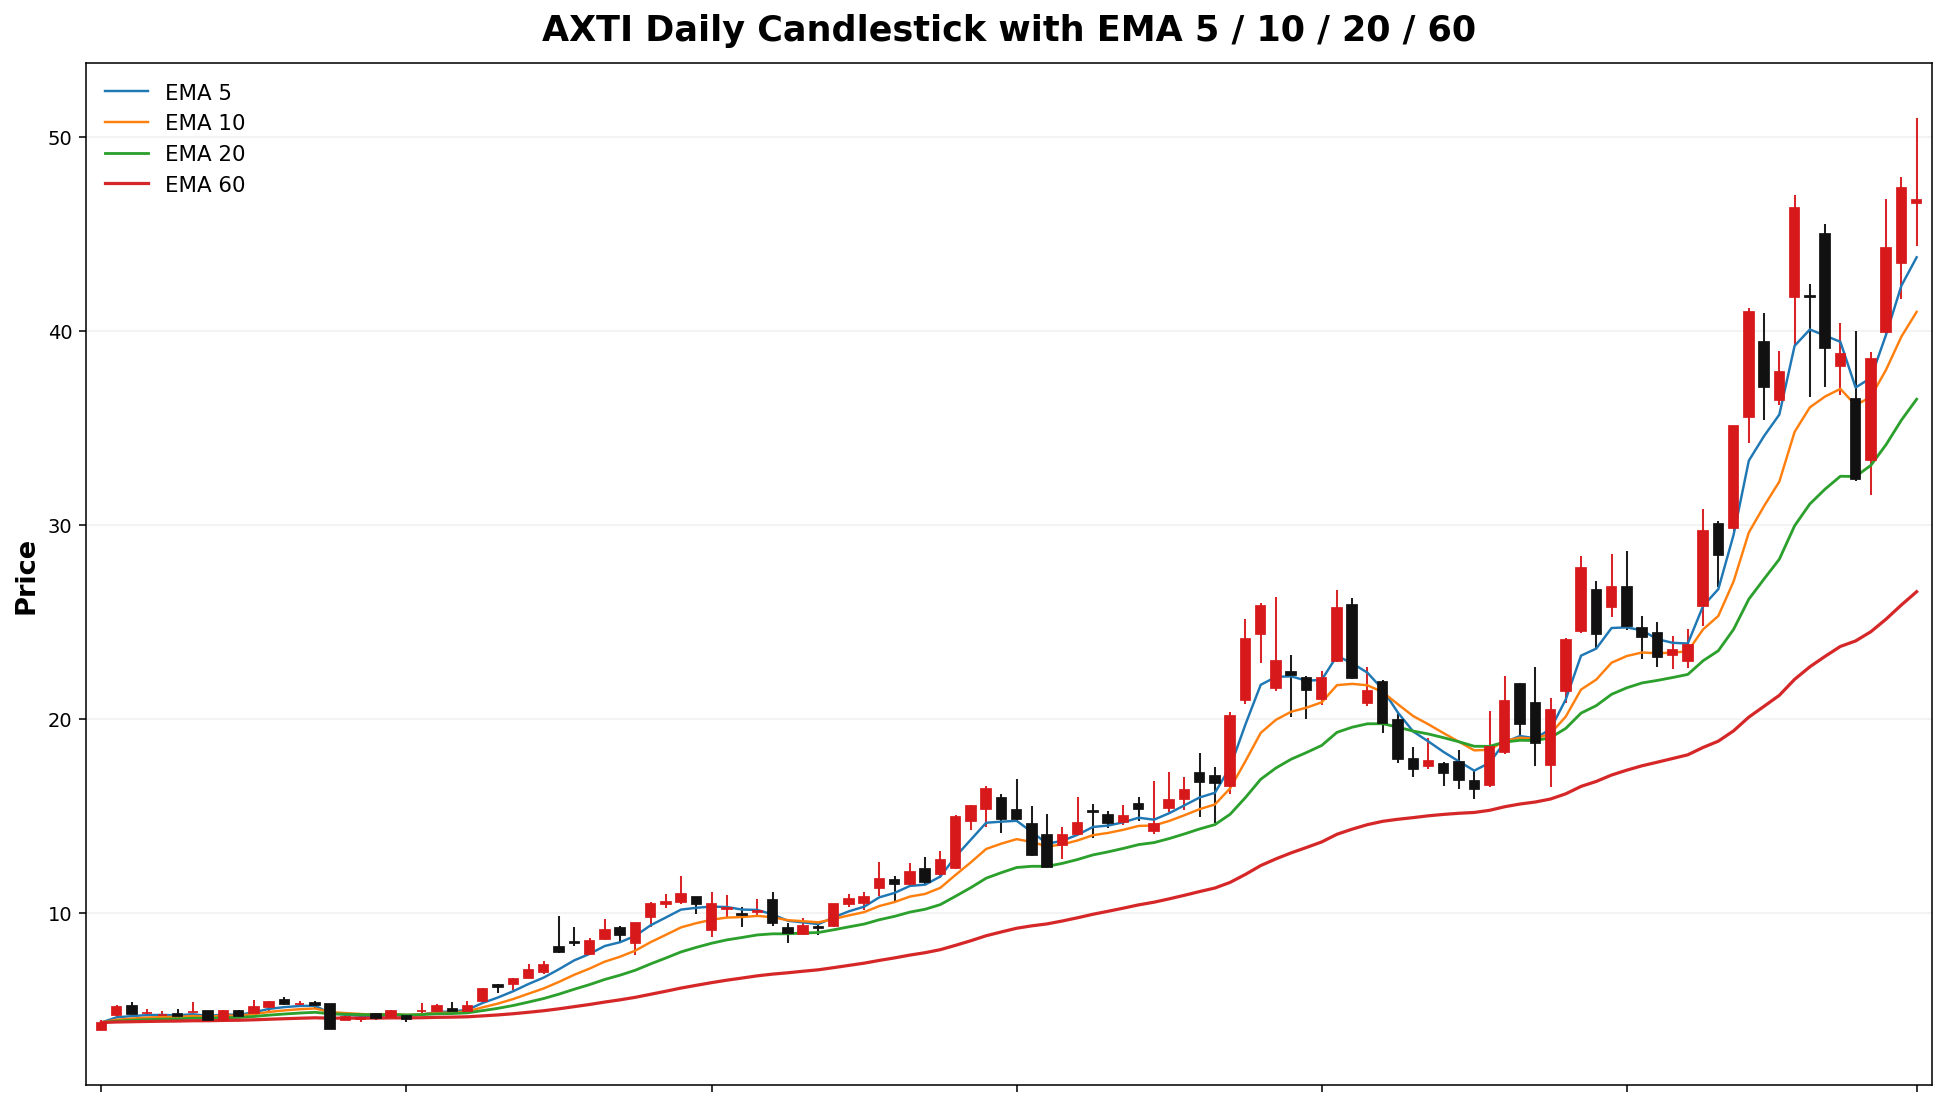
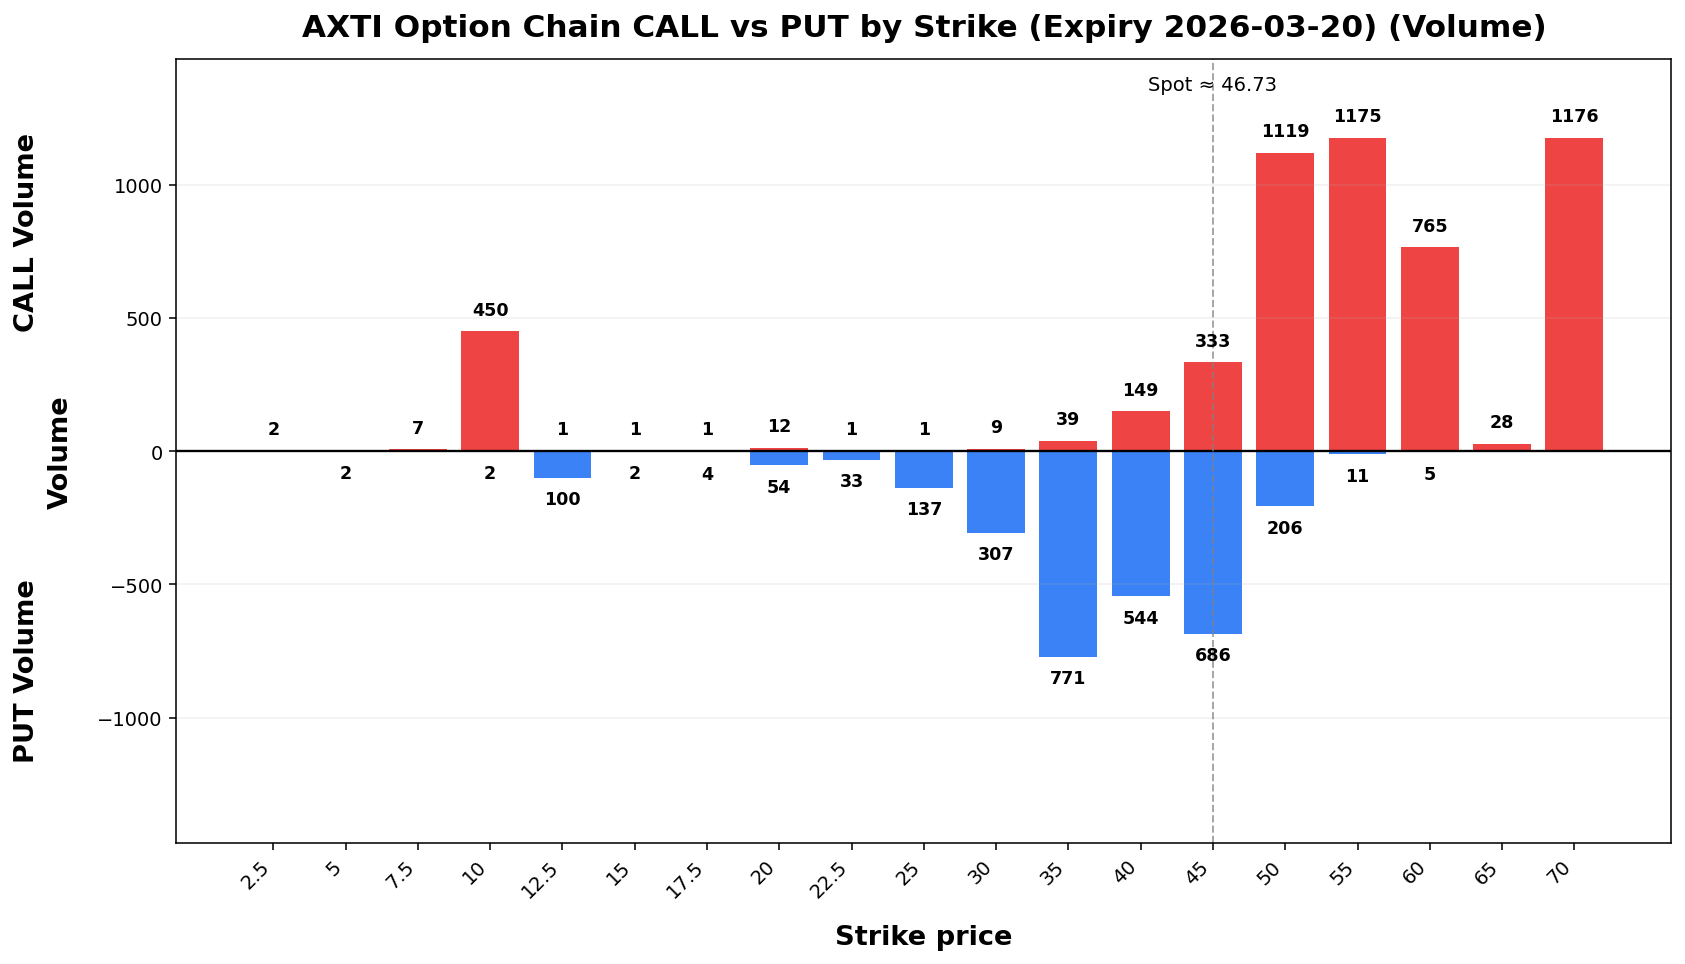
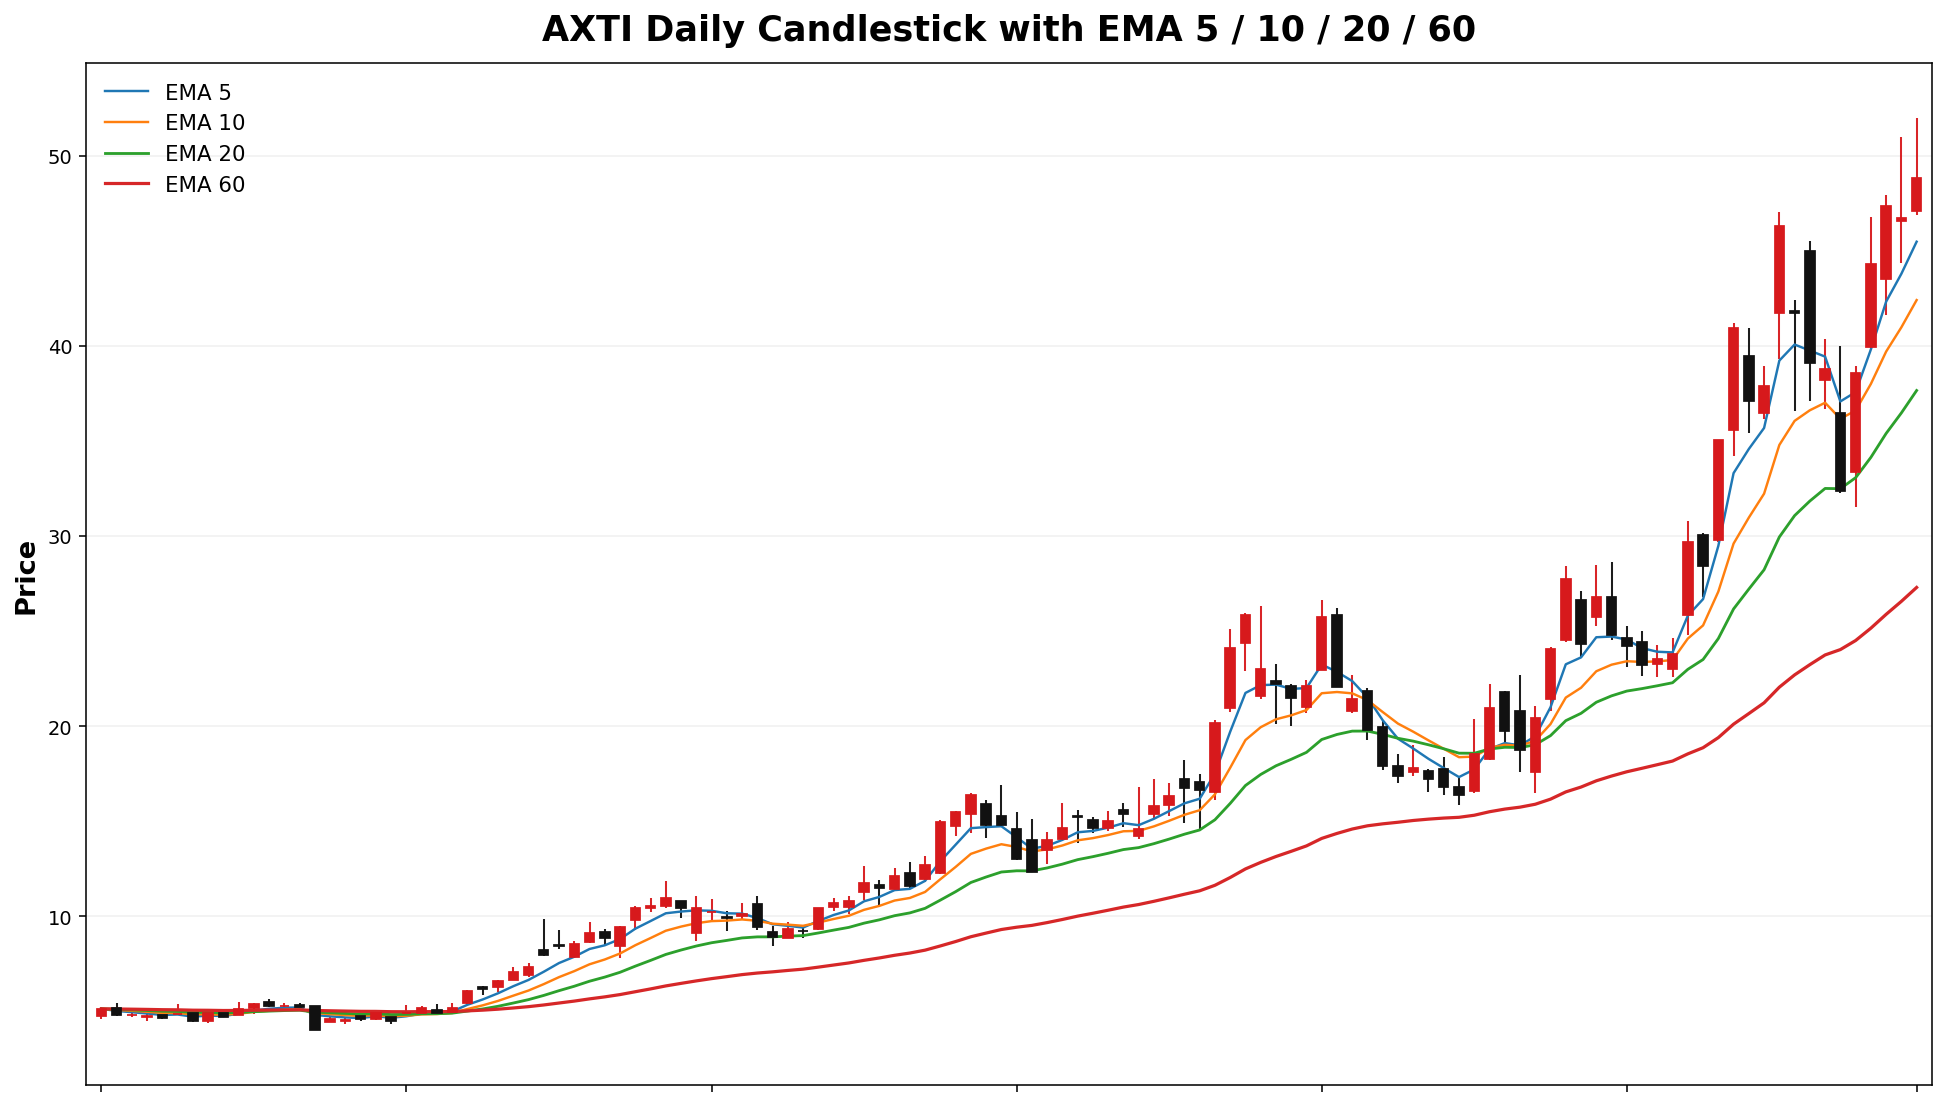
AXTI
Spot: 48.86
Report Time: 2026-03-15 08:43 AM MYT
Regime: TRANSITION
Dealer Gamma: LONG
Term Structure
| Expiry |
DTE |
Forward |
ATM IV |
ATM Straddle |
| 2026-03-20 |
6 |
48.99 |
145.32% |
8.95 |
| 2026-04-17 |
34 |
49.17 |
123.12% |
18.30 |
Weekly Range
| Confidence |
Low |
High |
Width |
| 68% |
39.20 |
58.52 |
19.31 |
| 80% |
36.49 |
61.23 |
24.75 |
| 90% |
32.98 |
64.74 |
31.77 |
| 95% |
29.93 |
67.79 |
37.85 |
Structure & Probabilities
| Support |
Resistance |
Gamma Flip |
Max Pain |
P>Res |
P<Sup |
| 45.00 |
50.00 |
53.12 |
40.00 |
44.5% |
28.3% |
Flow & Skew
| Call Vol |
Put Vol |
Vol P/C |
Call OI |
Put OI |
OI P/C |
Skew |
Skew Bias |
| 6,369 |
4,945 |
0.78 |
15,051 |
23,903 |
1.59 |
-7.71 vol pts |
CALL_SKEW |
Tail Risk
| Q10 |
Q50 |
Q90 |
Down Tail |
Up Tail |
Down/Up |
| 32.50 |
46.61 |
61.87 |
16.36 |
13.01 |
1.26 |
Daily Technicals
| EMA20 |
EMA50 |
VWAP20 |
BB Lower |
BB Mid |
BB Upper |
BB Width |
Vol Ratio |
Path |
| 37.66 |
29.14 |
38.29 |
19.33 |
36.41 |
53.49 |
93.82% |
1.16 |
UP trend (expanding) |
Day Plan
- 45.00-50.00 range: fade extremes
- > 50.00: chase only if hold + vol
- < 45.00: risk expand; reduce size
- Regime: TRANSITION
- Tech: UP trend (expanding)
Swing Plan
- Accumulate: 45.00-45.00
- Trim: 50.00-50.00
- Add: close > 50.00
- Cut: close < 45.00
- Best for: transition regime
Raw Text Summary
📌 AXTI @ 48.86 (2026-03-15 08:43 AM MYT)

• Current price is **48.86**. Key support is around **45.00**, and resistance is around **50.00**.
• For the next week, the model’s **68% expected range** is roughly **39.20 to 58.52**.
• A wider **90% range** is about **32.98 to 64.74**.
• Dealer positioning looks **LONG gamma**, so the market behavior is classified as **TRANSITION**.
• The estimated **gamma flip** is near **53.10*12**. Crossing and holding beyond this area can change the trading behavior.
• Approximate breakout odds: **above resistance 15.44.5%**, **below support 28.3%** by the target horizon.
• Options skew is tilted toward **calls**, which suggests upside speculation is relatively stronger.
• Near-term implied volatility is higher than the next expiry (**IV1 145.32% vs IV2 123.12%**), which suggests **near-term event stress / backwardation**.
• On the daily chart, the stock currently looks like **UP trend (expanding)**.
• The implied distribution shows **heavier downside tail risk** than upside tail potential.
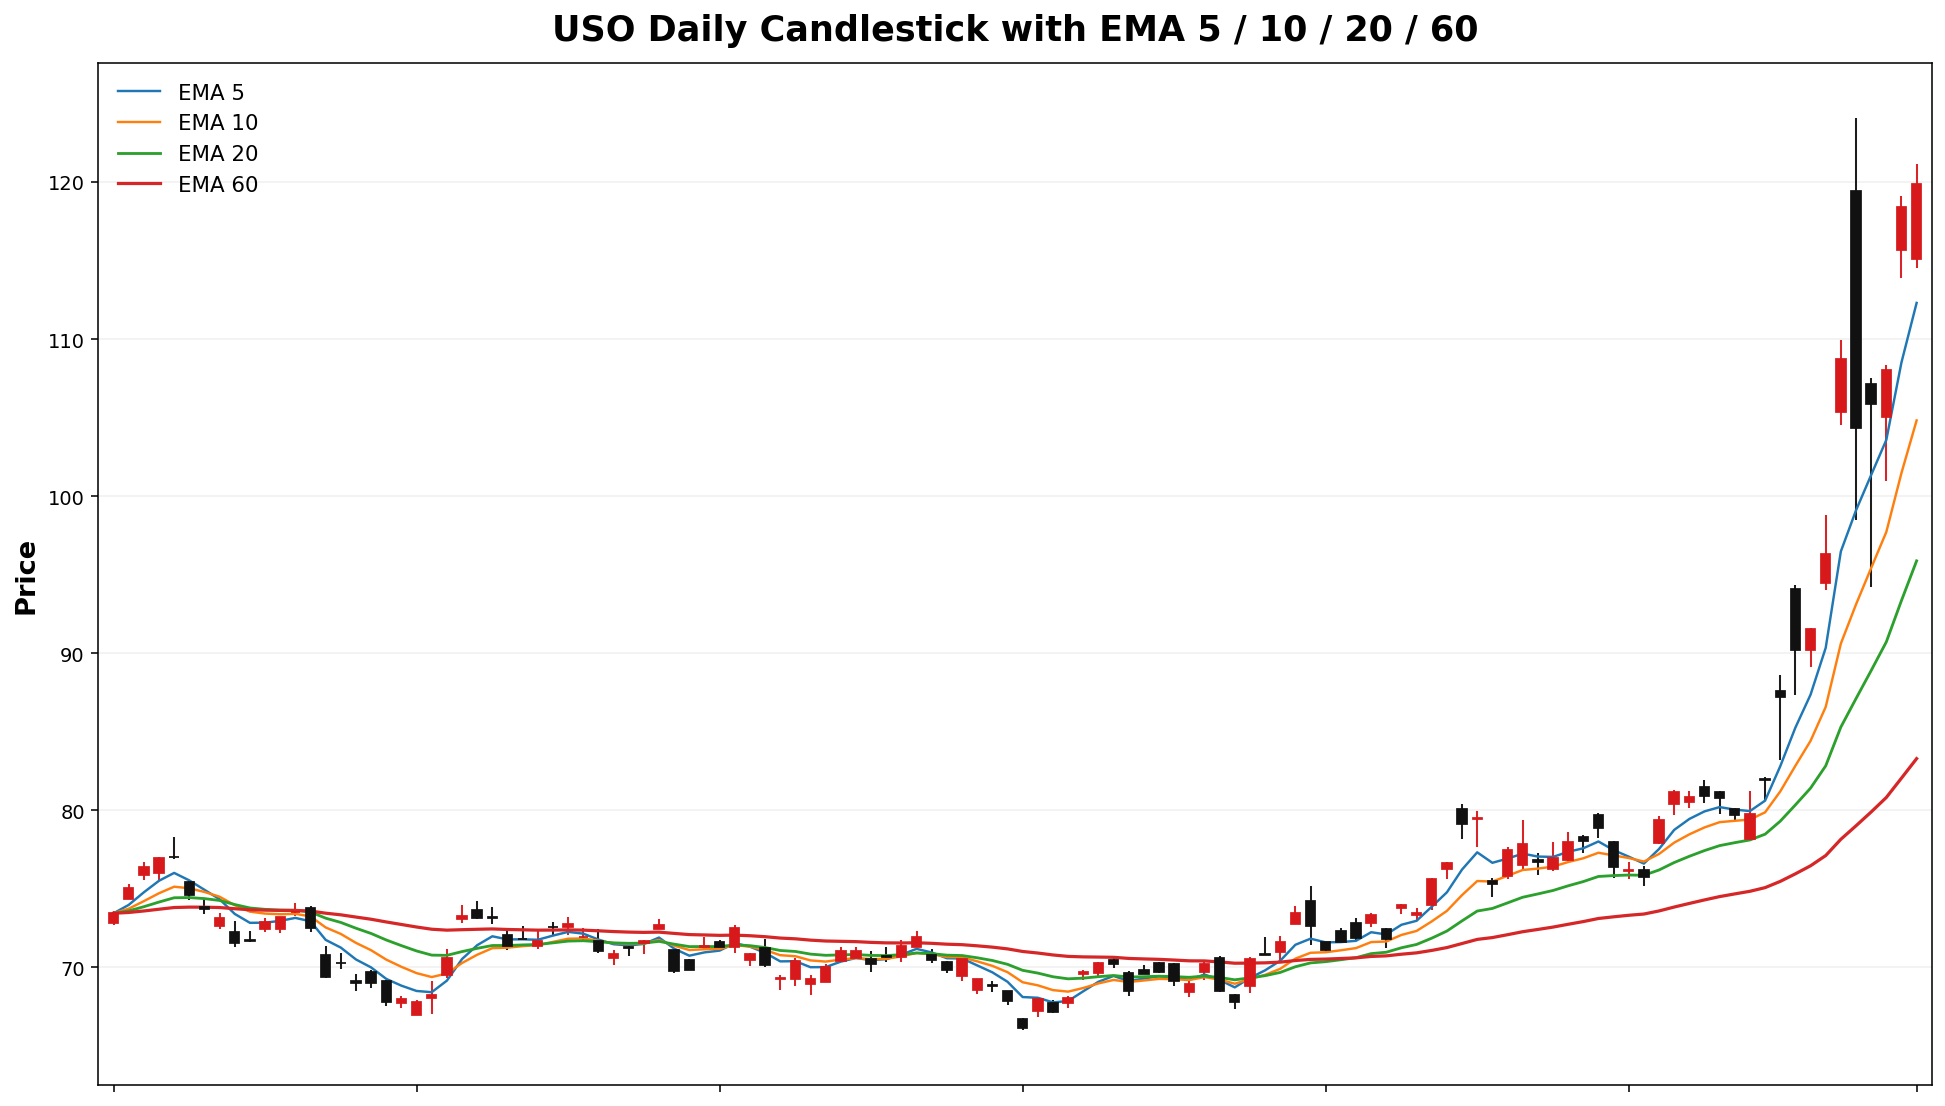
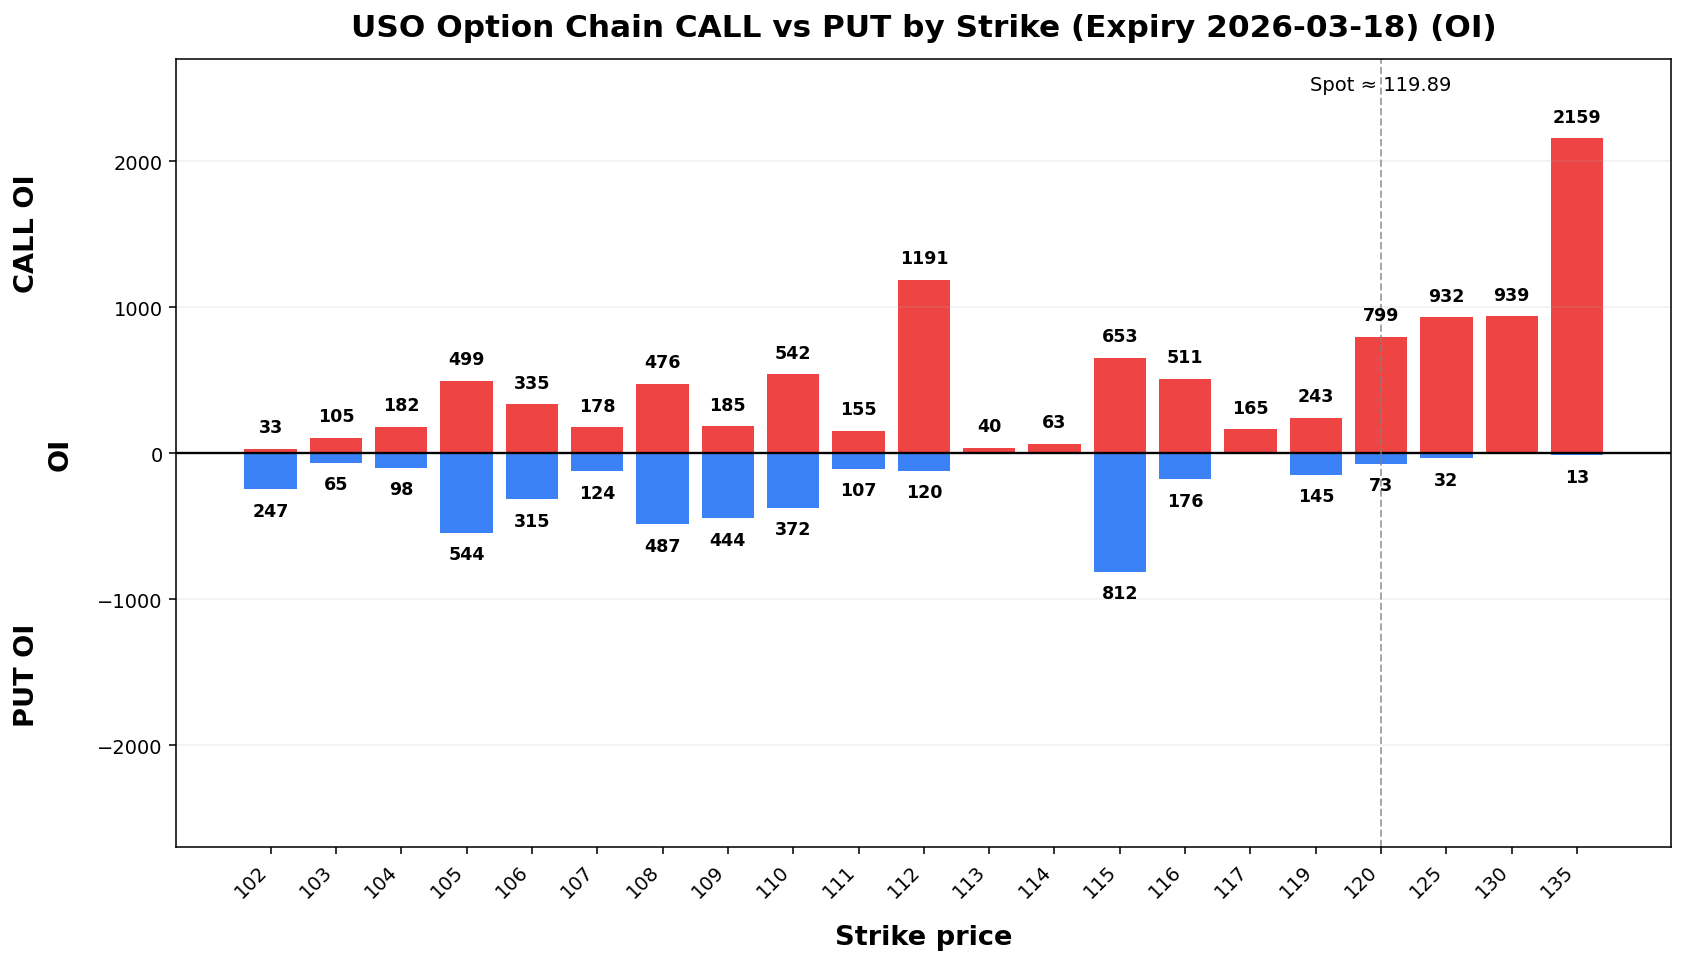
USO
Spot: 119.89
Report Time: 2026-03-15 08:43 AM MYT
Regime: TRANSITION
Dealer Gamma: LONG
Term Structure
| Expiry |
DTE |
Forward |
ATM IV |
ATM Straddle |
| 2026-03-18 |
4 |
111.80 |
114.44% |
14.00 |
| 2026-03-20 |
6 |
108.24 |
114.81% |
17.35 |
Weekly Range
| Confidence |
Low |
High |
Width |
| 68% |
100.48 |
139.30 |
38.82 |
| 80% |
95.01 |
144.77 |
49.76 |
| 90% |
87.96 |
151.82 |
63.86 |
| 95% |
81.84 |
157.94 |
76.10 |
Structure & Probabilities
| Support |
Resistance |
Gamma Flip |
Max Pain |
P>Res |
P<Sup |
| 112.00 |
125.00 |
108.70 |
69.00 |
29.7% |
30.7% |
Flow & Skew
| Call Vol |
Put Vol |
Vol P/C |
Call OI |
Put OI |
OI P/C |
Skew |
Skew Bias |
| 19,659 |
28,676 |
1.46 |
16,628 |
16,313 |
0.98 |
48.19 vol pts |
PUT_SKEW |
Tail Risk
| Q10 |
Q50 |
Q90 |
Down Tail |
Up Tail |
Down/Up |
| 120.21 |
121.06 |
121.91 |
0.00 |
2.02 |
0.00 |
Daily Technicals
| EMA20 |
EMA50 |
VWAP20 |
BB Lower |
BB Mid |
BB Upper |
BB Width |
Vol Ratio |
Path |
| 95.89 |
85.06 |
102.09 |
62.48 |
91.35 |
120.22 |
63.20% |
1.35 |
UP trend (expanding) |
Day Plan
- 112.00-125.00 range: fade extremes
- > 125.00: chase only if hold + vol
- < 112.00: risk expand; reduce size
- Regime: TRANSITION
- Tech: UP trend (expanding)
Swing Plan
- Accumulate: 112.00-112.00
- Trim: 125.00-125.00
- Add: close > 125.00
- Cut: close < 112.00
- Best for: transition regime
Raw Text Summary
📌 USO @ 119.89 (2026-03-15 08:43 AM MYT)

• Current price is **119.89**. Key support is around **112.00**, and resistance is around **125.00**.
• For the next week, the model’s **68% expected range** is roughly **100.48 to 139.30**.
• A wider **90% range** is about **87.96 to 151.82**.
• Dealer positioning looks **LONG gamma**, so the market behavior is classified as **TRANSITION**.
• The estimated **gamma flip** is near **108.70**. Crossing and holding beyond this area can change the trading behavior.
• Approximate breakout odds: **above resistance 29.7%**, **below support 18.8%30.7%** by the target horizon.
• Options skew is tilted toward **puts**, which suggests traders are paying more for downside protection.
• Near-term implied volatility is lower than the next expiry (**IV1 167.51%114.44% vs IV2 171.38%114.81%**), which suggests a **contango / calmer front expiry** setup.
• On the daily chart, the stock currently looks like **UP trend (expanding)**.
• The implied distribution shows **more upside tail potential** than downside tail risk.
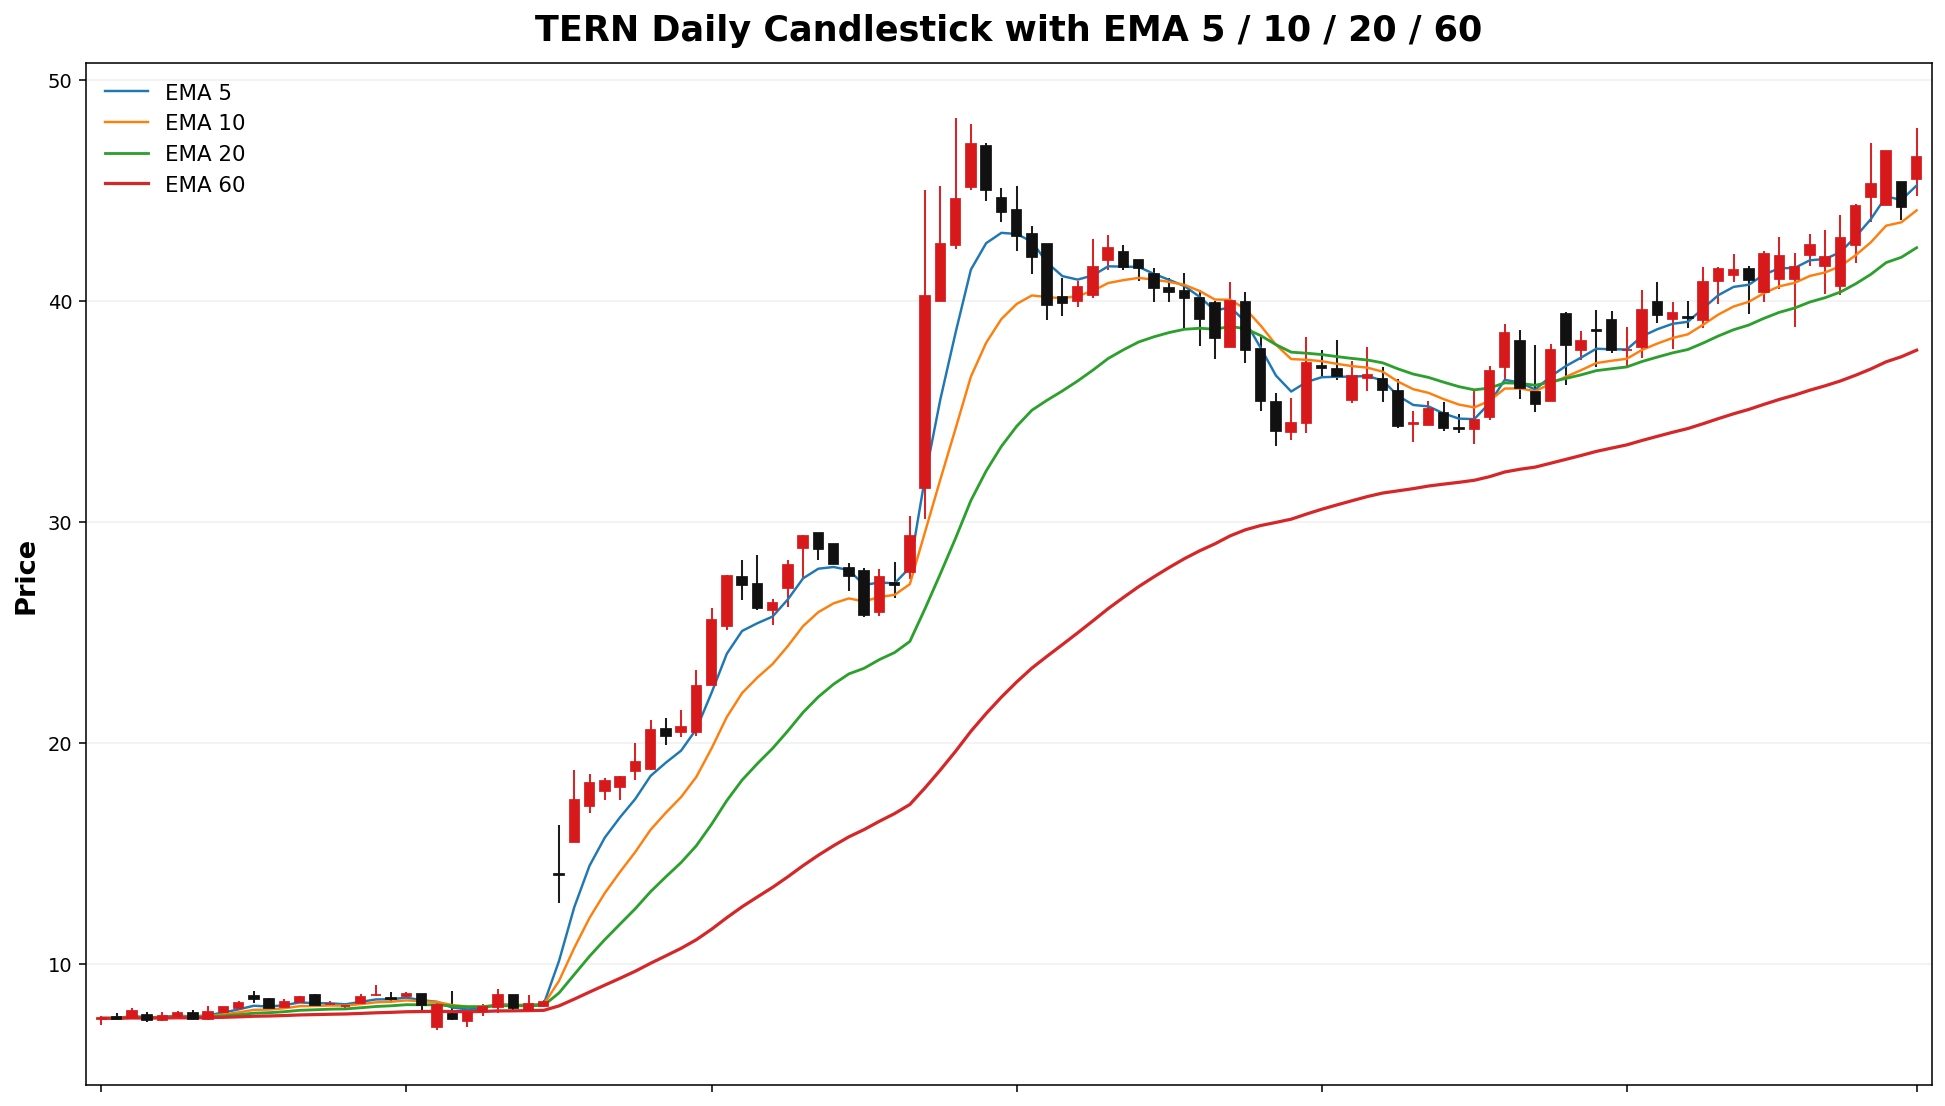
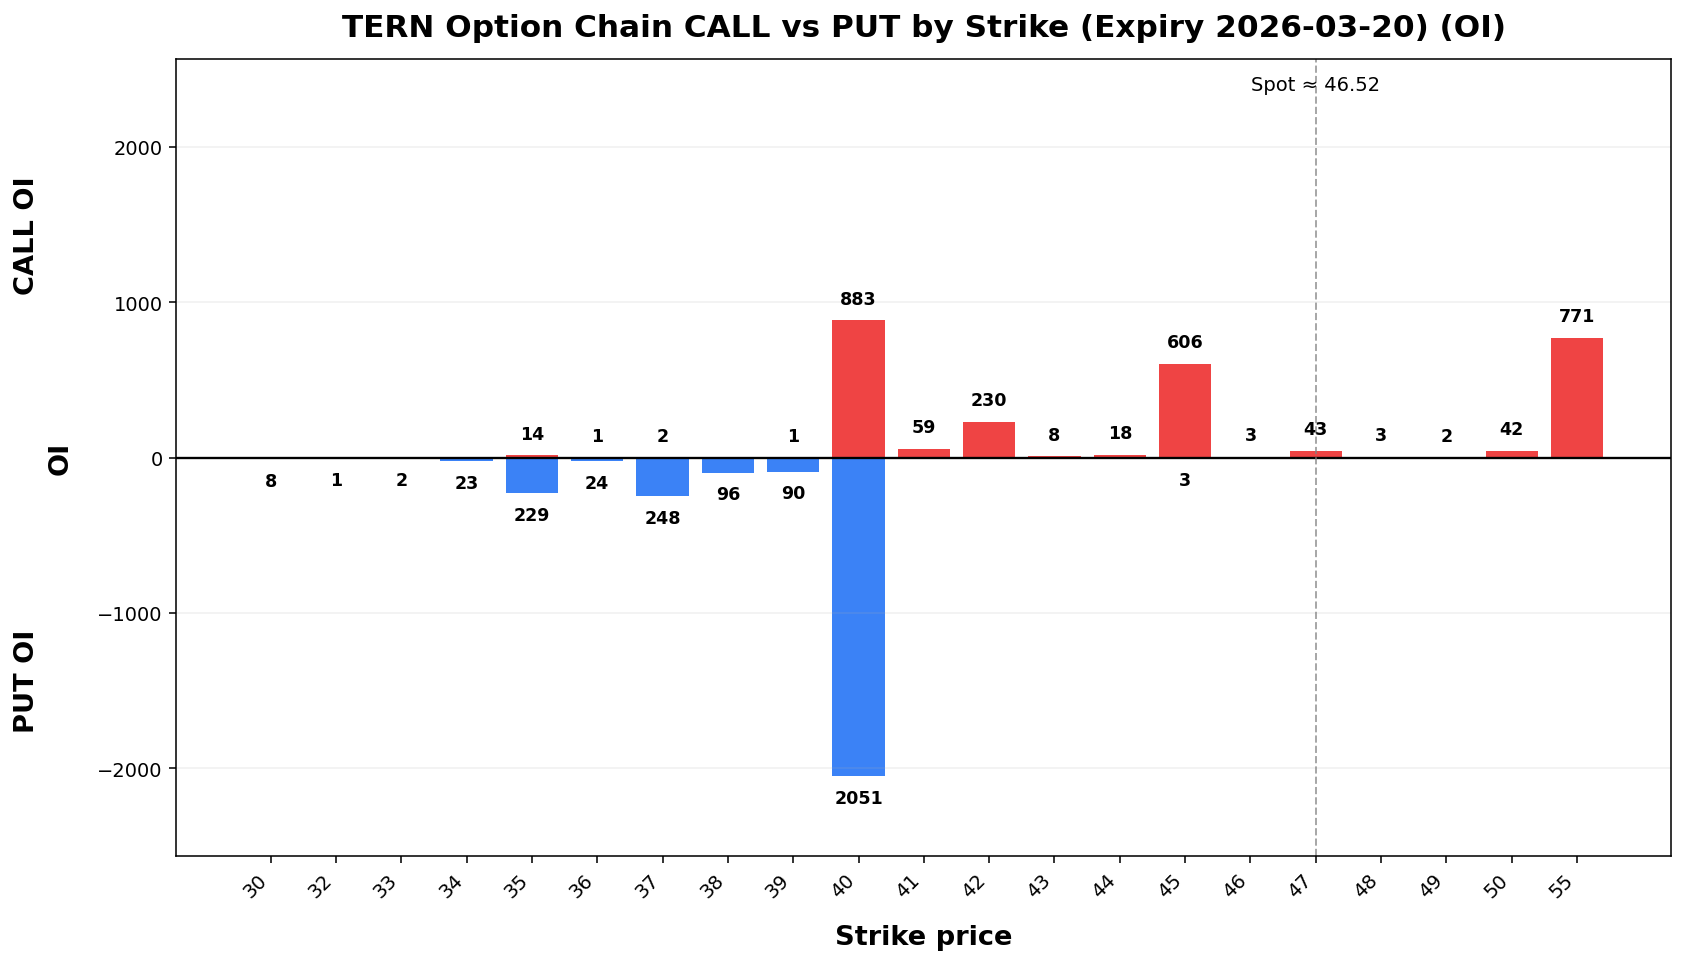
TERN
Spot: 46.52
Report Time: 2026-03-15 08:43 AM MYT
Regime: TRANSITION
Dealer Gamma: LONG
Term Structure
| Expiry |
DTE |
Forward |
ATM IV |
ATM Straddle |
| 2026-03-20 |
6 |
45.64 |
118.95% |
6.97 |
| 2026-04-17 |
34 |
43.77 |
96.81% |
13.70 |
Weekly Range
| Confidence |
Low |
High |
Width |
| 68% |
39.05 |
53.99 |
14.94 |
| 80% |
36.95 |
56.09 |
19.15 |
| 90% |
34.23 |
58.81 |
24.58 |
| 95% |
31.88 |
61.16 |
29.29 |
Structure & Probabilities
| Support |
Resistance |
Gamma Flip |
Max Pain |
P>Res |
P<Sup |
| 45.00 |
55.00 |
44.71 |
40.00 |
11.8% |
46.1% |
Flow & Skew
| Call Vol |
Put Vol |
Vol P/C |
Call OI |
Put OI |
OI P/C |
Skew |
Skew Bias |
| 864 |
189 |
0.22 |
2,709 |
3,042 |
1.12 |
124.12 vol pts |
PUT_SKEW |
Tail Risk
| Q10 |
Q50 |
Q90 |
Down Tail |
Up Tail |
Down/Up |
| 42.97 |
48.74 |
49.75 |
3.55 |
3.23 |
1.10 |
Daily Technicals
| EMA20 |
EMA50 |
VWAP20 |
BB Lower |
BB Mid |
BB Upper |
BB Width |
Vol Ratio |
Path |
| 42.40 |
38.95 |
42.14 |
37.12 |
42.01 |
46.90 |
23.27% |
2.09 |
UP trend (expanding) |
Day Plan
- 45.00-55.00 range: fade extremes
- > 55.00: chase only if hold + vol
- < 45.00: risk expand; reduce size
- Regime: TRANSITION
- Tech: UP trend (expanding)
Swing Plan
- Accumulate: 45.00-45.00
- Trim: 55.00-55.00
- Add: close > 55.00
- Cut: close < 45.00
- Best for: transition regime
Raw Text Summary
📌 TERN @ 46.52 (2026-03-15 08:43 AM MYT)

• Current price is **46.52**. Key support is around **45.00**, and resistance is around **55.00**.
• For the next week, the model’s **68% expected range** is roughly **39.05 to 53.99**.
• A wider **90% range** is about **34.23 to 58.81**.
• Dealer positioning looks **LONG gamma**, so the market behavior is classified as **TRANSITION**.
• The estimated **gamma flip** is near **44.71**. Crossing and holding beyond this area can change the trading behavior.
• Approximate breakout odds: **above resistance 11.8%**, **below support 46.1%** by the target horizon.
• Options skew is tilted toward **puts**, which suggests traders are paying more for downside protection.
• Near-term implied volatility is higher than the next expiry (**IV1 118.95% vs IV2 96.81%**), which suggests **near-term event stress / backwardation**.
• Recent volume is **1.52x*2.09x** the 20-day average, which supports stronger continuation or breakout follow-through.
• On the daily chart, the stock currently looks like **UP trend (expanding)**.
• The implied distribution shows **heavier downside tail risk** than upside tail potential.