Analysis Report
Updated: 2026-03-16 08:15:43:3405 MYT
Source File: combined-summary-20260316-084334.154304.md
Screening Source:
screen-report-20260316-Extracted Symbols: AAOI,084244.154250.mdMULL, UVXY, CRCA, USO, AXTI, UCO, TERNAXTI
Topline Summary
| Symbol | Spot | Support | Resistance | Flip | Regime | P>Res | P<Sup | 68% Range | 90% Range |
|---|---|---|---|---|---|---|---|---|---|
| AAOI | 96.81 | TREND | |||||||
| 0.0% | |||||||||
| AXTI | 48.86 | TRANSITION | 38.74 - 58.98 | 32. | |||||
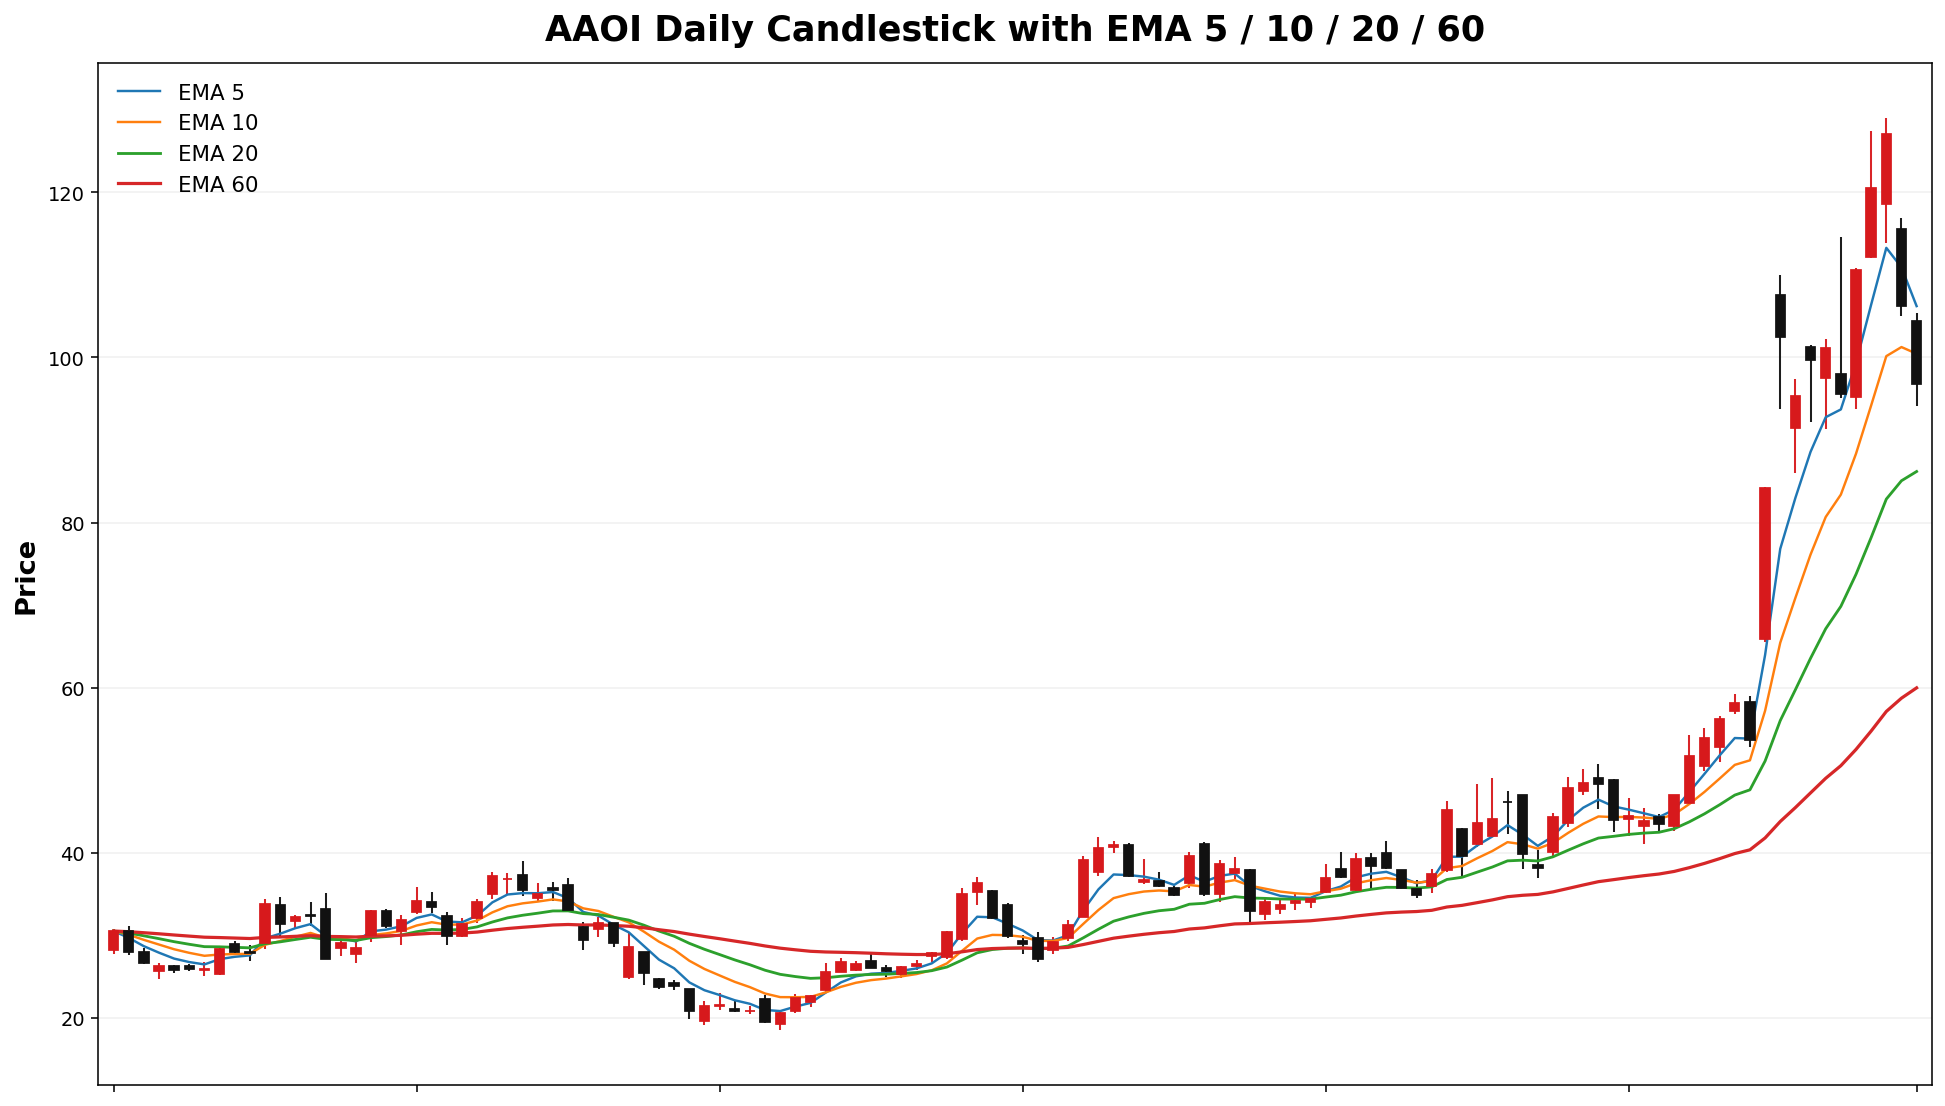
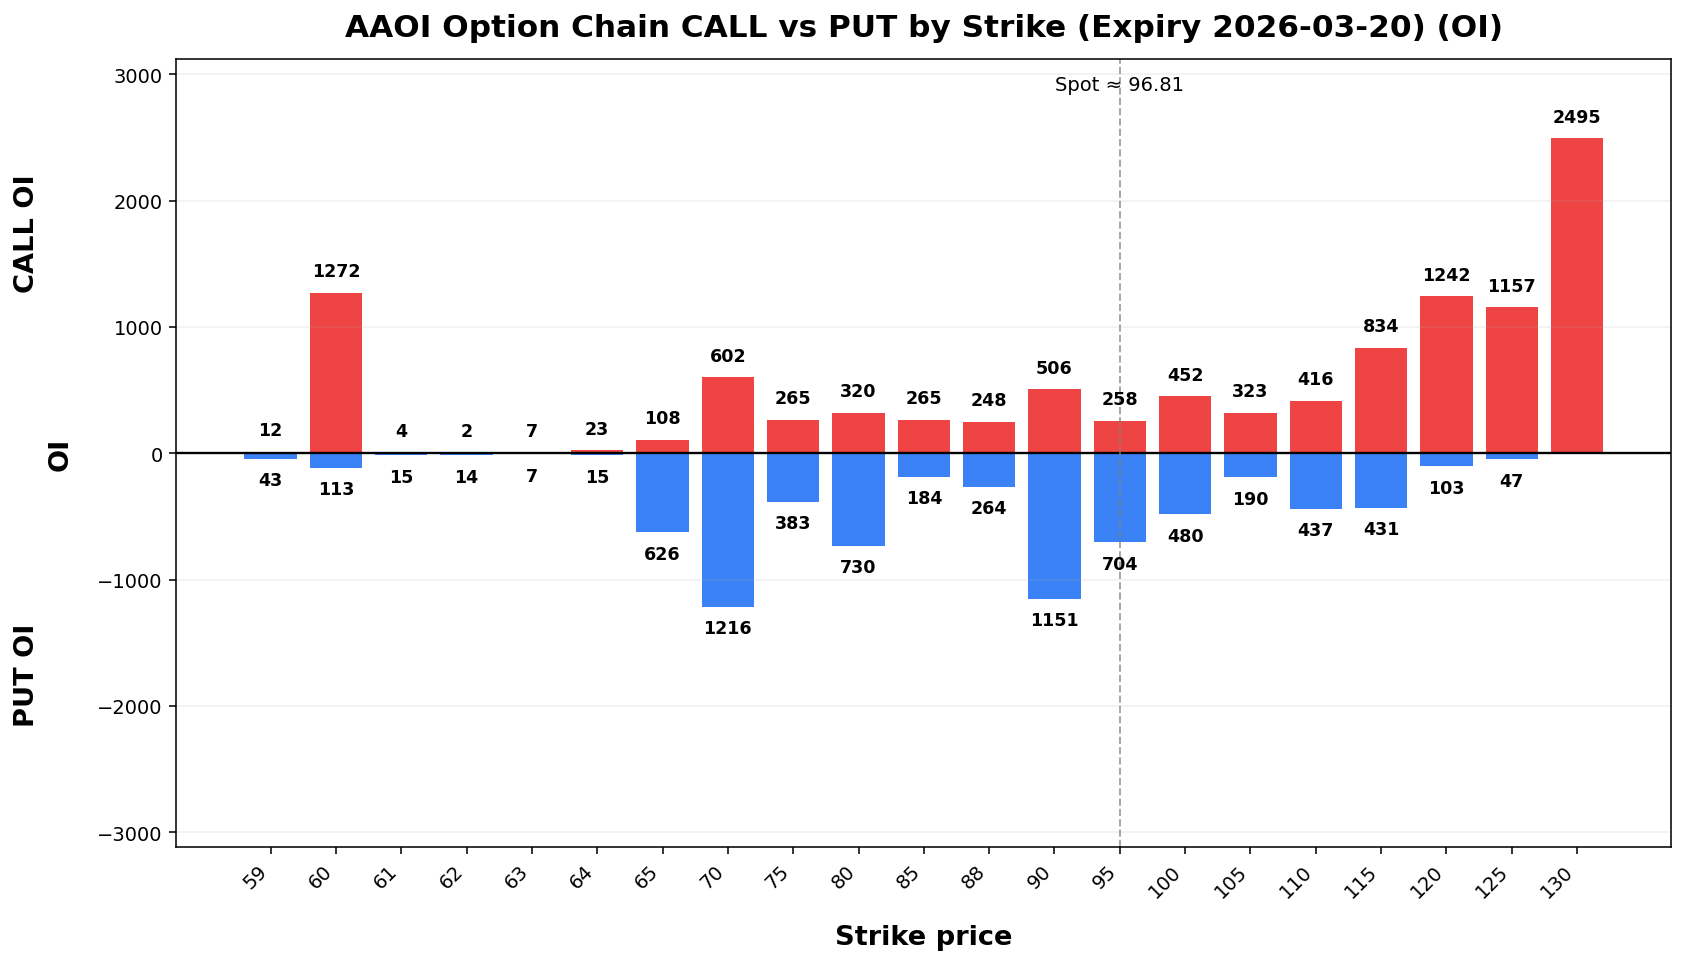
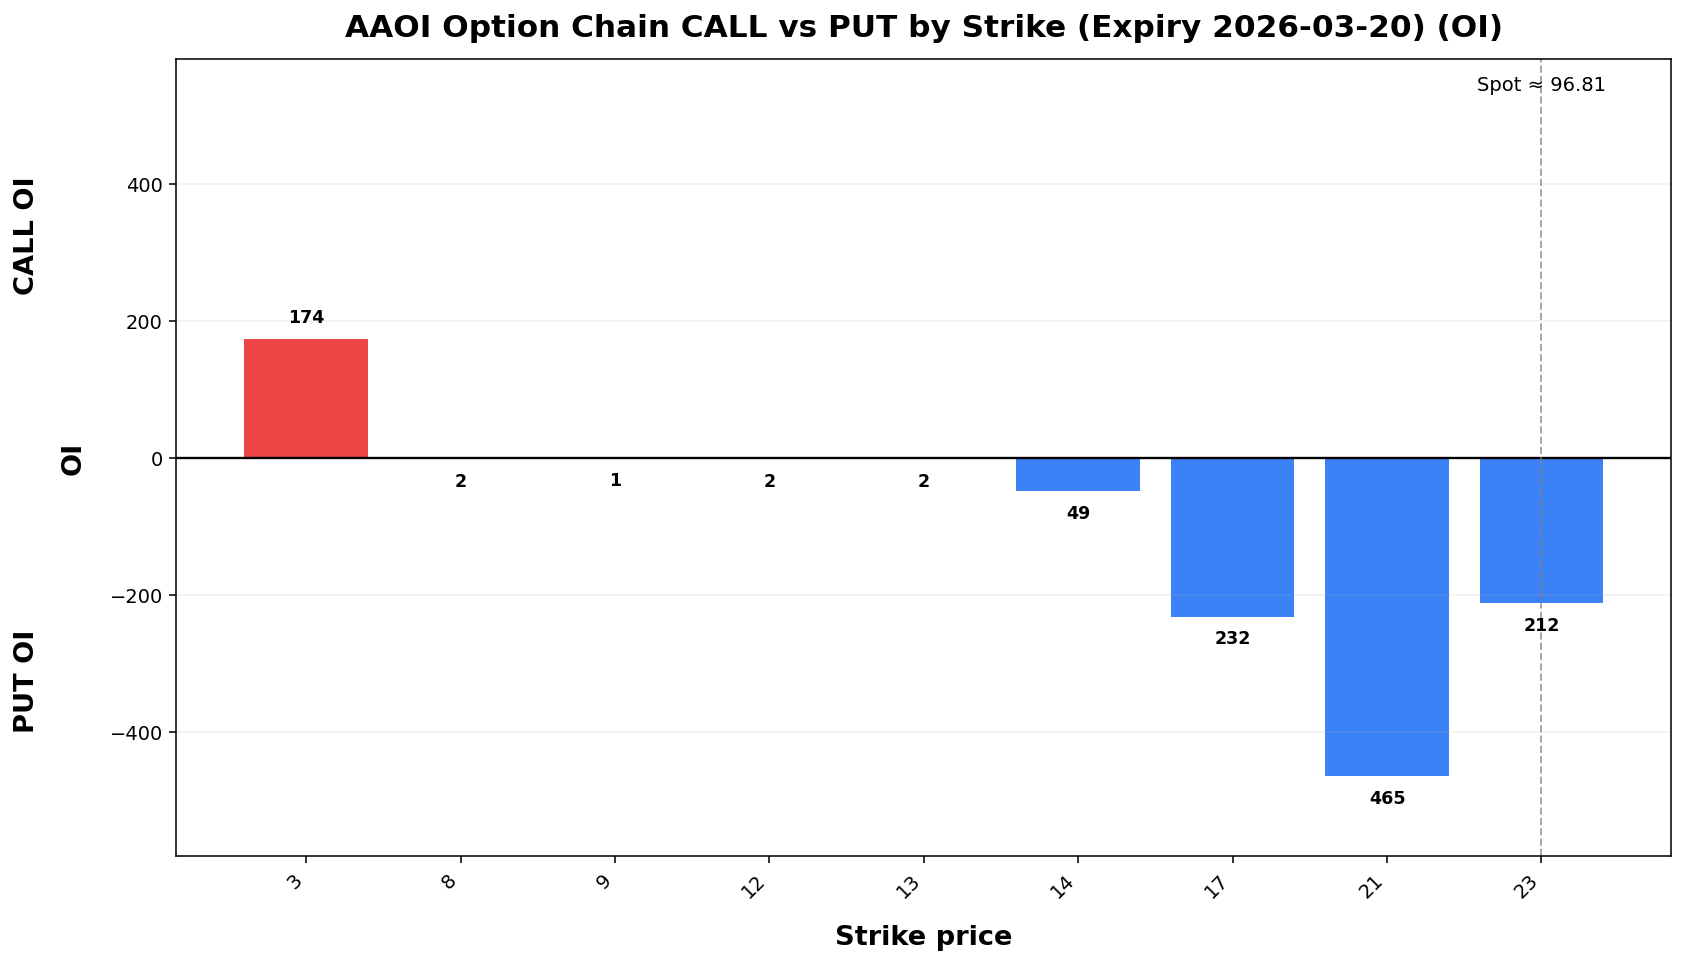
AAOI
Spot: 96.81
Report Time: 2026-03-16 08:03:42 AMPM MYT
Regime: TREND
Dealer Gamma: SHORT

Term Structure
| Expiry | DTE | Forward | ATM IV | ATM Straddle |
|---|---|---|---|---|
| 2026-03-20 | 5 | |||
| 2026-03-27 | 12 |
Weekly Range
| Confidence | Low | High | Width |
|---|---|---|---|
| 68% | |||
| 80% | |||
| 90% | |||
| 95% |
Structure & Probabilities
| Support | Resistance | Gamma Flip | Max Pain | P>Res | P<Sup |
|---|---|---|---|---|---|
| 1.00 |
Flow & Skew
| Call Vol | Put Vol | Vol P/C | Call OI | Put OI | OI P/C | Skew | Skew Bias |
|---|---|---|---|---|---|---|---|
| 11,537 | 4,641 | 0.40 | PUT_SKEW |
Tail Risk
| Q10 | Q50 | Q90 | Down Tail | Up Tail | Down/Up |
|---|---|---|---|---|---|
Daily Technicals
| EMA20 | EMA50 | VWAP20 | BB Lower | BB Mid | BB Upper | BB Width | Vol Ratio | Path |
|---|---|---|---|---|---|---|---|---|
| 86.18 | 63.92 | 91.44 | 21.94 | 79.61 | 137.28 | 144.88% | 1.41 | UP trend (expanding) |
Day Plan
90.23.00-120.00115.29 range: fade extremes- >
120.00:115.29: chase only if hold + vol - <
90.23.00: risk expand; reduce size - Regime: TREND
- Tech: UP trend (expanding)
Swing Plan
- Accumulate:
90.23.00-90.23.00 - Trim:
120.00-120.00115.29-115.29 - Add: close >
120.00115.29 - Cut: close <
90.23.00 - Best for: trend regime
Raw Text Summary
📌 AAOI @ 96.81 (2026-03-16 08:03:42 AMPM MYT)

• Current price is **96.81**. Key support is around **90.23.00**, and resistance is around **120.00*115.29**.
• For the next week, the model’s **68% expected range** is roughly **79.4778.33 to 114.15*115.29**.
• A wider **90% range** is about **68.2966.41 to 125.33*127.21**.
• Dealer positioning looks **SHORT gamma**, so the market behavior is classified as **TREND**.
• The estimated **gamma flip** is near **85.68**. Crossing and holding beyond this area can change the trading behavior.
• Approximate breakout odds: **above resistance 10.1%17.6%**, **below support 46.1%0.0%** by the target horizon.
• Options skew is tilted toward **puts**, which suggests traders are paying more for downside protection.
• Near-term implied volatility is higher than the next expiry (**IV1 143.22%149.91% vs IV2 113.48%125.97%**), which suggests **near-term event stress / backwardation**.
• On the daily chart, the stock currently looks like **UP trend (expanding)**.
• The implied distribution shows **heavier downside tail risk** than upside tail potential.
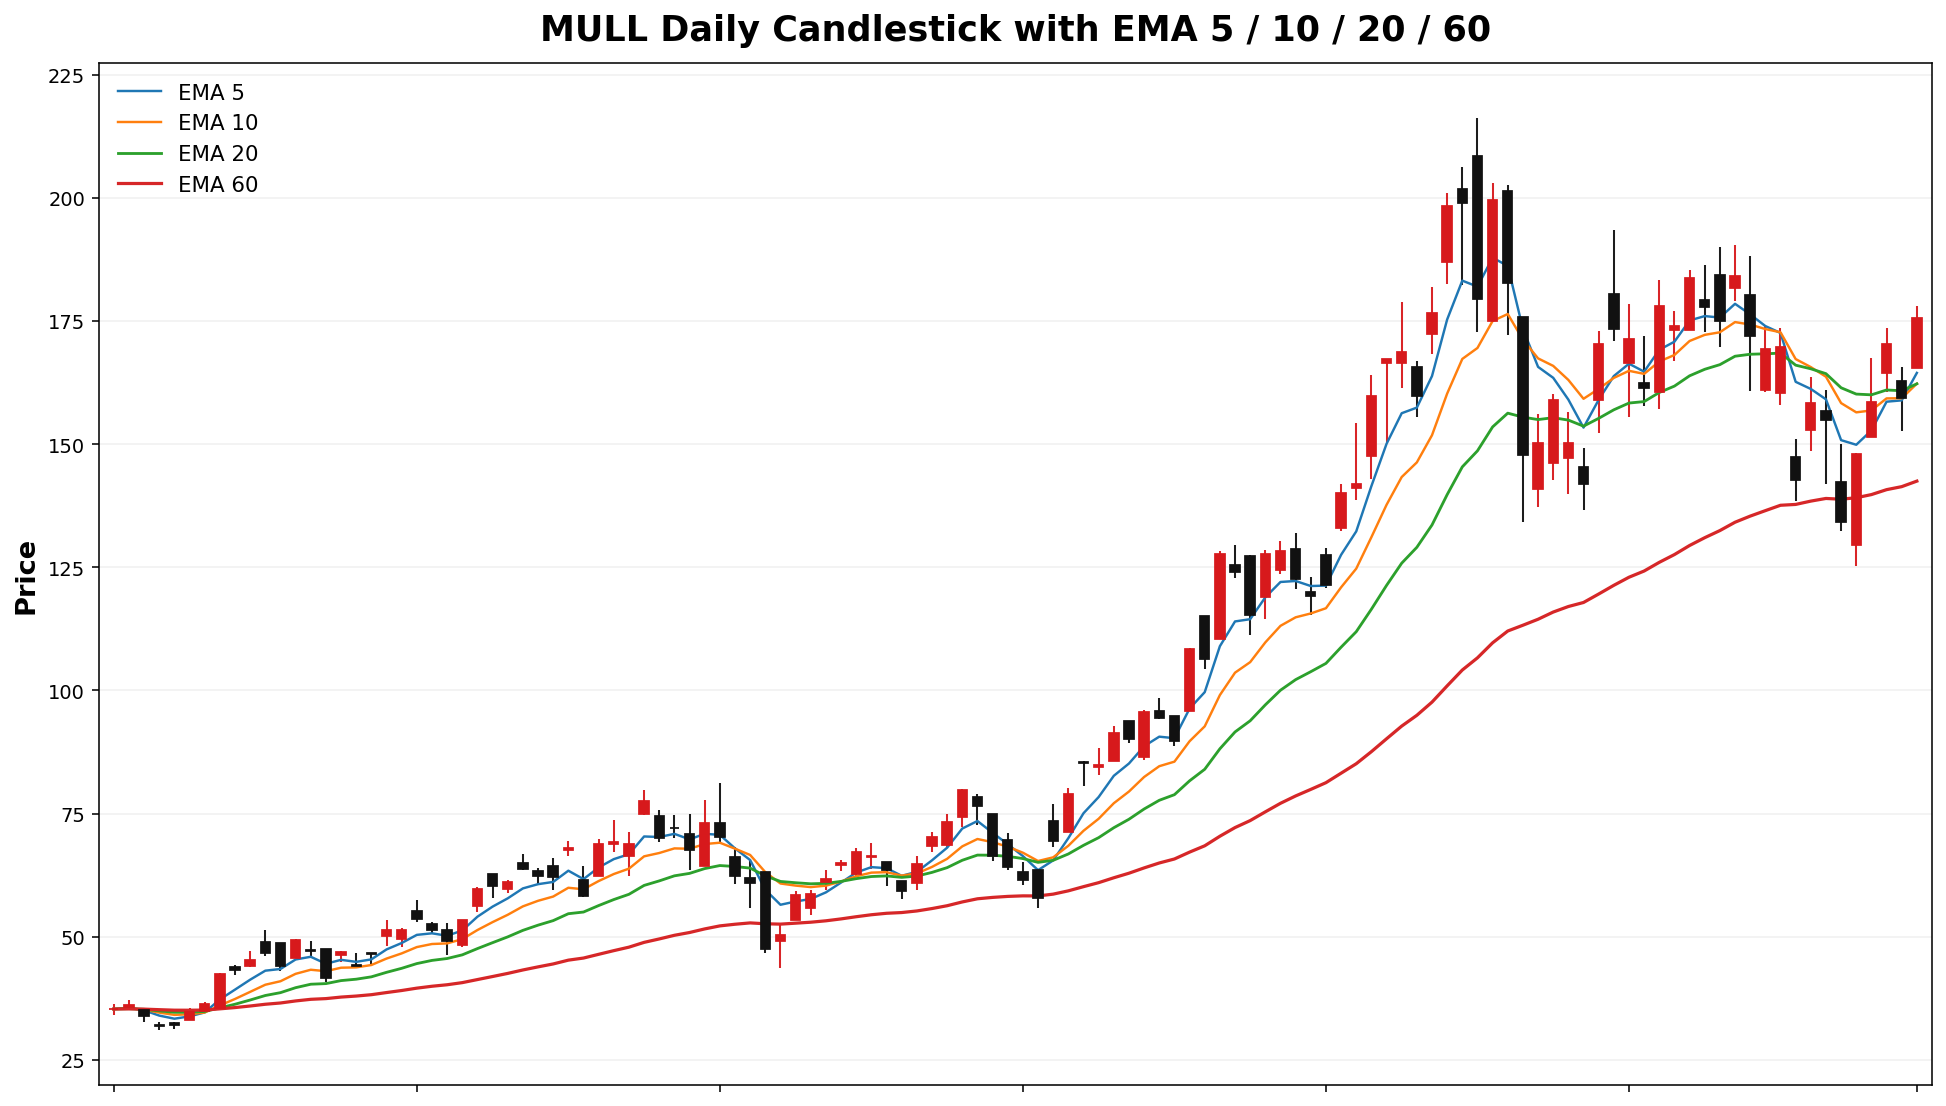
MULLAXTI
Spot: 175.6548.86
Report Time: 2026-03-16 08:4203:43 AMPM MYT
Regime: TRENDTRANSITION
Dealer Gamma: SHORTNEUTRAL

Term Structure
| Expiry | DTE | Forward | ATM IV | ATM Straddle |
|---|---|---|---|---|
| 2026-03-20 | 5 | |||
| 2026-04-17 | 33 |
Weekly Range
| Confidence | Low | High | Width |
|---|---|---|---|
| 68% | |||
| 80% | |||
| 90% | |||
| 95% |
Structure & Probabilities
| Support | Resistance | Gamma Flip | Max Pain | P>Res | P<Sup |
|---|---|---|---|---|---|
Flow & Skew
Tail Risk
Daily Technicals
Day Plan
155.00-180.00 range: fade extremes> 180.00: chase only if hold + vol< 155.00: risk expand; reduce sizeRegime: TRENDTech: UP trend (expanding)
Swing Plan
Accumulate: 155.00-155.00Trim: 180.00-180.00Add: close > 180.00Cut: close < 155.00Best for: trend regime
Raw Text Summary
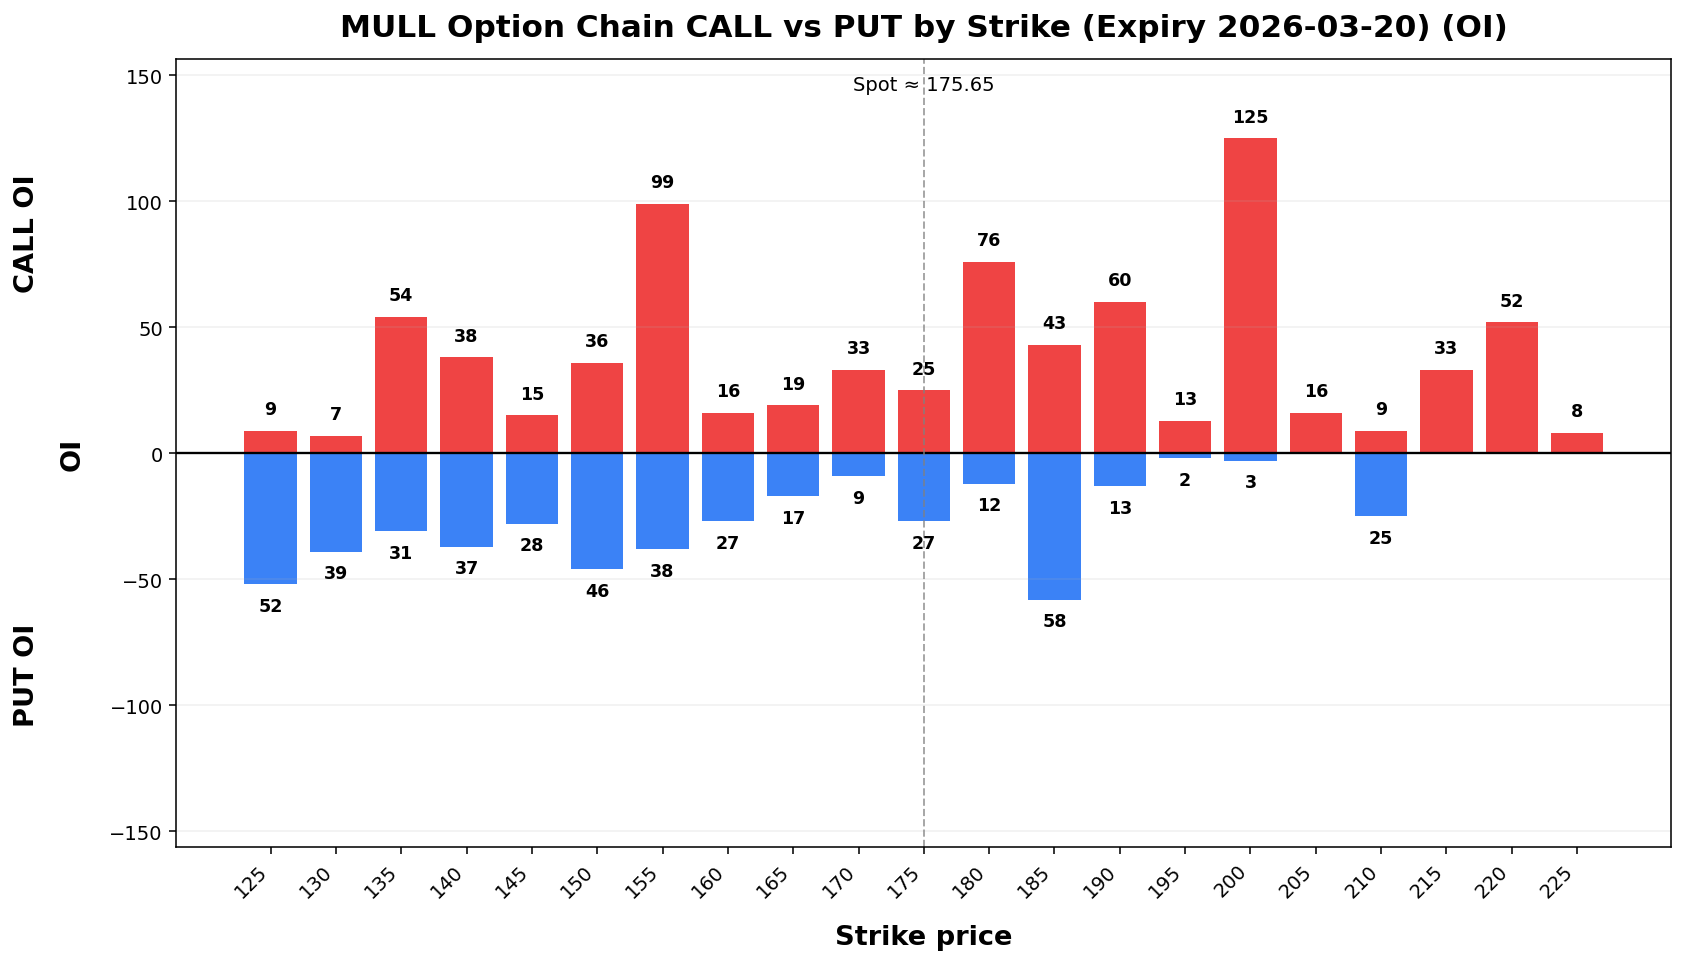
📌 MULL @ 175.65 (2026-03-16 08:42 AM MYT)

• Current price is **175.65**. Key support is around **155.00**, and resistance is around **180.00**.
• For the next week, the model’s **68% expected range** is roughly **136.57 to 214.73**.
• A wider **90% range** is about **111.37 to 239.93**.
• Dealer positioning looks **SHORT gamma**, so the market behavior is classified as **TREND**.
• The estimated **gamma flip** is near **137.81**. Crossing and holding beyond this area can change the trading behavior.
• Approximate breakout odds: **above resistance 50.6%**, **below support 39.7%** by the target horizon.
• Options skew is tilted toward **puts**, which suggests traders are paying more for downside protection.
• Near-term implied volatility is higher than the next expiry (**IV1 180.70% vs IV2 114.65%**), which suggests **near-term event stress / backwardation**.
• On the daily chart, the stock currently looks like **UP trend (expanding)**.
UVXY
Spot: 52.29
Report Time: 2026-03-16 08:43 AM MYT
Regime: TRANSITION
Dealer Gamma: LONG
Term Structure
Weekly Range
Structure & Probabilities
Flow & Skew
Tail Risk
Daily Technicals
Day Plan
50.00-55.00 range: fade extremes> 55.00: chase only if hold + vol< 50.00: risk expand; reduce sizeRegime: TRANSITIONTech: UP trend (expanding)
Swing Plan
Accumulate: 50.00-50.00Trim: 55.00-55.00Add: close > 55.00Cut: close < 50.00Best for: transition regime
Raw Text Summary
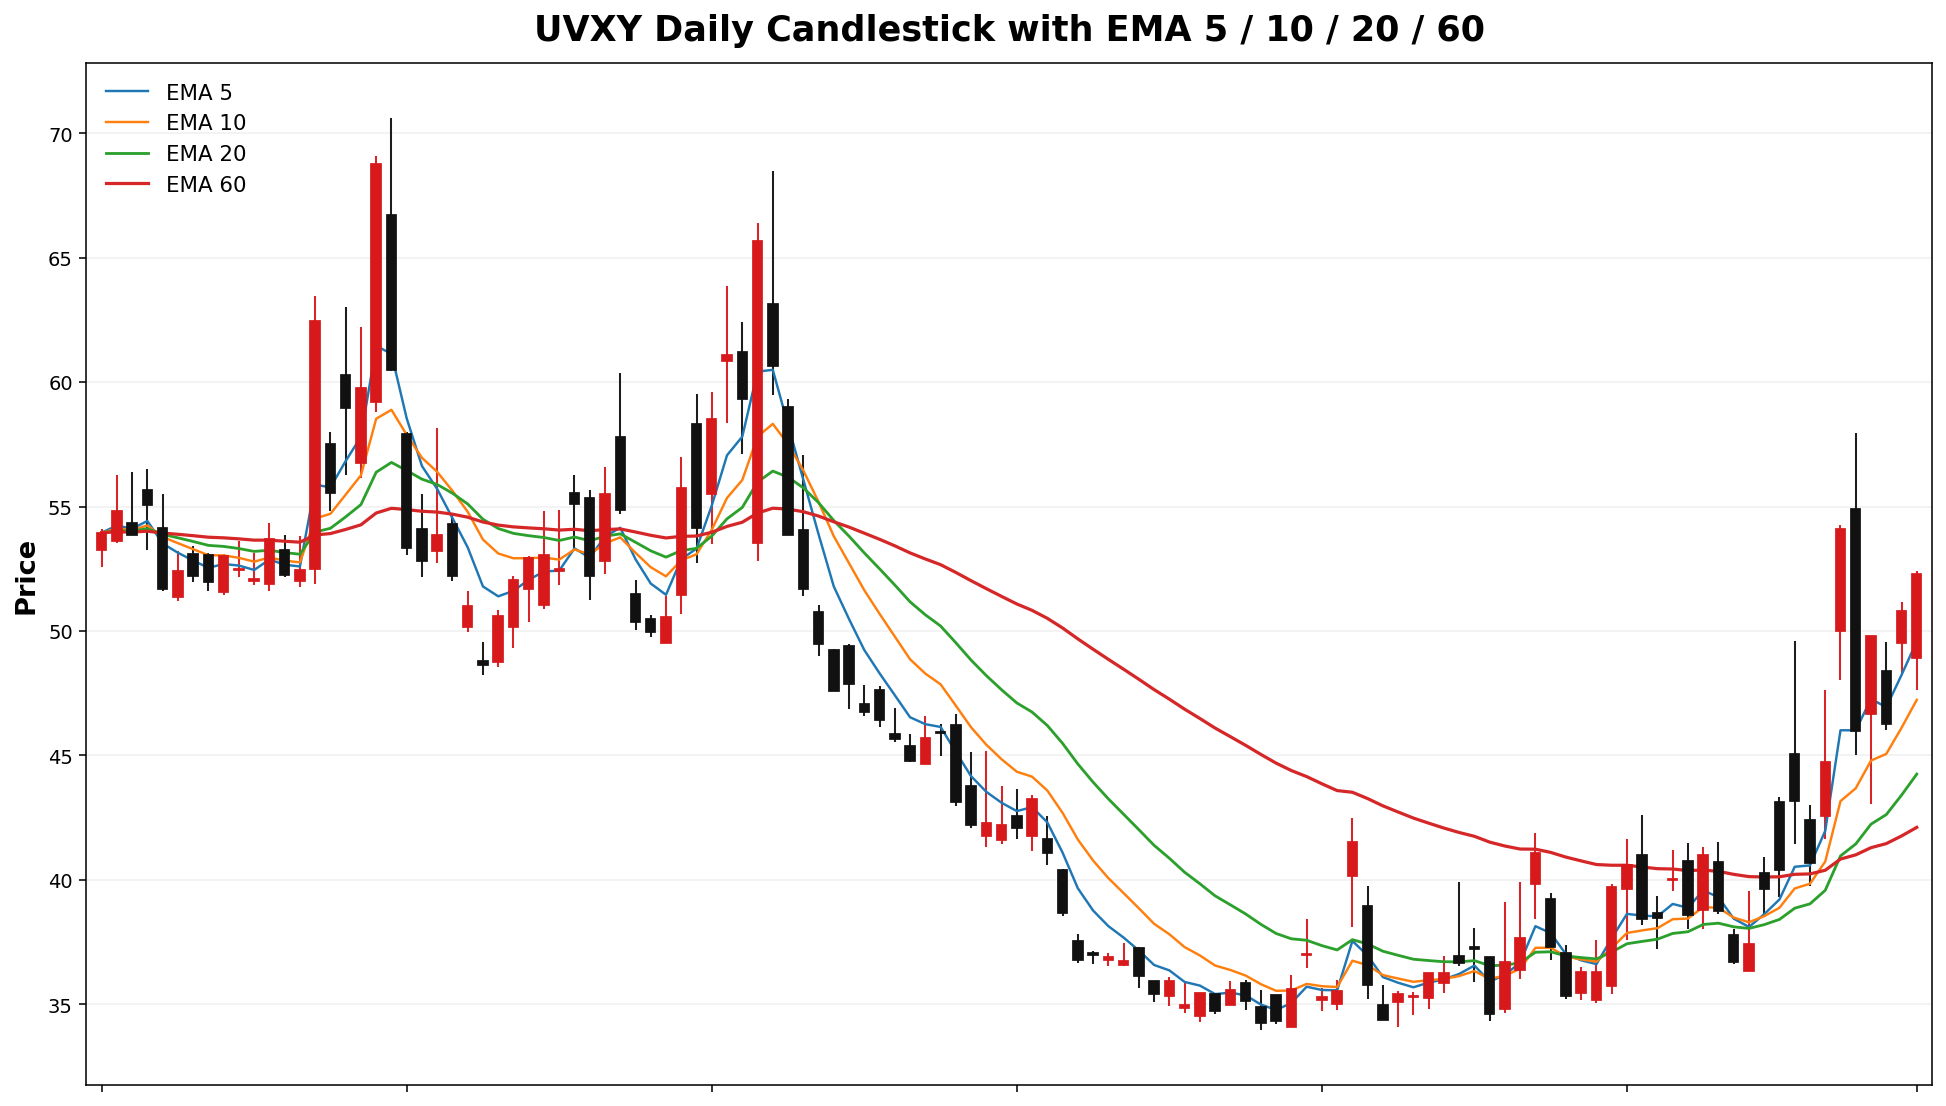
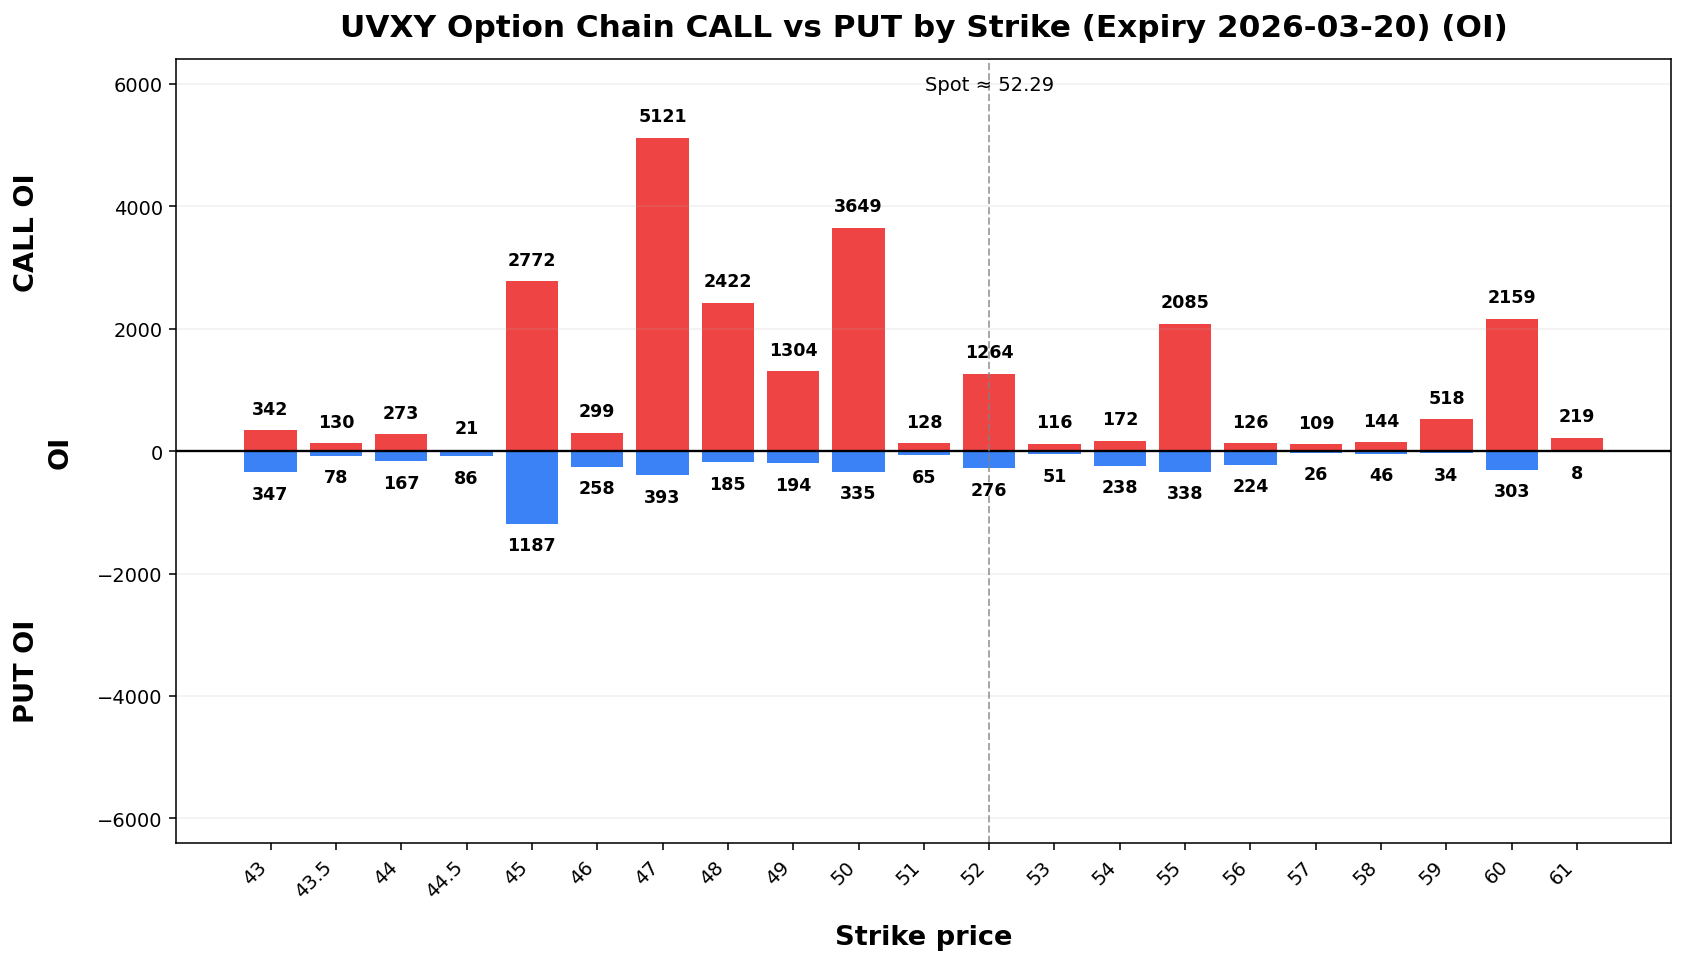
📌 UVXY @ 52.29 (2026-03-16 08:43 AM MYT)

• Current price is **52.29**. Key support is around **50.00**, and resistance is around **55.00**.
• For the next week, the model’s **68% expected range** is roughly **41.84 to 62.74**.
• A wider **90% range** is about **35.11 to 69.47**.
• Dealer positioning looks **LONG gamma**, so the market behavior is classified as **TRANSITION**.
• The estimated **gamma flip** is near **33.68**. Crossing and holding beyond this area can change the trading behavior.
• Approximate breakout odds: **above resistance 36.3%**, **below support 31.6%** by the target horizon.
• Options skew is tilted toward **calls**, which suggests upside speculation is relatively stronger.
• Near-term implied volatility is higher than the next expiry (**IV1 145.92% vs IV2 138.62%**), which suggests **near-term event stress / backwardation**.
• Recent volume is only **0.63x** the 20-day average, so breakouts may be less reliable unless volume improves.
• On the daily chart, the stock currently looks like **UP trend (expanding)**.
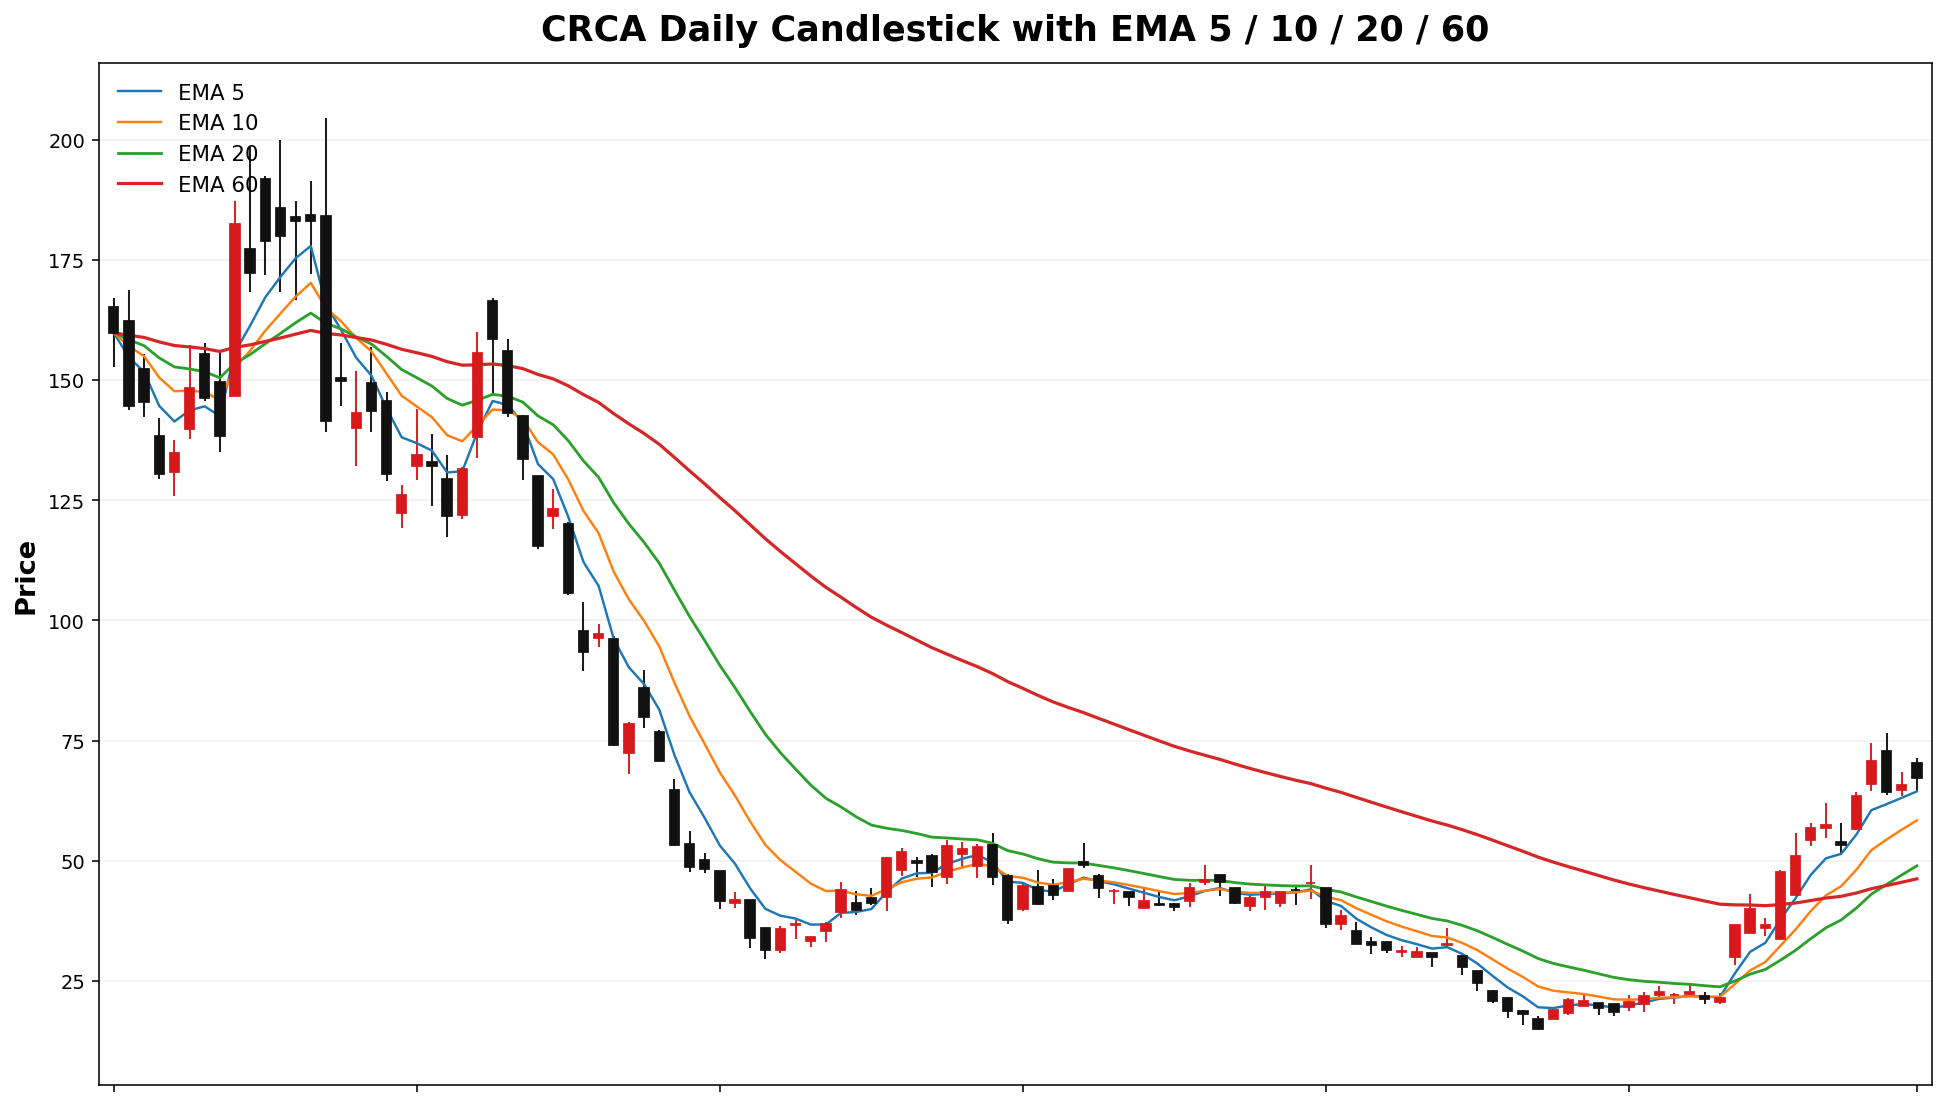
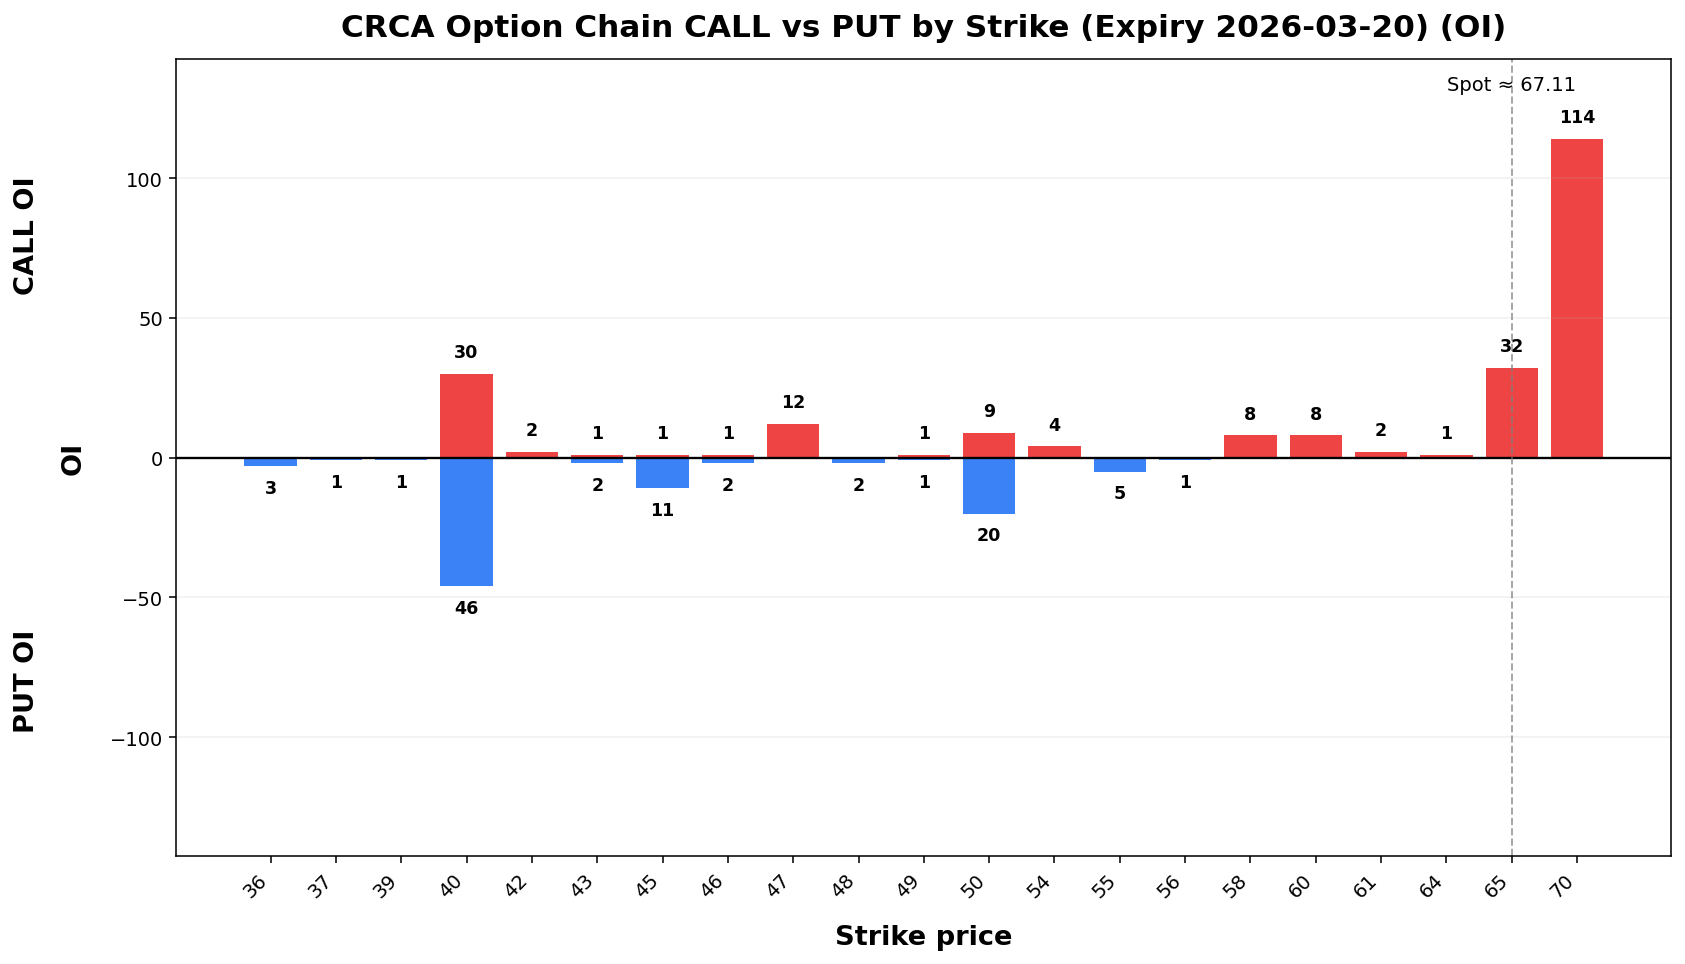
CRCA
Spot: 67.11
Report Time: 2026-03-16 08:43 AM MYT
Regime: TRANSITION
Dealer Gamma: LONG
Term Structure
Weekly Range
Structure & Probabilities
Flow & Skew
Tail Risk
Daily Technicals
Day Plan
20.00-70.00 range: fade extremes> 70.00: chase only if hold + vol< 20.00: risk expand; reduce sizeRegime: TRANSITIONTech: UP trend (expanding)
Swing Plan
Accumulate: 20.00-20.00Trim: 70.00-70.00Add: close > 70.00Cut: close < 20.00Best for: transition regime
Raw Text Summary
📌 CRCA @ 67.11 (2026-03-16 08:43 AM MYT)

• Current price is **67.11**. Key support is around **20.00**, and resistance is around **70.00**.
• For the next week, the model’s **68% expected range** is roughly **54.05 to 80.17**.
• A wider **90% range** is about **45.63 to 88.59**.
• Dealer positioning looks **LONG gamma**, so the market behavior is classified as **TRANSITION**.
• The estimated **gamma flip** is near **42.18**. Crossing and holding beyond this area can change the trading behavior.
• Approximate breakout odds: **above resistance 31.5%**, **below support 0.0%** by the target horizon.
• Options skew is tilted toward **puts**, which suggests traders are paying more for downside protection.
• Near-term implied volatility is higher than the next expiry (**IV1 146.18% vs IV2 124.80%**), which suggests **near-term event stress / backwardation**.
• Recent volume is only **0.48x** the 20-day average, so breakouts may be less reliable unless volume improves.
• On the daily chart, the stock currently looks like **UP trend (expanding)**.
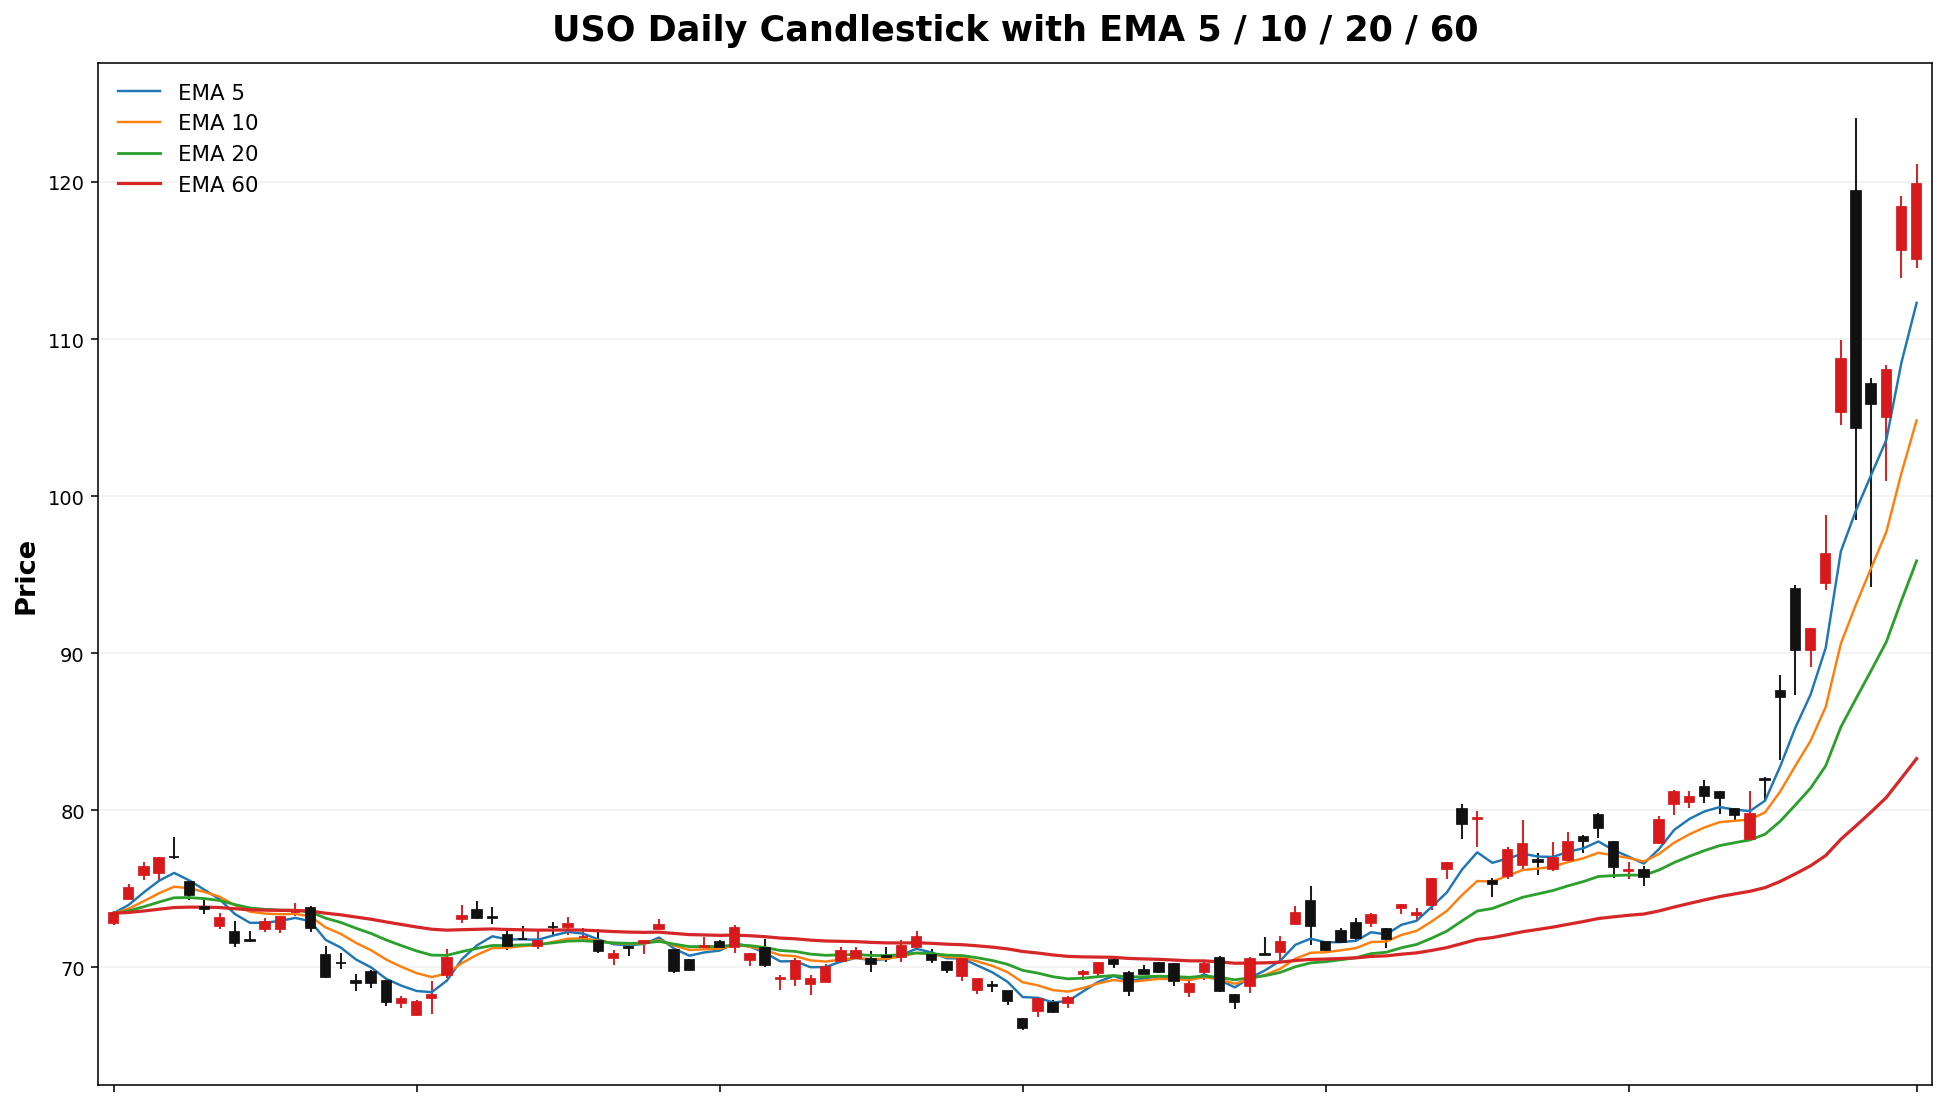
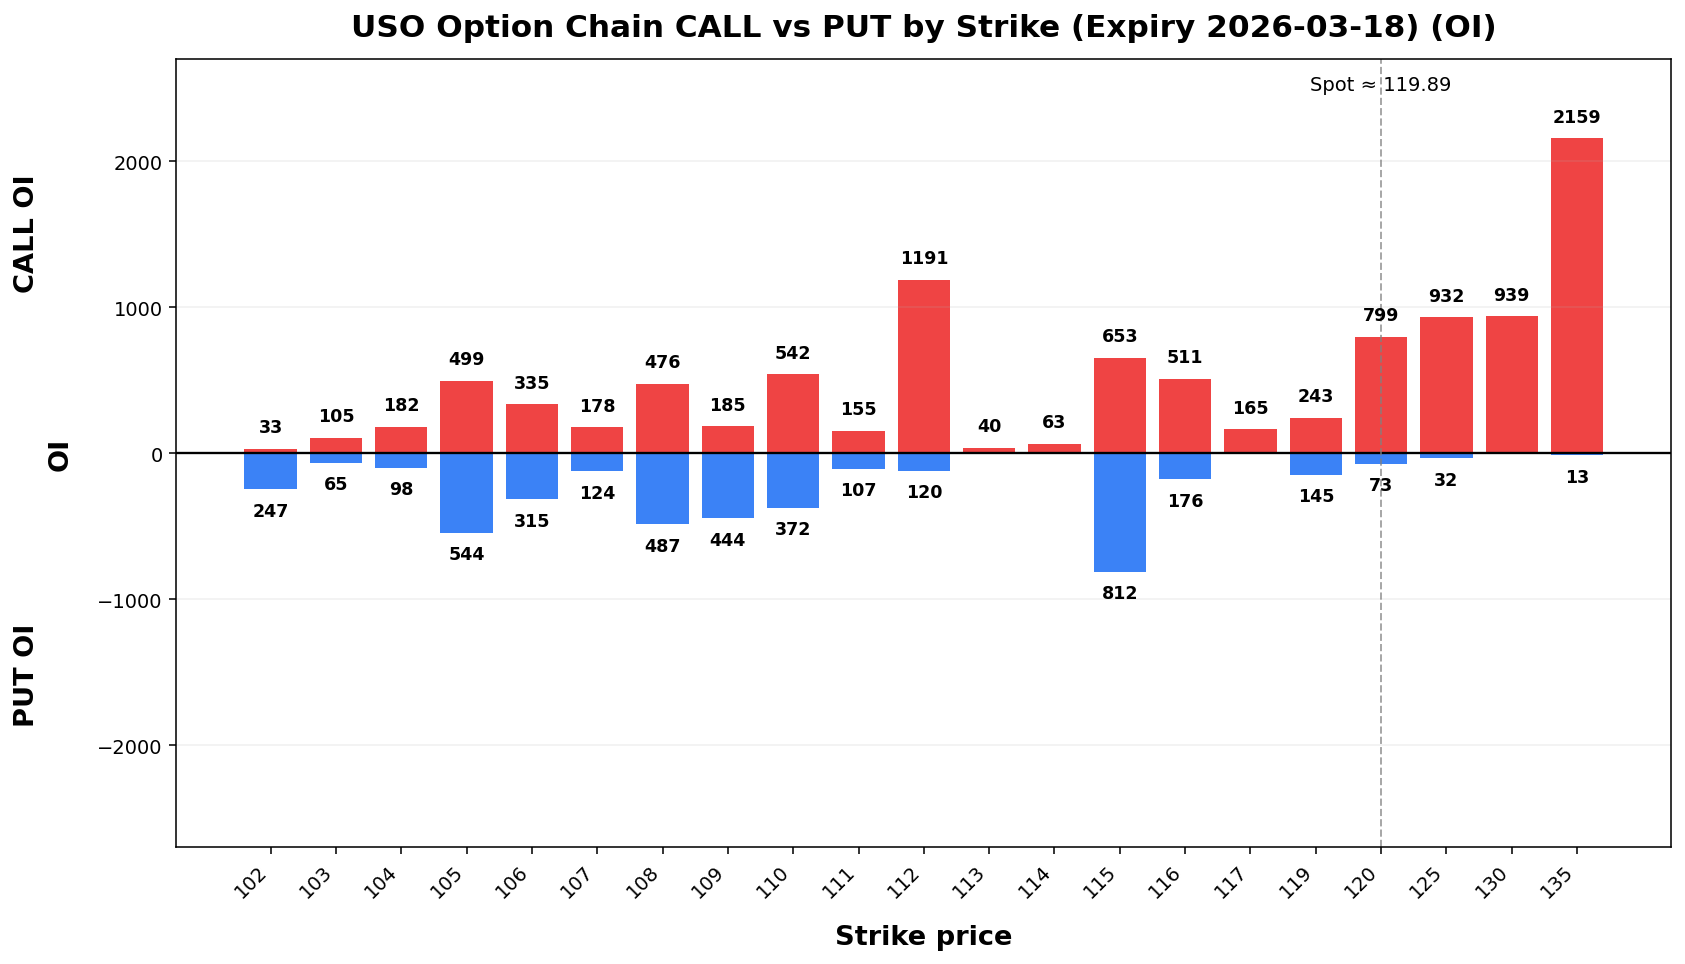
USO
Spot: 119.89
Report Time: 2026-03-16 08:43 AM MYT
Regime: TRANSITION
Dealer Gamma: LONG
Term Structure
Weekly Range
Structure & Probabilities
Flow & Skew
Tail Risk
Daily Technicals
Day Plan
112.00-125.00 range: fade extremes> 125.00: chase only if hold + vol< 112.00: risk expand; reduce sizeRegime: TRANSITIONTech: UP trend (expanding)
Swing Plan
Accumulate: 112.00-112.00Trim: 125.00-125.00Add: close > 125.00Cut: close < 112.00Best for: transition regime
Raw Text Summary
📌 USO @ 119.89 (2026-03-16 08:43 AM MYT)

• Current price is **119.89**. Key support is around **112.00**, and resistance is around **125.00**.
• For the next week, the model’s **68% expected range** is roughly **99.17 to 140.61**.
• A wider **90% range** is about **85.81 to 153.97**.
• Dealer positioning looks **LONG gamma**, so the market behavior is classified as **TRANSITION**.
• The estimated **gamma flip** is near **108.75**. Crossing and holding beyond this area can change the trading behavior.
• Approximate breakout odds: **above resistance 33.1%**, **below support 34.5%** by the target horizon.
• Options skew is tilted toward **puts**, which suggests traders are paying more for downside protection.
• Near-term implied volatility is higher than the next expiry (**IV1 133.29% vs IV2 126.20%**), which suggests **near-term event stress / backwardation**.
• On the daily chart, the stock currently looks like **UP trend (expanding)**.
• The implied distribution shows **more upside tail potential** than downside tail risk.
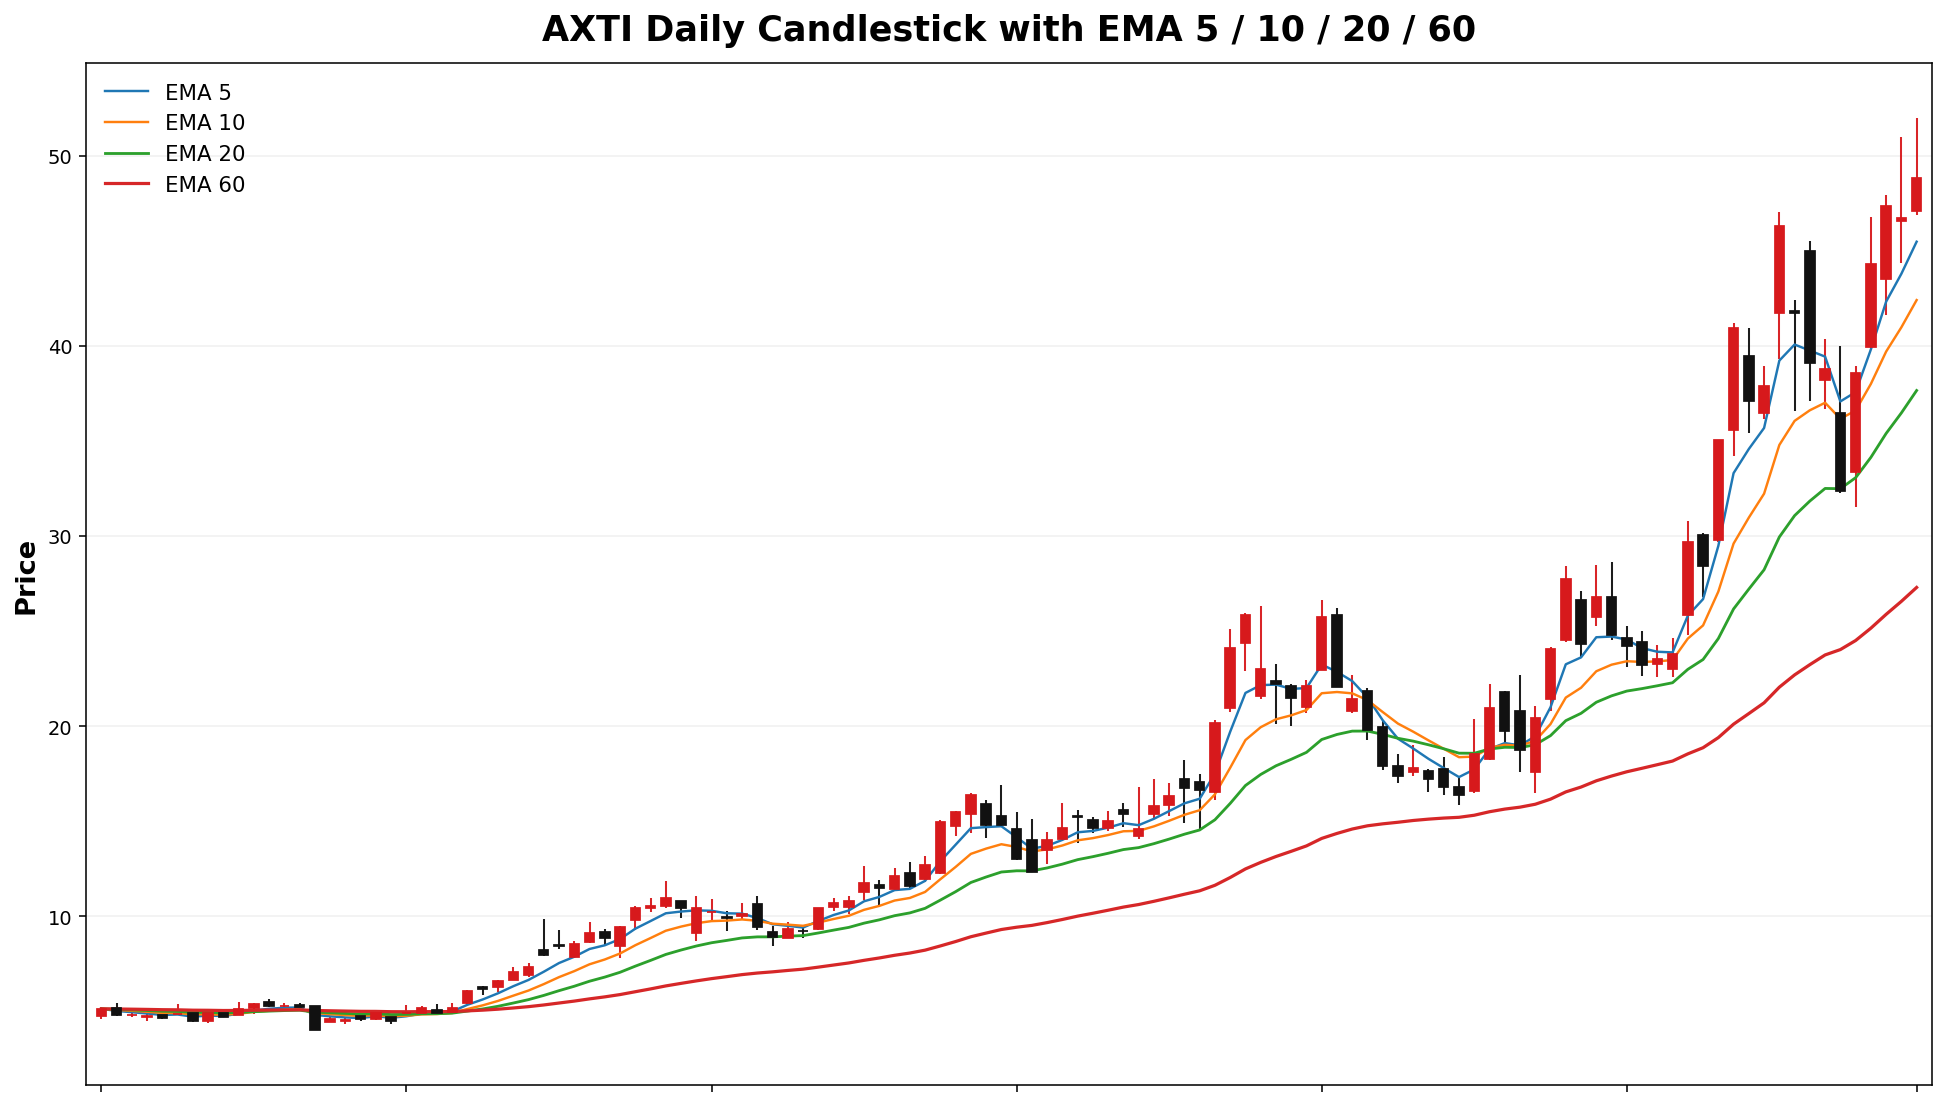
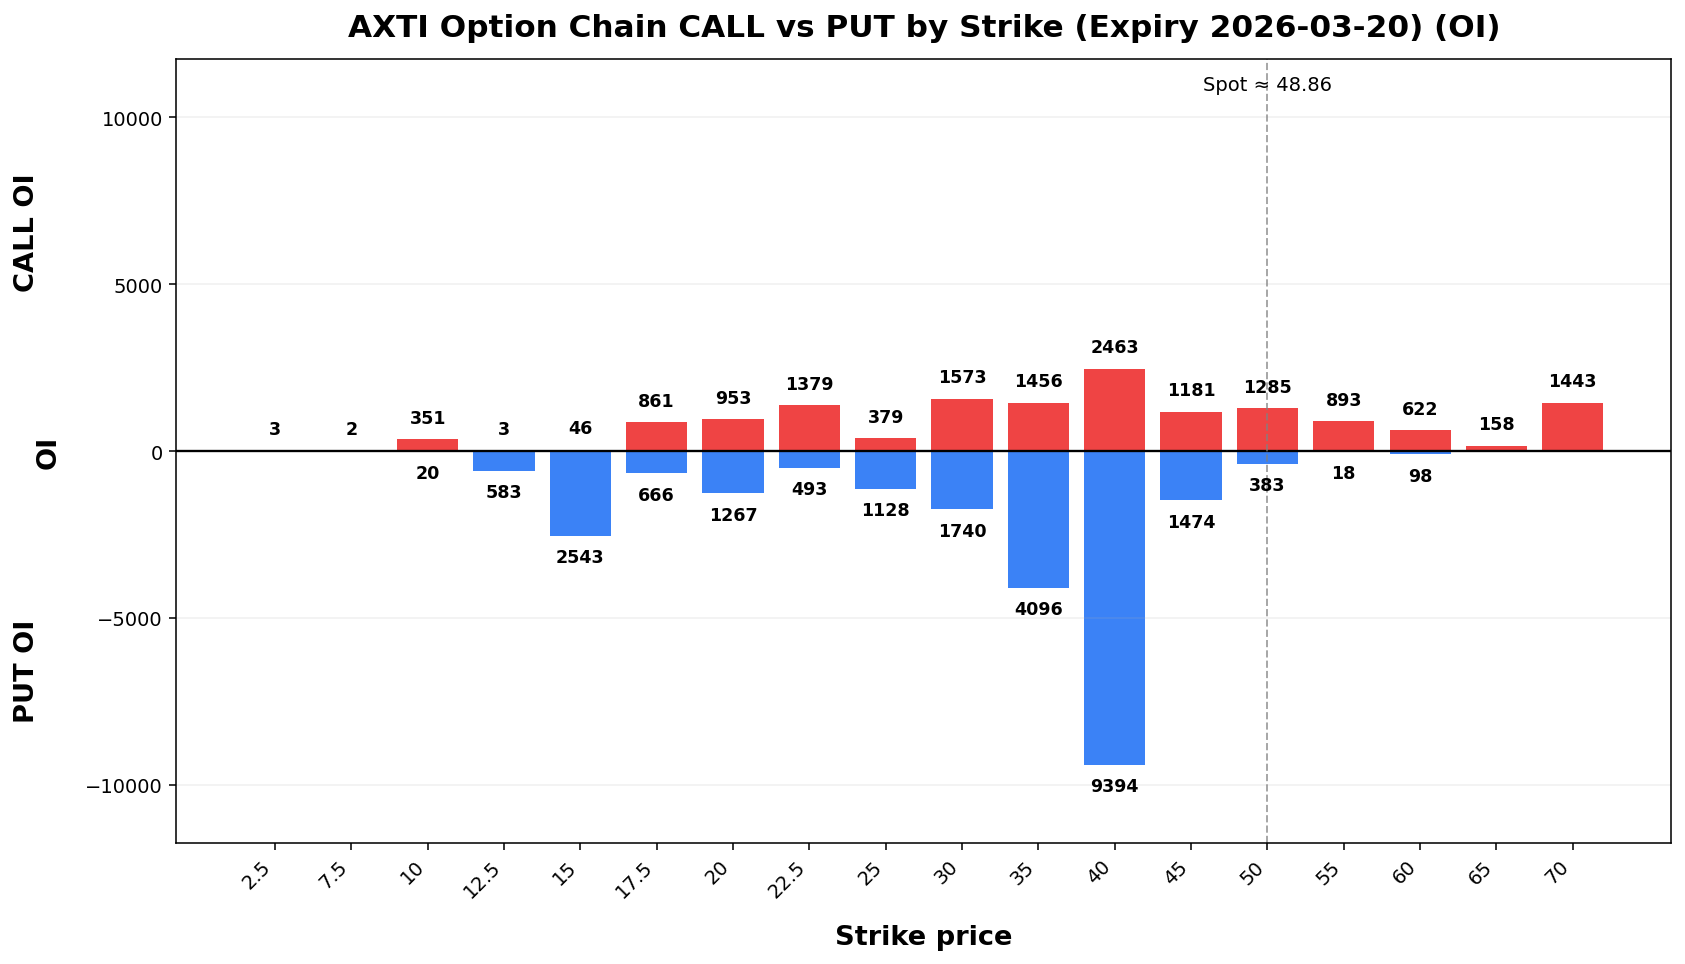
AXTI
Spot: 48.86
Report Time: 2026-03-16 08:43 AM MYT
Regime: TRANSITION
Dealer Gamma: LONG
Term Structure
Weekly Range
| 38.74 | 58.98 | ||
Structure & Probabilities
Flow & Skew
| Call Vol | Put Vol | Vol P/C | Call OI | Put OI | OI P/C | Skew | Skew Bias |
|---|---|---|---|---|---|---|---|
| 6,369 | 4,945 | 0.78 |
Tail Risk
| Q10 | Q50 | Q90 | Down Tail | Up Tail | Down/Up |
|---|---|---|---|---|---|
Daily Technicals
| EMA20 | EMA50 | VWAP20 | BB Lower | BB Mid | BB Upper | BB Width | Vol Ratio | Path |
|---|---|---|---|---|---|---|---|---|
| 37.66 | 29.14 | 38.30 | 19.33 | 36.41 | 53.49 | 93.82% | 1.17 | UP trend (expanding) |
Day Plan
45.00-50.0038.74-58.98 range: fade extremes- >
50.00:58.98: chase only if hold + vol - <
45.00:38.74: risk expand; reduce size - Regime: TRANSITION
- Tech: UP trend (expanding)
Swing Plan
- Accumulate:
45.00-45.0038.74-38.74 - Trim:
50.00-50.0058.98-58.98 - Add: close >
50.0058.98 - Cut: close <
45.0038.74 - Best for: transition regime
Raw Text Summary
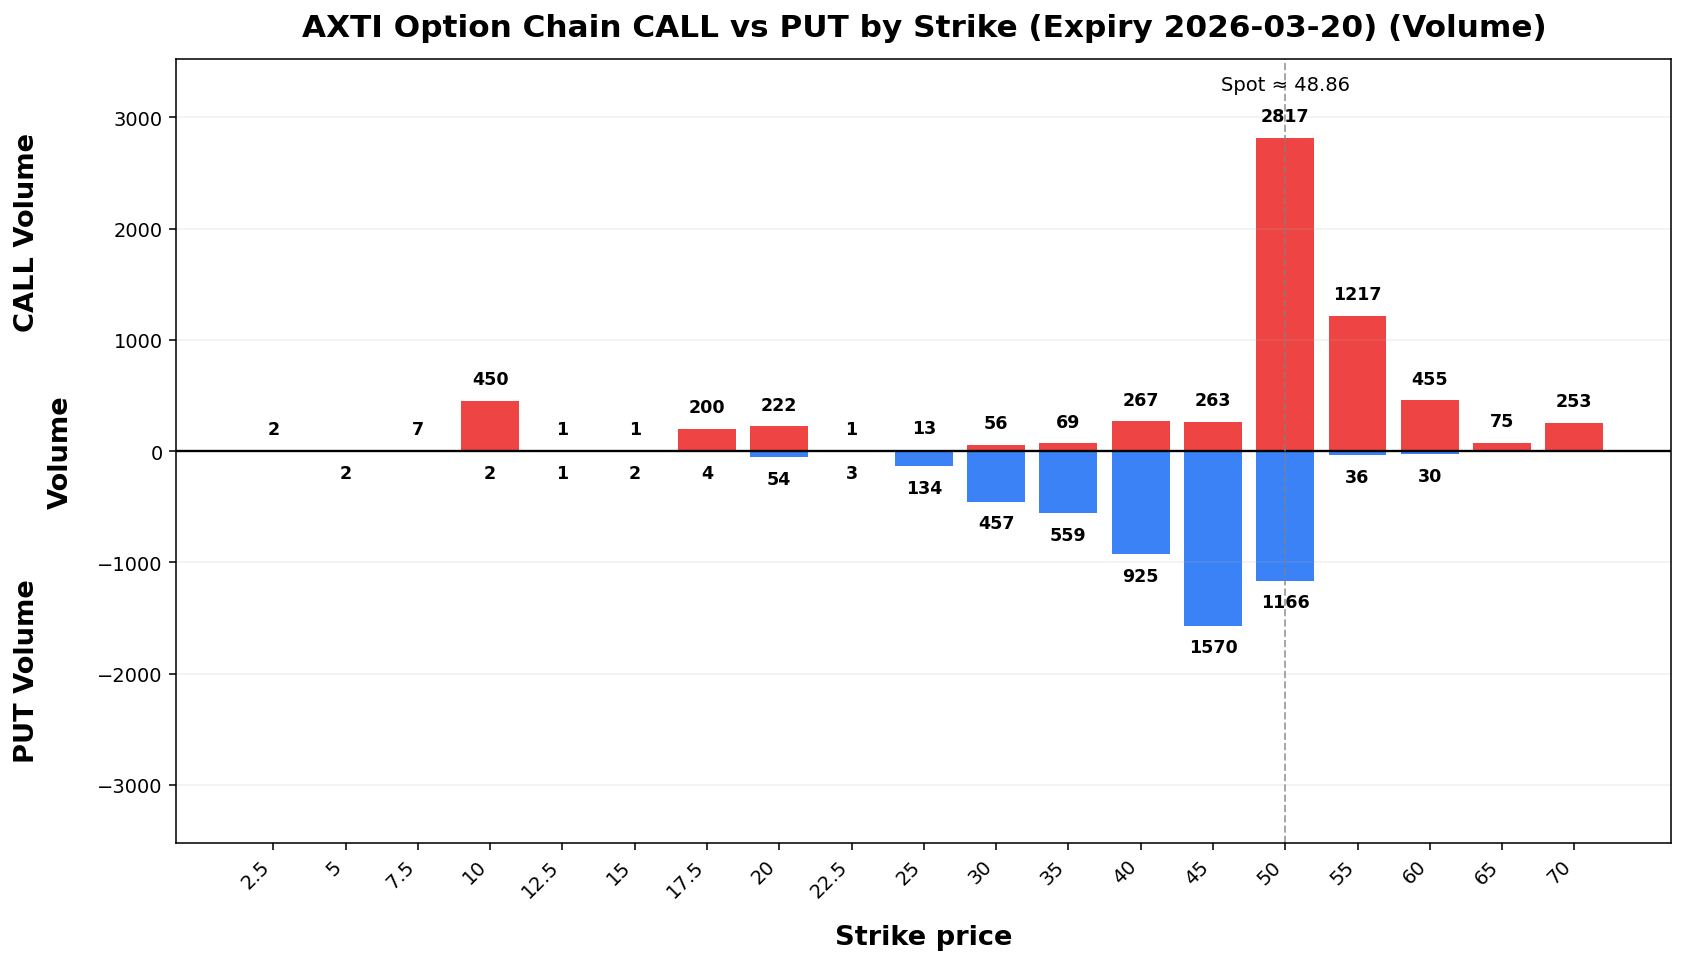
📌 AXTI @ 48.86 (2026-03-16 08:03:43 AMPM MYT)

• Current price is **48.86**. Key support is around **45.00*38.74**, and resistance is around **50.00*58.98**.
• For the next week, the model’s **68% expected range** is roughly **38.74 to 58.98**.
• A wider **90% range** is about **32.2221 to 65.50*51**.
• Dealer positioning looks **LONGNEUTRAL gamma**, so the market behavior is classified as **TRANSITION**.
• The estimated **gamma flip** is near **53.09*24.43**. Crossing and holding beyond this area can change the trading behavior.
• Approximate breakout odds: **above resistance 44.7%15.3%**, **below support 28.9%18.3%** by the target horizon.
• Options skew is tilted toward **calls*puts**, which suggests upsidetraders speculationare ispaying relativelymore stronger.for downside protection.
• Near-term implied volatility is higher than the next expiry (**IV1 159.73%162.42% vs IV2 124.98%58%**), which suggests **near-term event stress / backwardation**.
• On the daily chart, the stock currently looks like **UP trend (expanding)**.
• The implied distribution shows **heavier downside tail risk** than upside tail potential.
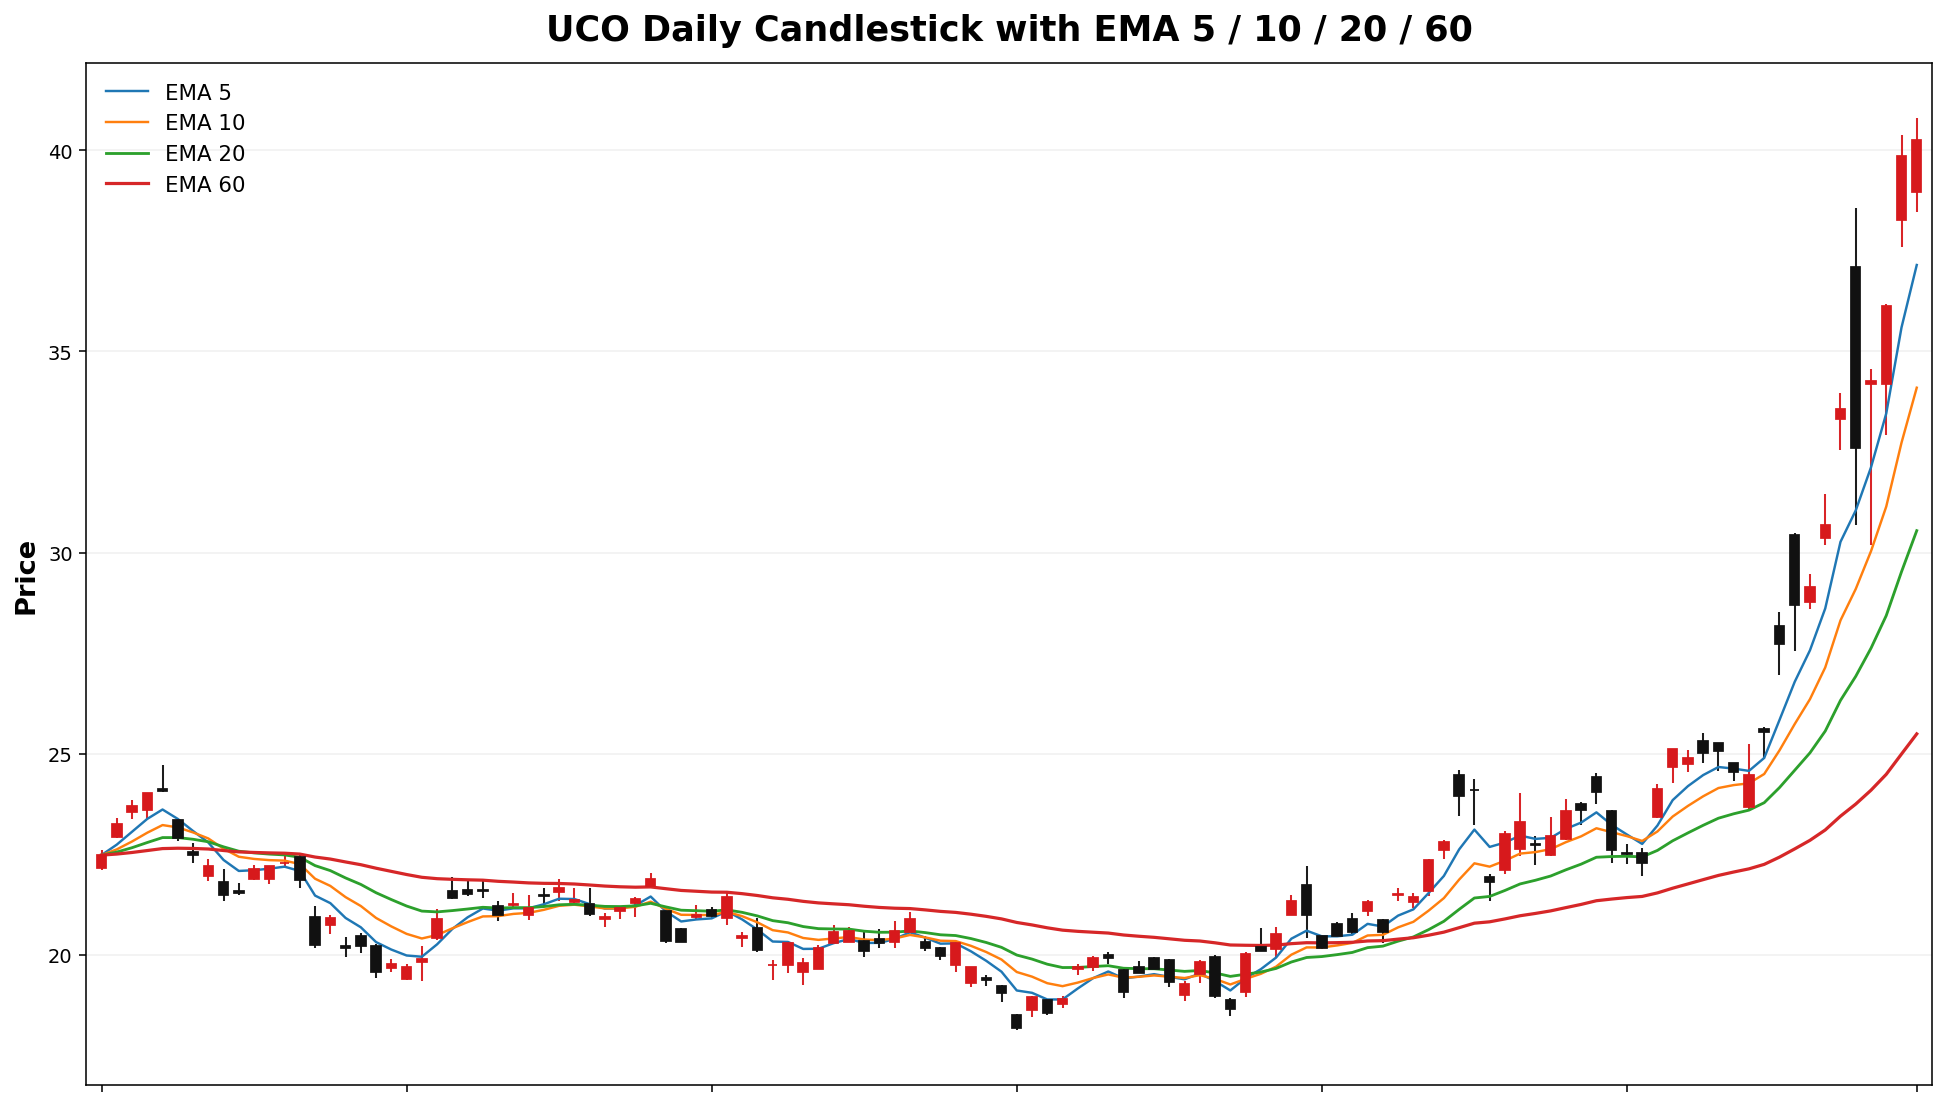
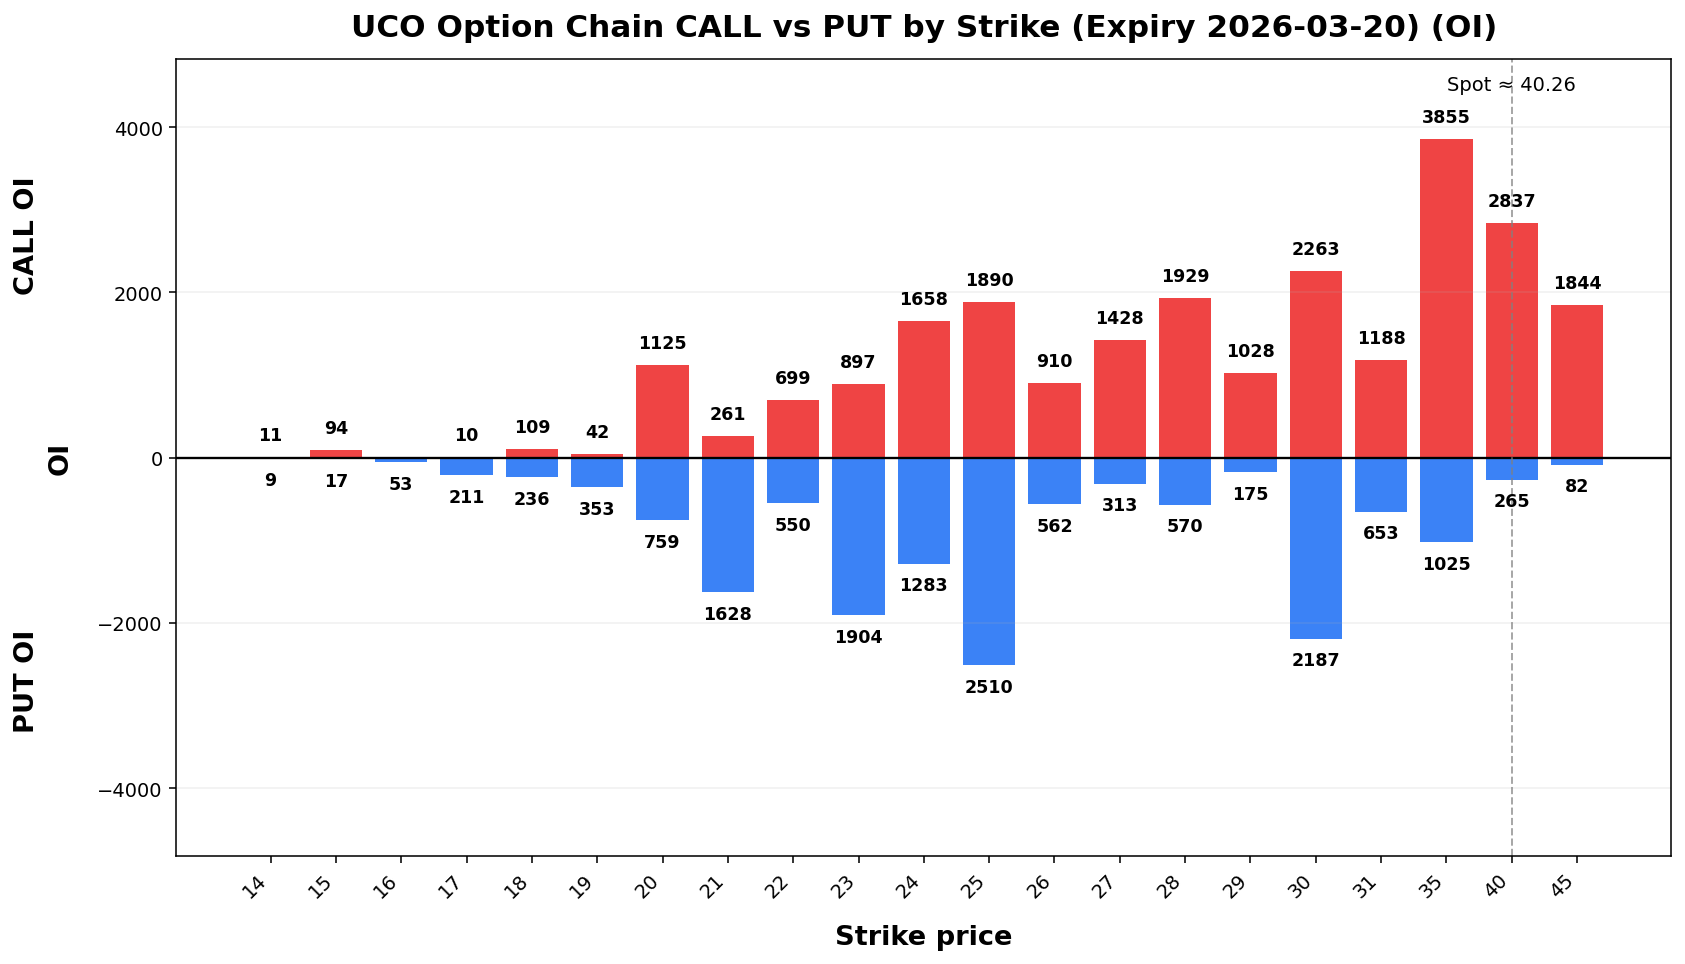
UCO
Spot: 40.26
Report Time: 2026-03-16 08:43 AM MYT
Regime: TRANSITION
Dealer Gamma: LONG
Term Structure
Weekly Range
Structure & Probabilities
Flow & Skew
Tail Risk
Daily Technicals
Day Plan
40.00-45.00 range: fade extremes> 45.00: chase only if hold + vol< 40.00: risk expand; reduce sizeRegime: TRANSITIONTech: UP trend (expanding)
Swing Plan
Accumulate: 40.00-40.00Trim: 45.00-45.00Add: close > 45.00Cut: close < 40.00Best for: transition regime
Raw Text Summary
📌 UCO @ 40.26 (2026-03-16 08:43 AM MYT)

• Current price is **40.26**. Key support is around **40.00**, and resistance is around **45.00**.
• For the next week, the model’s **68% expected range** is roughly **30.73 to 49.79**.
• A wider **90% range** is about **24.58 to 55.94**.
• Dealer positioning looks **LONG gamma**, so the market behavior is classified as **TRANSITION**.
• The estimated **gamma flip** is near **20.35**. Crossing and holding beyond this area can change the trading behavior.
• Approximate breakout odds: **above resistance 30.4%**, **below support 40.2%** by the target horizon.
• Options skew is tilted toward **calls**, which suggests upside speculation is relatively stronger.
• Near-term implied volatility is higher than the next expiry (**IV1 184.11% vs IV2 140.07%**), which suggests **near-term event stress / backwardation**.
• On the daily chart, the stock currently looks like **UP trend (expanding)**.
• The implied distribution is **fairly balanced** between upside and downside tails.
TERN
Spot: 46.52
Report Time: 2026-03-16 08:43 AM MYT
Regime: TRANSITION
Dealer Gamma: LONG
Term Structure
Weekly Range
Structure & Probabilities
Flow & Skew
Tail Risk
Daily Technicals
Day Plan
45.00-55.00 range: fade extremes> 55.00: chase only if hold + vol< 45.00: risk expand; reduce sizeRegime: TRANSITIONTech: UP trend (expanding)
Swing Plan
Accumulate: 45.00-45.00Trim: 55.00-55.00Add: close > 55.00Cut: close < 45.00Best for: transition regime
Raw Text Summary
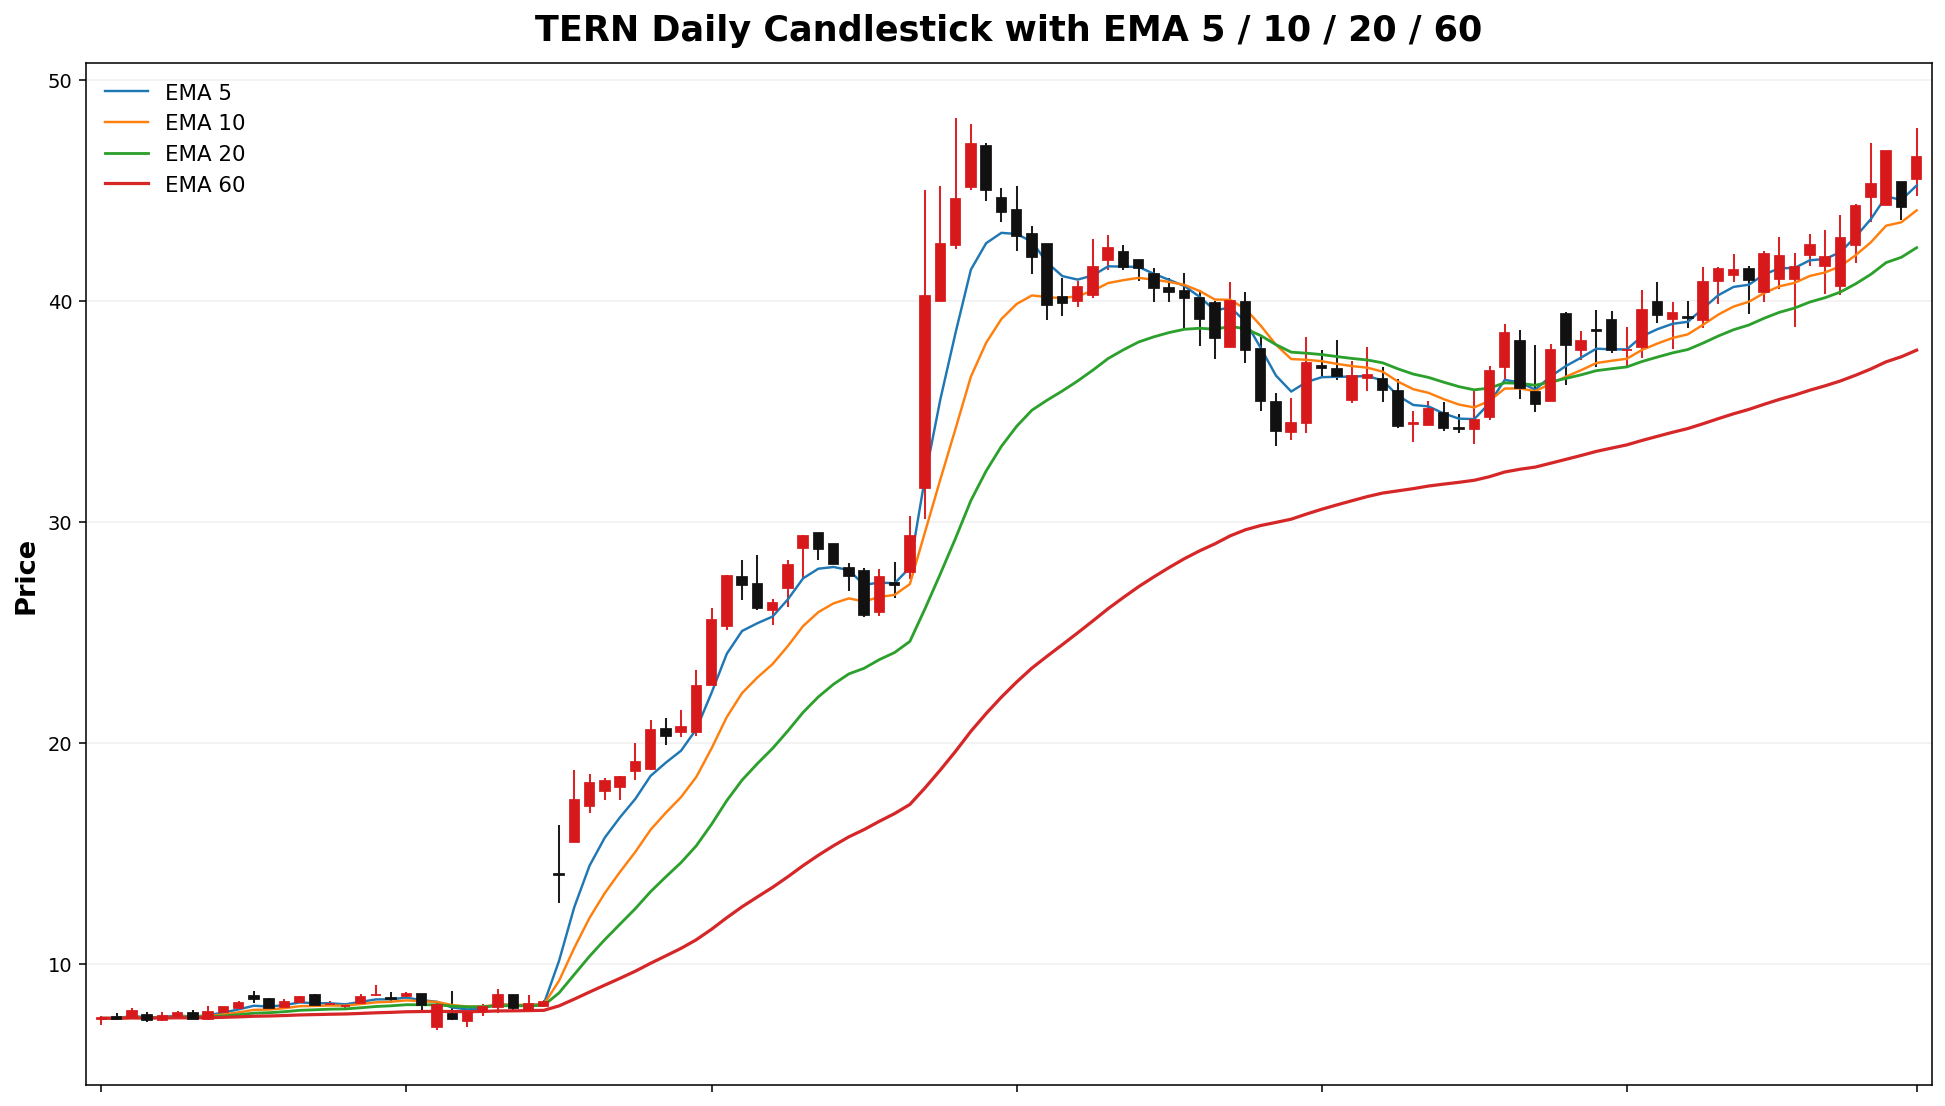
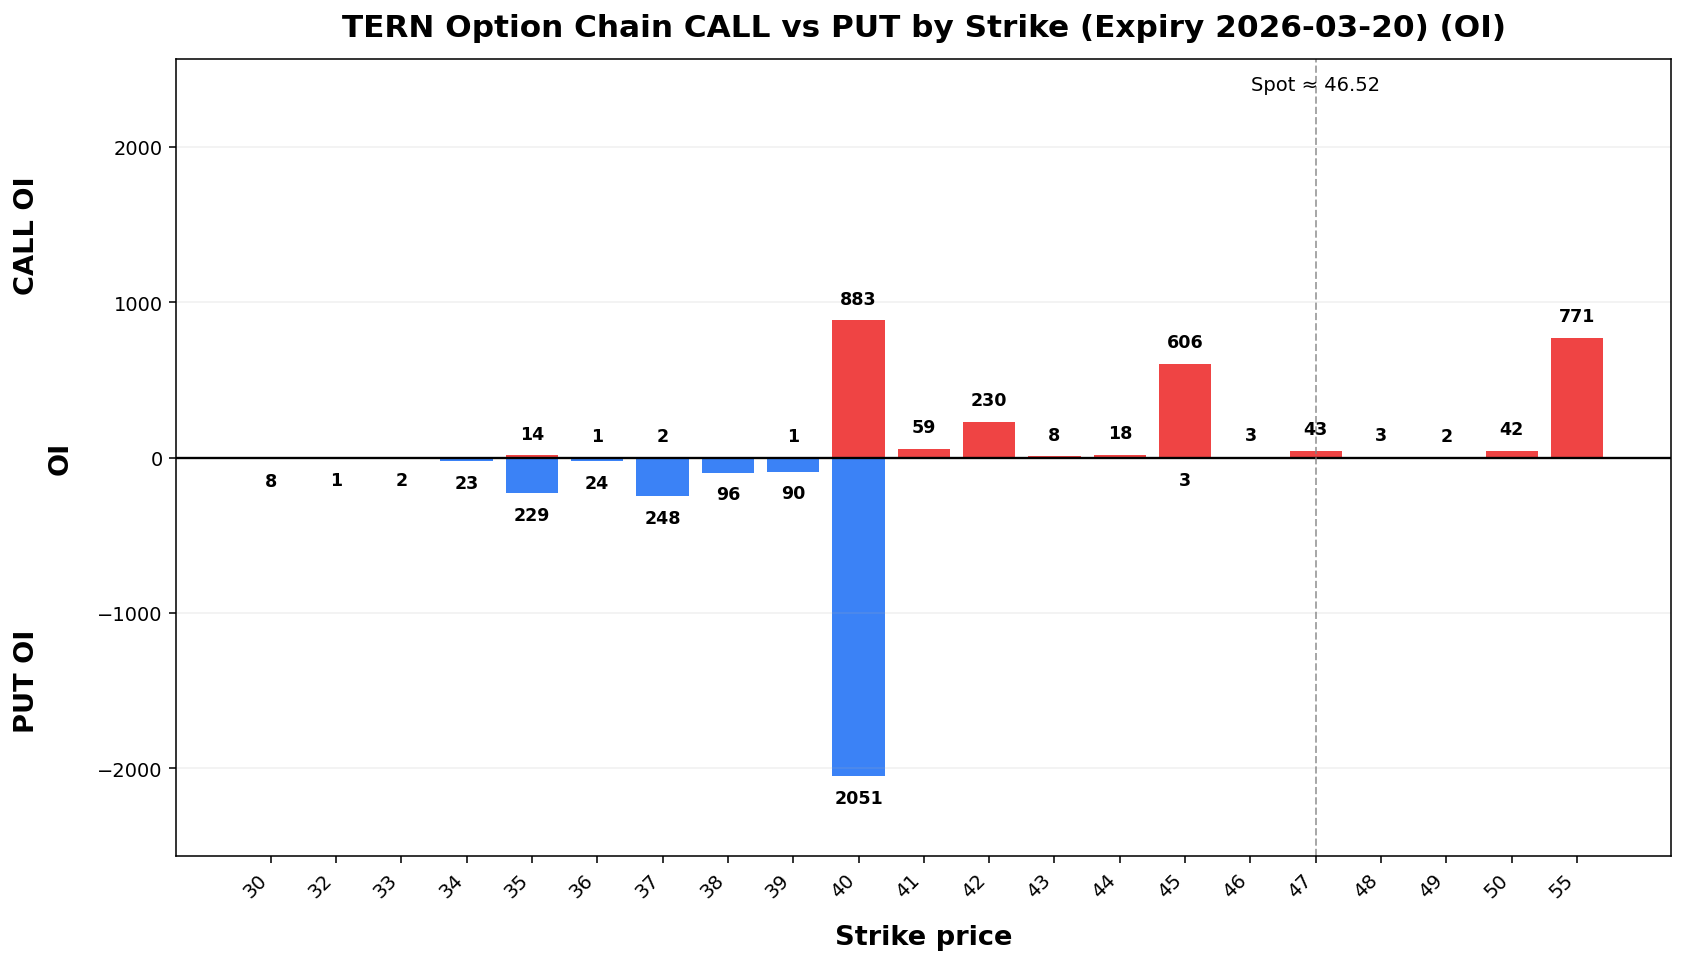
📌 TERN @ 46.52 (2026-03-16 08:43 AM MYT)

• Current price is **46.52**. Key support is around **45.00**, and resistance is around **55.00**.
• For the next week, the model’s **68% expected range** is roughly **38.72 to 54.32**.
• A wider **90% range** is about **33.70 to 59.34**.
• Dealer positioning looks **LONG gamma**, so the market behavior is classified as **TRANSITION**.
• The estimated **gamma flip** is near **44.71**. Crossing and holding beyond this area can change the trading behavior.
• Approximate breakout odds: **above resistance 12.7%**, **below support 46.5%** by the target horizon.
• Options skew is tilted toward **puts**, which suggests traders are paying more for downside protection.
• Near-term implied volatility is higher than the next expiry (**IV1 130.75% vs IV2 98.27%**), which suggests **near-term event stress / backwardation**.
• Recent volume is **2.09x** the 20-day average, which supports stronger continuation or breakout follow-through.
• On the daily chart, the stock currently looks like **UP trend (expanding)**.
• The implied distribution shows **heavier downside tail risk** than upside tail potential.