Analysis Report
Updated: 2026-03-1617 21:28:1108:43:44 MYT
Source File: combined-summary-20260316-212656.20260317-084343.md
Screening Source: screen-report-20260316-154250.20260317-084253.md
Extracted Symbols: MULL, NEBX, AAOI, AXTIUCO, AXTI, CRCA, TERN, SEI
Topline Summary
| Symbol |
Spot |
Support |
Resistance |
Flip |
Regime |
P>Res |
P<Sup |
68% Range |
90% Range |
| MULL |
188.65 |
180.00 |
190.00 |
133.23 |
TRANSITION |
40.0% |
40.9% |
147.69 - 229.61 |
121.28 - 256.02 |
| NEBX |
53.32 |
50.00 |
60.00 |
35.57 |
TRANSITION |
25.1% |
42.0% |
42.25 - 64.39 |
35.12 - 71.52 |
| AAOI |
96.8194.07 |
90.00 |
100.00 |
96.6987.62 |
PINTREND |
38.5% |
52.2% |
79.06 - 109.08 |
69.38 - 118.76 |
| UCO |
39.00 |
35.00 |
40.00 |
24.38 |
TRANSITION |
43.5% |
35.1%23.4% |
78.1331.98 - 115.4946.02 |
66.0927.45 - 127.5350.55 |
| AXTI |
48.8639 |
45.00 |
50.00 |
48.5251.14 |
PINTRANSITION |
37.4%35.3% |
34.9% |
39.23 - 57.55 |
33.32 - 63.46 |
| CRCA |
79.18 |
70.00 |
95.86 |
47.09 |
TRANSITION |
12.1% |
26.6% |
38.6362.50 - 59.95.86 |
51.74 - 106.62 |
| TERN |
46.07 |
45.00 |
47.00 |
44.02 |
TRANSITION |
36.7% |
43.1% |
39.05 - 53.09 |
32.0434.52 - 65.6857.62 |
| SEI |
56.99 |
55.00 |
57.50 |
55.44 |
TRANSITION |
35.9% |
35.2% |
50.18 - 63.80 |
45.79 - 68.19 |
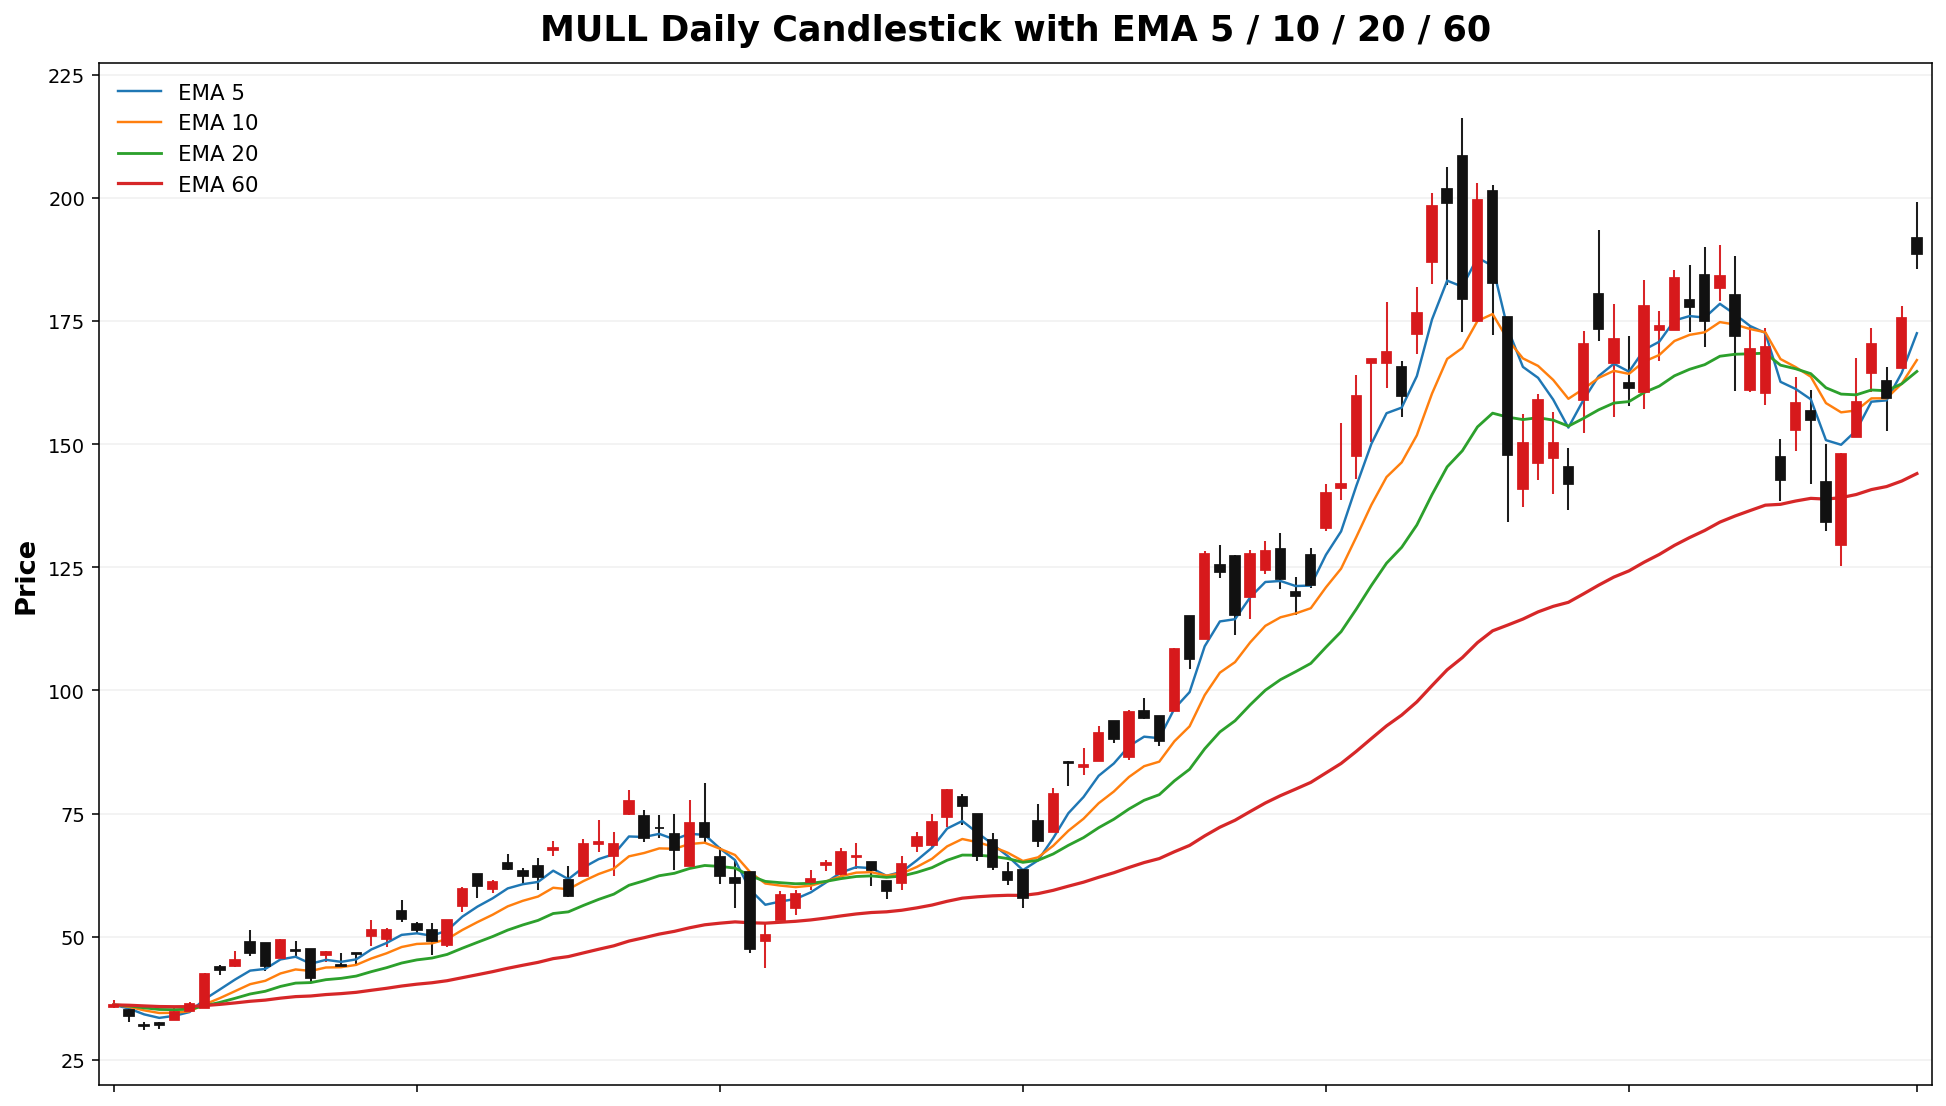
AAOIMULL
Spot: 96.81188.65
Report Time: 2026-03-1617 09:2608:43 PMAM MYT
Regime: PINTRANSITION
Dealer Gamma: LONG
Term Structure
| Expiry |
DTE |
Forward |
ATM IV |
ATM Straddle |
| 2026-03-20 |
54 |
96.72187.80 |
154.04%189.86% |
16.1336.55 |
2026-03-2704-17 |
1232 |
95.92187.81 |
127.30%115.24% |
21.6564.15 |
Weekly Range
| Confidence |
Low |
High |
Width |
| 68% |
78.13147.69 |
115.49229.61 |
37.3581.92 |
| 80% |
72.88136.16 |
120.74241.14 |
47.87104.98 |
| 90% |
66.09121.28 |
127.53256.02 |
61.44134.75 |
| 95% |
60.21108.37 |
133.41268.93 |
73.21160.56 |
Structure & Probabilities
| Support |
Resistance |
Gamma Flip |
Max Pain |
P>Res |
P<Sup |
90.180.00 |
100.190.00 |
96.69133.23 |
50.009.65 |
35.5%40.0% |
35.1%40.9% |
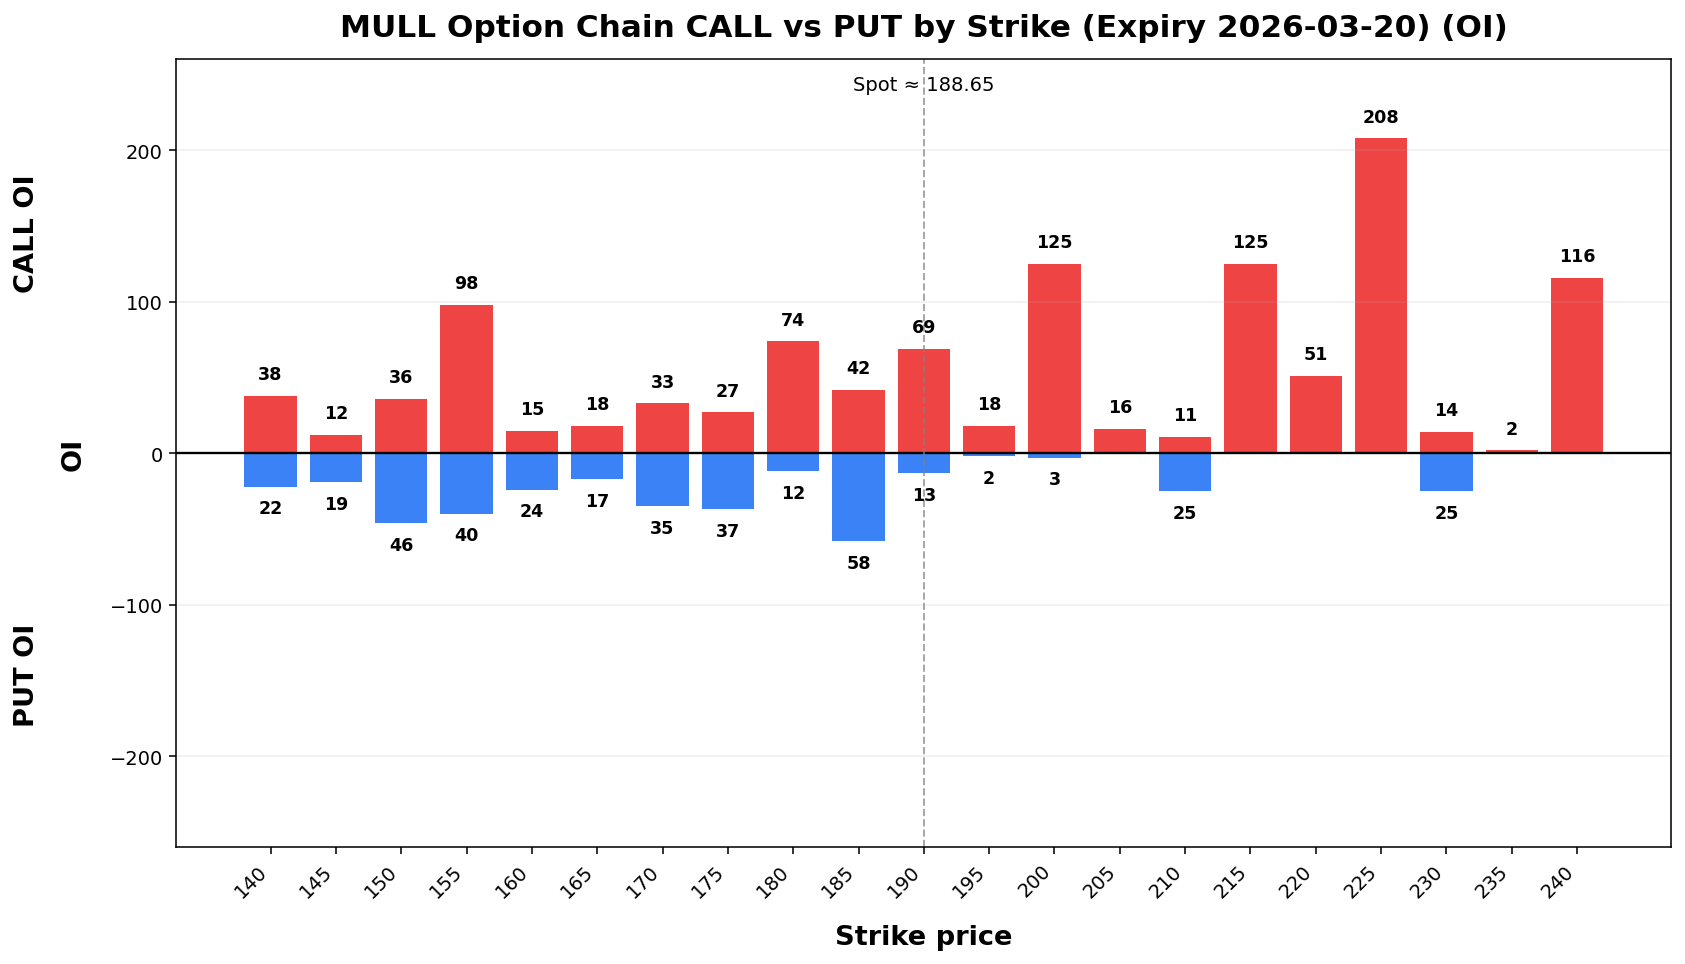
Flow & Skew
| Call Vol |
Put Vol |
Vol P/C |
Call OI |
Put OI |
OI P/C |
Skew |
Skew Bias |
11,537902 |
4,641718 |
0.4080 |
36,3682,005 |
30,8541,318 |
0.8566 |
790.2313.84 vol pts |
PUT_SKEW |
Tail Risk
| Q10 |
Q50 |
Q90 |
Down Tail |
Up Tail |
Down/Up |
11.9.75 |
10.16 |
10.57 |
178.90 |
0.00 |
NA |
Daily Technicals
| EMA20 |
EMA50 |
VWAP20 |
BB Lower |
BB Mid |
BB Upper |
BB Width |
Vol Ratio |
Path |
| 164.78 |
149.97 |
166.11 |
138.11 |
166.83 |
195.55 |
34.43% |
1.38 |
UP trend (expanding) |
Day Plan
- 180.00-190.00 range: fade extremes
- > 190.00: chase only if hold + vol
- < 180.00: risk expand; reduce size
- Regime: TRANSITION
- Tech: UP trend (expanding)
Swing Plan
- Accumulate: 180.00-180.00
- Trim: 190.00-190.00
- Add: close > 190.00
- Cut: close < 180.00
- Best for: transition regime
Raw Text Summary
📌 MULL @ 188.65 (2026-03-17 08:43 AM MYT)

• Current price is **188.65**. Key support is around **180.00**, and resistance is around **190.00**.
• For the next week, the model’s **68% expected range** is roughly **147.69 to 229.61**.
• A wider **90% range** is about **121.28 to 256.02**.
• Dealer positioning looks **LONG gamma**, so the market behavior is classified as **TRANSITION**.
• The estimated **gamma flip** is near **133.23**. Crossing and holding beyond this area can change the trading behavior.
• Approximate breakout odds: **above resistance 40.0%**, **below support 40.9%** by the target horizon.
• Options skew is tilted toward **puts**, which suggests traders are paying more for downside protection.
• Near-term implied volatility is higher than the next expiry (**IV1 189.86% vs IV2 115.24%**), which suggests **near-term event stress / backwardation**.
• On the daily chart, the stock currently looks like **UP trend (expanding)**.
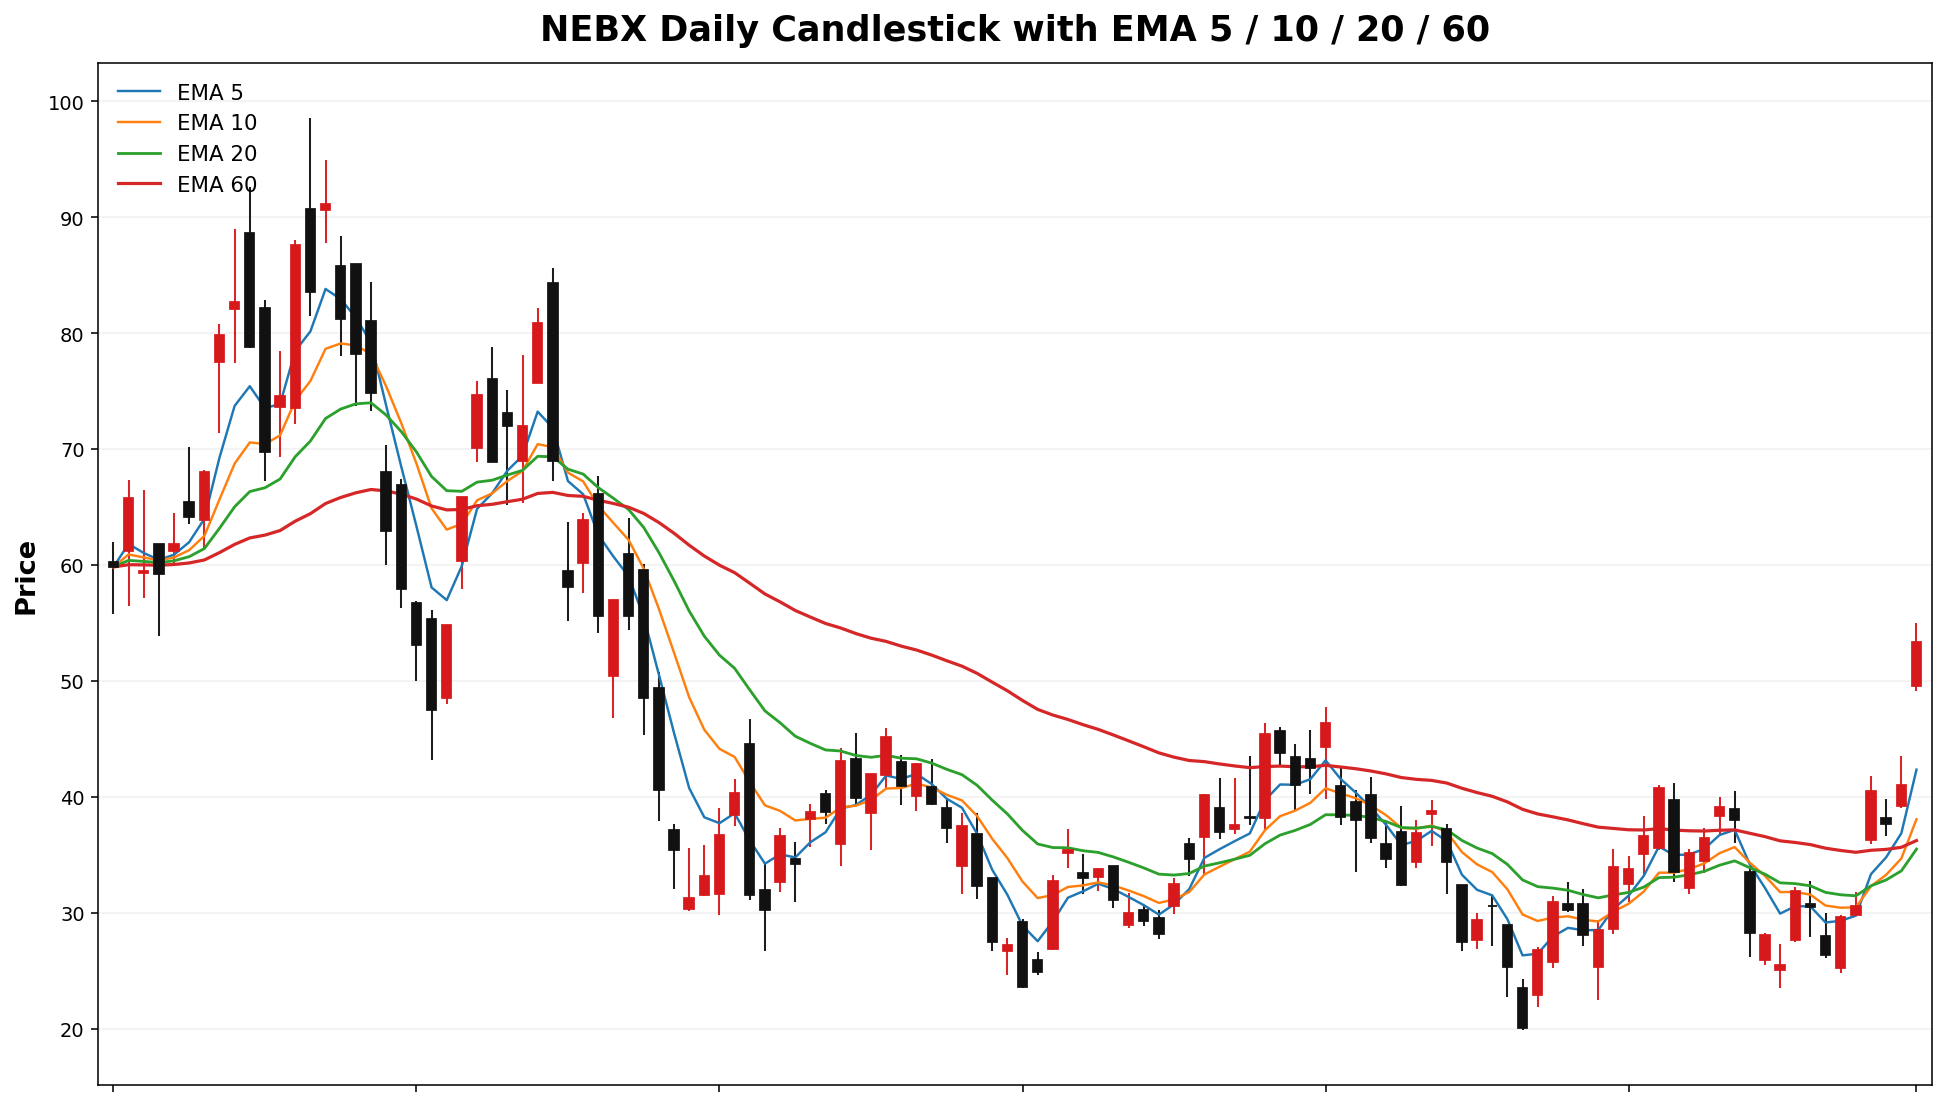
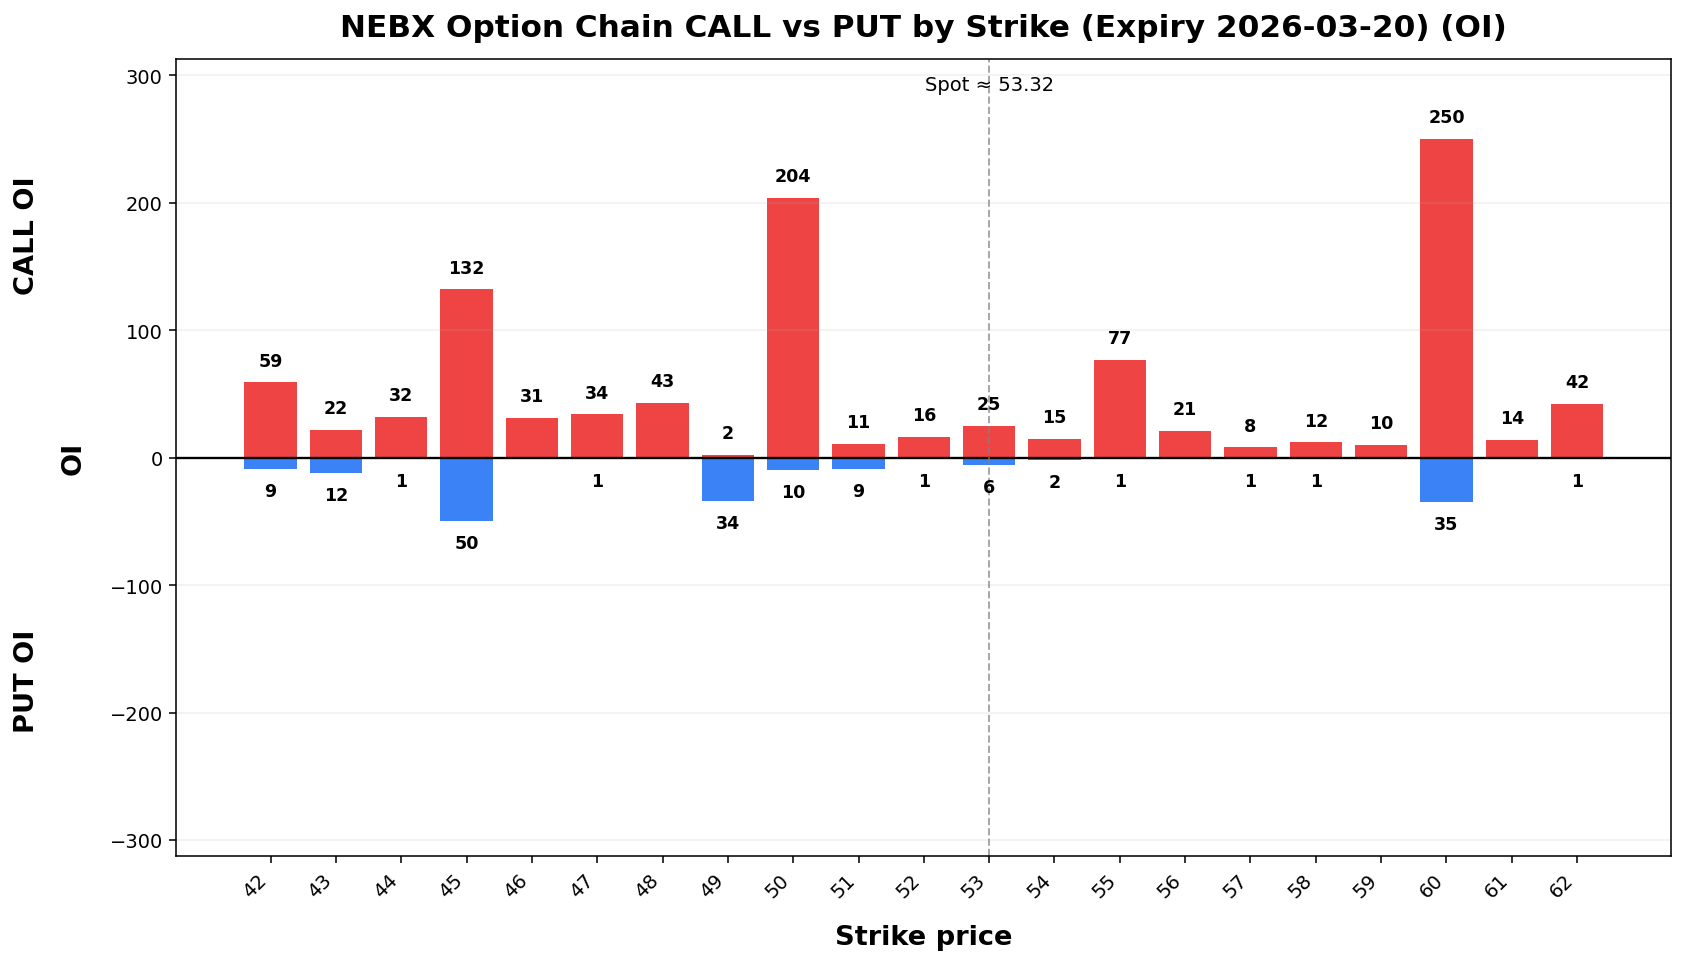
NEBX
Spot: 53.32
Report Time: 2026-03-17 08:43 AM MYT
Regime: TRANSITION
Dealer Gamma: LONG
Term Structure
| Expiry |
DTE |
Forward |
ATM IV |
ATM Straddle |
| 2026-03-20 |
4 |
47.22 |
165.41% |
9.00 |
| 2026-04-17 |
32 |
53.17 |
129.98% |
20.45 |
Weekly Range
| Confidence |
Low |
High |
Width |
| 68% |
42.25 |
64.39 |
22.13 |
| 80% |
39.14 |
67.50 |
28.37 |
| 90% |
35.12 |
71.52 |
36.41 |
| 95% |
31.63 |
75.01 |
43.38 |
Structure & Probabilities
| Support |
Resistance |
Gamma Flip |
Max Pain |
P>Res |
P<Sup |
| 50.00 |
60.00 |
35.57 |
36.00 |
25.1% |
42.0% |
Flow & Skew
| Call Vol |
Put Vol |
Vol P/C |
Call OI |
Put OI |
OI P/C |
Skew |
Skew Bias |
| 839 |
382 |
0.46 |
4,081 |
2,517 |
0.62 |
15.53 vol pts |
PUT_SKEW |
Tail Risk
| Q10 |
Q50 |
Q90 |
Down Tail |
Up Tail |
Down/Up |
| 38.63 |
53.19 |
60.54 |
14.69 |
7.22 |
2.03 |
Daily Technicals
| EMA20 |
EMA50 |
VWAP20 |
BB Lower |
BB Mid |
BB Upper |
BB Width |
Vol Ratio |
Path |
| 35.49 |
35.38 |
35.83 |
21.75 |
34.83 |
47.92 |
75.13% |
2.15 |
UP trend (expanding) |
Day Plan
- 50.00-60.00 range: fade extremes
- > 60.00: chase only if hold + vol
- < 50.00: risk expand; reduce size
- Regime: TRANSITION
- Tech: UP trend (expanding)
Swing Plan
- Accumulate: 50.00-50.00
- Trim: 60.00-60.00
- Add: close > 60.00
- Cut: close < 50.00
- Best for: transition regime
Raw Text Summary
📌 NEBX @ 53.32 (2026-03-17 08:43 AM MYT)

• Current price is **53.32**. Key support is around **50.00**, and resistance is around **60.00**.
• For the next week, the model’s **68% expected range** is roughly **42.25 to 64.39**.
• A wider **90% range** is about **35.12 to 71.52**.
• Dealer positioning looks **LONG gamma**, so the market behavior is classified as **TRANSITION**.
• The estimated **gamma flip** is near **35.57**. Crossing and holding beyond this area can change the trading behavior.
• Approximate breakout odds: **above resistance 25.1%**, **below support 42.0%** by the target horizon.
• Options skew is tilted toward **puts**, which suggests traders are paying more for downside protection.
• Near-term implied volatility is higher than the next expiry (**IV1 165.41% vs IV2 129.98%**), which suggests **near-term event stress / backwardation**.
• Recent volume is **2.15x** the 20-day average, which supports stronger continuation or breakout follow-through.
• On the daily chart, the stock currently looks like **UP trend (expanding)**.
• The implied distribution shows **heavier downside tail risk** than upside tail potential.
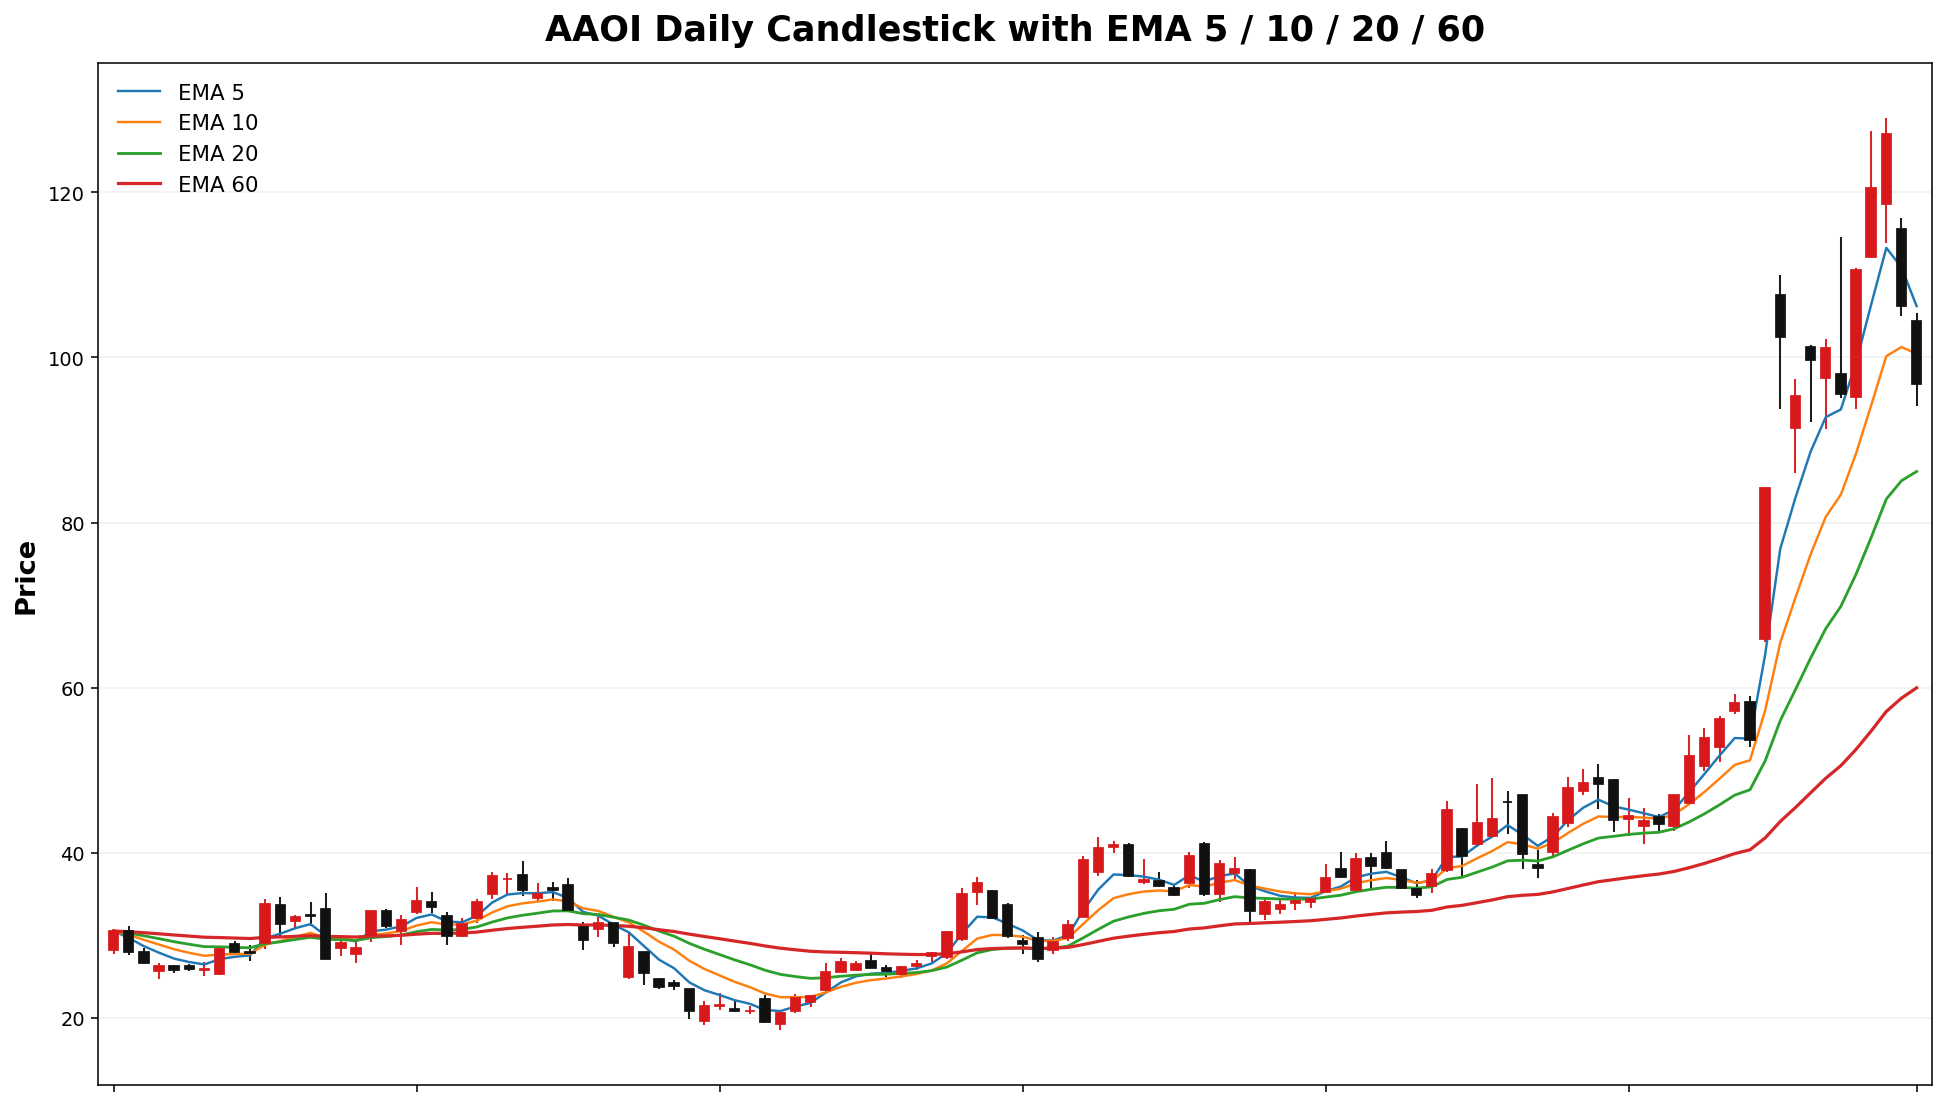
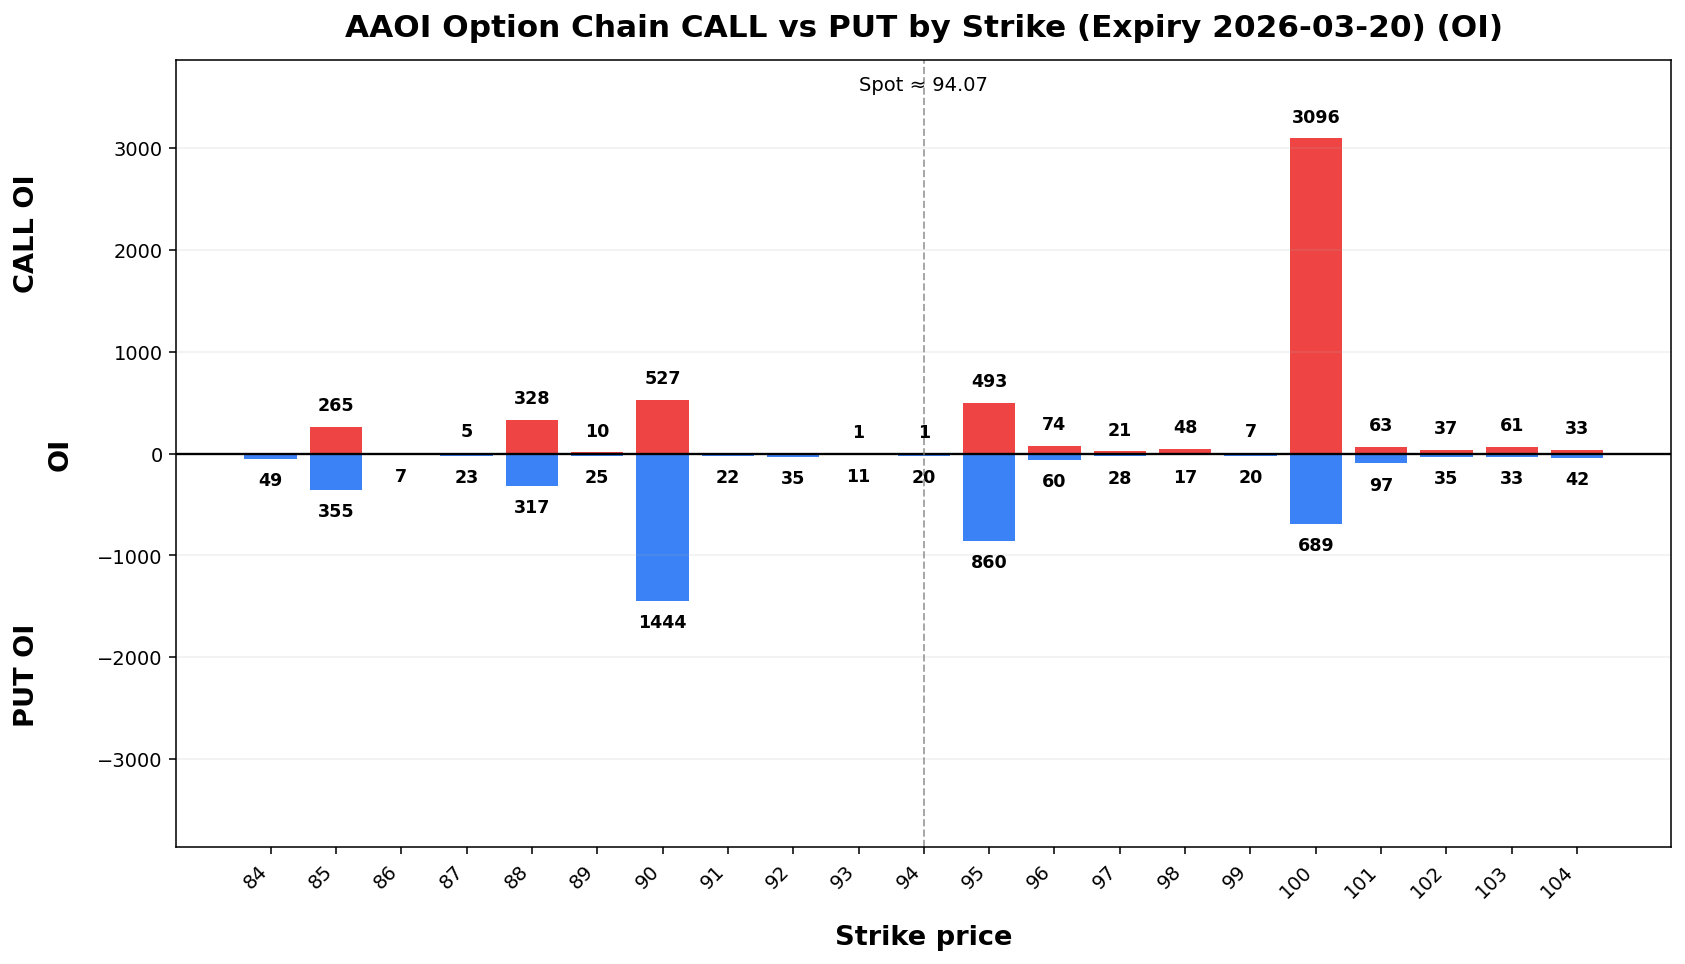
AAOI
Spot: 94.07
Report Time: 2026-03-17 08:43 AM MYT
Regime: TREND
Dealer Gamma: SHORT

Term Structure
| Expiry |
DTE |
Forward |
ATM IV |
ATM Straddle |
| 2026-03-20 |
4 |
94.17 |
129.18% |
12.40 |
| 2026-03-27 |
12.11 |
94.09 |
106.93% |
17.30 |
Weekly Range
| Confidence |
Low |
High |
Width |
| 68% |
79.06 |
109.08 |
30.02 |
| 80% |
74.83 |
113.31 |
38.48 |
| 90% |
69.38 |
118.76 |
49.38 |
| 95% |
64.65 |
123.49 |
58.85 |
Structure & Probabilities
| Support |
Resistance |
Gamma Flip |
Max Pain |
P>Res |
P<Sup |
| 90.00 |
100.00 |
87.62 |
50.00 |
38.5% |
52.2% |
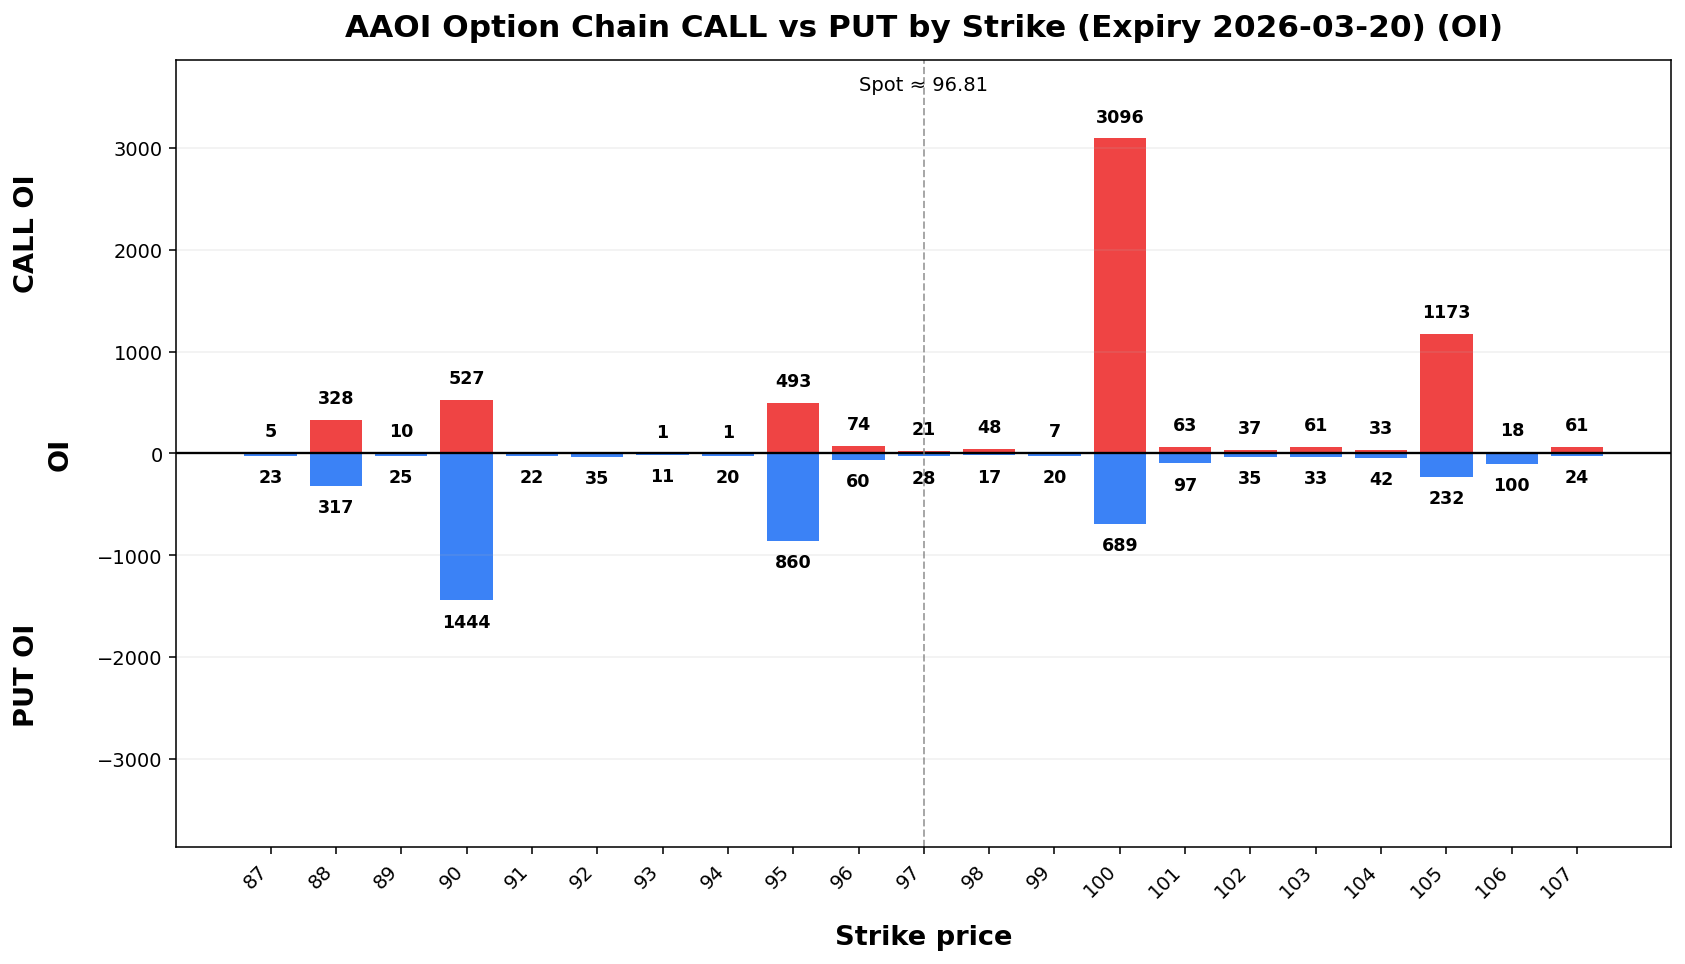
Flow & Skew
| Call Vol |
Put Vol |
Vol P/C |
Call OI |
Put OI |
OI P/C |
Skew |
Skew Bias |
| 19,142 |
6,786 |
0.35 |
107.6536,368 |
85.5430,854 |
10.840.85 |
7.894.98 vol pts |
PUT_SKEW |
Tail Risk
| Q10 |
Q50 |
Q90 |
Down Tail |
Up Tail |
Down/Up |
| 75.03 |
91.69 |
108.86 |
19.04 |
14.79 |
1.29 |
Daily Technicals
| EMA20 |
EMA50 |
VWAP20 |
BB Lower |
BB Mid |
BB Upper |
BB Width |
Vol Ratio |
Path |
86.1893 |
63.9265.10 |
91.4492.25 |
21.9426.56 |
79.6182.09 |
137.2862 |
144.88%135.30% |
1.410.97 |
UP trend (expanding) |
Day Plan
- 90.00-100.00 range: fade extremes
- > 100.00: chase only if hold + vol
- < 90.00: risk expand; reduce size
- Regime:
PINTREND
- Tech: UP trend (expanding)
Swing Plan
- Accumulate: 90.00-90.00
- Trim: 100.00-100.00
- Add: close > 100.00
- Cut: close < 90.00
- Best for:
pintrend regime
Raw Text Summary
📌 AAOI @ 96.8194.07 (2026-03-1617 09:2608:43 PMAM MYT)

• Current price is **96.81*94.07**. Key support is around **90.00**, and resistance is around **100.00**.
• For the next week, the model’s **68% expected range** is roughly **78.1379.06 to 115.49*109.08**.
• A wider **90% range** is about **66.0969.38 to 127.53*118.76**.
• Dealer positioning looks **LONGSHORT gamma**, so the market behavior is classified as **PIN*TREND**.
• The estimated **gamma flip** is near **96.69*87.62**. Crossing and holding beyond this area can change the trading behavior.
• Approximate breakout odds: **above resistance 35.38.5%**, **below support 35.1%52.2%** by the target horizon.
• Options skew is tilted toward **puts**, which suggests traders are paying more for downside protection.
• Near-term implied volatility is higher than the next expiry (**IV1 154.04%129.18% vs IV2 127.30%106.93%**), which suggests **near-term event stress / backwardation**.
• On the daily chart, the stock currently looks like **UP trend (expanding)**.
• The implied distribution shows **heavier downside tail risk** than upside tail potential.
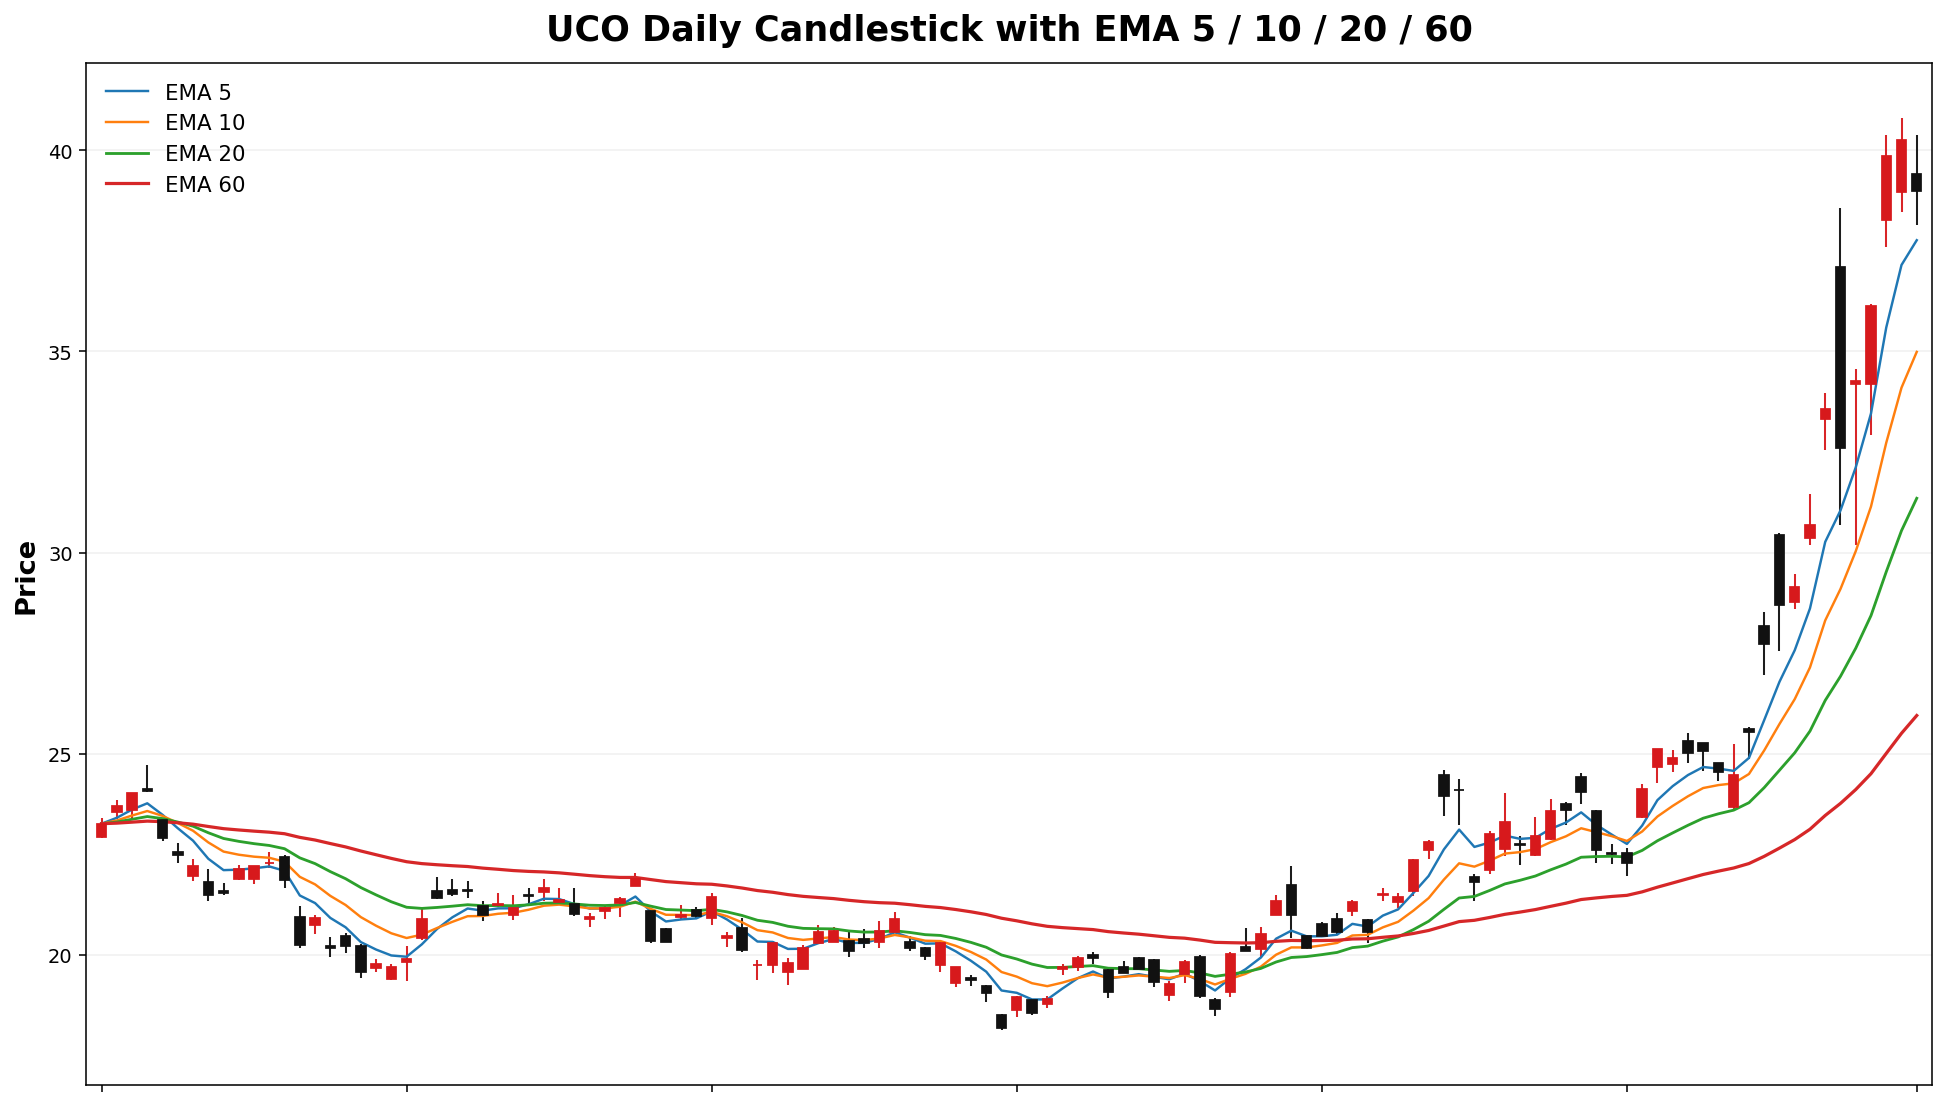
UCO
Spot: 39.00
Report Time: 2026-03-17 08:43 AM MYT
Regime: TRANSITION
Dealer Gamma: LONG
Term Structure
| Expiry |
DTE |
Forward |
ATM IV |
ATM Straddle |
| 2026-03-20 |
4 |
39.00 |
135.69% |
5.40 |
| 2026-04-17 |
32 |
39.08 |
120.78% |
13.90 |
Weekly Range
| Confidence |
Low |
High |
Width |
| 68% |
31.98 |
46.02 |
14.05 |
| 80% |
30.00 |
48.00 |
18.00 |
| 90% |
27.45 |
50.55 |
23.11 |
| 95% |
25.23 |
52.77 |
27.53 |
Structure & Probabilities
| Support |
Resistance |
Gamma Flip |
Max Pain |
P>Res |
P<Sup |
| 35.00 |
40.00 |
24.38 |
26.00 |
43.5% |
23.4% |
Flow & Skew
| Call Vol |
Put Vol |
Vol P/C |
Call OI |
Put OI |
OI P/C |
Skew |
Skew Bias |
| 8,303 |
6,823 |
0.82 |
29,040 |
16,875 |
0.58 |
-10.16 vol pts |
CALL_SKEW |
Tail Risk
| Q10 |
Q50 |
Q90 |
Down Tail |
Up Tail |
Down/Up |
| 16.85 |
36.87 |
45.75 |
22.15 |
6.75 |
3.28 |
Daily Technicals
| EMA20 |
EMA50 |
VWAP20 |
BB Lower |
BB Mid |
BB Upper |
BB Width |
Vol Ratio |
Path |
| 31.35 |
26.70 |
32.81 |
18.06 |
29.65 |
41.24 |
78.18% |
0.99 |
UP trend (expanding) |
Day Plan
- 35.00-40.00 range: fade extremes
- > 40.00: chase only if hold + vol
- < 35.00: risk expand; reduce size
- Regime: TRANSITION
- Tech: UP trend (expanding)
Swing Plan
- Accumulate: 35.00-35.00
- Trim: 40.00-40.00
- Add: close > 40.00
- Cut: close < 35.00
- Best for: transition regime
Raw Text Summary
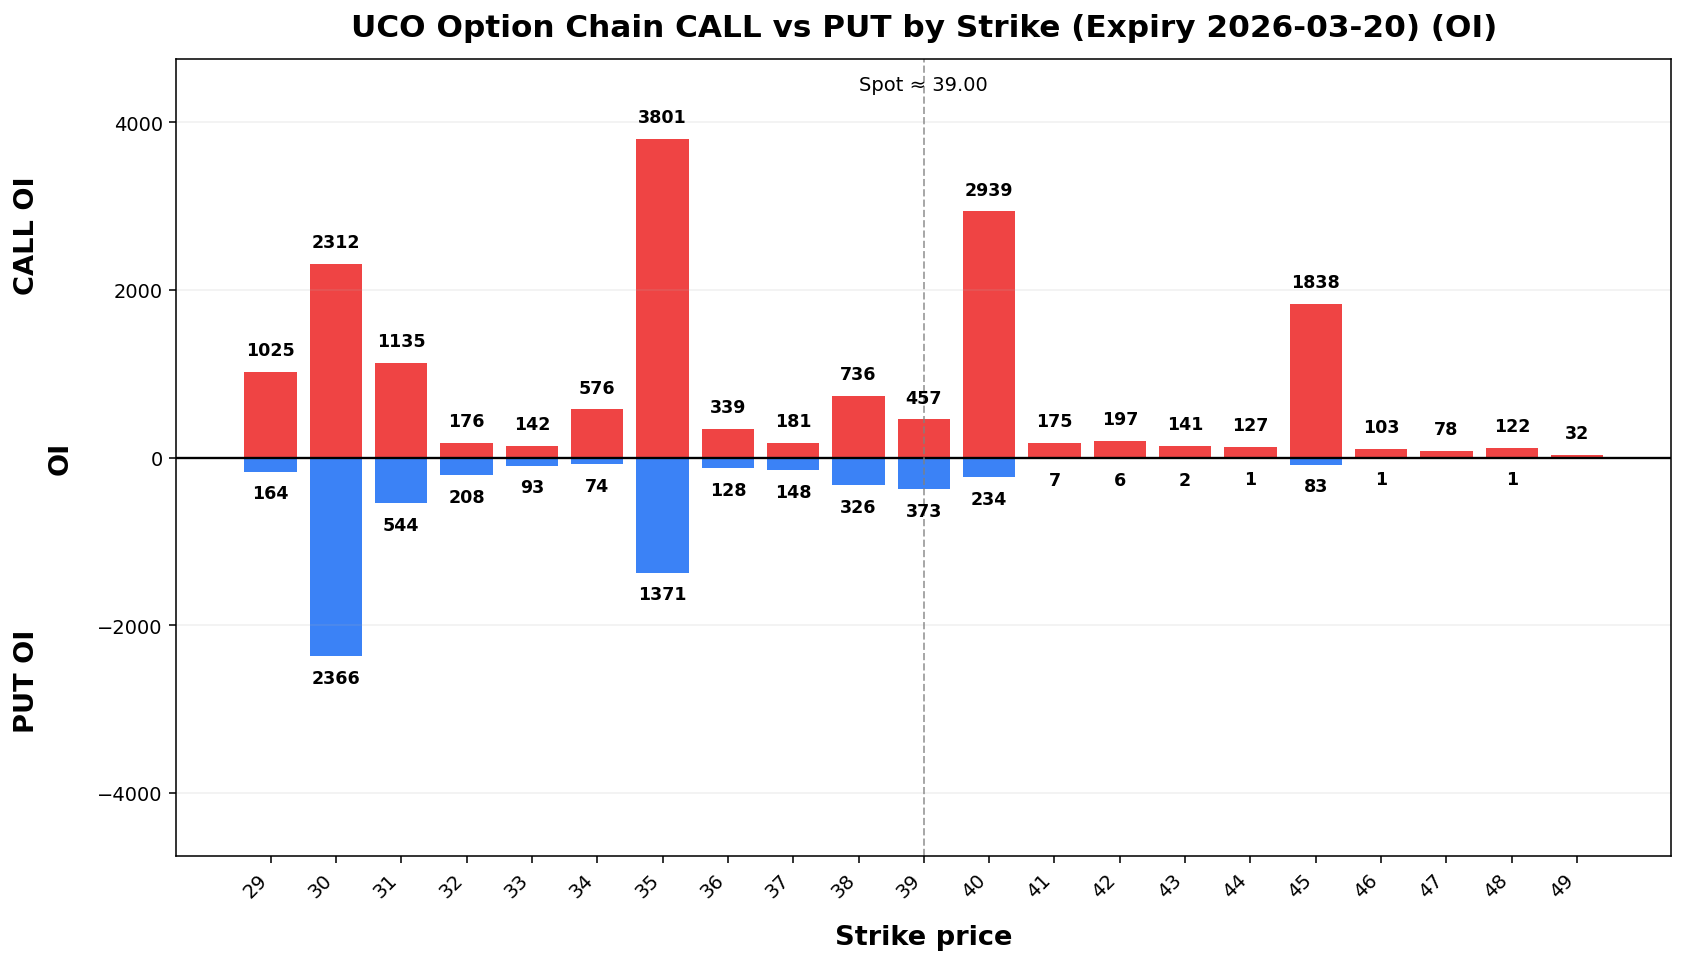
📌 UCO @ 39.00 (2026-03-17 08:43 AM MYT)

• Current price is **39.00**. Key support is around **35.00**, and resistance is around **40.00**.
• For the next week, the model’s **68% expected range** is roughly **31.98 to 46.02**.
• A wider **90% range** is about **27.45 to 50.55**.
• Dealer positioning looks **LONG gamma**, so the market behavior is classified as **TRANSITION**.
• The estimated **gamma flip** is near **24.38**. Crossing and holding beyond this area can change the trading behavior.
• Approximate breakout odds: **above resistance 43.5%**, **below support 23.4%** by the target horizon.
• Options skew is tilted toward **calls**, which suggests upside speculation is relatively stronger.
• Near-term implied volatility is higher than the next expiry (**IV1 135.69% vs IV2 120.78%**), which suggests **near-term event stress / backwardation**.
• On the daily chart, the stock currently looks like **UP trend (expanding)**.
• The implied distribution shows **heavier downside tail risk** than upside tail potential.
AXTI
Spot: 48.8639
Report Time: 2026-03-1617 09:2608:43 PMAM MYT
Regime: PINTRANSITION
Dealer Gamma: LONG

Term Structure
| Expiry |
DTE |
Forward |
ATM IV |
ATM Straddle |
| 2026-03-20 |
54 |
49.0748.45 |
166.90%148.85% |
8.827.35 |
| 2026-04-17 |
3332 |
48.9562 |
125.04%120.81% |
18.1617.25 |
Weekly Range
| Confidence |
Low |
High |
Width |
| 68% |
38.6339.23 |
59.0957.55 |
20.4518.33 |
| 80% |
35.7636.65 |
61.9660.13 |
26.2123.49 |
| 90% |
32.0433.32 |
65.6863.46 |
33.6430.15 |
| 95% |
28.8230.43 |
68.9066.35 |
40.0835.92 |
Structure & Probabilities
| Support |
Resistance |
Gamma Flip |
Max Pain |
P>Res |
P<Sup |
| 45.00 |
50.00 |
48.5251.14 |
40.00 |
37.4%35.3% |
34.9% |
Flow & Skew
| Call Vol |
Put Vol |
Vol P/C |
Call OI |
Put OI |
OI P/C |
Skew |
Skew Bias |
| 3,647 |
3,038 |
0.83 |
15,822 |
24,439 |
1.54 |
7.71 vol pts |
PUT_SKEW |
Tail Risk
| Q10 |
Q50 |
Q90 |
Down Tail |
Up Tail |
Down/Up |
| 35.19 |
47.15 |
60.91 |
13.20 |
12.52 |
1.05 |
Daily Technicals
| EMA20 |
EMA50 |
VWAP20 |
BB Lower |
BB Mid |
BB Upper |
BB Width |
Vol Ratio |
Path |
| 38.68 |
29.90 |
39.17 |
20.75 |
37.62 |
54.49 |
89.70% |
1.16 |
UP trend (expanding) |
Day Plan
- 45.00-50.00 range: fade extremes
- > 50.00: chase only if hold + vol
- < 45.00: risk expand; reduce size
- Regime: TRANSITION
- Tech: UP trend (expanding)
Swing Plan
- Accumulate: 45.00-45.00
- Trim: 50.00-50.00
- Add: close > 50.00
- Cut: close < 45.00
- Best for: transition regime
Raw Text Summary
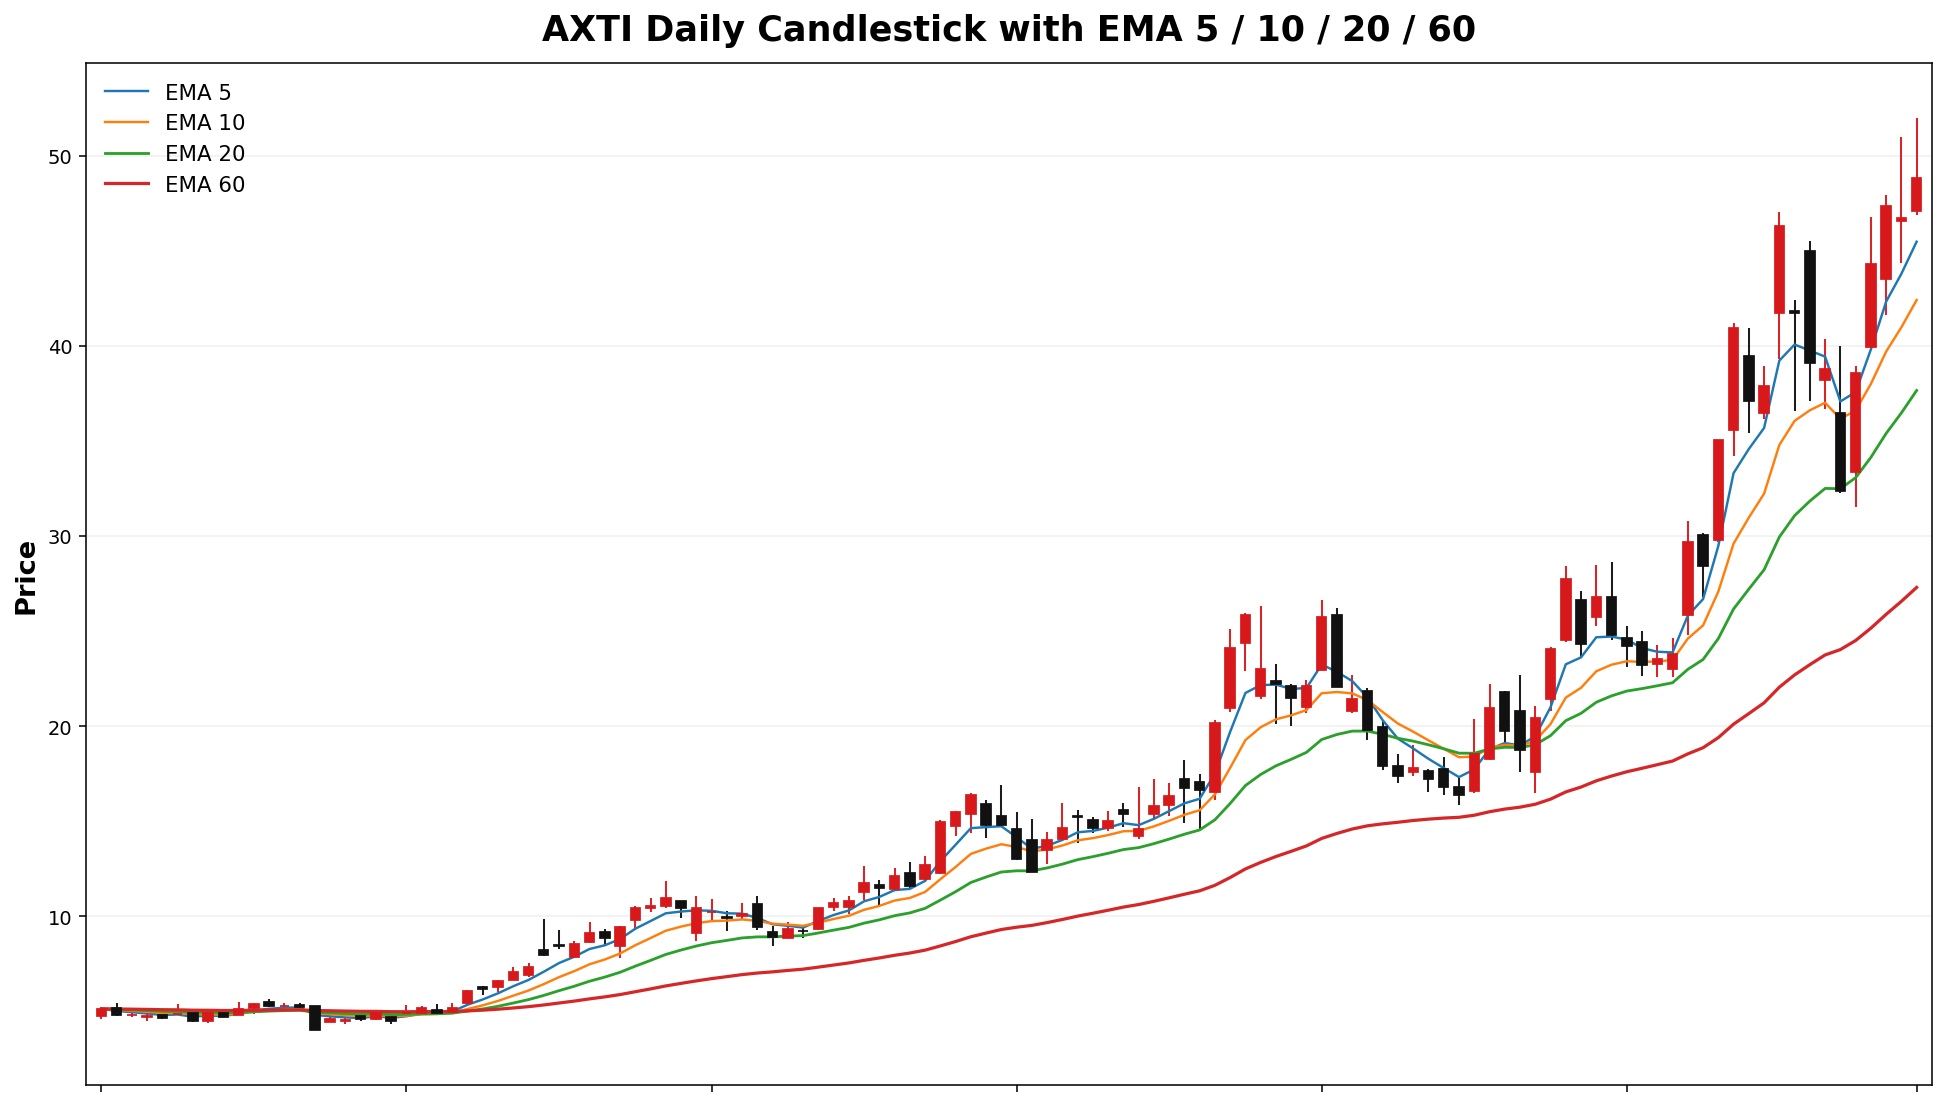
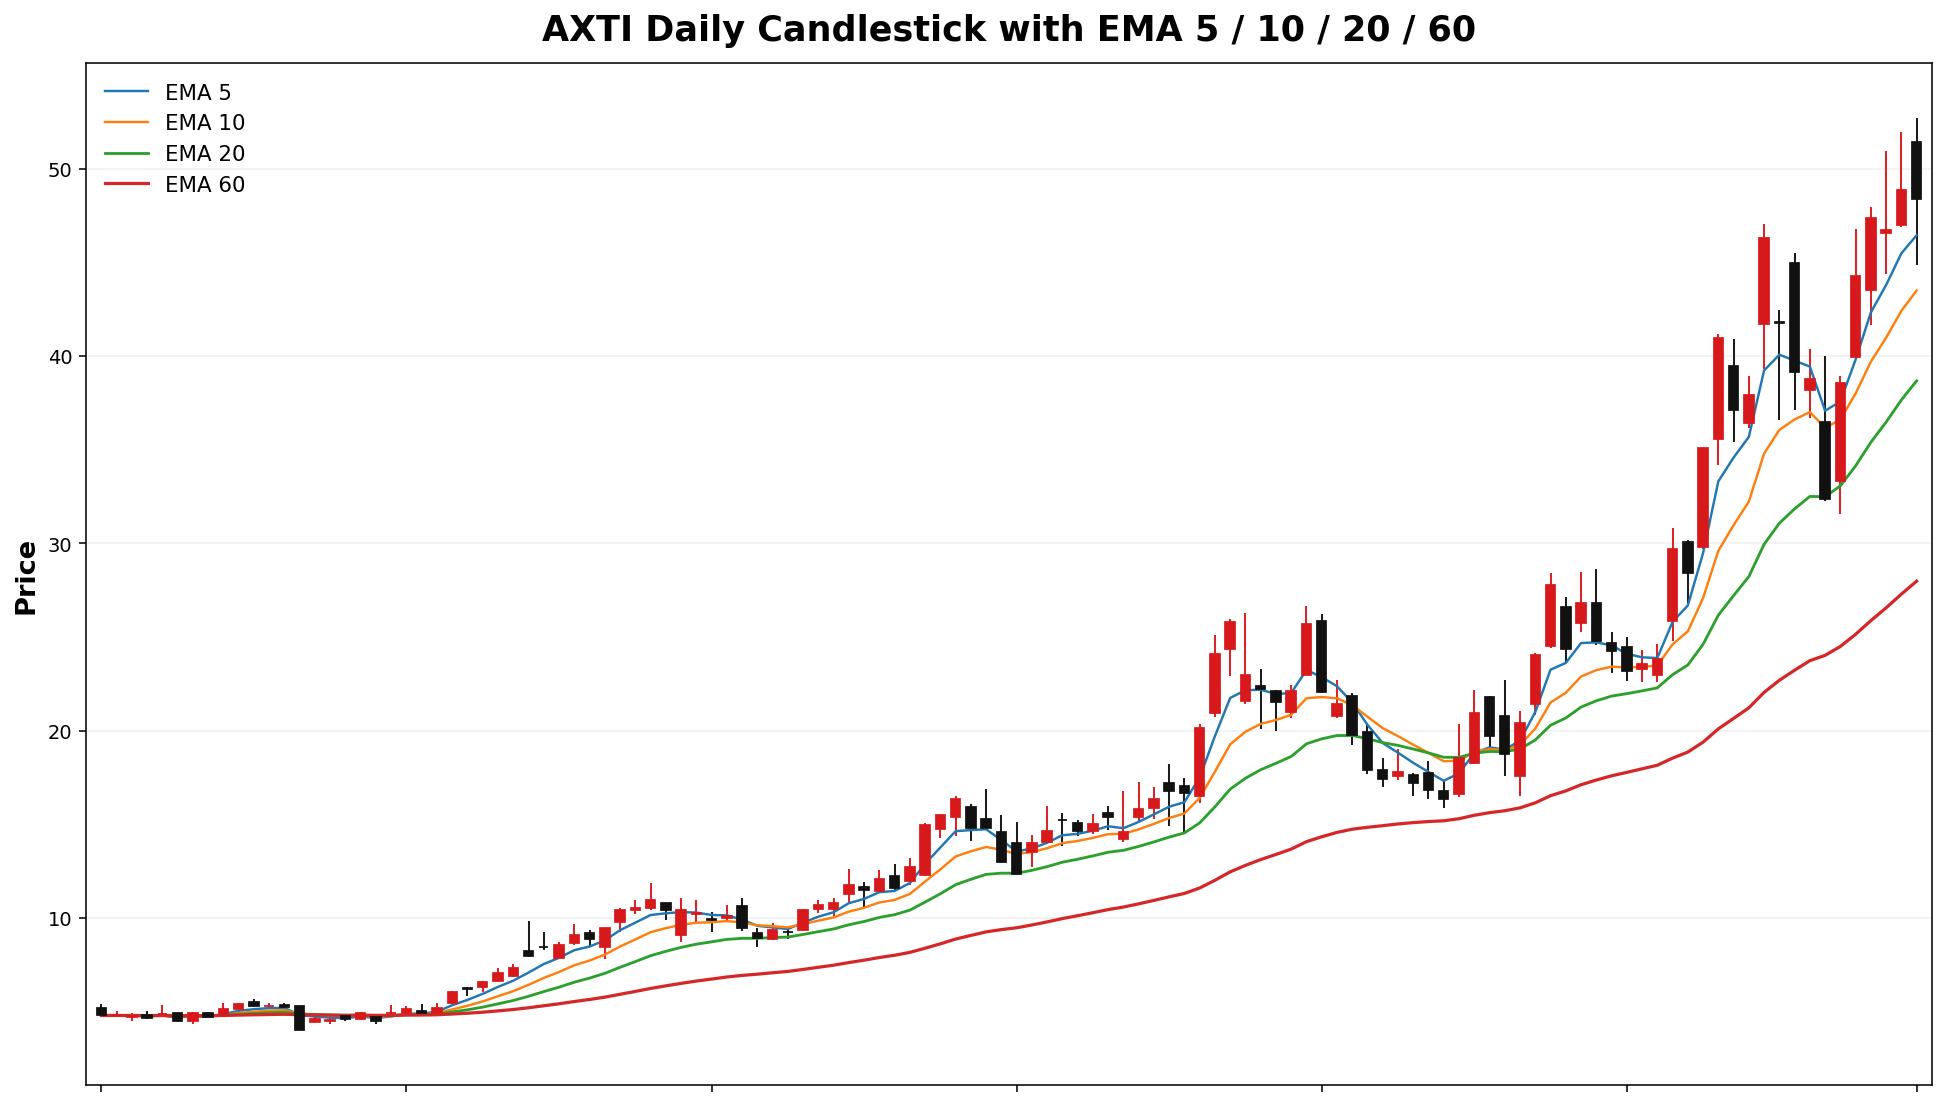
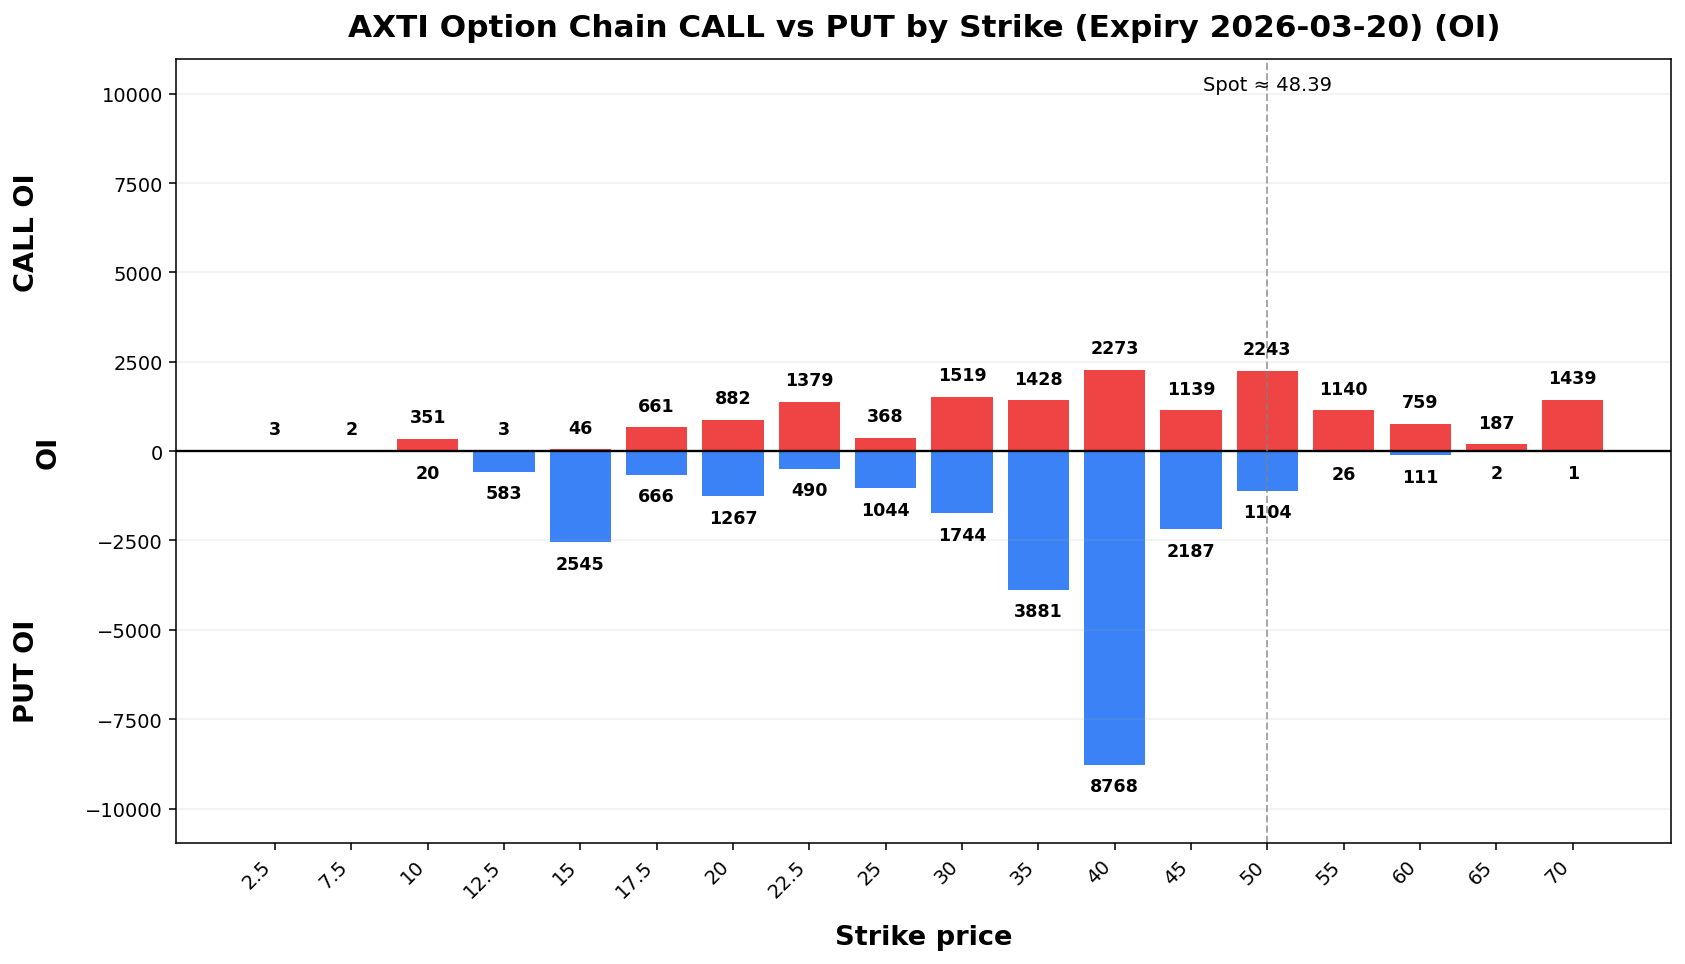
📌 AXTI @ 48.39 (2026-03-17 08:43 AM MYT)

• Current price is **48.39**. Key support is around **45.00**, and resistance is around **50.00**.
• For the next week, the model’s **68% expected range** is roughly **39.23 to 57.55**.
• A wider **90% range** is about **33.32 to 63.46**.
• Dealer positioning looks **LONG gamma**, so the market behavior is classified as **TRANSITION**.
• The estimated **gamma flip** is near **51.14**. Crossing and holding beyond this area can change the trading behavior.
• Approximate breakout odds: **above resistance 35.3%**, **below support 34.9%** by the target horizon.
• Options skew is tilted toward **puts**, which suggests traders are paying more for downside protection.
• Near-term implied volatility is higher than the next expiry (**IV1 148.85% vs IV2 120.81%**), which suggests **near-term event stress / backwardation**.
• On the daily chart, the stock currently looks like **UP trend (expanding)**.
• The implied distribution is **fairly balanced** between upside and downside tails.
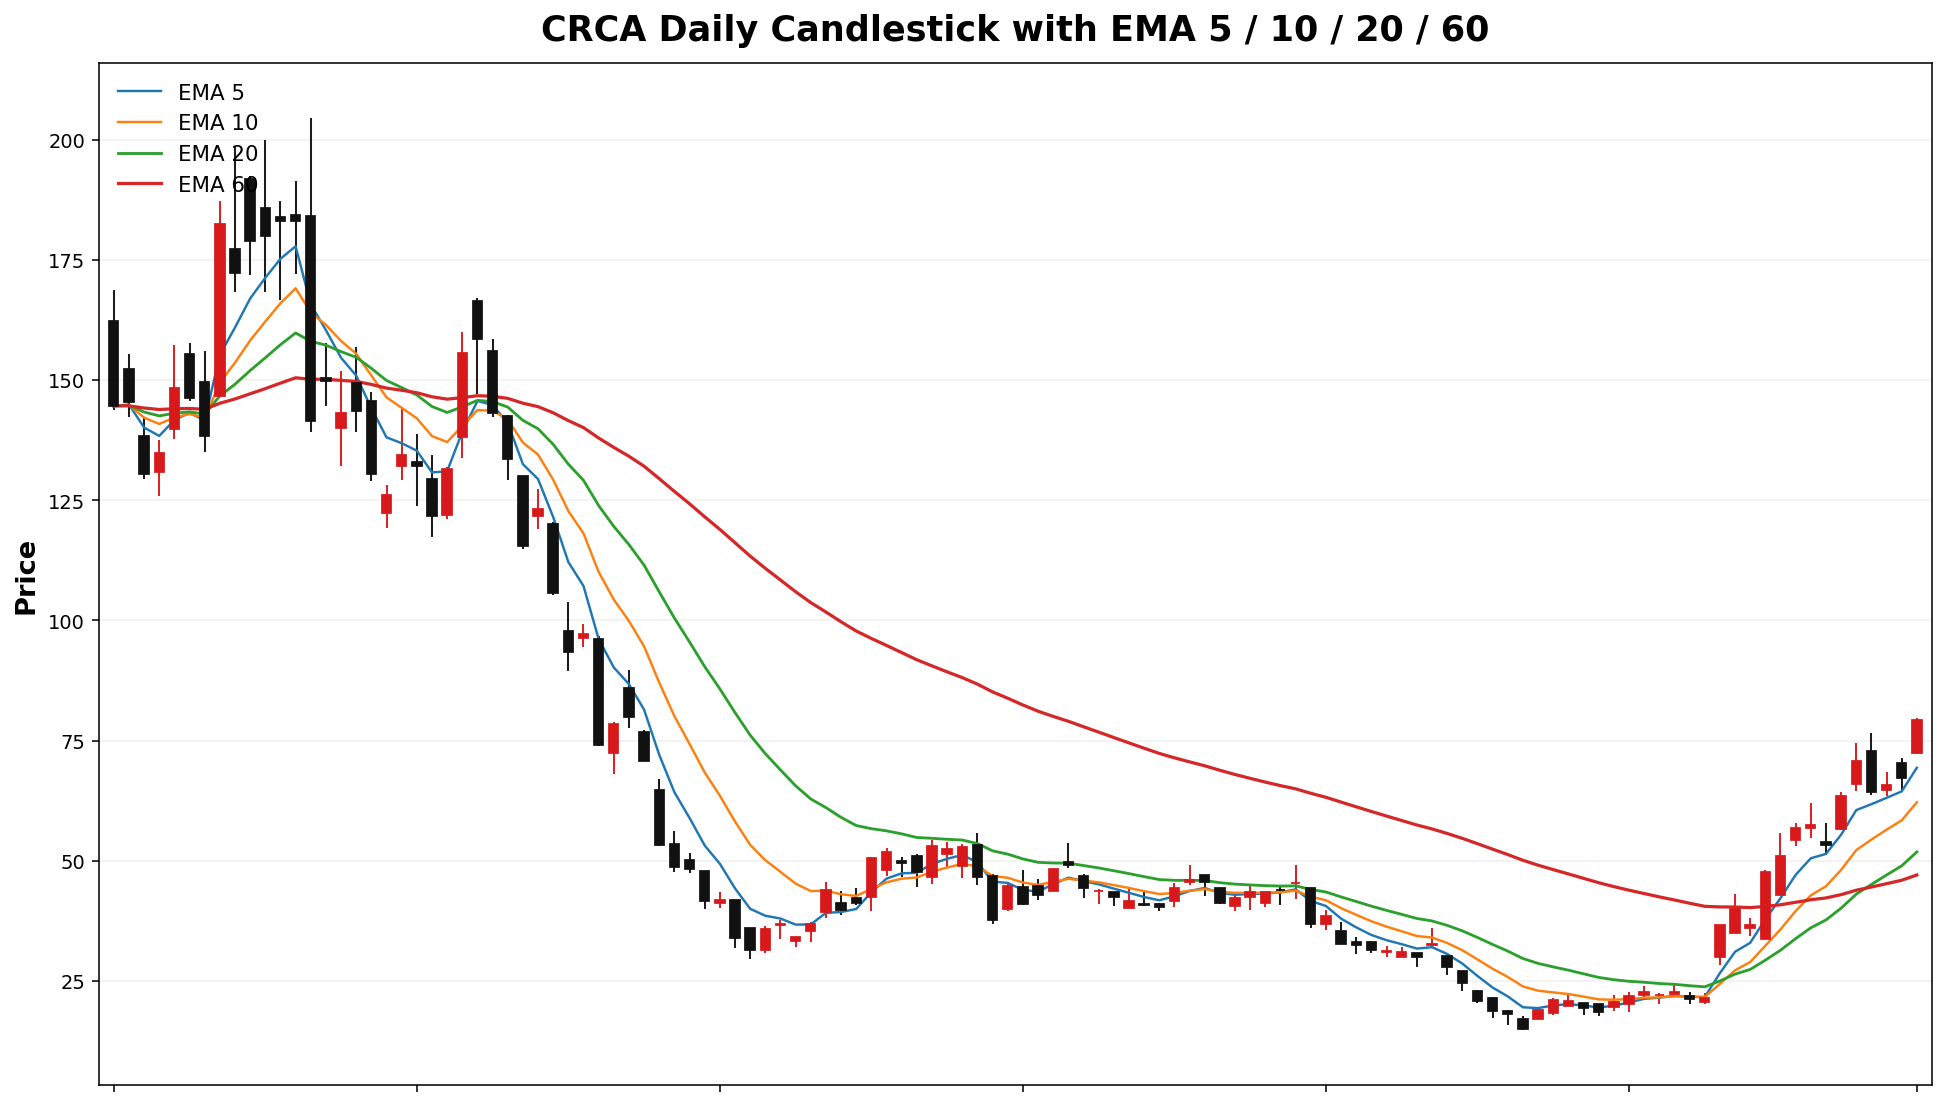
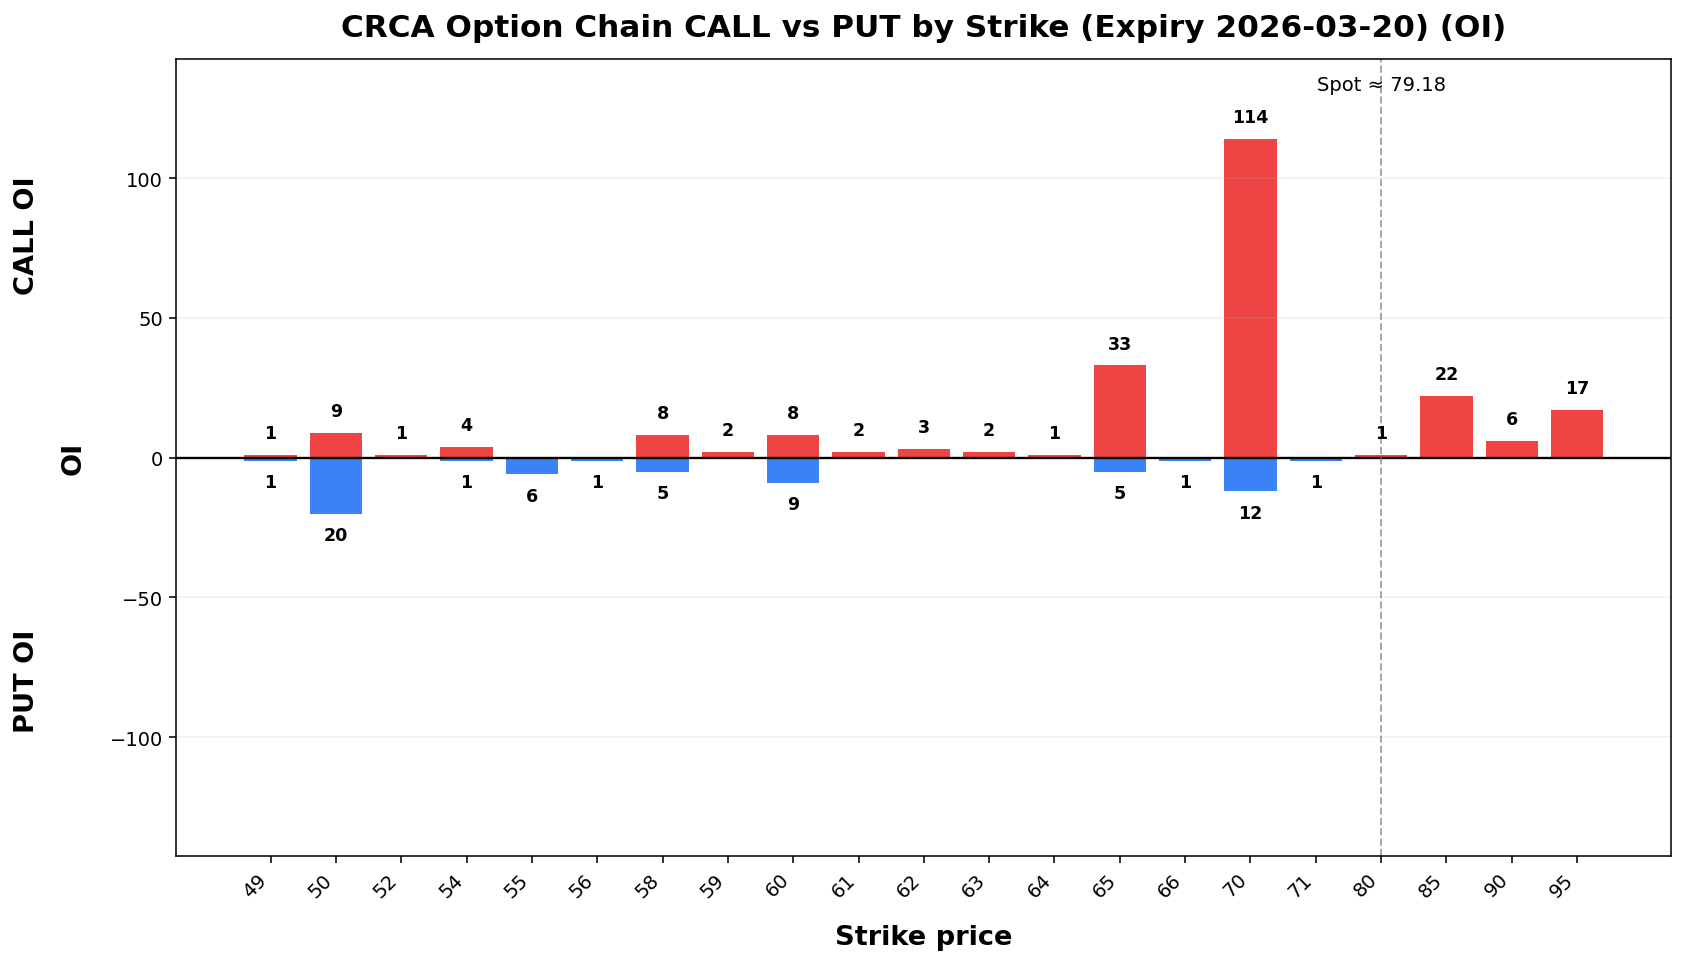
CRCA
Spot: 79.18
Report Time: 2026-03-17 08:43 AM MYT
Regime: TRANSITION
Dealer Gamma: LONG
Term Structure
| Expiry |
DTE |
Forward |
ATM IV |
ATM Straddle |
| 2026-03-20 |
4 |
77.44 |
171.11% |
13.82 |
| 2026-04-17 |
32 |
78.38 |
128.40% |
30.00 |
Weekly Range
| Confidence |
Low |
High |
Width |
| 68% |
62.50 |
95.86 |
33.37 |
| 80% |
57.80 |
100.56 |
42.76 |
| 90% |
51.74 |
106.62 |
54.88 |
| 95% |
46.48 |
111.88 |
65.40 |
Structure & Probabilities
| Support |
Resistance |
Gamma Flip |
Max Pain |
P>Res |
P<Sup |
| 70.00 |
95.86 |
47.09 |
1.00 |
12.1% |
26.6% |
Flow & Skew
| Call Vol |
Put Vol |
Vol P/C |
Call OI |
Put OI |
OI P/C |
Skew |
Skew Bias |
6,3691,299 |
4,945297 |
0.7823 |
15,8225,847 |
24,439631 |
1.540.11 |
43.7515.19 vol pts |
PUT_SKEW |
Tail Risk
| Q10 |
Q50 |
Q90 |
Down Tail |
Up Tail |
Down/Up |
5.6686.00 |
8.2890.00 |
57.6394.00 |
43.200.00 |
8.7714.82 |
4.930.00 |
Daily Technicals
| EMA20 |
EMA50 |
VWAP20 |
BB Lower |
BB Mid |
BB Upper |
BB Width |
Vol Ratio |
Path |
37.6651.83 |
29.1445.65 |
38.3041.88 |
19.337.22 |
36.4146.09 |
53.4984.95 |
93.82%168.66% |
1.170.68 |
UP trend (expanding) |
Day Plan
45.70.00-50.0095.86 range: fade extremes- >
50.00:95.86: chase only if hold + vol
- <
45.70.00: risk expand; reduce size
- Regime:
PINTRANSITION
- Tech: UP trend (expanding)
Swing Plan
- Accumulate:
45.70.00-45.70.00
- Trim:
50.00-50.0095.86-95.86
- Add: close >
50.0095.86
- Cut: close <
45.70.00
- Best for:
pintransition regime
Raw Text Summary
📌 AXTICRCA @ 48.8679.18 (2026-03-1617 09:2608:43 PMAM MYT)

• Current price is **48.86*79.18**. Key support is around **45.70.00**, and resistance is around **50.00*95.86**.
• For the next week, the model’s **68% expected range** is roughly **38.6362.50 to 59.09*95.86**.
• A wider **90% range** is about **32.0451.74 to 65.68*106.62**.
• Dealer positioning looks **LONG gamma**, so the market behavior is classified as **PIN*TRANSITION**.
• The estimated **gamma flip** is near **48.52*47.09**. Crossing and holding beyond this area can change the trading behavior.
• Approximate breakout odds: **above resistance 37.4%12.1%**, **below support 34.26.6%** by the target horizon.
• Options skew is tilted toward **puts**, which suggests traders are paying more for downside protection.
• Near-term implied volatility is higher than the next expiry (**IV1 166.90%171.11% vs IV2 125.04%128.40%**), which suggests **near-term event stress / backwardation**.
• Recent volume is only **0.68x** the 20-day average, so breakouts may be less reliable unless volume improves.
• On the daily chart, the stock currently looks like **UP trend (expanding)**.
• The implied distribution shows **more upside tail potential** than downside tail risk.
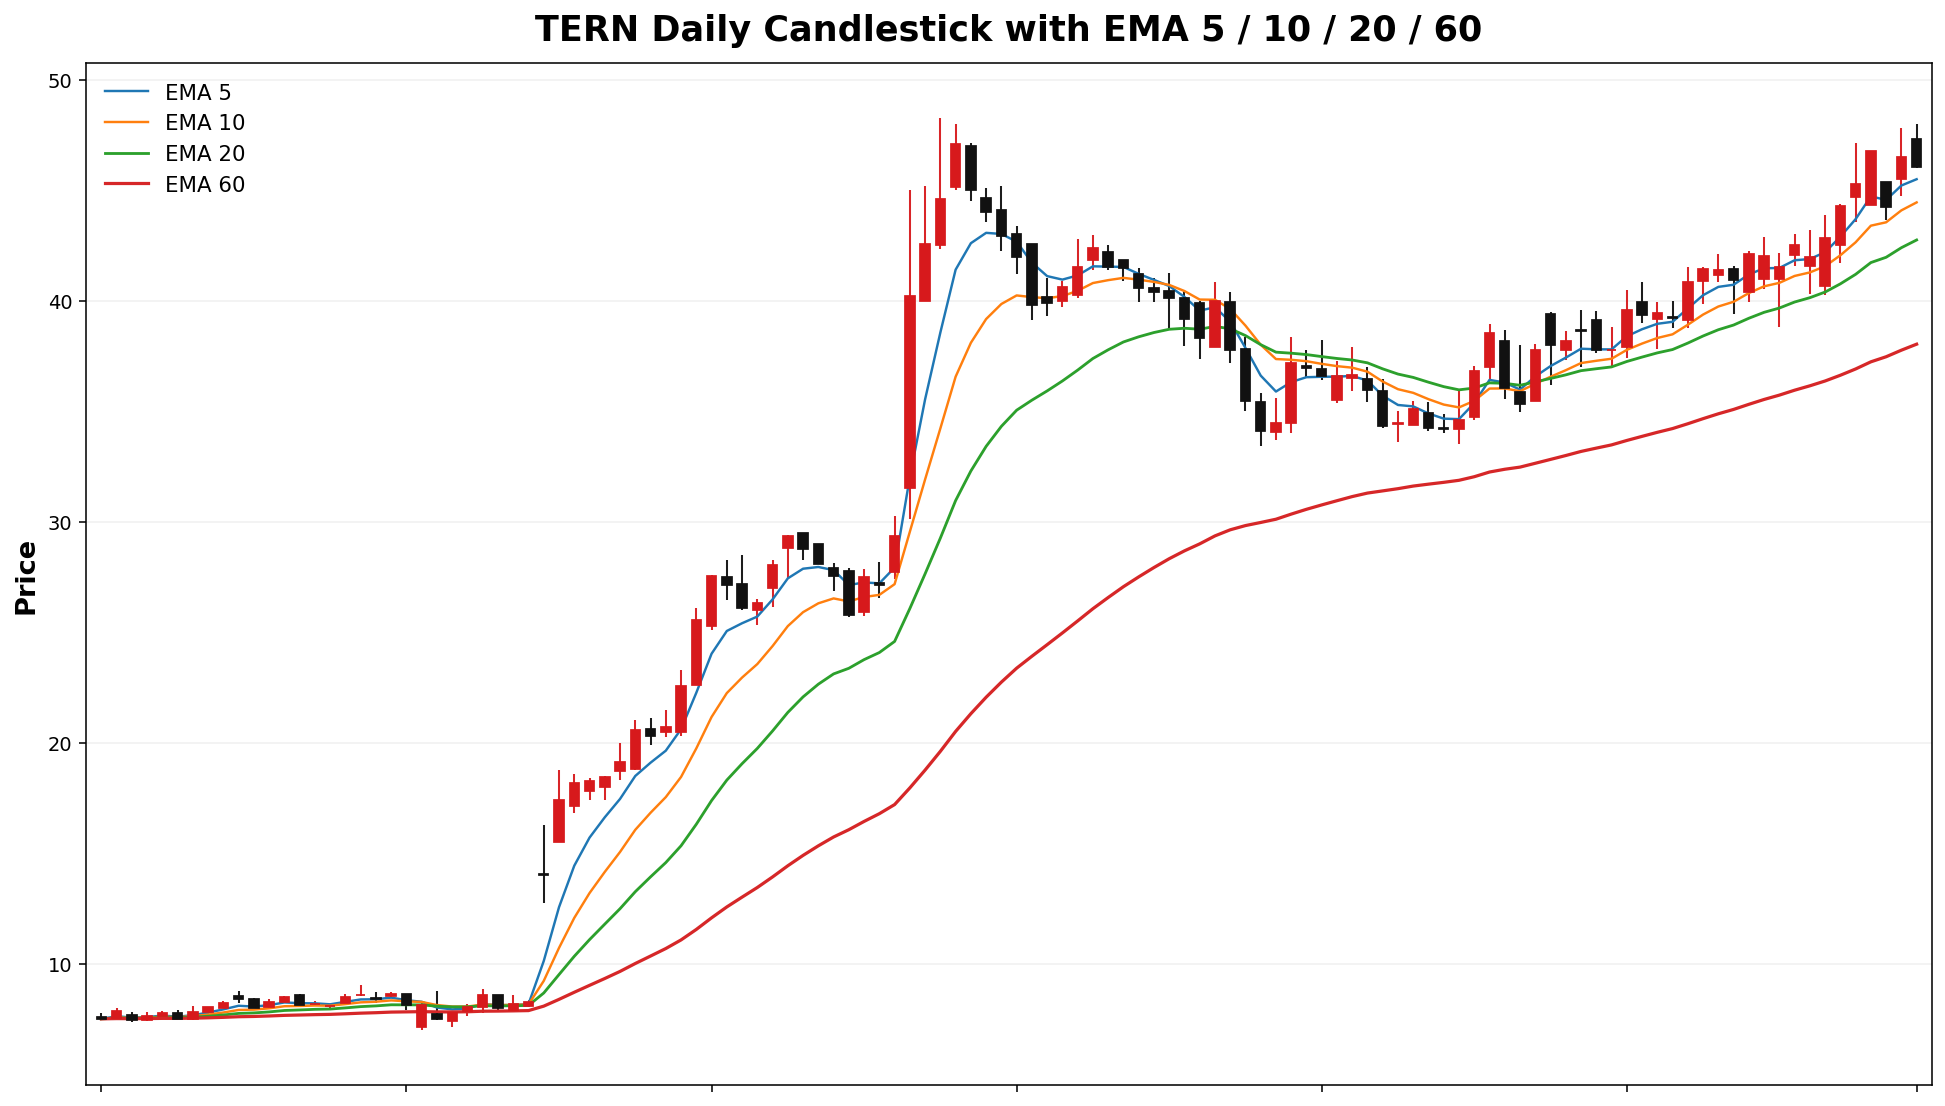
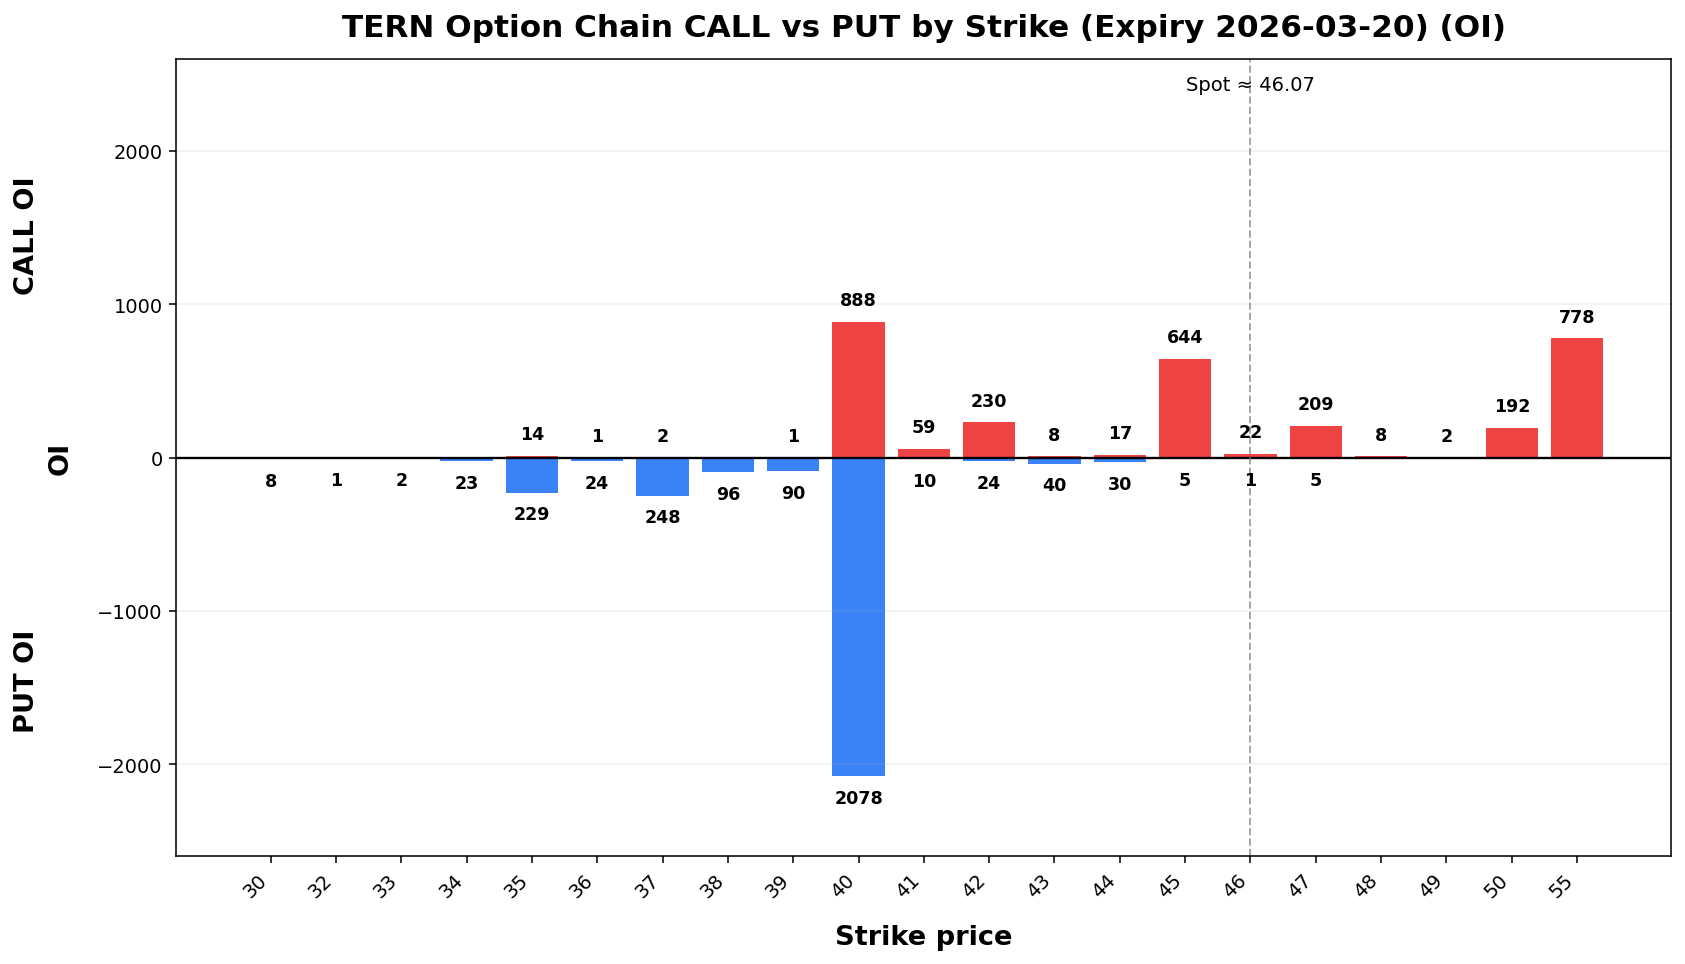
TERN
Spot: 46.07
Report Time: 2026-03-17 08:43 AM MYT
Regime: TRANSITION
Dealer Gamma: LONG
Term Structure
| Expiry |
DTE |
Forward |
ATM IV |
ATM Straddle |
| 2026-03-20 |
4 |
46.55 |
120.19% |
5.65 |
| 2026-04-17 |
32 |
46.51 |
96.73% |
13.15 |
Weekly Range
| Confidence |
Low |
High |
Width |
| 68% |
39.05 |
53.09 |
14.04 |
| 80% |
37.07 |
55.07 |
17.99 |
| 90% |
34.52 |
57.62 |
23.09 |
| 95% |
32.31 |
59.83 |
27.51 |
Structure & Probabilities
| Support |
Resistance |
Gamma Flip |
Max Pain |
P>Res |
P<Sup |
| 45.00 |
47.00 |
44.02 |
40.00 |
36.7% |
43.1% |
Flow & Skew
| Call Vol |
Put Vol |
Vol P/C |
Call OI |
Put OI |
OI P/C |
Skew |
Skew Bias |
| 413 |
162 |
0.39 |
3,101 |
3,181 |
1.03 |
179.59 vol pts |
PUT_SKEW |
Tail Risk
| Q10 |
Q50 |
Q90 |
Down Tail |
Up Tail |
Down/Up |
| 47.19 |
48.07 |
48.95 |
0.00 |
2.88 |
0.00 |
Daily Technicals
| EMA20 |
EMA50 |
VWAP20 |
BB Lower |
BB Mid |
BB Upper |
BB Width |
Vol Ratio |
Path |
| 42.75 |
39.23 |
42.43 |
37.64 |
42.42 |
47.21 |
22.56% |
0.91 |
UP trend (expanding) |
Day Plan
- 45.00-47.00 range: fade extremes
- > 47.00: chase only if hold + vol
- < 45.00: risk expand; reduce size
- Regime: TRANSITION
- Tech: UP trend (expanding)
Swing Plan
- Accumulate: 45.00-45.00
- Trim: 47.00-47.00
- Add: close > 47.00
- Cut: close < 45.00
- Best for: transition regime
Raw Text Summary
📌 TERN @ 46.07 (2026-03-17 08:43 AM MYT)

• Current price is **46.07**. Key support is around **45.00**, and resistance is around **47.00**.
• For the next week, the model’s **68% expected range** is roughly **39.05 to 53.09**.
• A wider **90% range** is about **34.52 to 57.62**.
• Dealer positioning looks **LONG gamma**, so the market behavior is classified as **TRANSITION**.
• The estimated **gamma flip** is near **44.02**. Crossing and holding beyond this area can change the trading behavior.
• Approximate breakout odds: **above resistance 36.7%**, **below support 43.1%** by the target horizon.
• Options skew is tilted toward **puts**, which suggests traders are paying more for downside protection.
• Near-term implied volatility is higher than the next expiry (**IV1 120.19% vs IV2 96.73%**), which suggests **near-term event stress / backwardation**.
• On the daily chart, the stock currently looks like **UP trend (expanding)**.
• The implied distribution shows **more upside tail potential** than downside tail risk.
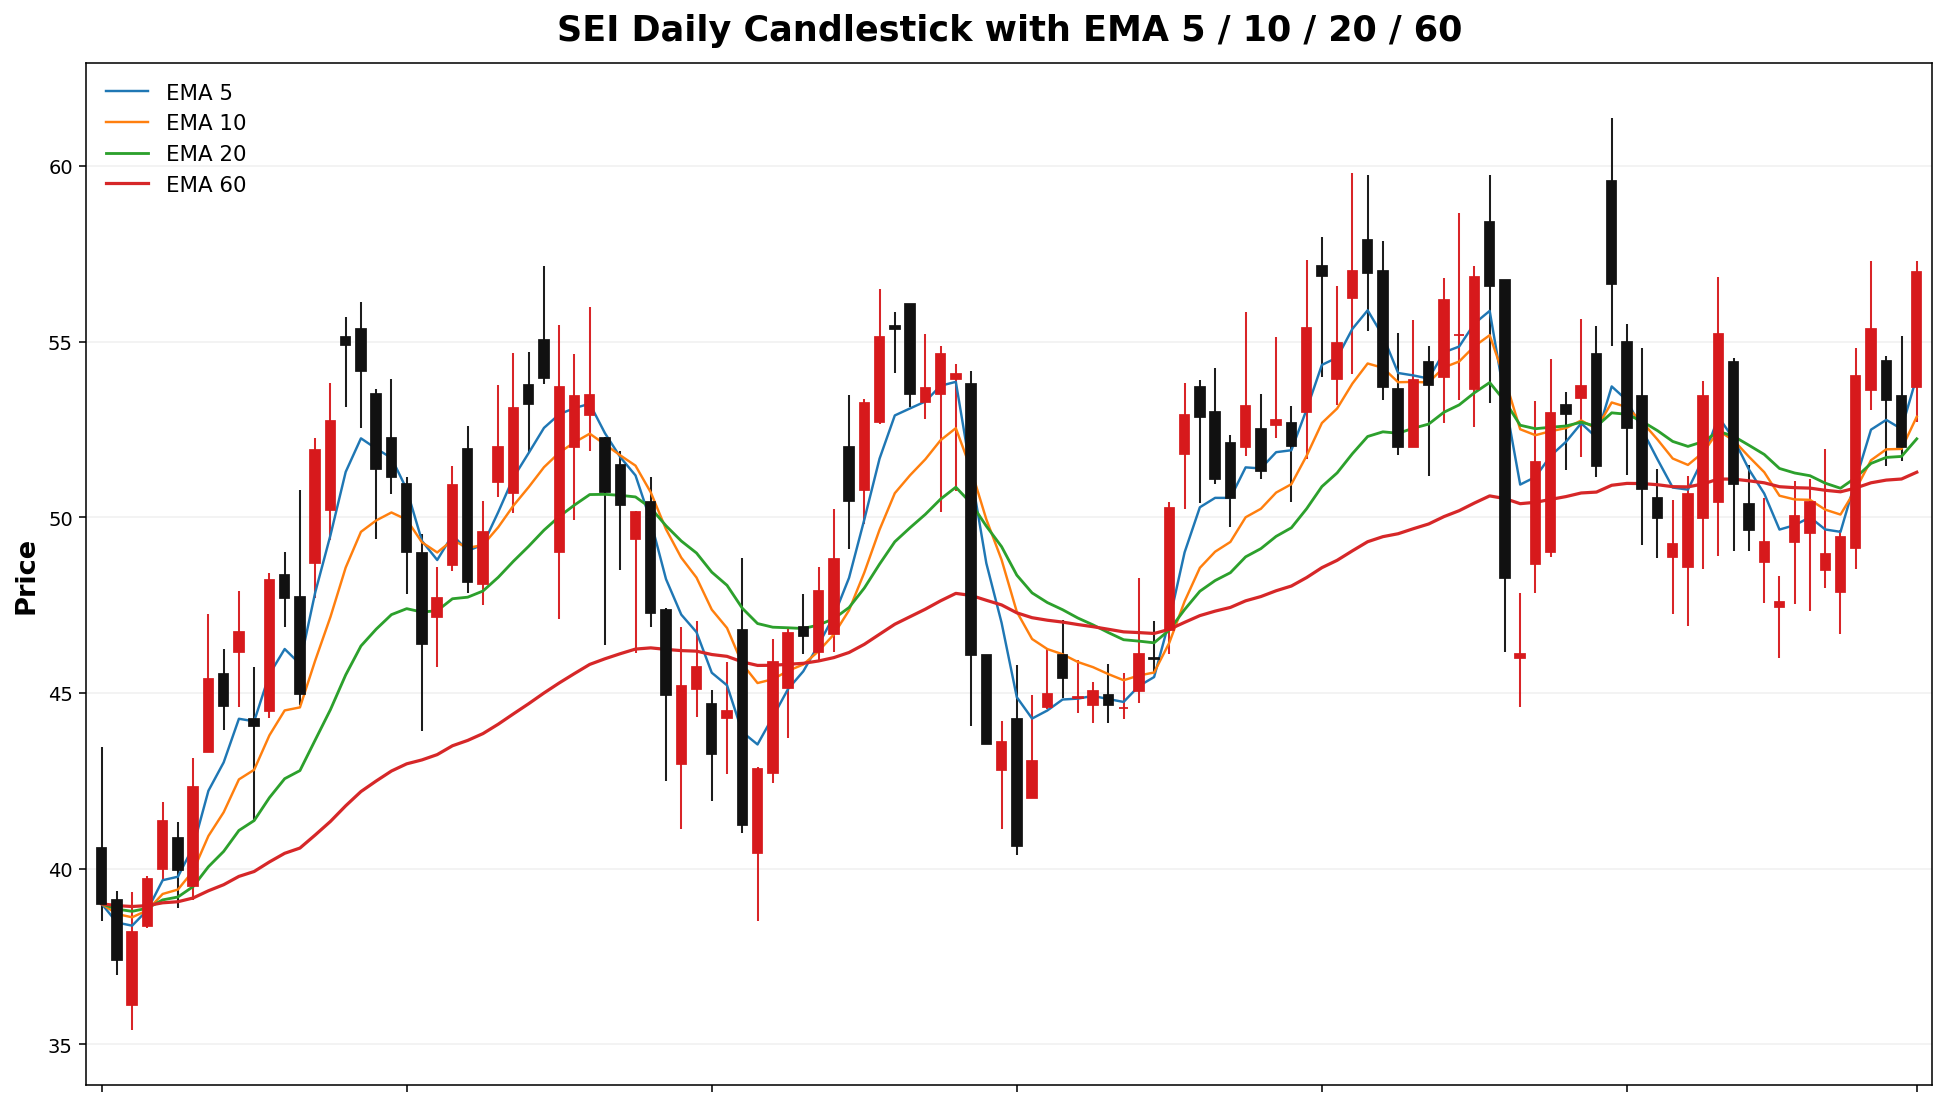
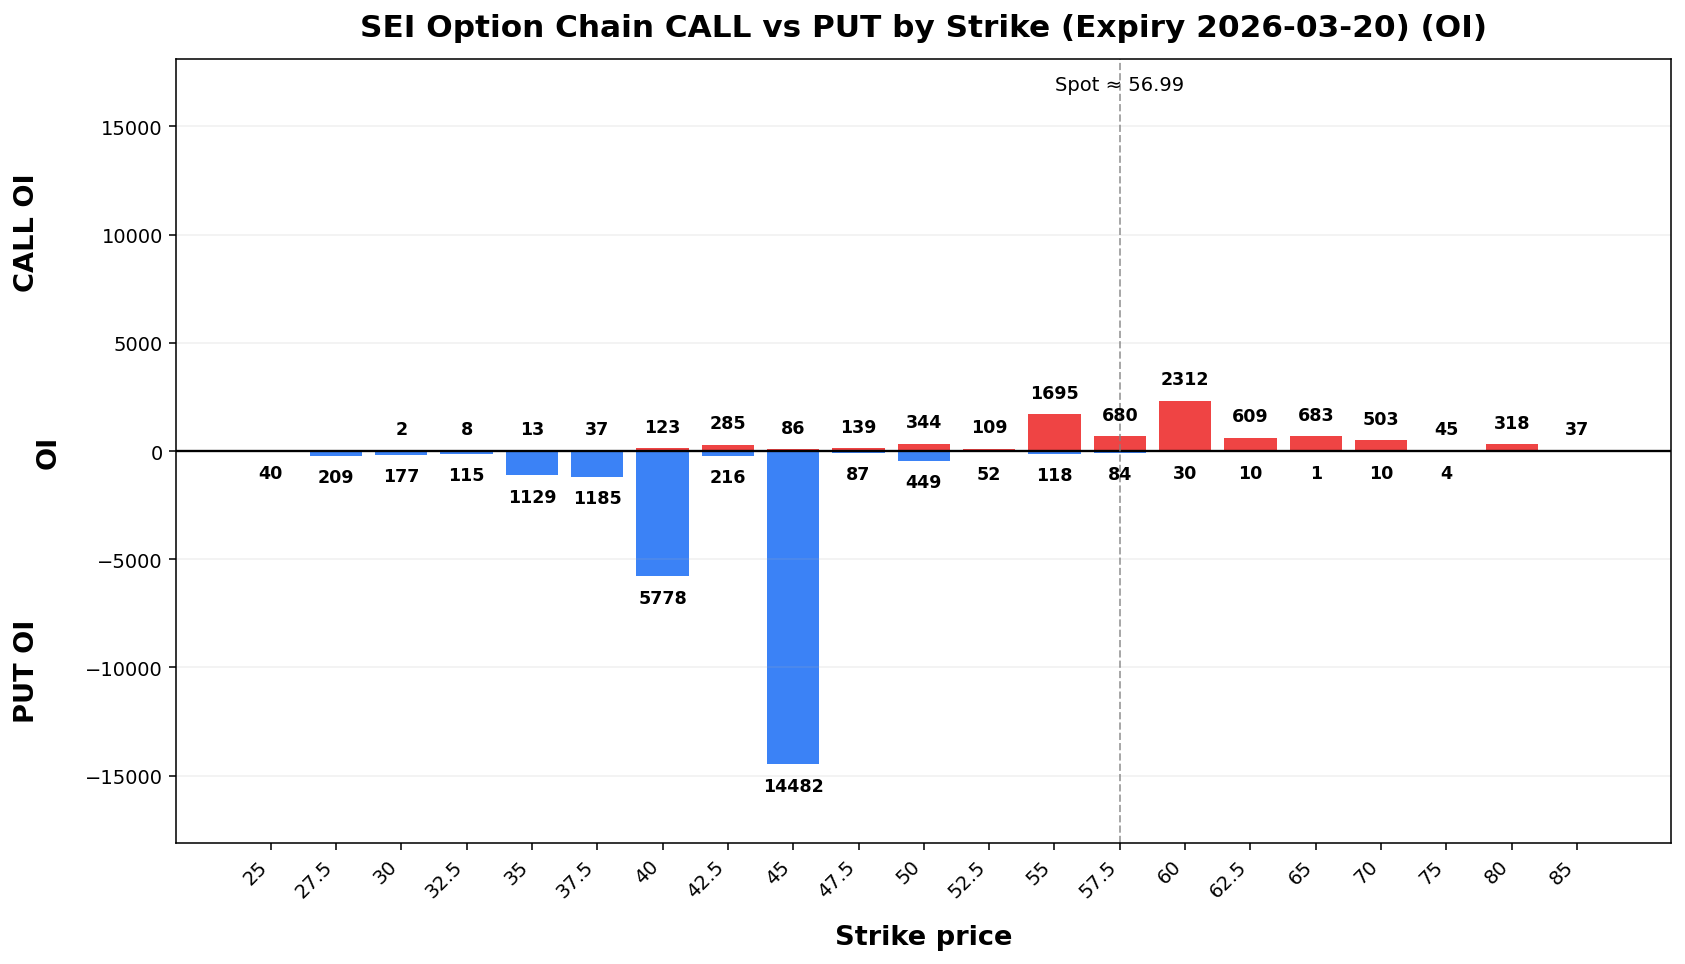
SEI
Spot: 56.99
Report Time: 2026-03-17 08:43 AM MYT
Regime: TRANSITION
Dealer Gamma: LONG
Term Structure
| Expiry |
DTE |
Forward |
ATM IV |
ATM Straddle |
| 2026-03-20 |
4 |
56.86 |
101.03% |
5.88 |
| 2026-04-17 |
32 |
56.62 |
68.09% |
11.45 |
Weekly Range
| Confidence |
Low |
High |
Width |
| 68% |
50.18 |
63.80 |
13.62 |
| 80% |
48.26 |
65.72 |
17.46 |
| 90% |
45.79 |
68.19 |
22.41 |
| 95% |
43.64 |
70.34 |
26.70 |
Structure & Probabilities
| Support |
Resistance |
Gamma Flip |
Max Pain |
P>Res |
P<Sup |
| 55.00 |
57.50 |
55.44 |
50.00 |
35.9% |
35.2% |
Flow & Skew
| Call Vol |
Put Vol |
Vol P/C |
Call OI |
Put OI |
OI P/C |
Skew |
Skew Bias |
| 194 |
352 |
1.81 |
8,028 |
24,176 |
3.01 |
23.73 vol pts |
PUT_SKEW |
Tail Risk
| Q10 |
Q50 |
Q90 |
Down Tail |
Up Tail |
Down/Up |
| 31.04 |
50.70 |
63.94 |
25.95 |
6.95 |
3.73 |
Daily Technicals
| EMA20 |
EMA50 |
VWAP20 |
BB Lower |
BB Mid |
BB Upper |
BB Width |
Vol Ratio |
Path |
| 52.23 |
51.51 |
51.40 |
46.47 |
51.50 |
56.53 |
19.52% |
0.70 |
UP trend (expanding) |
Day Plan
- 55.00-57.50 range: fade extremes
- > 57.50: chase only if hold + vol
- < 55.00: risk expand; reduce size
- Regime: TRANSITION
- Tech: UP trend (expanding)
Swing Plan
- Accumulate: 55.00-55.00
- Trim: 57.50-57.50
- Add: close > 57.50
- Cut: close < 55.00
- Best for: transition regime
Raw Text Summary
📌 SEI @ 56.99 (2026-03-17 08:43 AM MYT)

• Current price is **56.99**. Key support is around **55.00**, and resistance is around **57.50**.
• For the next week, the model’s **68% expected range** is roughly **50.18 to 63.80**.
• A wider **90% range** is about **45.79 to 68.19**.
• Dealer positioning looks **LONG gamma**, so the market behavior is classified as **TRANSITION**.
• The estimated **gamma flip** is near **55.44**. Crossing and holding beyond this area can change the trading behavior.
• Approximate breakout odds: **above resistance 35.9%**, **below support 35.2%** by the target horizon.
• Options skew is tilted toward **puts**, which suggests traders are paying more for downside protection.
• Near-term implied volatility is higher than the next expiry (**IV1 101.03% vs IV2 68.09%**), which suggests **near-term event stress / backwardation**.
• Recent volume is only **0.70x** the 20-day average, so breakouts may be less reliable unless volume improves.
• On the daily chart, the stock currently looks like **UP trend (expanding)**.
• The implied distribution shows **heavier downside tail risk** than upside tail potential.