Analysis Report
Updated: 2026-03-1718 15:08:43:0725 MYT
Source File: combined-summary-20260317-154307.20260318-084324.md
Screening Source: screen-report-20260317-154253.20260318-084247.md
Extracted Symbols: AAOI,PL, AXTICRCA, NEBX, SYRE, AXTI, LQDA
Topline Summary
| Symbol |
Spot |
Support |
Resistance |
Flip |
Regime |
P>Res |
P<Sup |
68% Range |
90% Range |
AAOIPL |
94.0727.08 |
23.26.00 |
109.28.00 |
22.92 |
PIN |
35.9% |
41.9% |
21.25 - 32.91 |
NA17.49 - 36.67 |
| CRCA |
TREND86.84 |
17.6%70.00 |
0.0%108.87 |
78.2350.21 |
TRANSITION |
13.2% |
18.5% |
64.81 - 109.91108.87 |
68.0150.60 - 120.123.08 |
| NEBX |
42.17 |
40.00 |
50.00 |
35.39 |
TRANSITION |
15.4% |
43.4% |
34.03 - 50.31 |
28.78 - 55.56 |
| SYRE |
43.95 |
40.00 |
45.00 |
34.13 |
TRANSITION |
44.2% |
26.2% |
35.56 - 52.34 |
30.15 - 57.75 |
| AXTI |
48.3944.36 |
38.9440.00 |
57.8445.00 |
24.1950.50 |
TREND |
62.0% |
31.4% |
36.76 - 51.96 |
31.87 - 56.85 |
| LQDA |
36.86 |
35.00 |
40.00 |
32.54 |
TRANSITION |
16.7%25.5% |
16.7%27.8% |
38.9431.50 - 57.8442.22 |
32.8528.05 - 63.9345.67 |
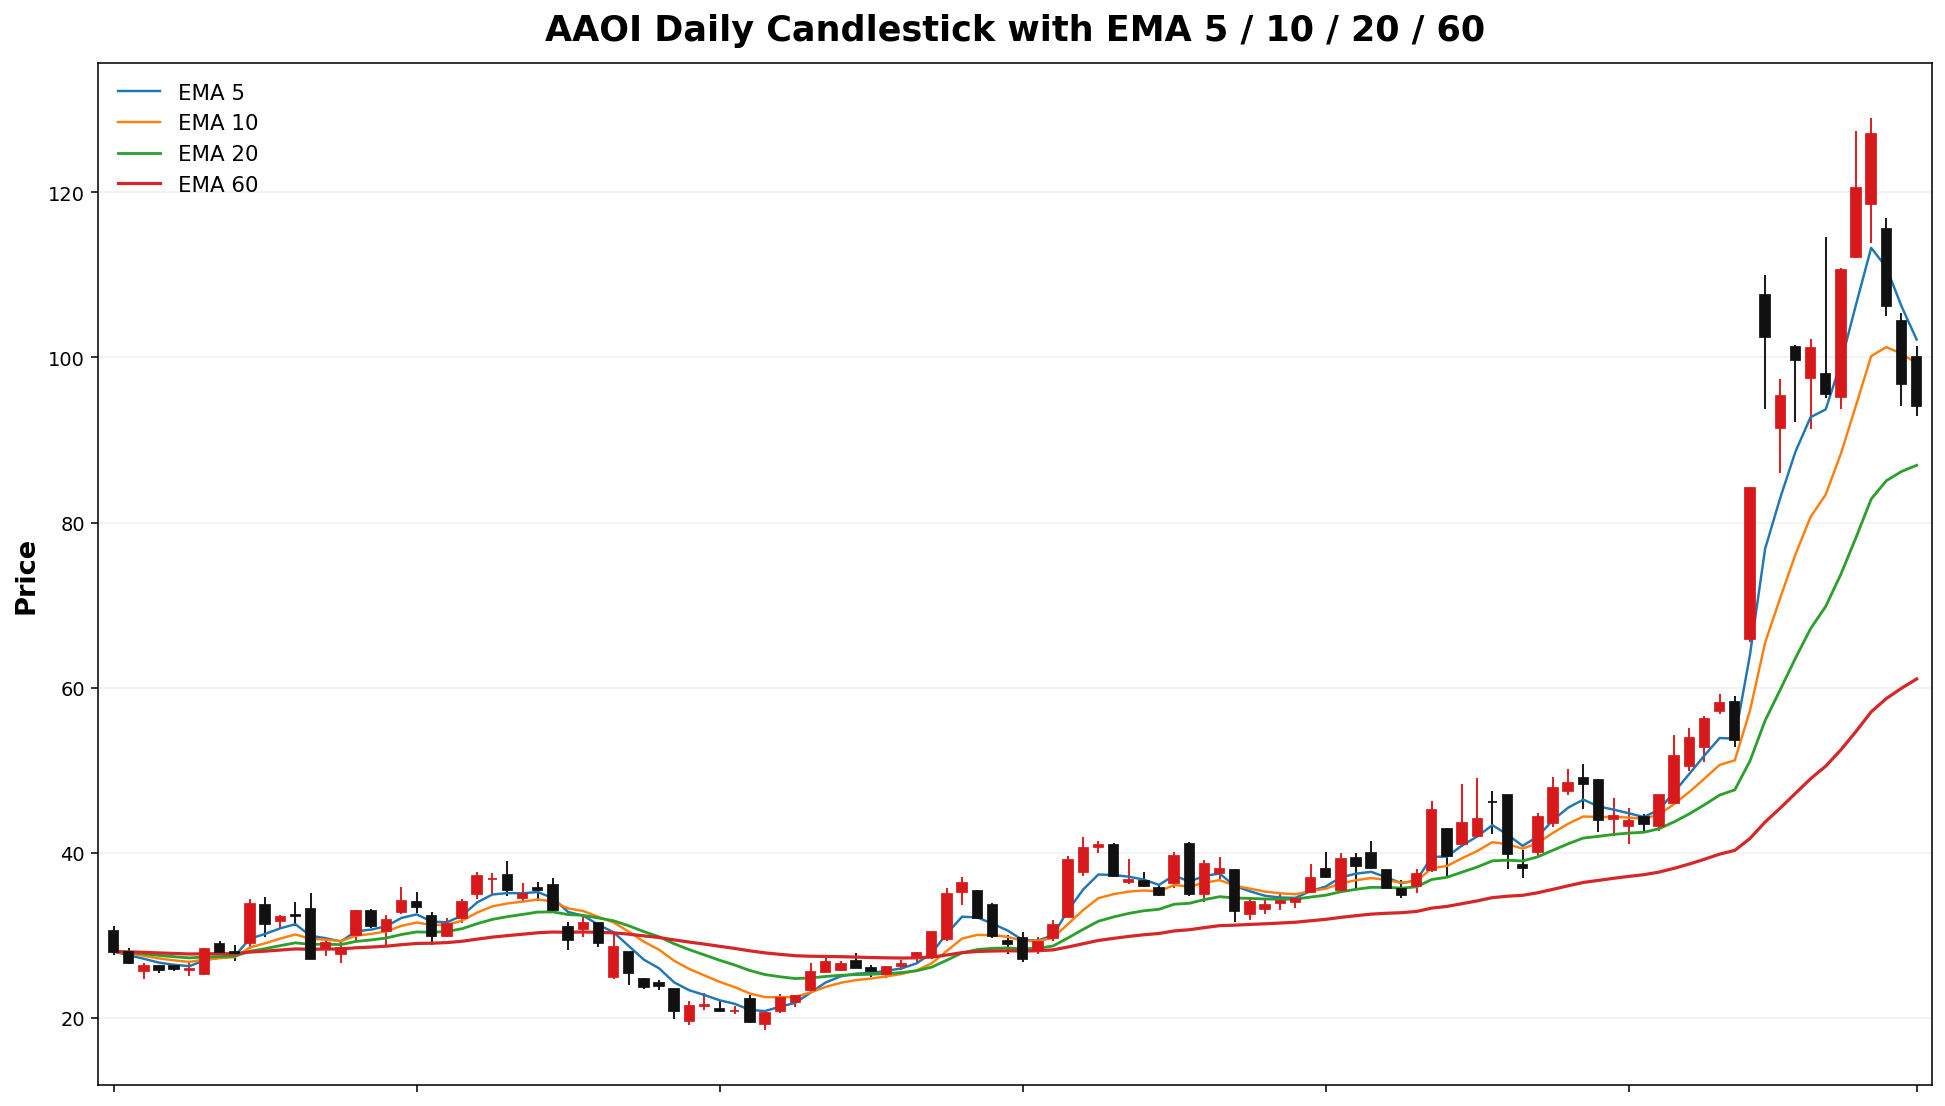
AAOIPL
Spot: 94.0727.08
Report Time: 2026-03-1718 03:4308:42 PMAM MYT
Regime: TRENDPIN
Dealer Gamma: SHORTLONG
Term Structure
| Expiry |
DTE |
Forward |
ATM IV |
ATM Straddle |
| 2026-03-20 |
43 |
94.5726.83 |
133.35%226.55% |
12.305.38 |
| 2026-03-27 |
1110 |
95.3026.87 |
115.24%136.93% |
18.396.07 |
Weekly Range
| Confidence |
Low |
High |
Width |
| 68% |
78.2321.25 |
109.32.91 |
31.6911.66 |
| 80% |
73.7719.61 |
114.3734.55 |
40.6114.94 |
| 90% |
68.0117.49 |
120.1336.67 |
52.1219.18 |
| 95% |
63.0215.66 |
125.1238.50 |
62.1122.85 |
Structure & Probabilities
| Support |
Resistance |
Gamma Flip |
Max Pain |
P>Res |
P<Sup |
23.26.00 |
109.91 |
NA |
23.28.00 |
17.6%22.92 |
0.0%25.00 |
35.9% |
41.9% |
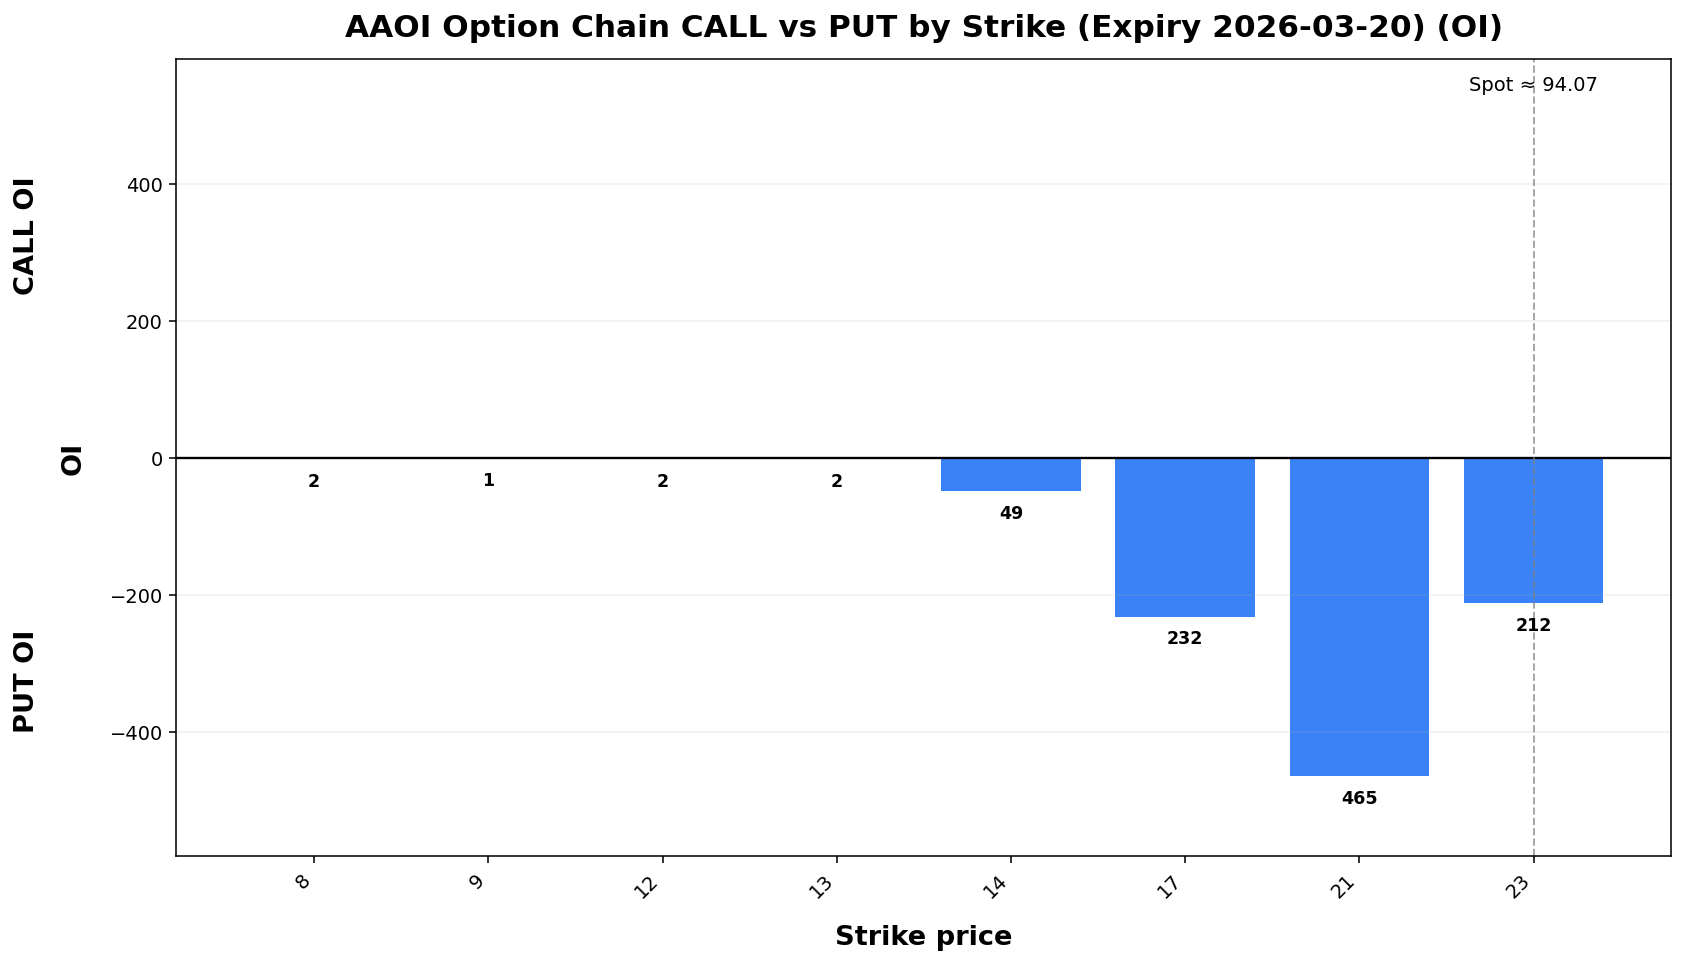
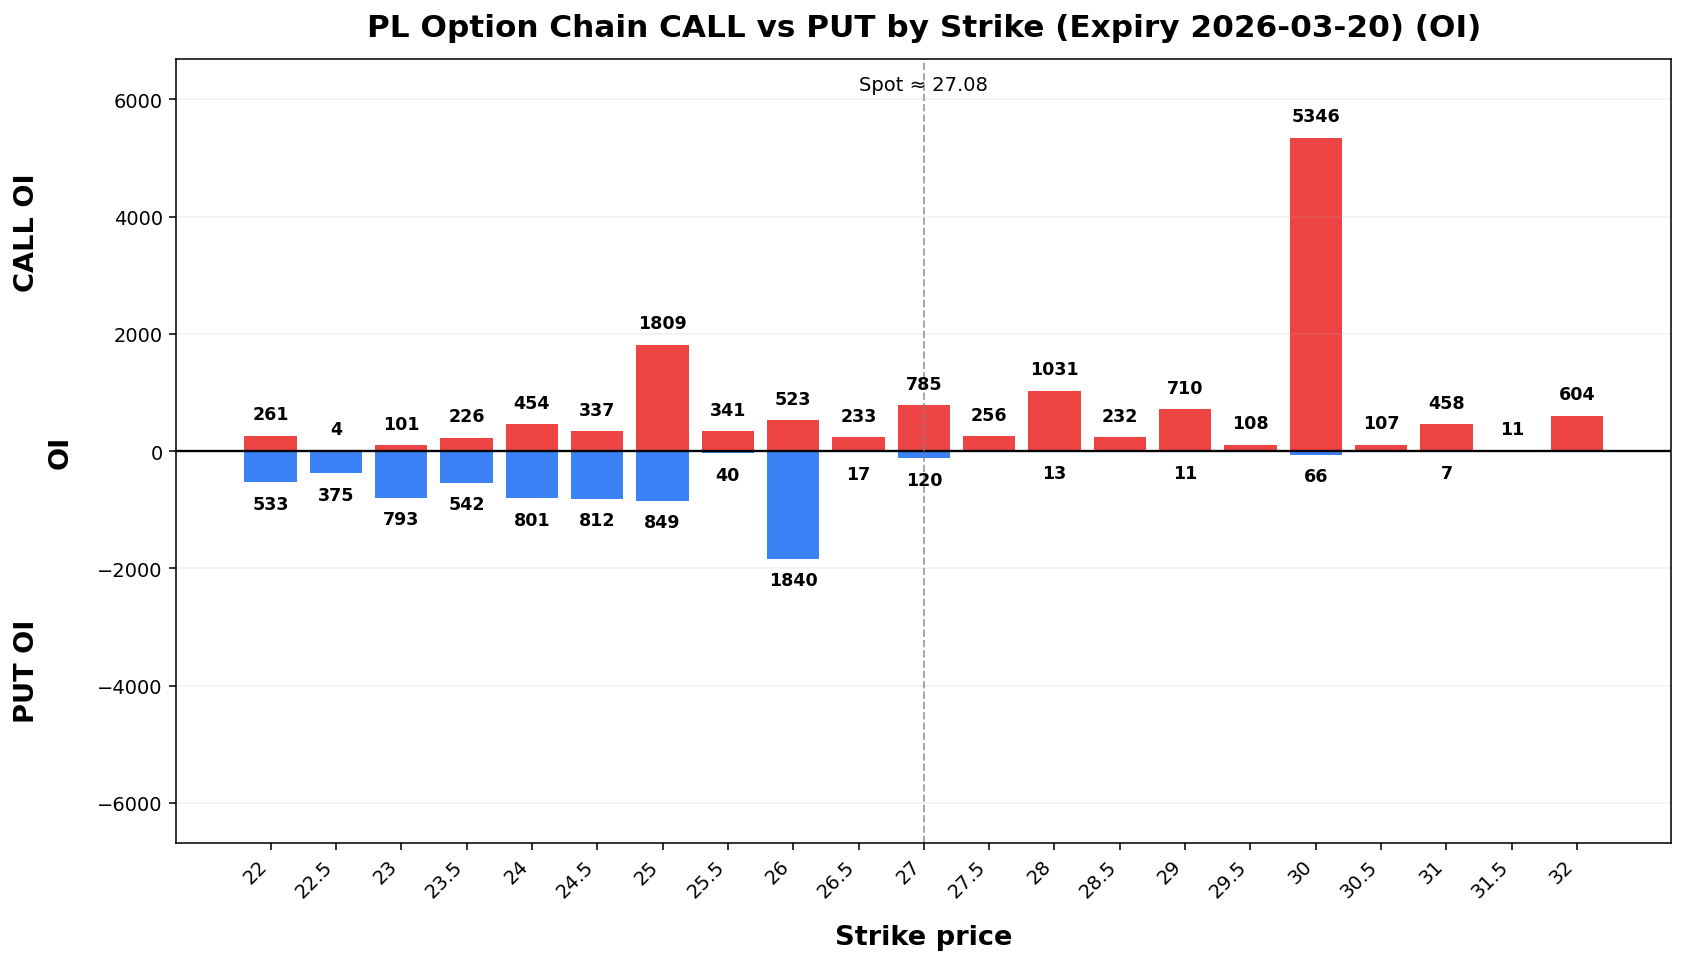
Flow & Skew
| Call Vol |
Put Vol |
Vol P/C |
Call OI |
Put OI |
OI P/C |
Skew |
Skew Bias |
19,1424,680 |
6,7863,868 |
0.3583 |
018,591 |
96515,165 |
NA0.82 |
869.19.92 vol pts |
PUT_SKEW |
Tail Risk
| Q10 |
Q50 |
Q90 |
Down Tail |
Up Tail |
Down/Up |
3.4419.83 |
79.9725.33 |
106.77 |
90.63 |
12.7033.89 |
7.1425 |
6.81 |
1.06 |
Daily Technicals
| EMA20 |
EMA50 |
VWAP20 |
BB Lower |
BB Mid |
BB Upper |
BB Width |
Vol Ratio |
Path |
86.9325.00 |
65.1023.48 |
92.2524.99 |
23.33 |
25.06 |
26.5680 |
82.0913.84% |
137.62 |
135.30% |
0.971.21 |
UP trend (expanding)bias |
Day Plan
23.26.00-109.9128.00 range: fade extremes- >
109.91:28.00: chase only if hold + vol
- <
23.26.00: risk expand; reduce size
- Regime:
TRENDPIN
- Tech: UP
trend (expanding)bias
Swing Plan
- Accumulate:
23.26.00-23.26.00
- Trim:
109.91-109.9128.00-28.00
- Add: close >
109.9128.00
- Cut: close <
23.26.00
- Best for:
trendpin regime
Raw Text Summary
📌 AAOIPL @ 94.0727.08 (2026-03-1718 03:4308:42 PMAM MYT)

• Current price is **94.07*27.08**. Key support is around **23.26.00**, and resistance is around **109.91*28.00**.
• For the next week, the model’s **68% expected range** is roughly **78.2321.25 to 109.32.91**.
• A wider **90% range** is about **68.0117.49 to 120.13*36.67**.
• Dealer positioning looks **SHORTLONG gamma**, so the market behavior is classified as **TREND*PIN**.
• The estimated **gamma flip** is near **22.92**. Crossing and holding beyond this area can change the trading behavior.
• Approximate breakout odds: **above resistance 17.6%35.9%**, **below support 0.0%41.9%** by the target horizon.
• Options skew is tilted toward **puts**, which suggests traders are paying more for downside protection.
• Near-term implied volatility is higher than the next expiry (**IV1 133.35%226.55% vs IV2 115.24%136.93%**), which suggests **near-term event stress / backwardation**.
• On the daily chart, the stock currently looks like **UP bias**.
• The implied distribution is **fairly balanced** between upside and downside tails.
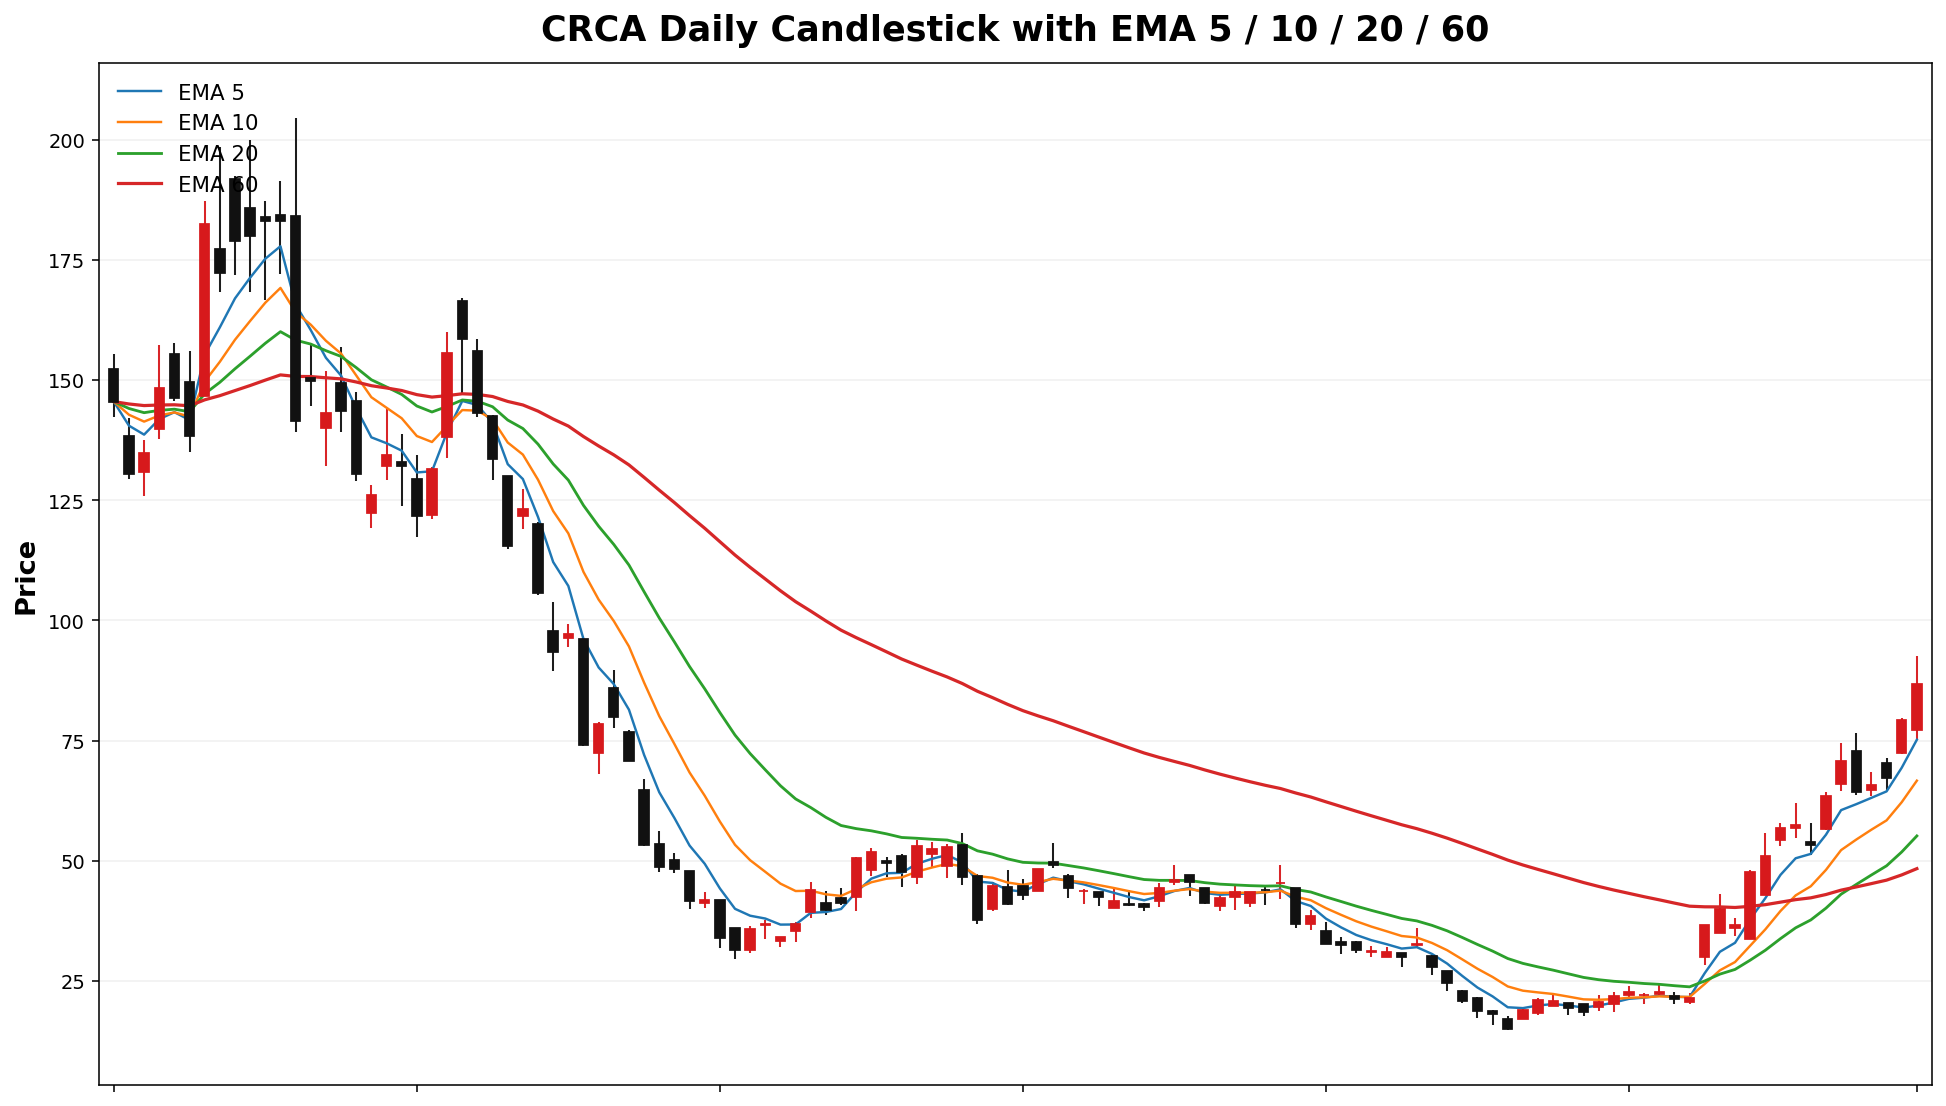
CRCA
Spot: 86.84
Report Time: 2026-03-18 08:43 AM MYT
Regime: TRANSITION
Dealer Gamma: LONG
Term Structure
| Expiry |
DTE |
Forward |
ATM IV |
ATM Straddle |
| 2026-03-20 |
3 |
85.04 |
240.21% |
18.28 |
| 2026-04-17 |
31 |
86.11 |
142.35% |
35.90 |
Weekly Range
| Confidence |
Low |
High |
Width |
| 68% |
64.81 |
108.87 |
44.07 |
| 80% |
58.60 |
115.08 |
56.48 |
| 90% |
50.60 |
123.08 |
72.49 |
| 95% |
43.65 |
130.03 |
86.37 |
Structure & Probabilities
| Support |
Resistance |
Gamma Flip |
Max Pain |
P>Res |
P<Sup |
| 70.00 |
108.87 |
50.21 |
1.00 |
13.2% |
18.5% |
Flow & Skew
| Call Vol |
Put Vol |
Vol P/C |
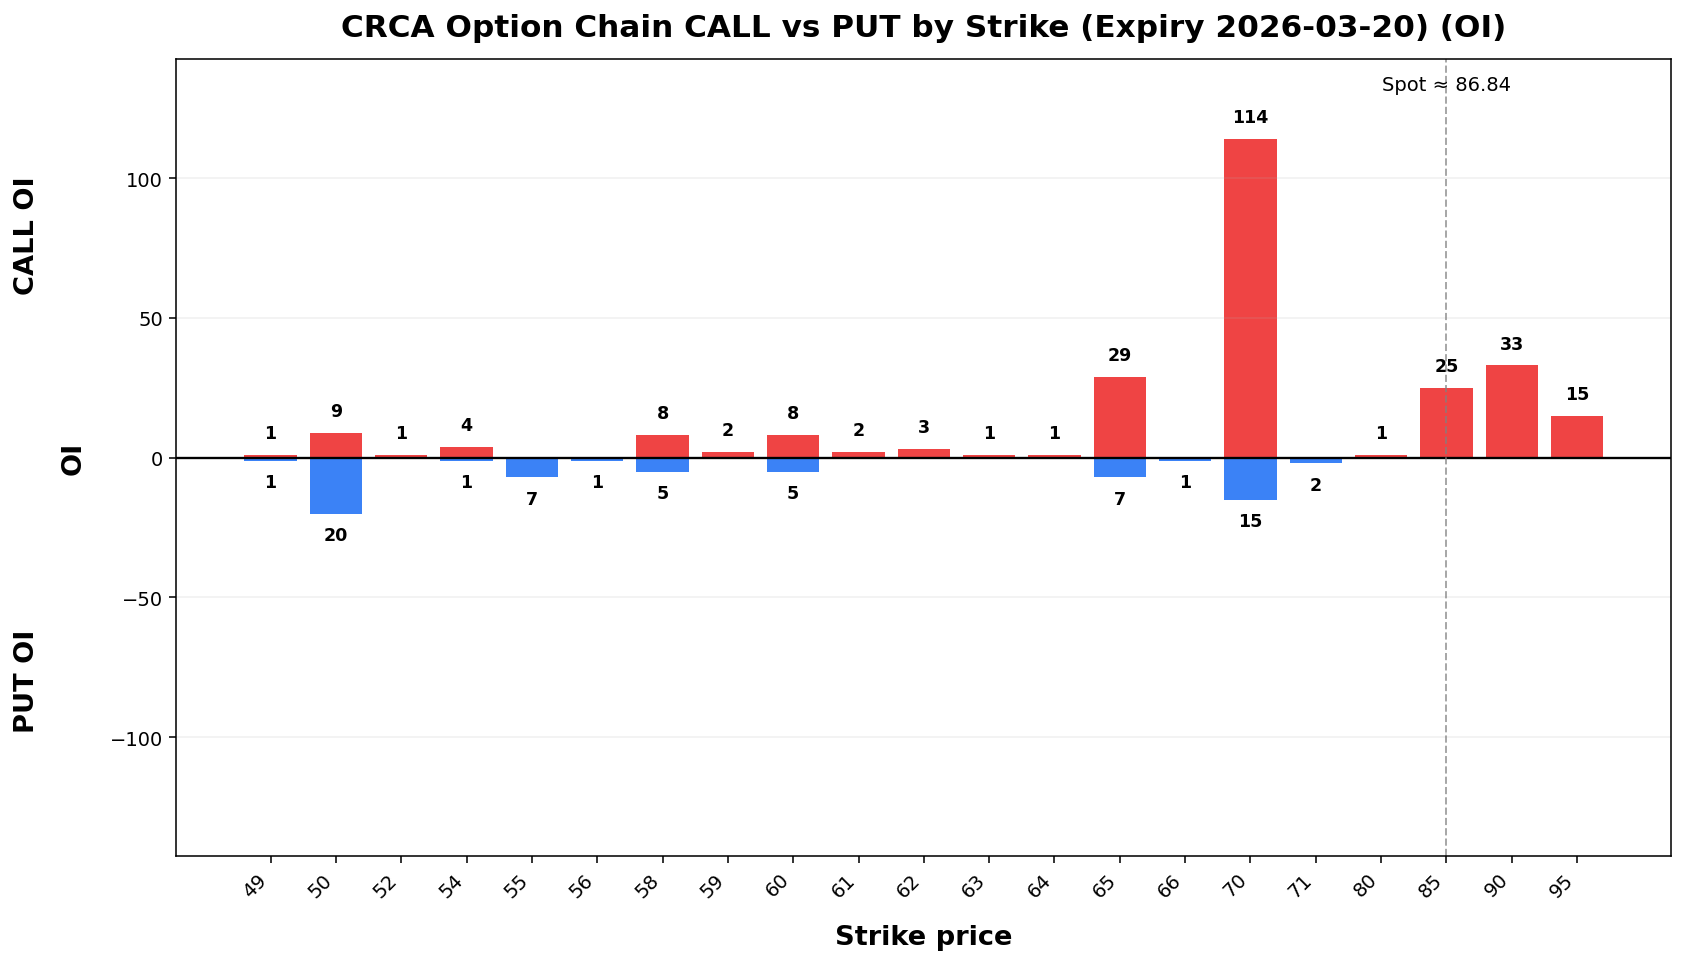
Call OI |
Put OI |
OI P/C |
Skew |
Skew Bias |
| 1,357 |
286 |
0.21 |
5,847 |
634 |
0.11 |
-1.07 vol pts |
CALL_SKEW |
Tail Risk
| Q10 |
Q50 |
Q90 |
Down Tail |
Up Tail |
Down/Up |
| 23.32 |
36.62 |
41.92 |
63.51 |
0.00 |
NA |
Daily Technicals
| EMA20 |
EMA50 |
VWAP20 |
BB Lower |
BB Mid |
BB Upper |
BB Width |
Vol Ratio |
Path |
| 55.16 |
47.26 |
44.47 |
8.21 |
49.34 |
90.47 |
166.71% |
0.60 |
UP trend (expanding) |
Day Plan
- 70.00-108.87 range: fade extremes
- > 108.87: chase only if hold + vol
- < 70.00: risk expand; reduce size
- Regime: TRANSITION
- Tech: UP trend (expanding)
Swing Plan
- Accumulate: 70.00-70.00
- Trim: 108.87-108.87
- Add: close > 108.87
- Cut: close < 70.00
- Best for: transition regime
Raw Text Summary
📌 CRCA @ 86.84 (2026-03-18 08:43 AM MYT)

• Current price is **86.84**. Key support is around **70.00**, and resistance is around **108.87**.
• For the next week, the model’s **68% expected range** is roughly **64.81 to 108.87**.
• A wider **90% range** is about **50.60 to 123.08**.
• Dealer positioning looks **LONG gamma**, so the market behavior is classified as **TRANSITION**.
• The estimated **gamma flip** is near **50.21**. Crossing and holding beyond this area can change the trading behavior.
• Approximate breakout odds: **above resistance 13.2%**, **below support 18.5%** by the target horizon.
• Options skew is fairly balanced, so there is **no strong directional bias** from skew alone.
• Near-term implied volatility is higher than the next expiry (**IV1 240.21% vs IV2 142.35%**), which suggests **near-term event stress / backwardation**.
• Recent volume is only **0.60x** the 20-day average, so breakouts may be less reliable unless volume improves.
• On the daily chart, the stock currently looks like **UP trend (expanding)**.
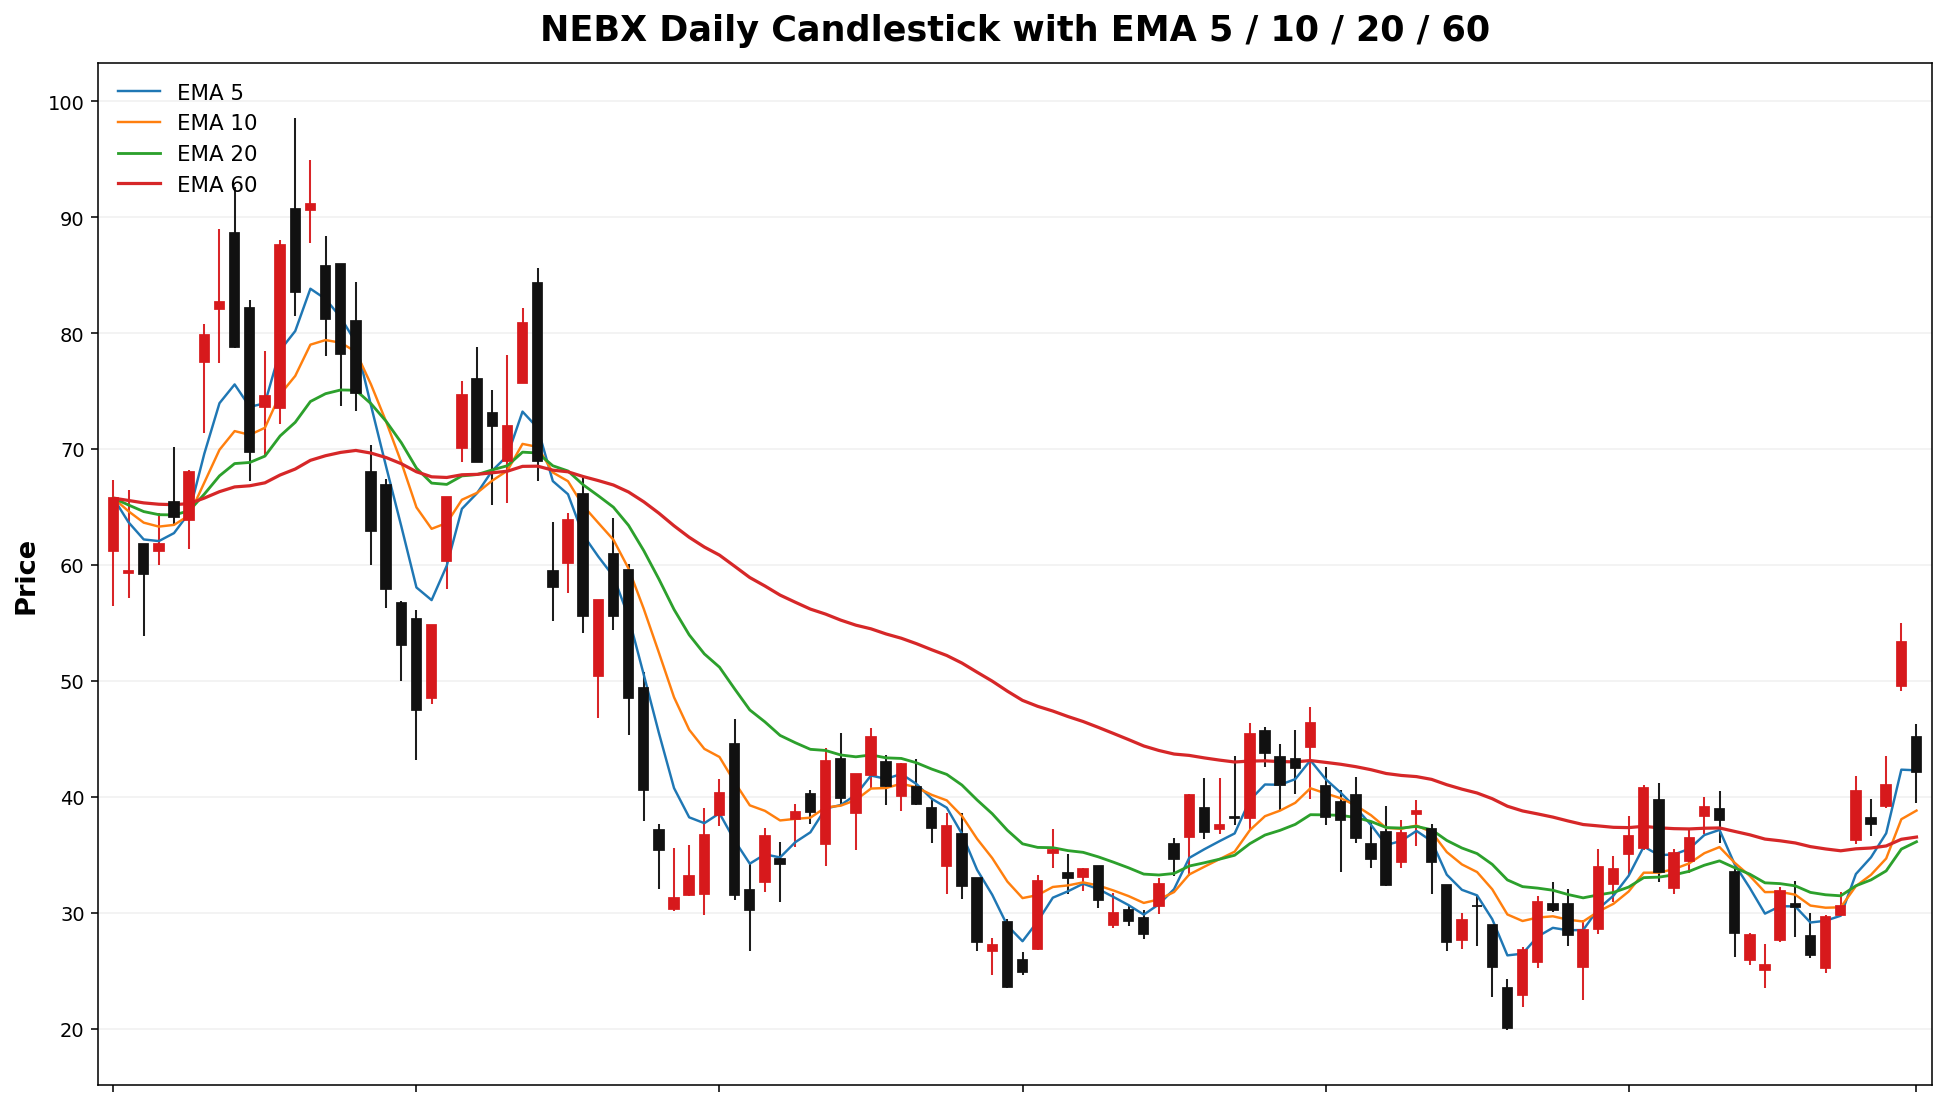
NEBX
Spot: 42.17
Report Time: 2026-03-18 08:43 AM MYT
Regime: TRANSITION
Dealer Gamma: LONG
Term Structure
| Expiry |
DTE |
Forward |
ATM IV |
ATM Straddle |
| 2026-03-20 |
3 |
41.80 |
161.73% |
5.97 |
| 2026-04-17 |
31 |
41.68 |
123.30% |
15.10 |
Weekly Range
| Confidence |
Low |
High |
Width |
| 68% |
34.03 |
50.31 |
16.28 |
| 80% |
31.74 |
52.60 |
20.86 |
| 90% |
28.78 |
55.56 |
26.77 |
| 95% |
26.22 |
58.12 |
31.90 |
Structure & Probabilities
| Support |
Resistance |
Gamma Flip |
Max Pain |
P>Res |
P<Sup |
| 40.00 |
50.00 |
35.39 |
36.00 |
15.4% |
43.4% |
Flow & Skew
| Call Vol |
Put Vol |
Vol P/C |
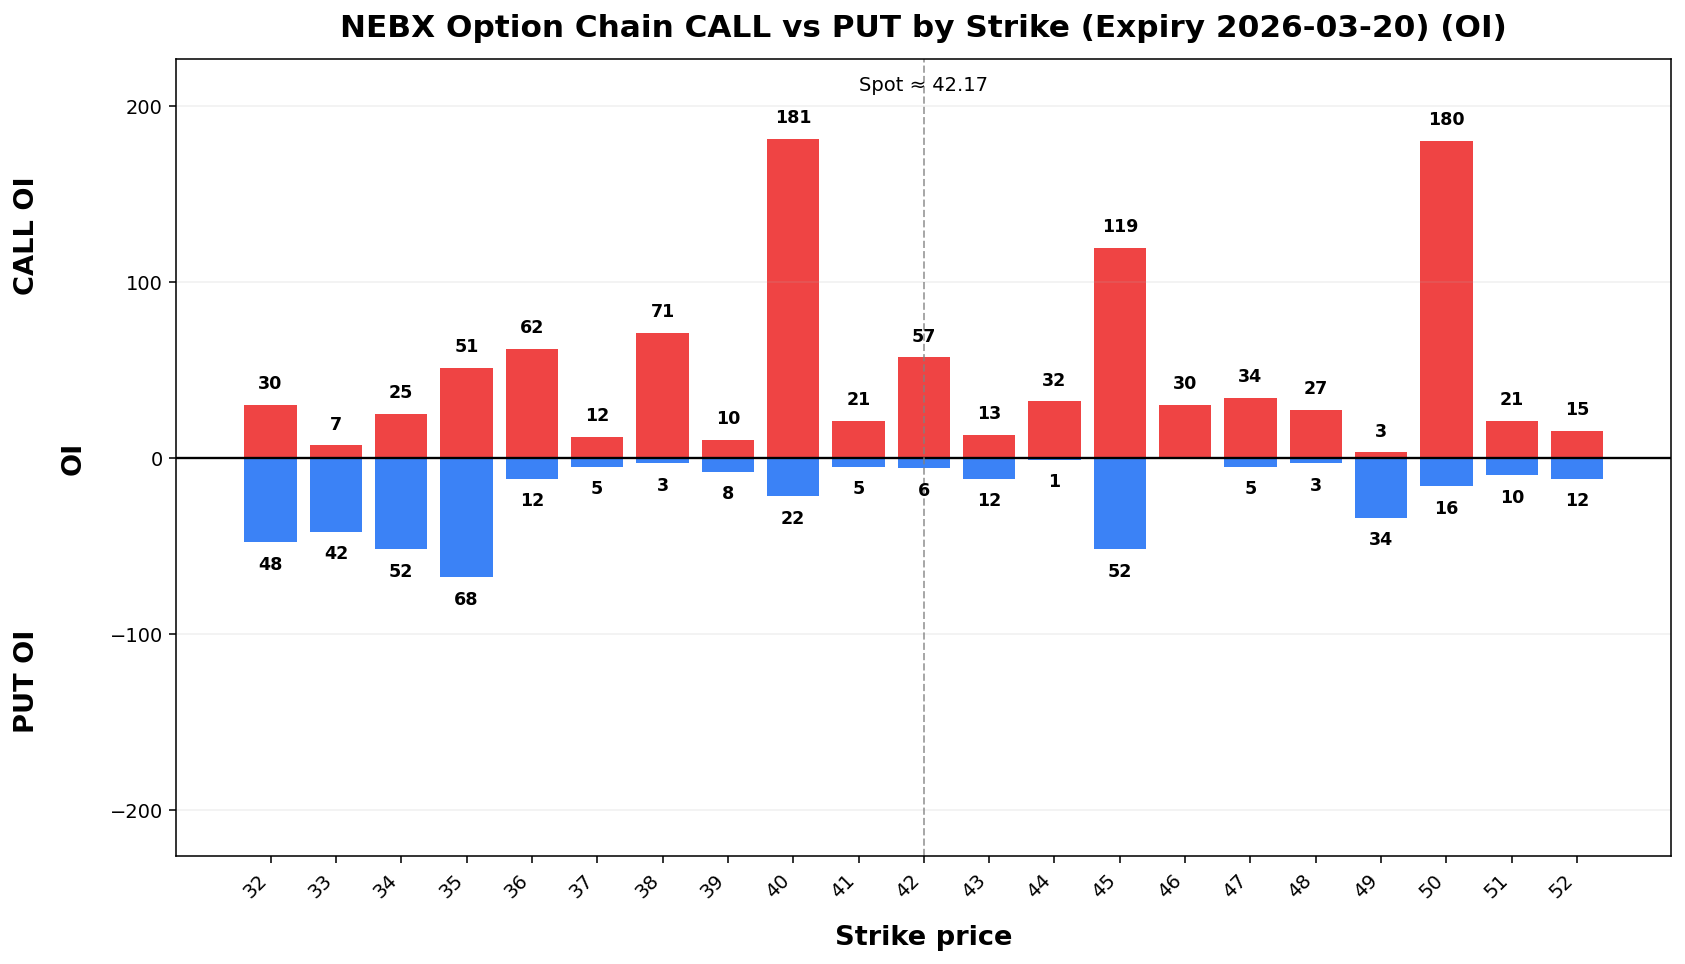
Call OI |
Put OI |
OI P/C |
Skew |
Skew Bias |
| 608 |
385 |
0.63 |
4,118 |
2,445 |
0.59 |
50.00 vol pts |
PUT_SKEW |
Tail Risk
| Q10 |
Q50 |
Q90 |
Down Tail |
Up Tail |
Down/Up |
| 31.37 |
42.23 |
47.34 |
10.80 |
5.17 |
2.09 |
Daily Technicals
| EMA20 |
EMA50 |
VWAP20 |
BB Lower |
BB Mid |
BB Upper |
BB Width |
Vol Ratio |
Path |
| 36.13 |
35.65 |
36.68 |
21.78 |
35.26 |
48.73 |
76.44% |
2.17 |
UP trend (expanding) |
Day Plan
- 40.00-50.00 range: fade extremes
- > 50.00: chase only if hold + vol
- < 40.00: risk expand; reduce size
- Regime: TRANSITION
- Tech: UP trend (expanding)
Swing Plan
- Accumulate: 40.00-40.00
- Trim: 50.00-50.00
- Add: close > 50.00
- Cut: close < 40.00
- Best for: transition regime
Raw Text Summary
📌 NEBX @ 42.17 (2026-03-18 08:43 AM MYT)

• Current price is **42.17**. Key support is around **40.00**, and resistance is around **50.00**.
• For the next week, the model’s **68% expected range** is roughly **34.03 to 50.31**.
• A wider **90% range** is about **28.78 to 55.56**.
• Dealer positioning looks **LONG gamma**, so the market behavior is classified as **TRANSITION**.
• The estimated **gamma flip** is near **35.39**. Crossing and holding beyond this area can change the trading behavior.
• Approximate breakout odds: **above resistance 15.4%**, **below support 43.4%** by the target horizon.
• Options skew is tilted toward **puts**, which suggests traders are paying more for downside protection.
• Near-term implied volatility is higher than the next expiry (**IV1 161.73% vs IV2 123.30%**), which suggests **near-term event stress / backwardation**.
• Recent volume is **2.17x** the 20-day average, which supports stronger continuation or breakout follow-through.
• On the daily chart, the stock currently looks like **UP trend (expanding)**.
• The implied distribution shows **heavier downside tail risk** than upside tail potential.
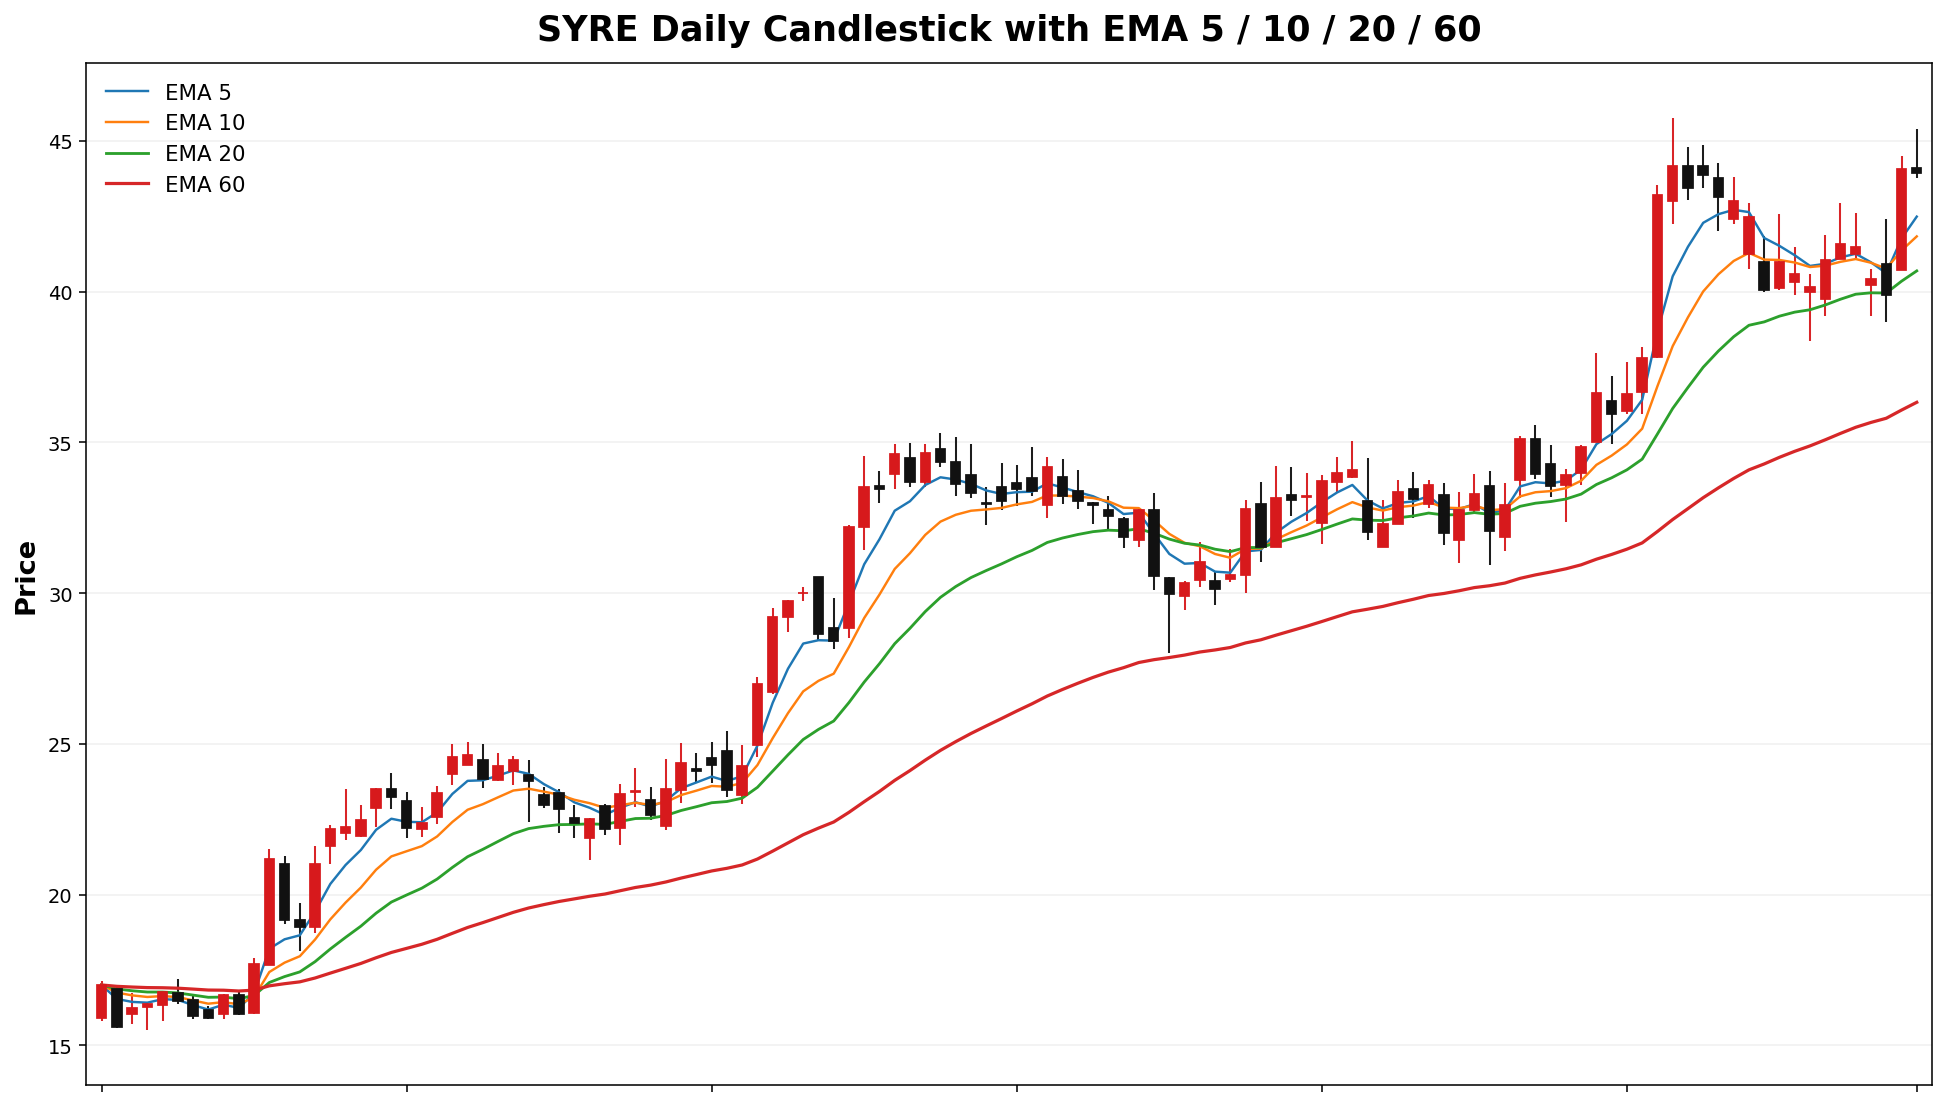
AXTISYRE
Spot: 48.3943.95
Report Time: 2026-03-1718 03:08:43 PMAM MYT
Regime: TRANSITION
Dealer Gamma: NEUTRALLONG
Term Structure
| Expiry |
DTE |
Forward |
ATM IV |
ATM Straddle |
| 2026-03-20 |
43 |
48.6038.59 |
159.75%177.91% |
7.586.85 |
| 2026-04-17 |
3231 |
48.8944.63 |
121.08%109.30% |
17.2113.95 |
Weekly Range
| Confidence |
Low |
High |
Width |
| 68% |
38.9435.56 |
57.8452.34 |
18.9016.78 |
| 80% |
36.2833.20 |
60.5054.70 |
24.2221.50 |
| 90% |
32.8530.15 |
63.9357.75 |
31.0927.59 |
| 95% |
29.8727.51 |
66.9160.39 |
37.0432.88 |
Structure & Probabilities
| Support |
Resistance |
Gamma Flip |
Max Pain |
P>Res |
P<Sup |
38.9440.00 |
57.45.00 |
34.13 |
40.00 |
44.2% |
26.2% |
Flow & Skew
| Call Vol |
Put Vol |
Vol P/C |
Call OI |
Put OI |
OI P/C |
Skew |
Skew Bias |
| 21 |
1,285 |
61.19 |
664 |
933 |
1.41 |
-19.34 vol pts |
CALL_SKEW |
Tail Risk
| Q10 |
Q50 |
Q90 |
Down Tail |
Up Tail |
Down/Up |
| 15.83 |
19.16 |
23.84 |
24.28.12 |
0.00 |
NA |
Daily Technicals
| EMA20 |
EMA50 |
VWAP20 |
BB Lower |
BB Mid |
BB Upper |
BB Width |
Vol Ratio |
Path |
| 40.69 |
37.31 |
41.55 |
37.38 |
41.60 |
45.82 |
20.28% |
0.99 |
UP trend (expanding) |
Day Plan
- 40.00-45.00 range: fade extremes
- > 45.00: chase only if hold + vol
- < 40.00: risk expand; reduce size
- Regime: TRANSITION
- Tech: UP trend (expanding)
Swing Plan
- Accumulate: 40.00-40.00
- Trim: 45.00-45.00
- Add: close > 45.00
- Cut: close < 40.00
- Best for: transition regime
Raw Text Summary
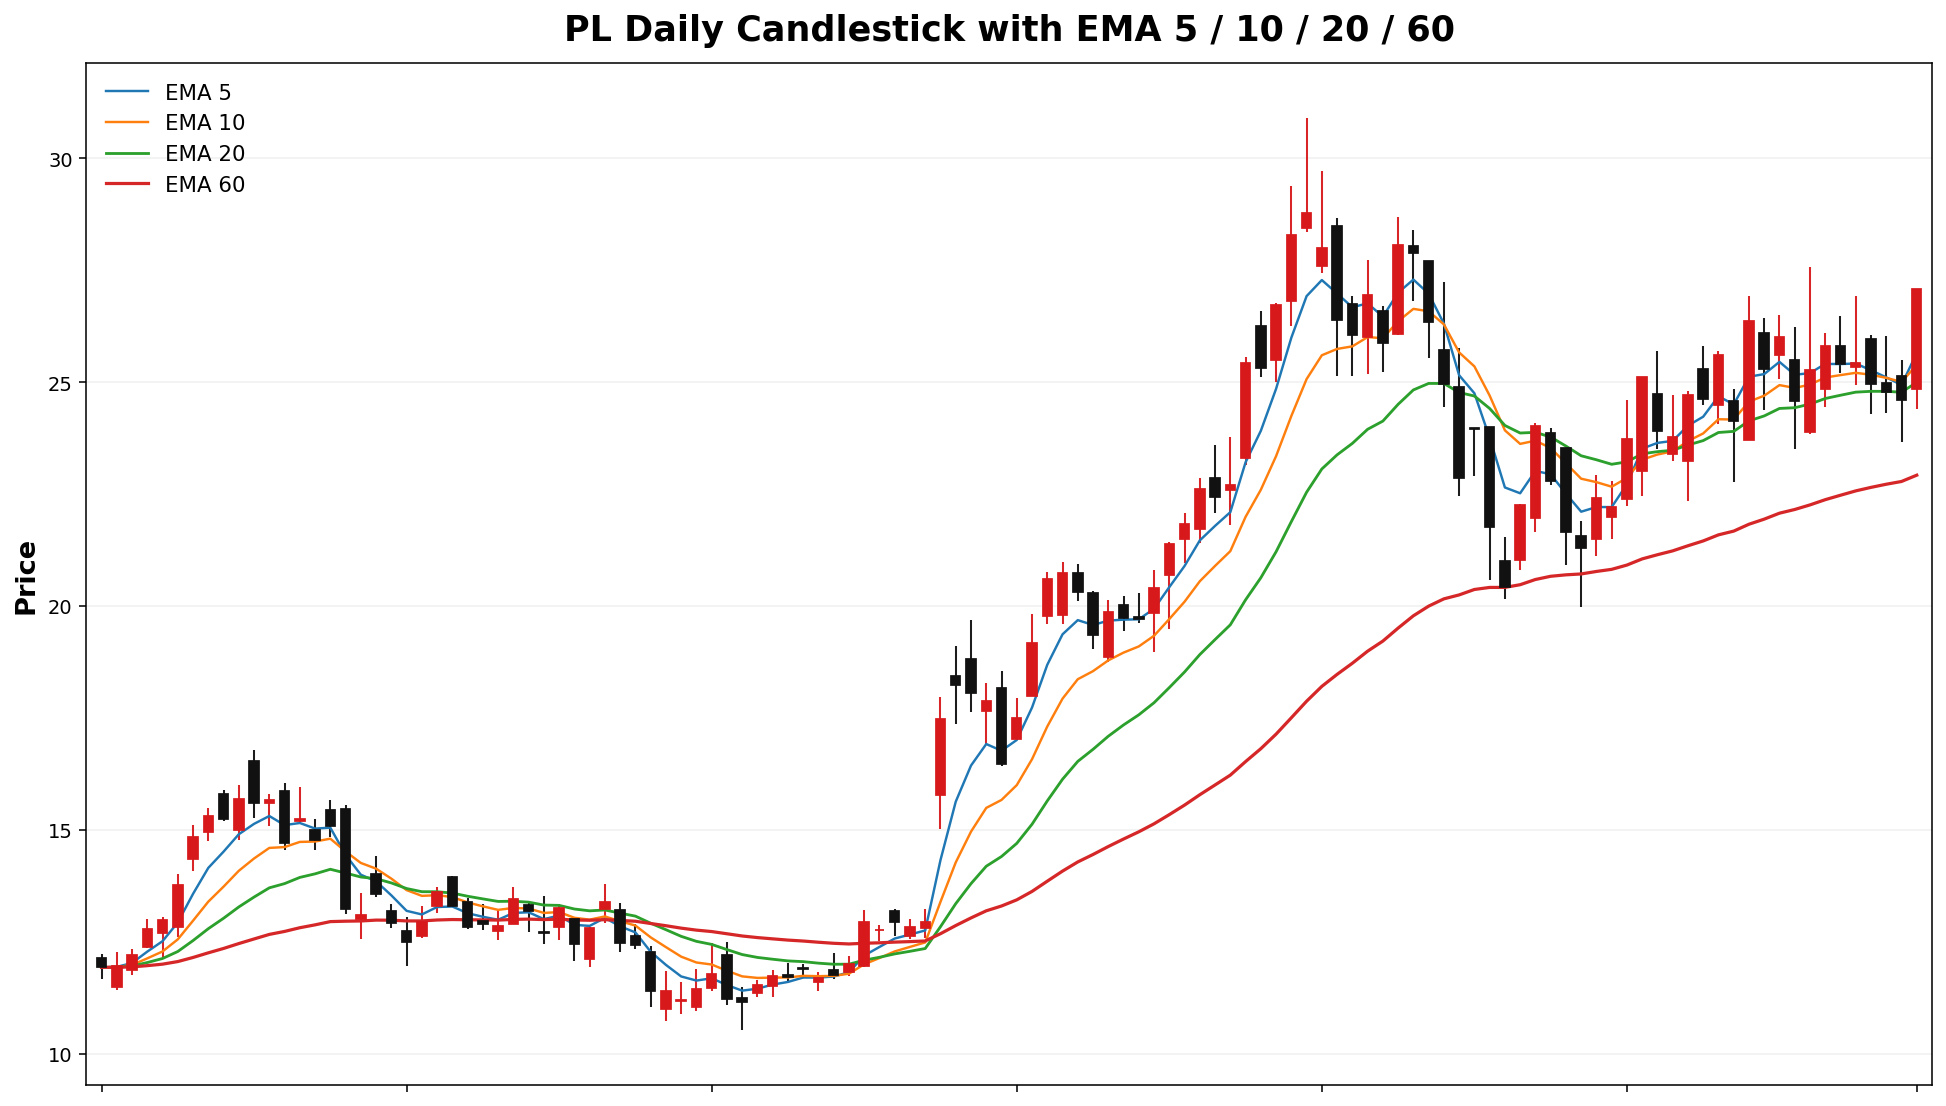
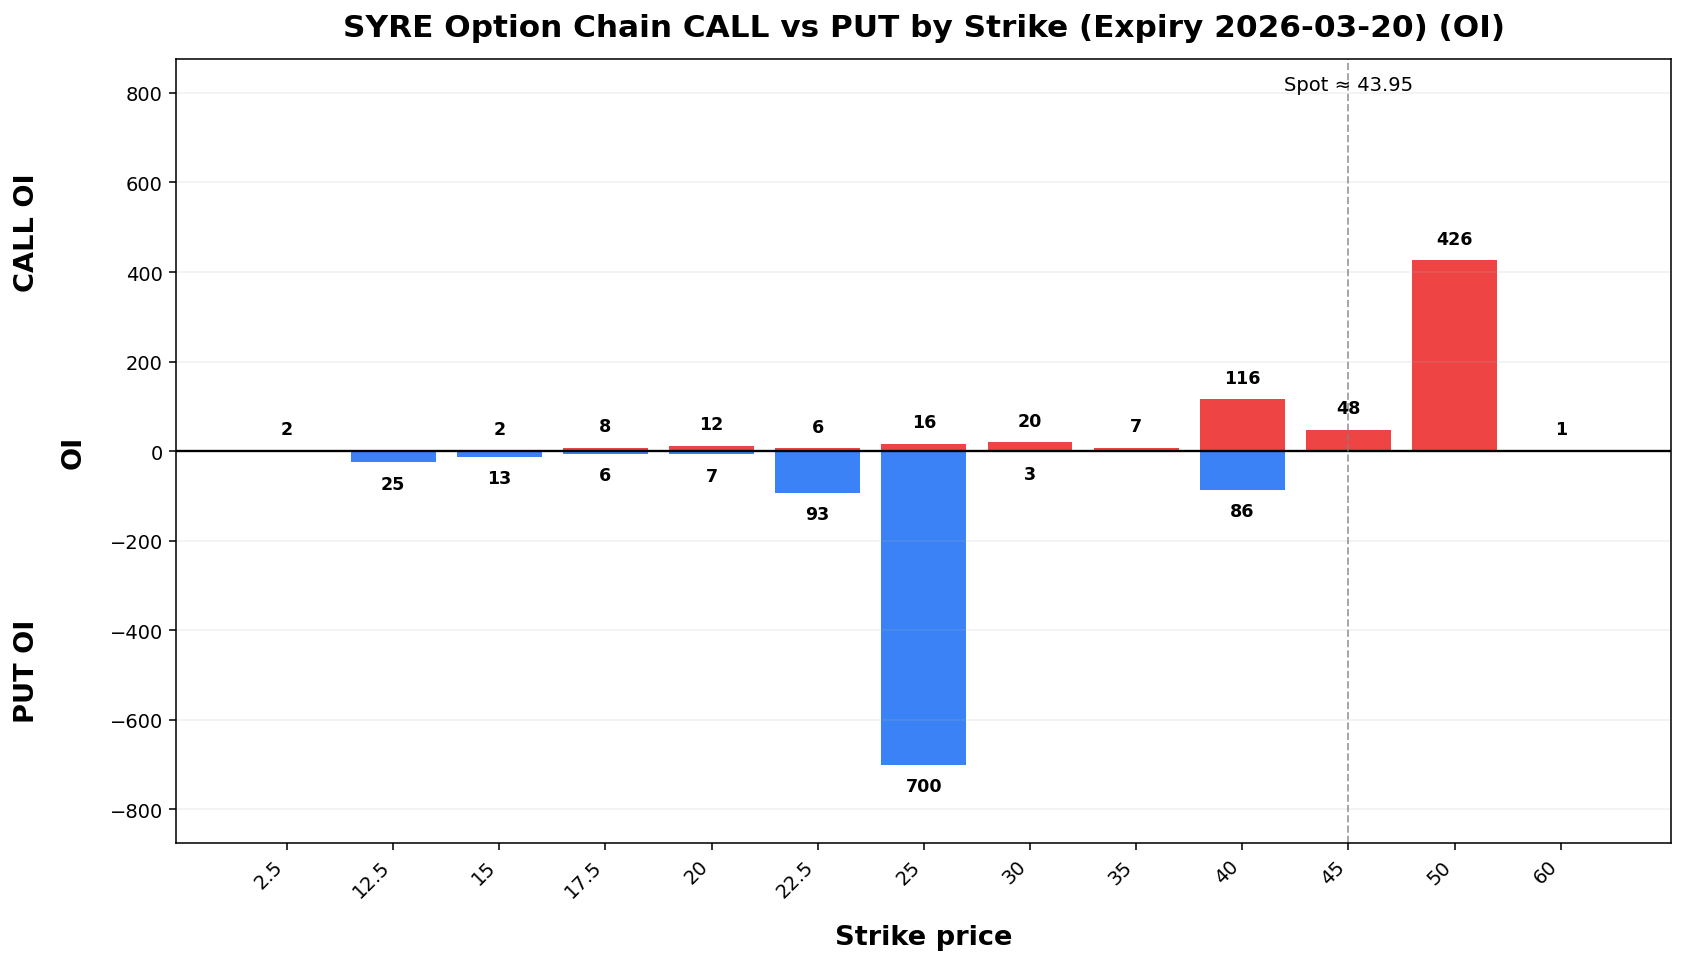
📌 SYRE @ 43.95 (2026-03-18 08:43 AM MYT)

• Current price is **43.95**. Key support is around **40.00**, and resistance is around **45.00**.
• For the next week, the model’s **68% expected range** is roughly **35.56 to 52.34**.
• A wider **90% range** is about **30.15 to 57.75**.
• Dealer positioning looks **LONG gamma**, so the market behavior is classified as **TRANSITION**.
• The estimated **gamma flip** is near **34.13**. Crossing and holding beyond this area can change the trading behavior.
• Approximate breakout odds: **above resistance 44.2%**, **below support 26.2%** by the target horizon.
• Options skew is tilted toward **calls**, which suggests upside speculation is relatively stronger.
• Near-term implied volatility is higher than the next expiry (**IV1 177.91% vs IV2 109.30%**), which suggests **near-term event stress / backwardation**.
• On the daily chart, the stock currently looks like **UP trend (expanding)**.
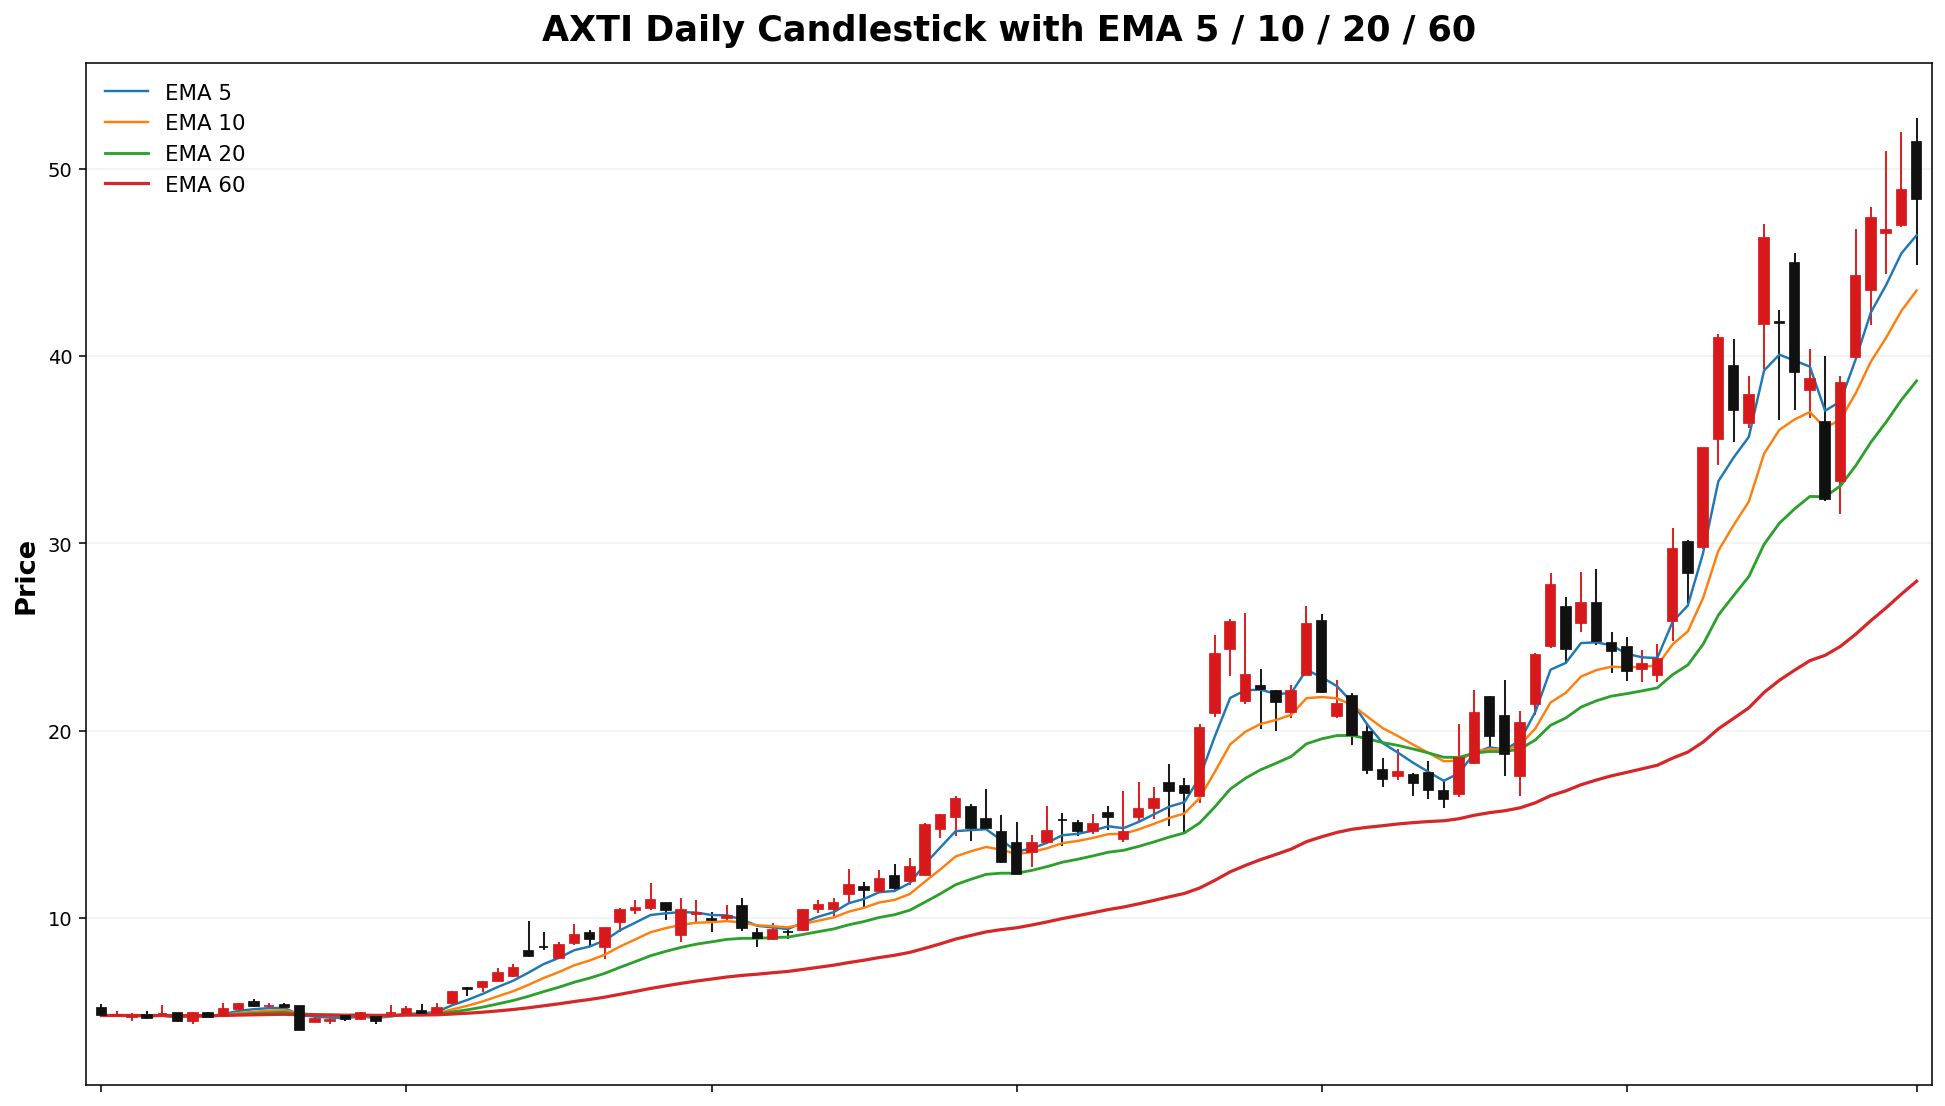
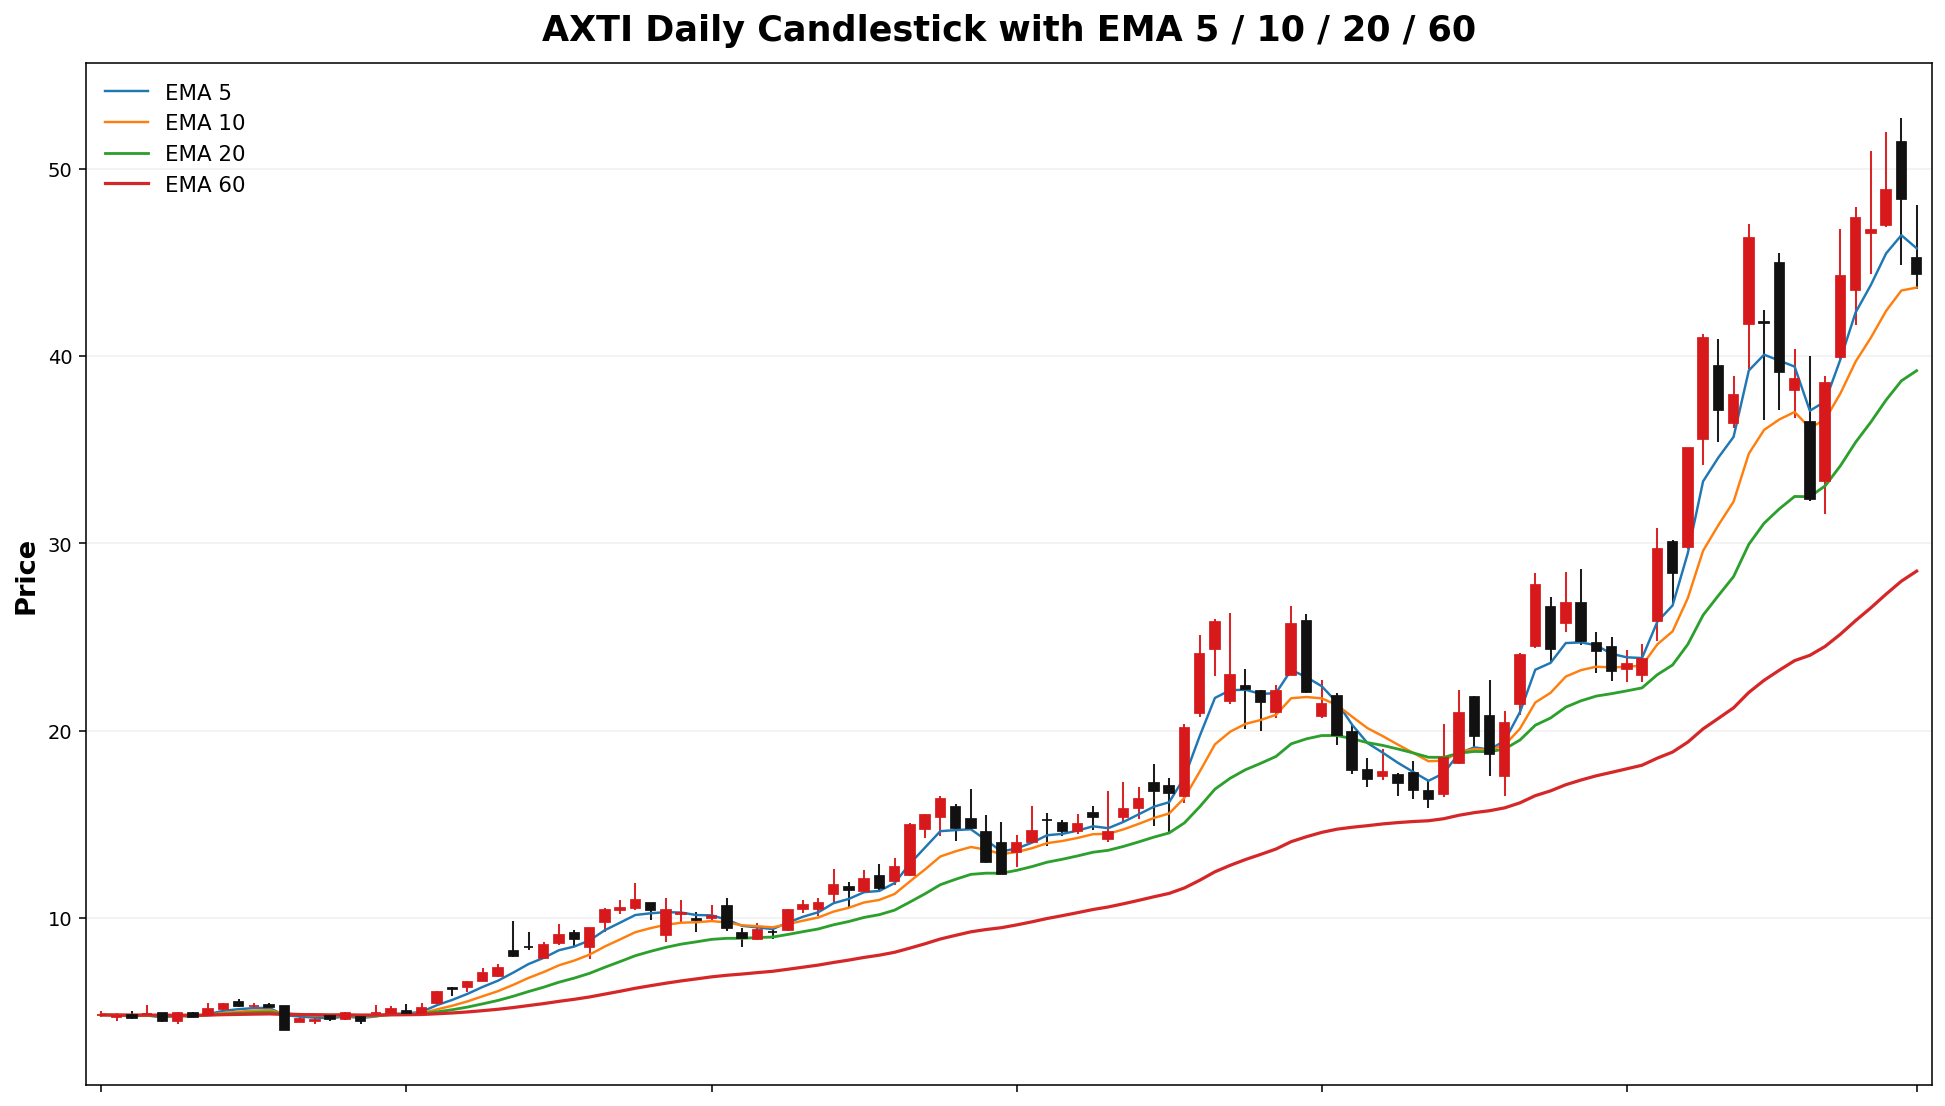
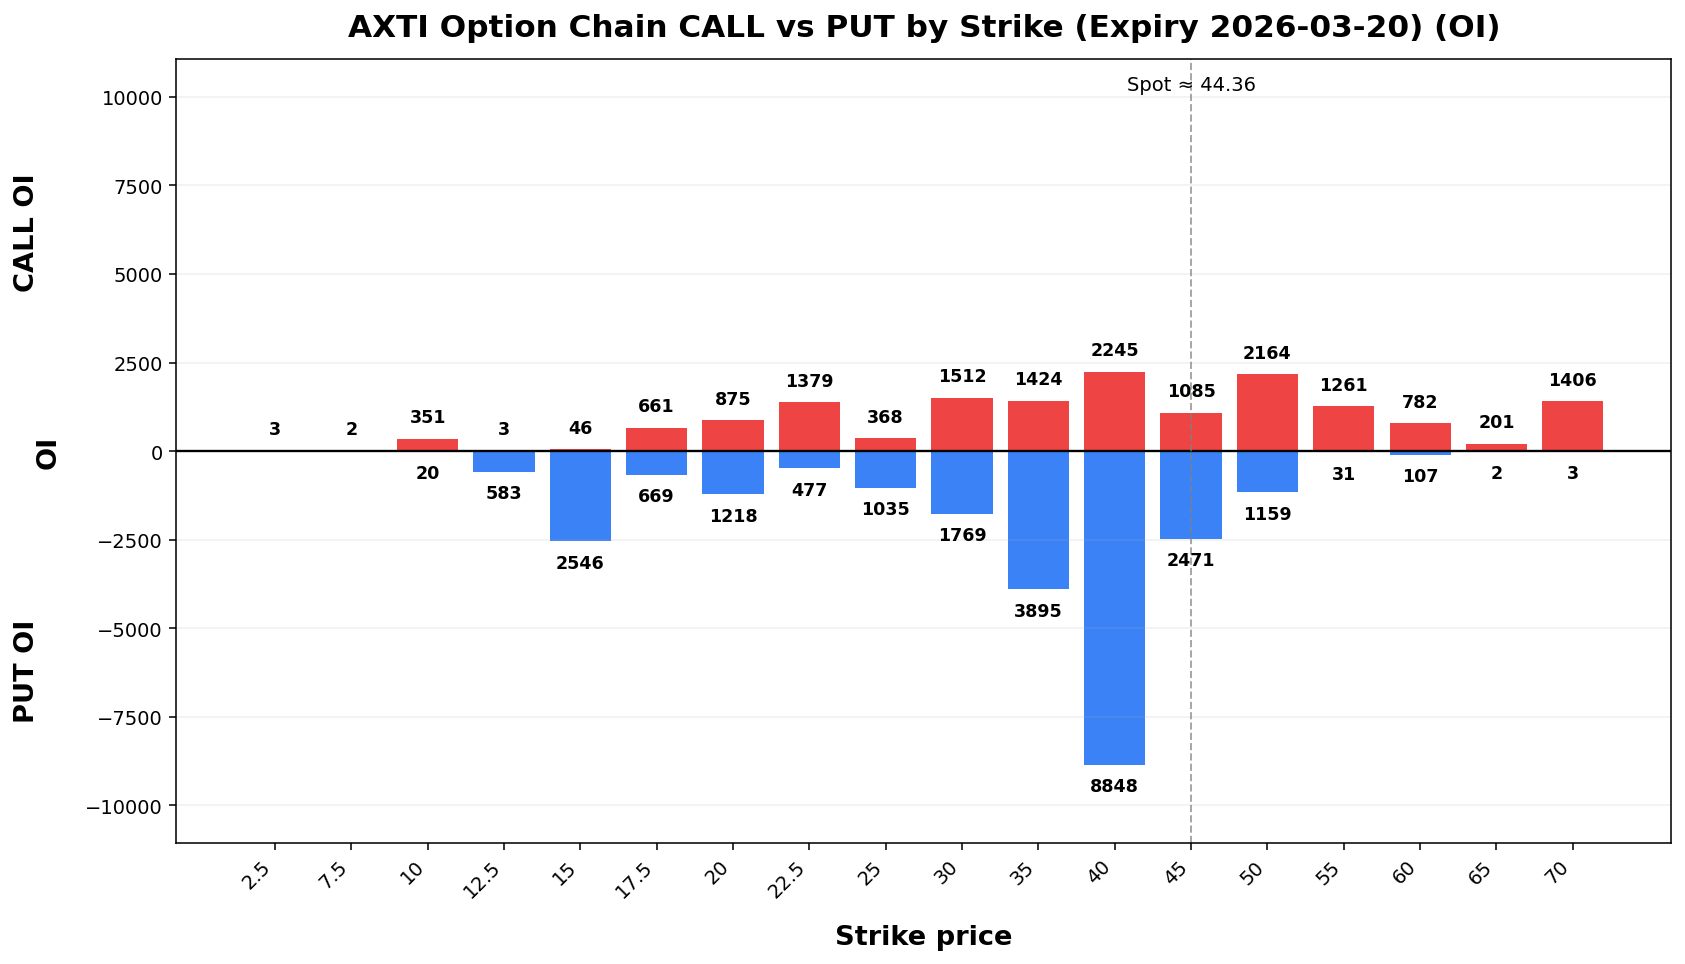
AXTI
Spot: 44.36
Report Time: 2026-03-18 08:43 AM MYT
Regime: TREND
Dealer Gamma: SHORT
Term Structure
| Expiry |
DTE |
Forward |
ATM IV |
ATM Straddle |
| 2026-03-20 |
3 |
44.39 |
137.02% |
5.32 |
| 2026-04-17 |
31 |
44.72 |
113.33% |
14.60 |
Weekly Range
| Confidence |
Low |
High |
Width |
| 68% |
36.76 |
51.96 |
15.19 |
2.80% |
34.63 |
54.09 |
19.47 |
| 90% |
31.87 |
56.85 |
24.99 |
| 95% |
29.47 |
59.25 |
29.77 |
Structure & Probabilities
| Support |
Resistance |
Gamma Flip |
Max Pain |
P>Res |
P<Sup |
| 40.00 |
45.00 |
50.50 |
16.7%40.00 |
16.7%62.0% |
31.4% |
Flow & Skew
| Call Vol |
Put Vol |
Vol P/C |
Call OI |
Put OI |
OI P/C |
Skew |
Skew Bias |
3,647421 |
3,0382,344 |
0.8369 |
015,768 |
024,833 |
NA1.57 |
0.00-18.95 vol pts |
FLATCALL_SKEW |
Tail Risk
| Q10 |
Q50 |
Q90 |
Down Tail |
Up Tail |
Down/Up |
5.6635.36 |
8.3143.59 |
55.8254.04 |
42.739.00 |
7.439.68 |
5.750.93 |
Daily Technicals
| EMA20 |
EMA50 |
VWAP20 |
BB Lower |
BB Mid |
BB Upper |
BB Width |
Vol Ratio |
Path |
38.6839.22 |
29.9030.47 |
39.1785 |
20.7523.00 |
37.6238.67 |
54.4935 |
89.70%81.08% |
1.1601 |
UP trend (expanding) |
Day Plan
38.94-57.8440.00-45.00 range: fade extremes- >
57.84:45.00: chase only if hold + vol
- <
38.94:40.00: risk expand; reduce size
- Regime: TREND
- Tech: UP trend (expanding)
Swing Plan
- Accumulate: 40.00-40.00
- Trim: 45.00-45.00
- Add: close > 45.00
- Cut: close < 40.00
- Best for: trend regime
- Bias: upside breakout more favored
Raw Text Summary
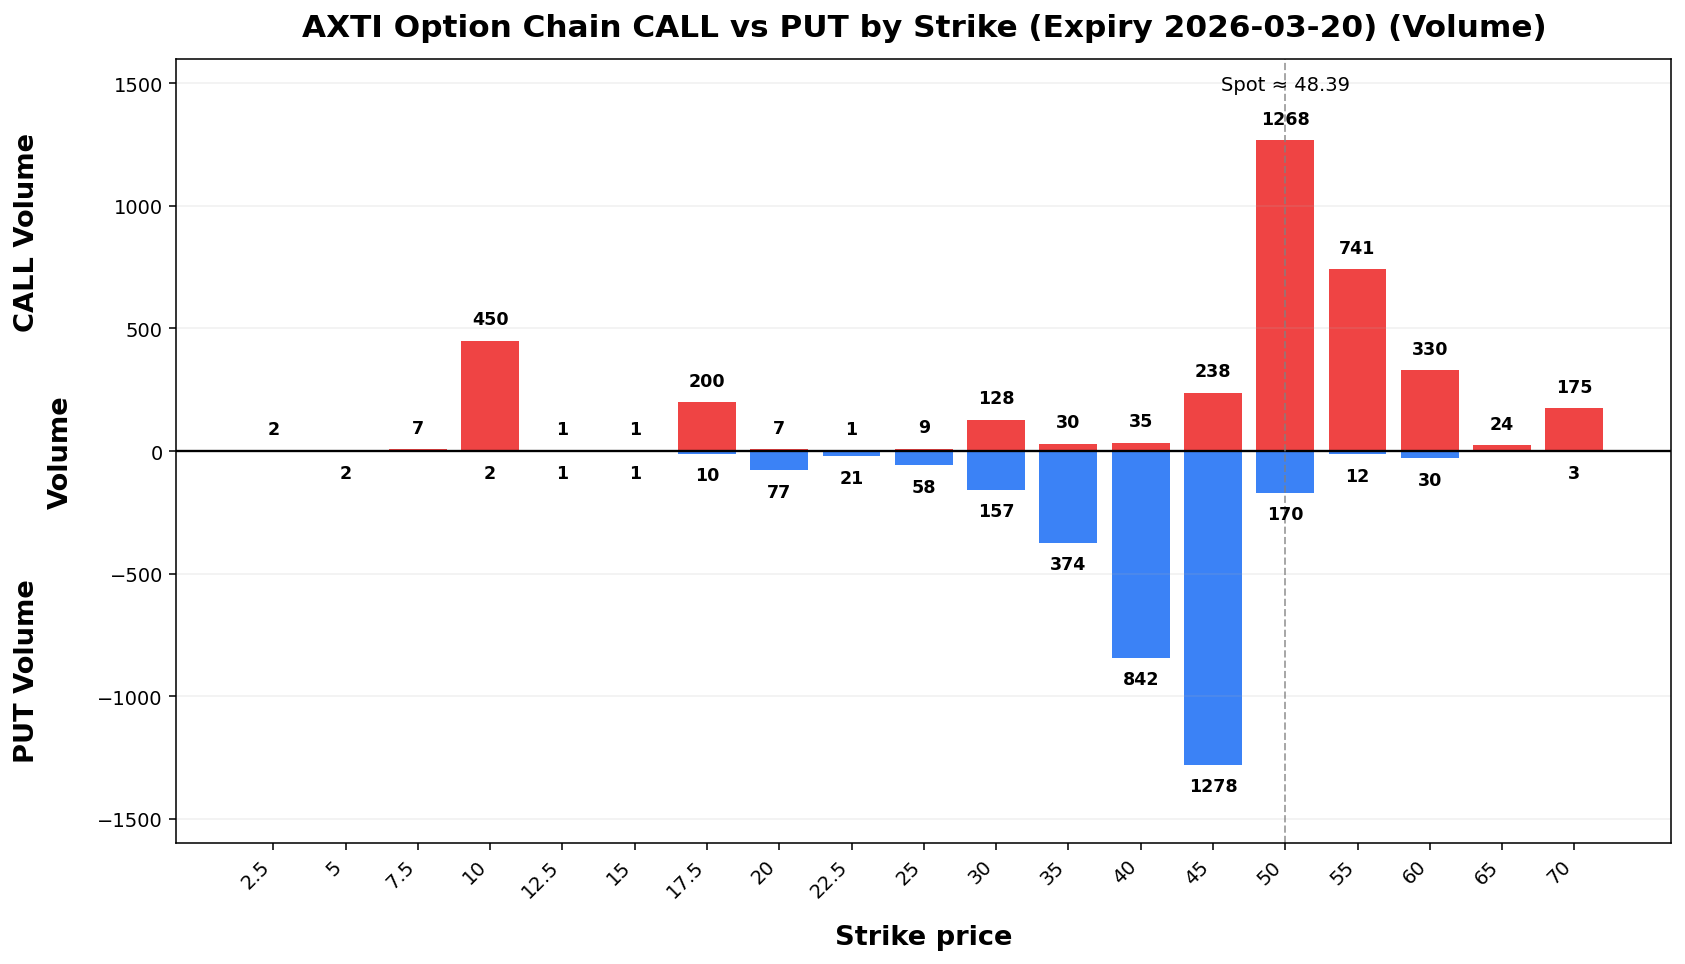
📌 AXTI @ 44.36 (2026-03-18 08:43 AM MYT)

• Current price is **44.36**. Key support is around **40.00**, and resistance is around **45.00**.
• For the next week, the model’s **68% expected range** is roughly **36.76 to 51.96**.
• A wider **90% range** is about **31.87 to 56.85**.
• Dealer positioning looks **SHORT gamma**, so the market behavior is classified as **TREND**.
• The estimated **gamma flip** is near **50.50**. Crossing and holding beyond this area can change the trading behavior.
• Approximate breakout odds: **above resistance 62.0%**, **below support 31.4%** by the target horizon.
• Options skew is tilted toward **calls**, which suggests upside speculation is relatively stronger.
• Near-term implied volatility is higher than the next expiry (**IV1 137.02% vs IV2 113.33%**), which suggests **near-term event stress / backwardation**.
• On the daily chart, the stock currently looks like **UP trend (expanding)**.
• The implied distribution is **fairly balanced** between upside and downside tails.
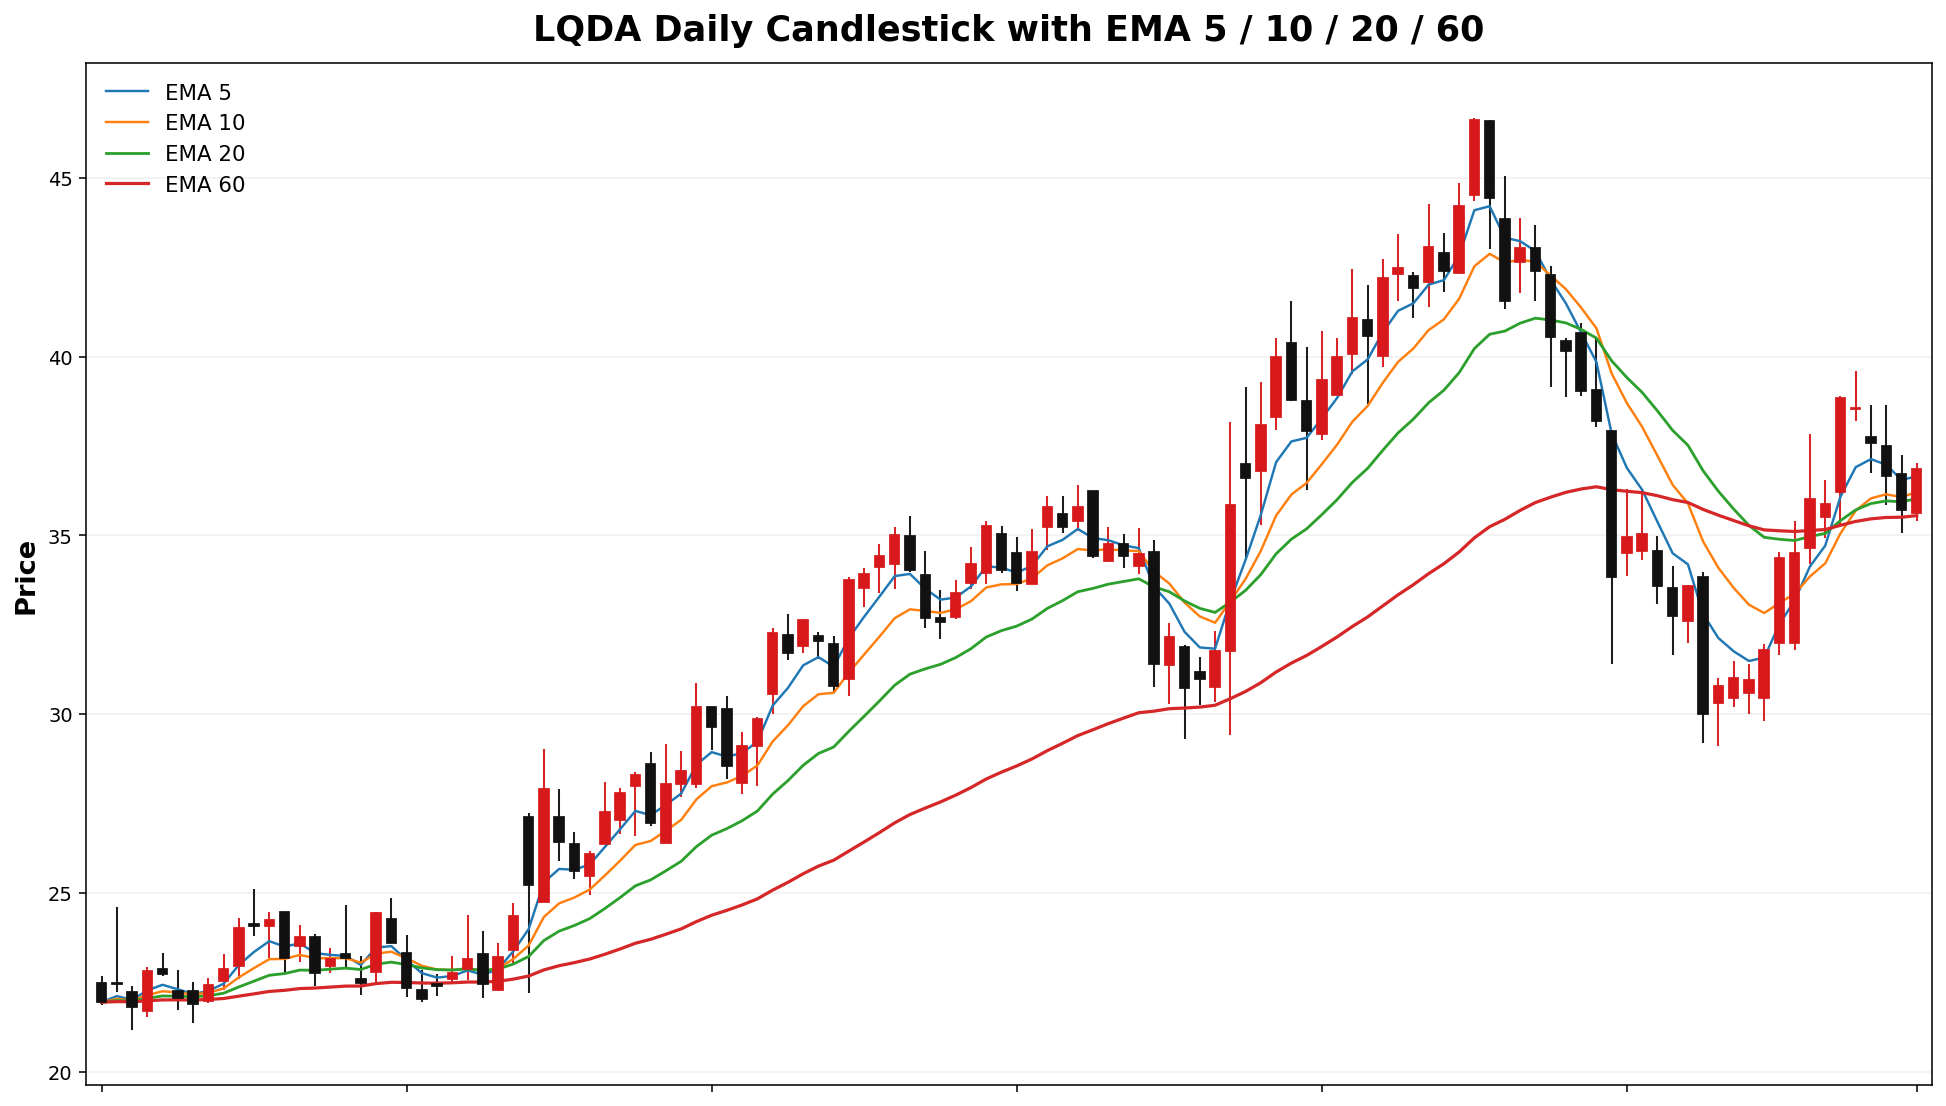
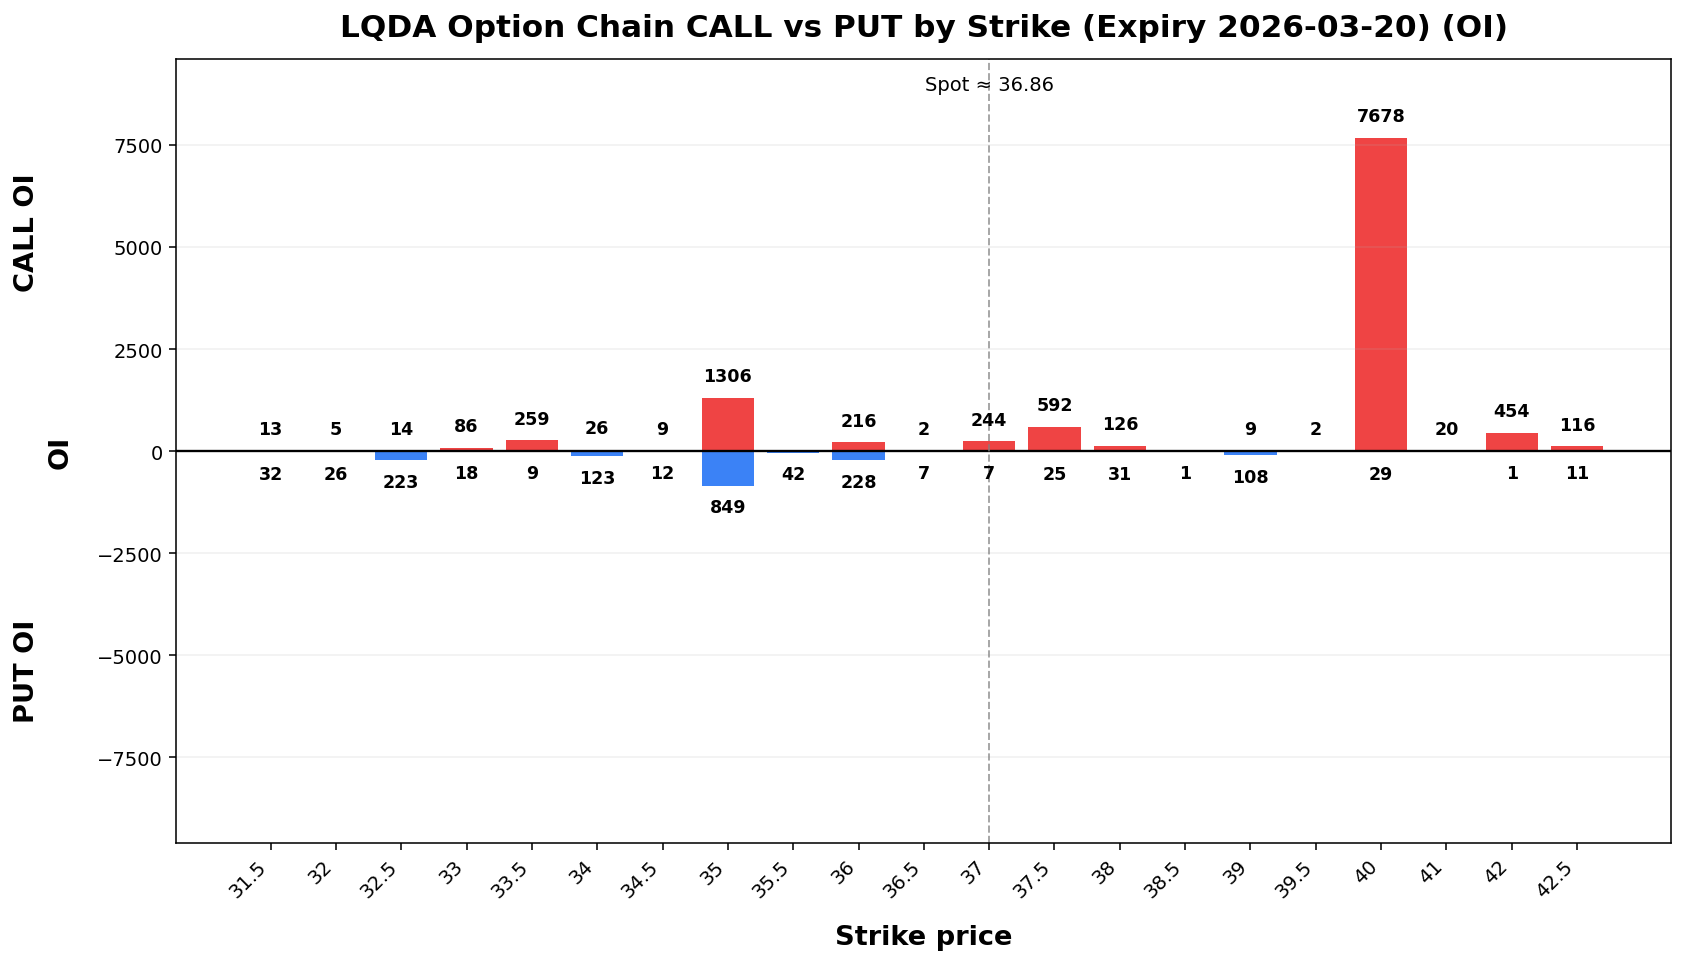
LQDA
Spot: 36.86
Report Time: 2026-03-18 08:43 AM MYT
Regime: TRANSITION
Dealer Gamma: LONG
Term Structure
| Expiry |
DTE |
Forward |
ATM IV |
ATM Straddle |
| 2026-03-20 |
3 |
36.23 |
154.84% |
5.00 |
| 2026-03-27 |
10 |
36.61 |
91.91% |
5.55 |
Weekly Range
| Confidence |
Low |
High |
Width |
| 68% |
31.50 |
42.22 |
10.71 |
| 80% |
30.00 |
43.72 |
13.73 |
| 90% |
28.05 |
45.67 |
17.62 |
| 95% |
26.36 |
47.36 |
20.99 |
Structure & Probabilities
| Support |
Resistance |
Gamma Flip |
Max Pain |
P>Res |
P<Sup |
| 35.00 |
40.00 |
32.54 |
35.00 |
25.5% |
27.8% |
Flow & Skew
| Call Vol |
Put Vol |
Vol P/C |
Call OI |
Put OI |
OI P/C |
Skew |
Skew Bias |
| 2,858 |
3,637 |
1.27 |
15,866 |
16,695 |
1.05 |
-3.32 vol pts |
CALL_SKEW |
Tail Risk
| Q10 |
Q50 |
Q90 |
Down Tail |
Up Tail |
Down/Up |
| 28.10 |
36.56 |
41.98 |
8.76 |
5.12 |
1.71 |
Daily Technicals
| EMA20 |
EMA50 |
VWAP20 |
BB Lower |
BB Mid |
BB Upper |
BB Width |
Vol Ratio |
Path |
| 36.03 |
35.93 |
33.96 |
29.20 |
34.47 |
39.75 |
30.60% |
0.58 |
UP trend (expanding) |
Day Plan
- 35.00-40.00 range: fade extremes
- > 40.00: chase only if hold + vol
- < 35.00: risk expand; reduce size
- Regime: TRANSITION
- Tech: UP trend (expanding)
Swing Plan
- Accumulate:
38.94-38.9435.00-35.00
- Trim:
57.84-57.8440.00-40.00
- Add: close >
57.8440.00
- Cut: close <
38.9435.00
- Best for: transition regime
Raw Text Summary
📌 AXTILQDA @ 48.3936.86 (2026-03-1718 03:08:43 PMAM MYT)

• Current price is **48.39*36.86**. Key support is around **38.94*35.00**, and resistance is around **57.84*40.00**.
• For the next week, the model’s **68% expected range** is roughly **38.9431.50 to 57.84*42.22**.
• A wider **90% range** is about **32.8528.05 to 63.93*45.67**.
• Dealer positioning looks **NEUTRALLONG gamma**, so the market behavior is classified as **TRANSITION**.
• The estimated **gamma flip** is near **24.19*32.54**. Crossing and holding beyond this area can change the trading behavior.
• Approximate breakout odds: **above resistance 16.7%25.5%**, **below support 16.7%27.8%** by the target horizon.
• Options skew is fairlytilted balanced,toward so**calls**, therewhich suggests upside speculation is **norelatively strong directional bias** from skew alone.stronger.
• Near-term implied volatility is higher than the next expiry (**IV1 159.75%154.84% vs IV2 121.08%91.91%**), which suggests **near-term event stress / backwardation**.
• Recent volume is only **0.58x** the 20-day average, so breakouts may be less reliable unless volume improves.
• On the daily chart, the stock currently looks like **UP trend (expanding)**.
• The implied distribution shows **heavier downside tail risk** than upside tail potential.