Analysis Report
Updated: 2026-03-18 08:43:2515:42:55 MYT
Source File: combined-summary-20260318-084324.154255.md
Screening Source:
screen-report-20260318-Extracted Symbols:084247.154246.mdPL, CRCA, NEBX, SYRE, AXTI, LQDAAXTI
Topline Summary
| Symbol | Spot | Support | Resistance | Flip | Regime | P>Res | P<Sup | 68% Range | 90% Range | |
|---|---|---|---|---|---|---|---|---|---|---|
| AXTI | 44.36 | |||||||||
| TRANSITION | 36.68 - 52.04 | 31. |
PLAXTI
Spot: 27.0844.36
Report Time: 2026-03-18 08:03:42 AMPM MYT
Regime: PINTRANSITION
Dealer Gamma: LONGNEUTRAL
Term Structure
| Expiry | DTE | Forward | ATM IV | ATM Straddle |
|---|---|---|---|---|
| 2026-03-20 | 3 | 5. |
||
| 2026- |
Weekly Range
| Confidence | Low | High | Width |
|---|---|---|---|
| 68% | |||
| 80% | |||
| 90% | |||
| 95% |
Structure & Probabilities
| Support | Resistance | Gamma Flip | Max Pain | P>Res | P<Sup |
|---|---|---|---|---|---|
Flow & Skew
Tail Risk
Daily Technicals
Day Plan
26.00-28.00 range: fade extremes> 28.00: chase only if hold + vol< 26.00: risk expand; reduce sizeRegime: PINTech: UP bias
Swing Plan
Accumulate: 26.00-26.00Trim: 28.00-28.00Add: close > 28.00Cut: close < 26.00Best for: pin regime
Raw Text Summary
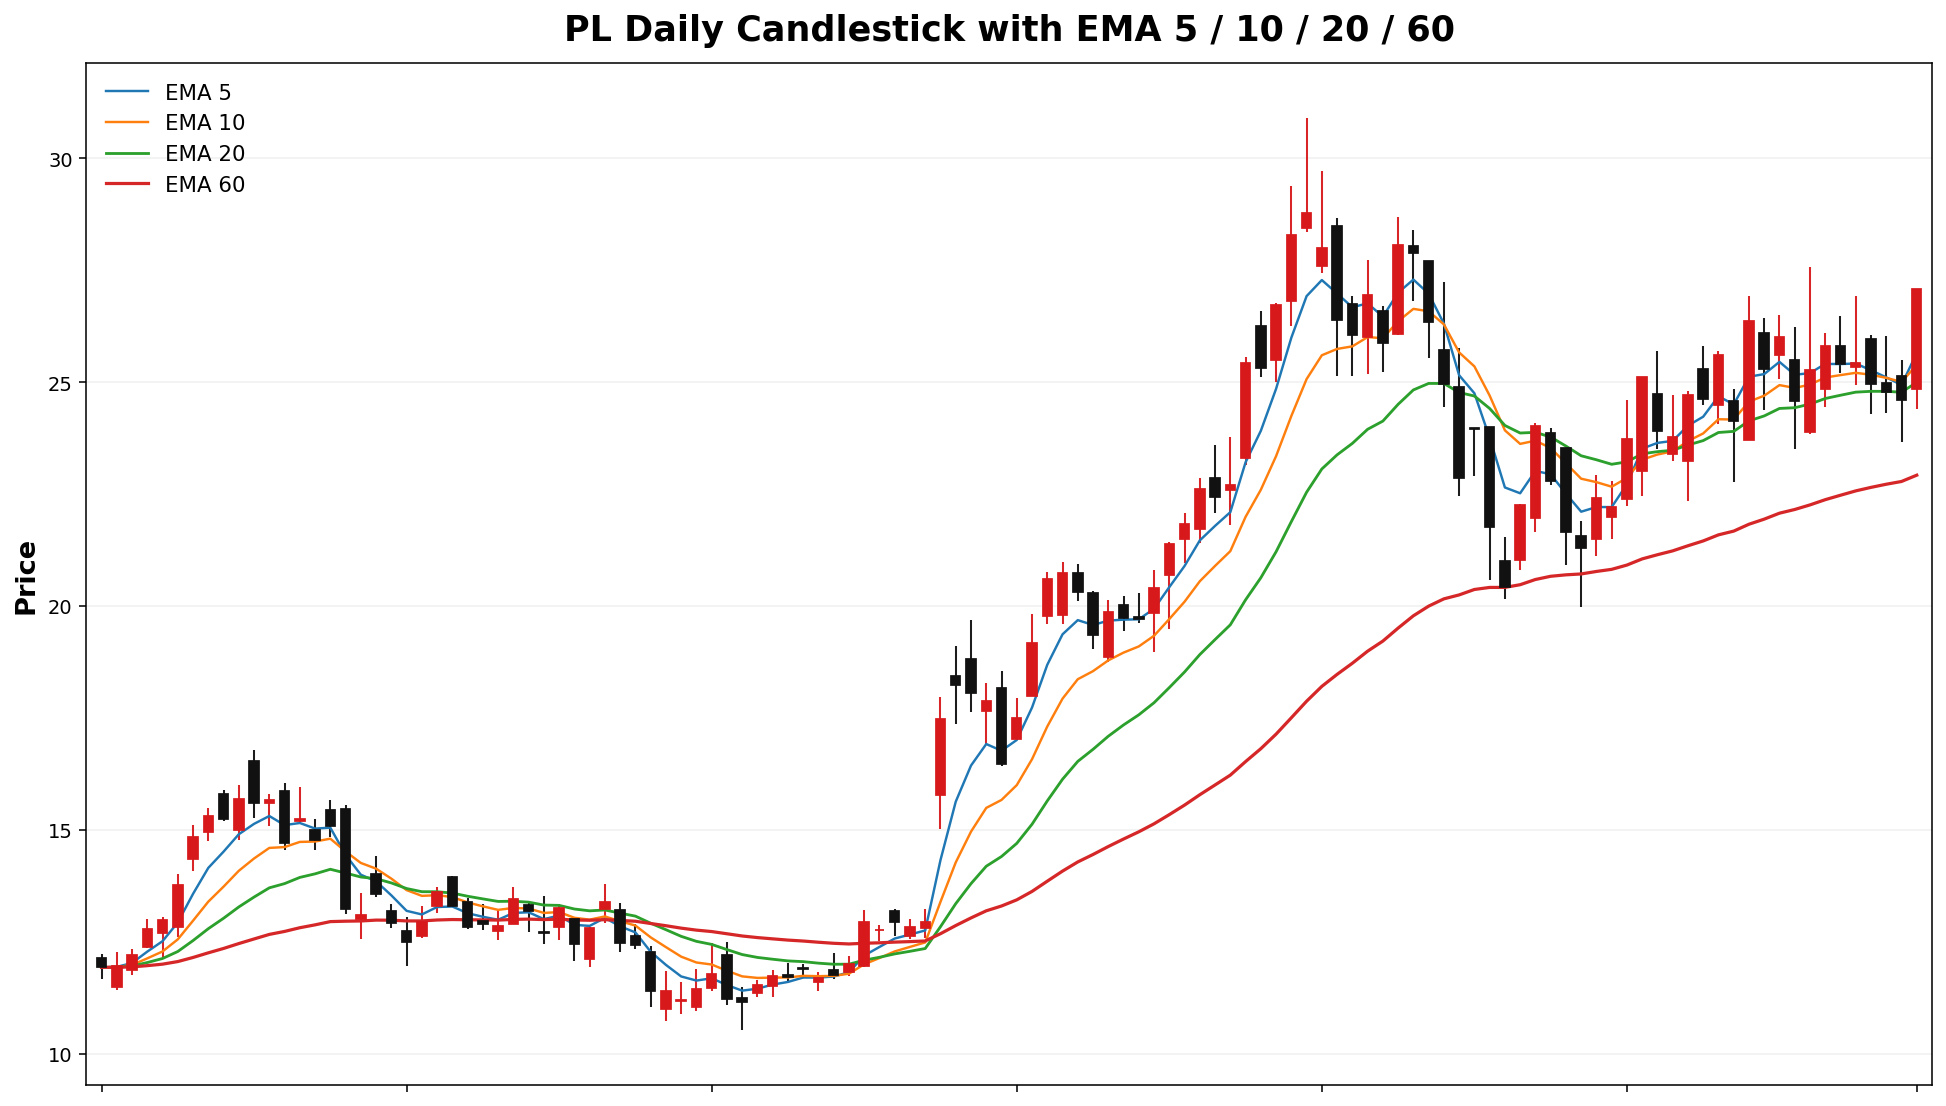
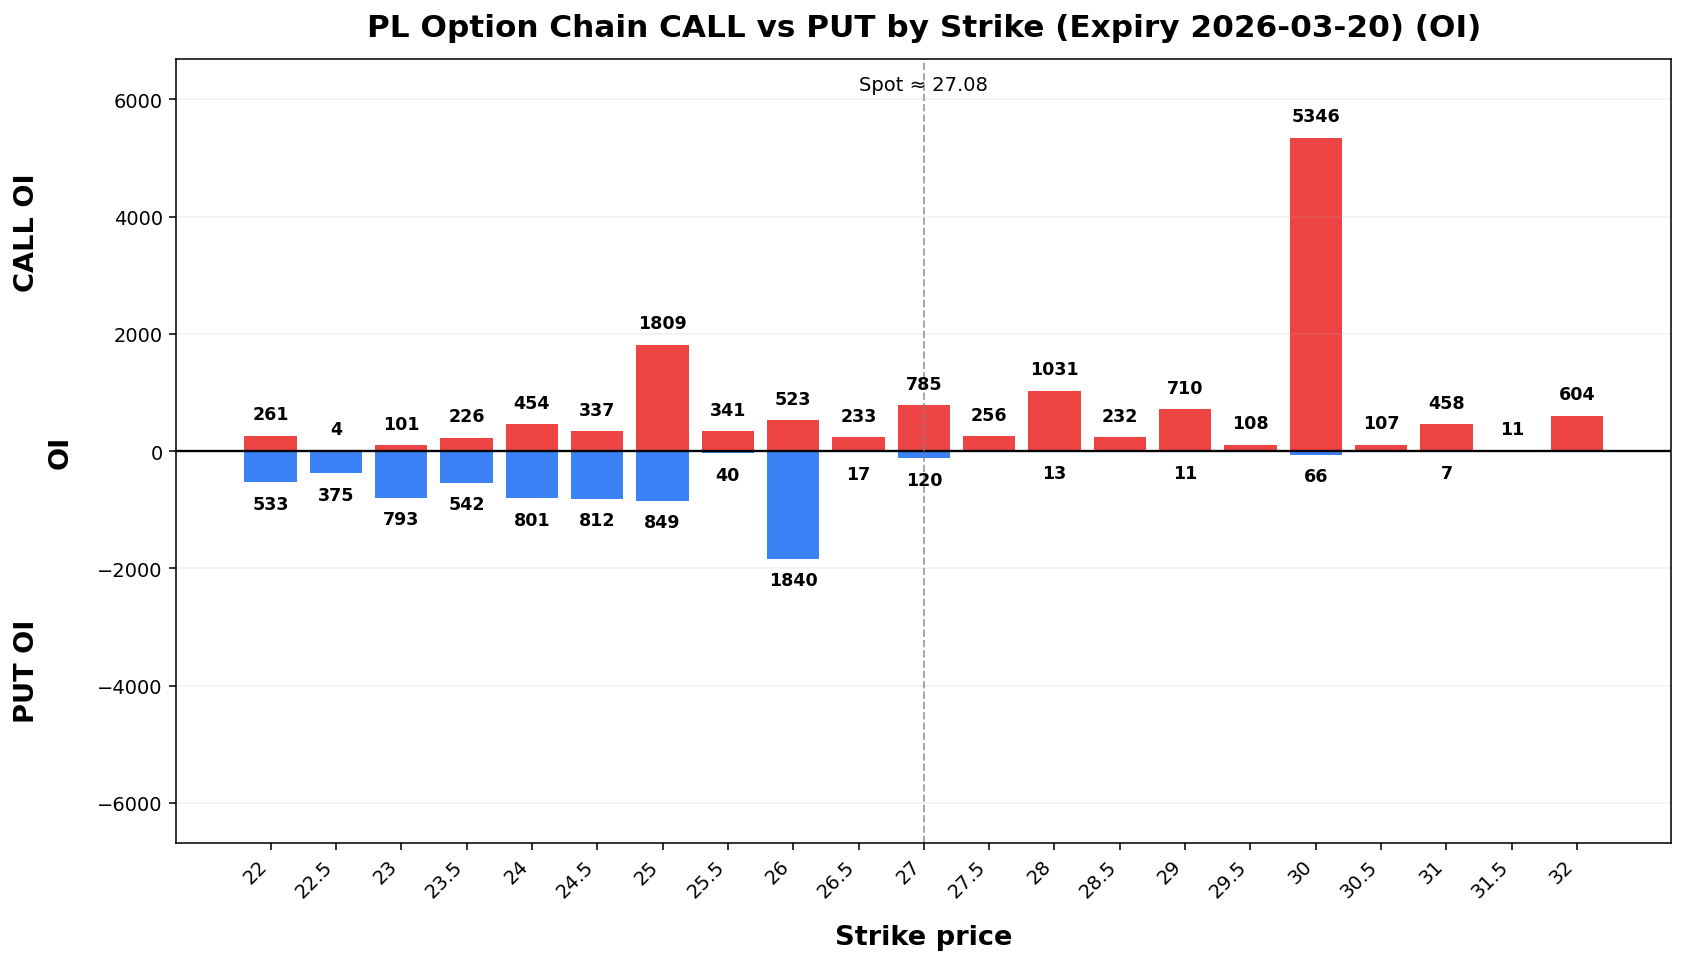
📌 PL @ 27.08 (2026-03-18 08:42 AM MYT)

• Current price is **27.08**. Key support is around **26.00**, and resistance is around **28.00**.
• For the next week, the model’s **68% expected range** is roughly **21.25 to 32.91**.
• A wider **90% range** is about **17.49 to 36.67**.
• Dealer positioning looks **LONG gamma**, so the market behavior is classified as **PIN**.
• The estimated **gamma flip** is near **22.92**. Crossing and holding beyond this area can change the trading behavior.
• Approximate breakout odds: **above resistance 35.9%**, **below support 41.9%** by the target horizon.
• Options skew is tilted toward **puts**, which suggests traders are paying more for downside protection.
• Near-term implied volatility is higher than the next expiry (**IV1 226.55% vs IV2 136.93%**), which suggests **near-term event stress / backwardation**.
• On the daily chart, the stock currently looks like **UP bias**.
• The implied distribution is **fairly balanced** between upside and downside tails.
CRCA
Spot: 86.84
Report Time: 2026-03-18 08:43 AM MYT
Regime: TRANSITION
Dealer Gamma: LONG
Term Structure
Weekly Range
Structure & Probabilities
Flow & Skew
Tail Risk
Daily Technicals
Day Plan
70.00-108.87 range: fade extremes> 108.87: chase only if hold + vol< 70.00: risk expand; reduce sizeRegime: TRANSITIONTech: UP trend (expanding)
Swing Plan
Accumulate: 70.00-70.00Trim: 108.87-108.87Add: close > 108.87Cut: close < 70.00Best for: transition regime
Raw Text Summary
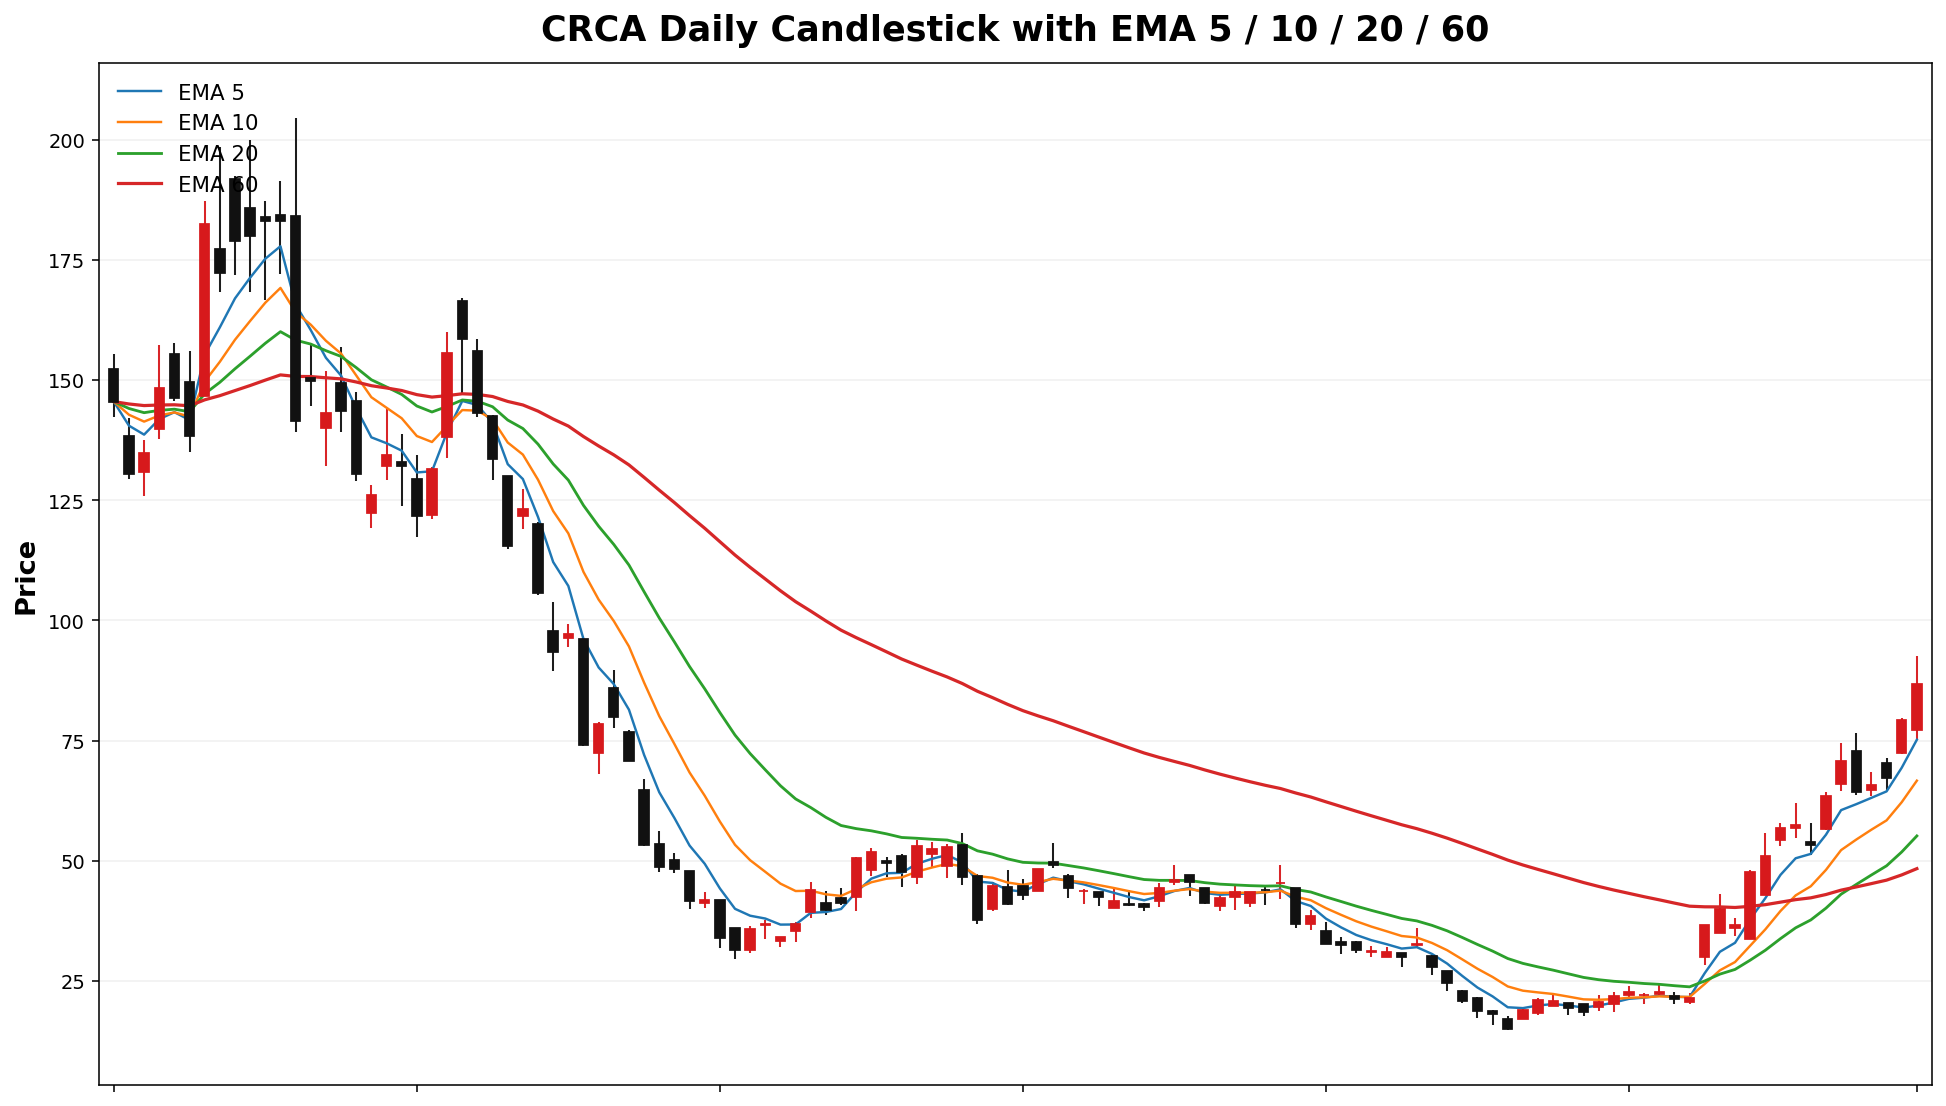
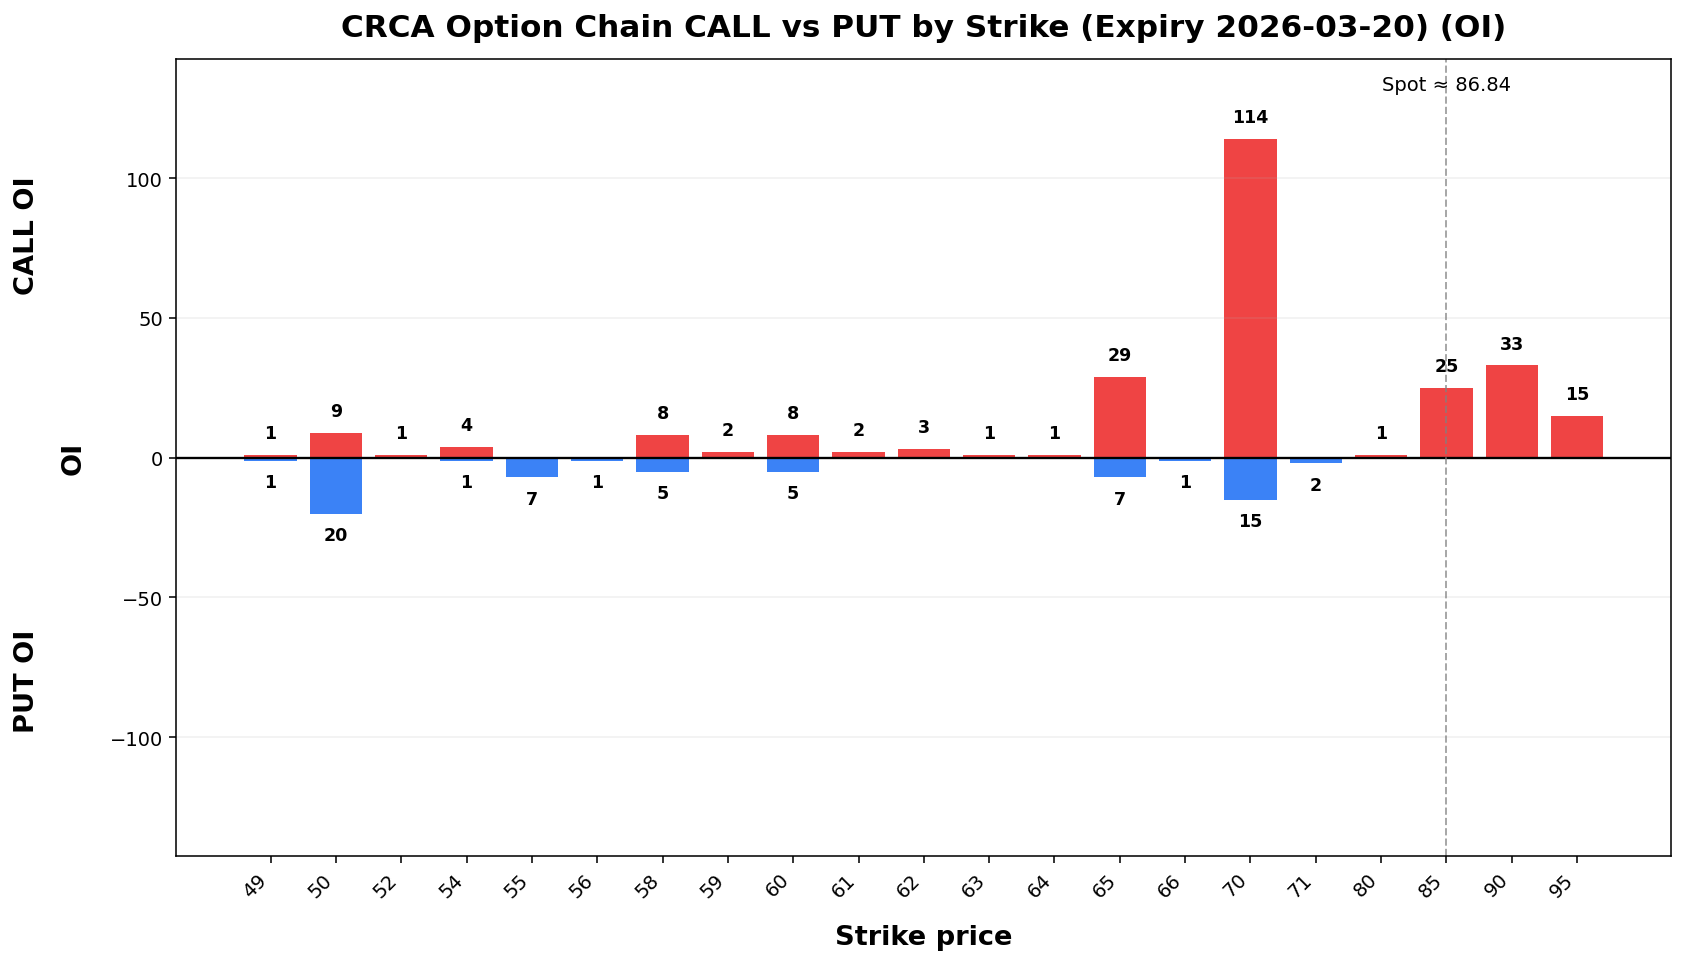
📌 CRCA @ 86.84 (2026-03-18 08:43 AM MYT)

• Current price is **86.84**. Key support is around **70.00**, and resistance is around **108.87**.
• For the next week, the model’s **68% expected range** is roughly **64.81 to 108.87**.
• A wider **90% range** is about **50.60 to 123.08**.
• Dealer positioning looks **LONG gamma**, so the market behavior is classified as **TRANSITION**.
• The estimated **gamma flip** is near **50.21**. Crossing and holding beyond this area can change the trading behavior.
• Approximate breakout odds: **above resistance 13.2%**, **below support 18.5%** by the target horizon.
• Options skew is fairly balanced, so there is **no strong directional bias** from skew alone.
• Near-term implied volatility is higher than the next expiry (**IV1 240.21% vs IV2 142.35%**), which suggests **near-term event stress / backwardation**.
• Recent volume is only **0.60x** the 20-day average, so breakouts may be less reliable unless volume improves.
• On the daily chart, the stock currently looks like **UP trend (expanding)**.
NEBX
Spot: 42.17
Report Time: 2026-03-18 08:43 AM MYT
Regime: TRANSITION
Dealer Gamma: LONG
Term Structure
Weekly Range
Structure & Probabilities
Flow & Skew
Tail Risk
Daily Technicals
| 36.68 | 2. |
Day Plan
40.00-50.00 range: fade extremes> 50.00: chase only if hold + vol< 40.00: risk expand; reduce sizeRegime: TRANSITIONTech: UP trend (expanding)
Swing Plan
Accumulate: 40.00-40.00Trim: 50.00-50.00Add: close > 50.00Cut: close < 40.00Best for: transition regime
Raw Text Summary
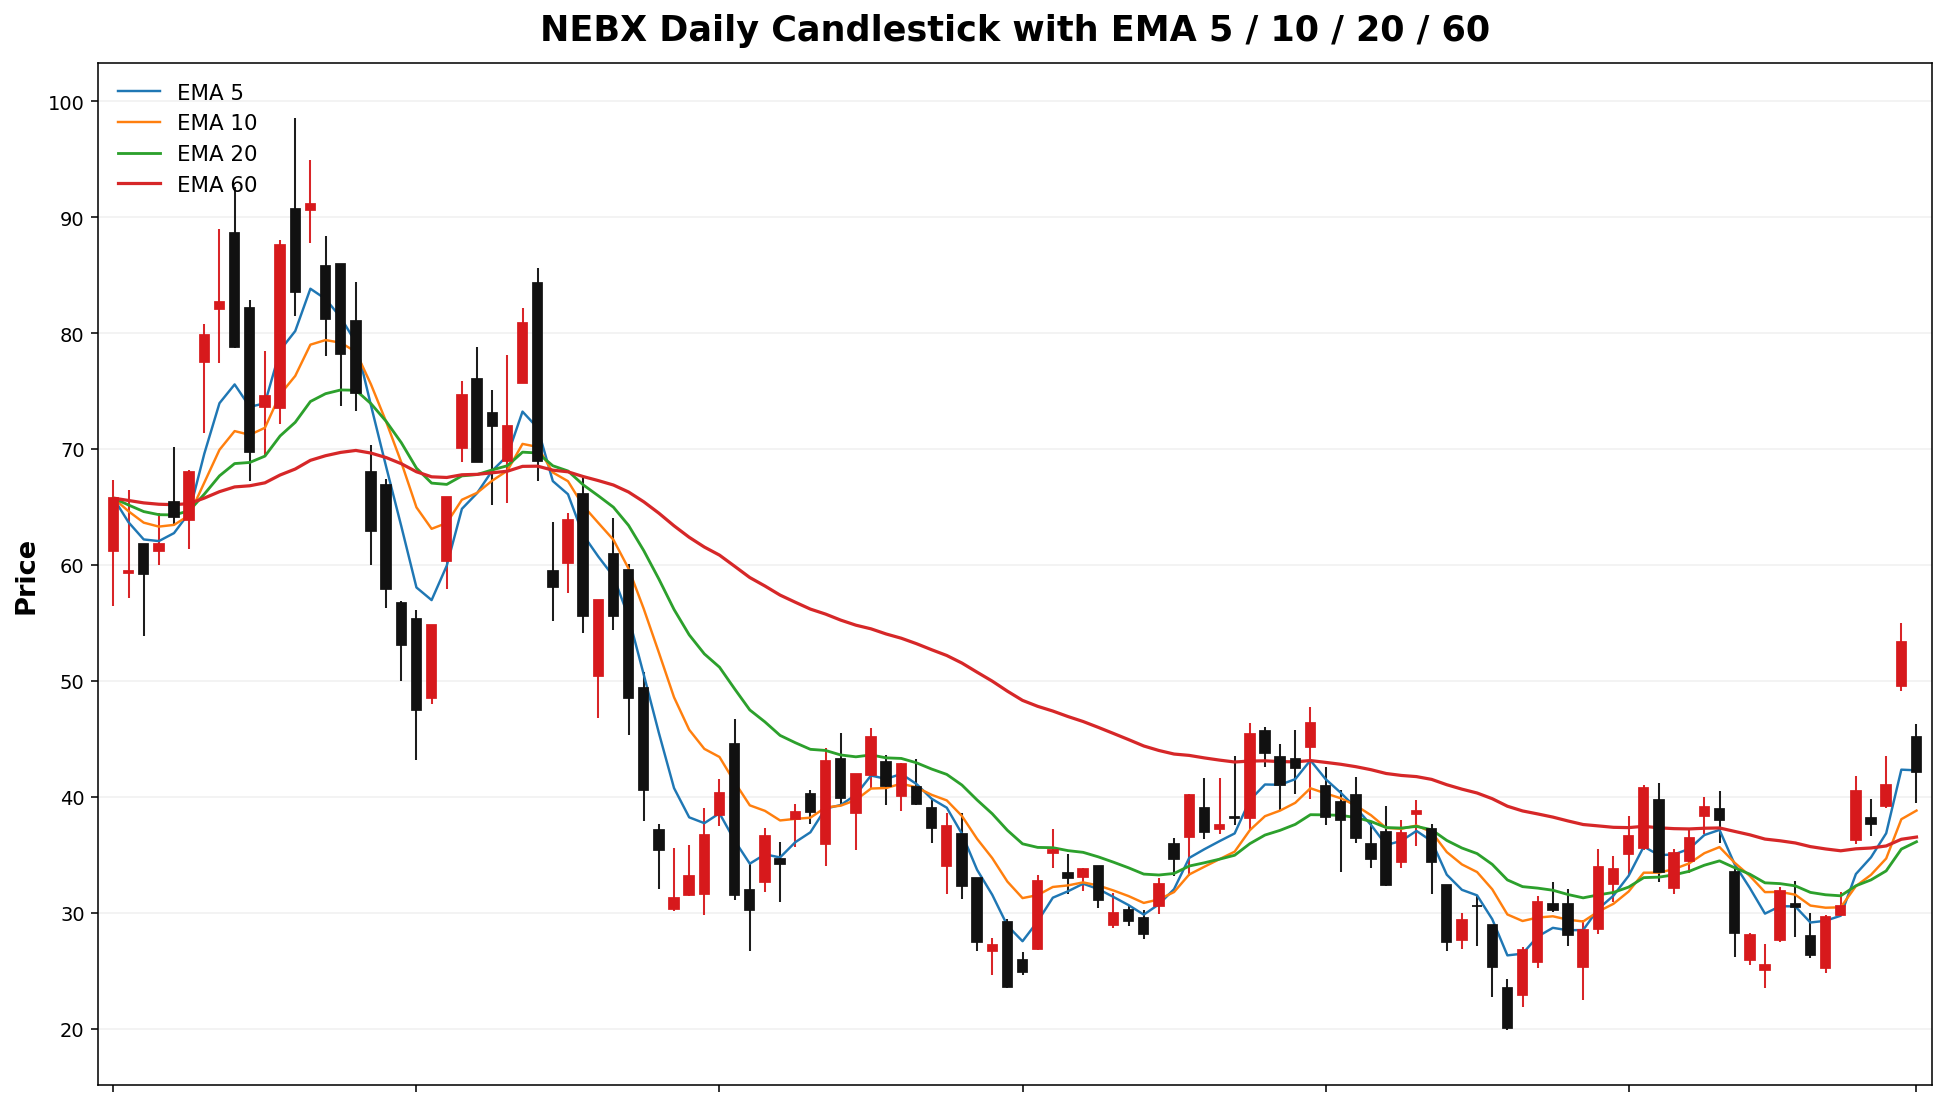
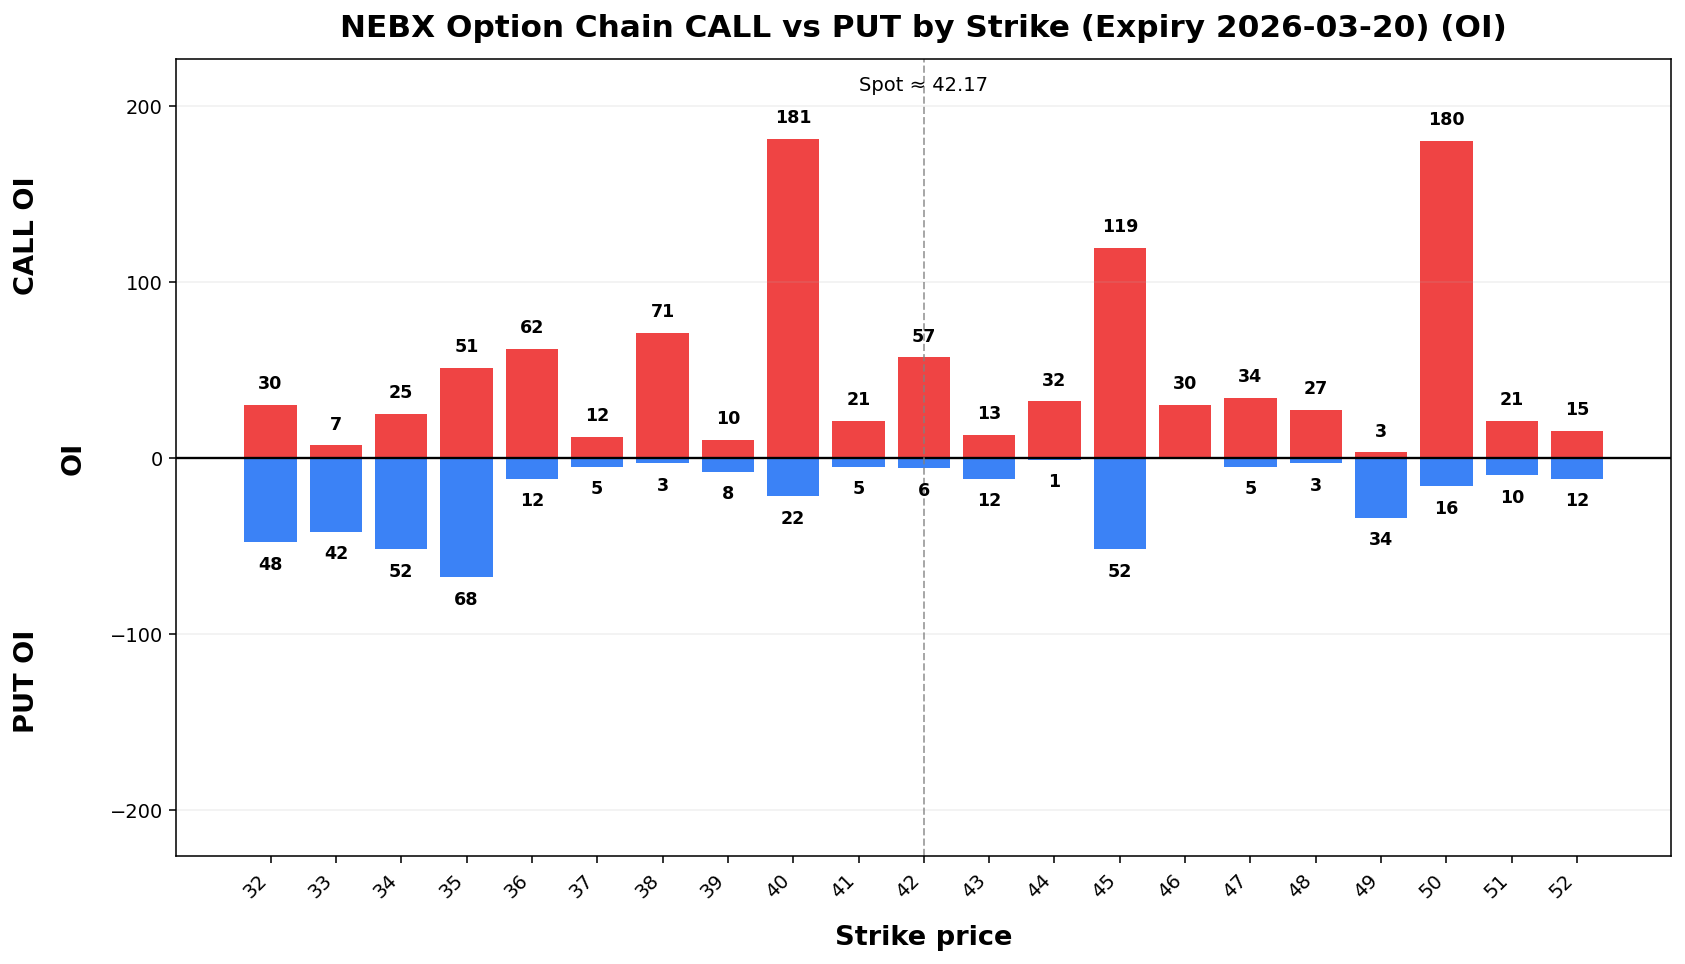
📌 NEBX @ 42.17 (2026-03-18 08:43 AM MYT)

• Current price is **42.17**. Key support is around **40.00**, and resistance is around **50.00**.
• For the next week, the model’s **68% expected range** is roughly **34.03 to 50.31**.
• A wider **90% range** is about **28.78 to 55.56**.
• Dealer positioning looks **LONG gamma**, so the market behavior is classified as **TRANSITION**.
• The estimated **gamma flip** is near **35.39**. Crossing and holding beyond this area can change the trading behavior.
• Approximate breakout odds: **above resistance 15.4%**, **below support 43.4%** by the target horizon.
• Options skew is tilted toward **puts**, which suggests traders are paying more for downside protection.
• Near-term implied volatility is higher than the next expiry (**IV1 161.73% vs IV2 123.30%**), which suggests **near-term event stress / backwardation**.
• Recent volume is **2.17x** the 20-day average, which supports stronger continuation or breakout follow-through.
• On the daily chart, the stock currently looks like **UP trend (expanding)**.
• The implied distribution shows **heavier downside tail risk** than upside tail potential.
SYRE
Spot: 43.95
Report Time: 2026-03-18 08:43 AM MYT
Regime: TRANSITION
Dealer Gamma: LONG
Term Structure
Weekly Range
Structure & Probabilities
Flow & Skew
Tail Risk
Daily Technicals
Day Plan
40.00-45.00 range: fade extremes> 45.00: chase only if hold + vol< 40.00: risk expand; reduce sizeRegime: TRANSITIONTech: UP trend (expanding)
Swing Plan
Accumulate: 40.00-40.00Trim: 45.00-45.00Add: close > 45.00Cut: close < 40.00Best for: transition regime
Raw Text Summary
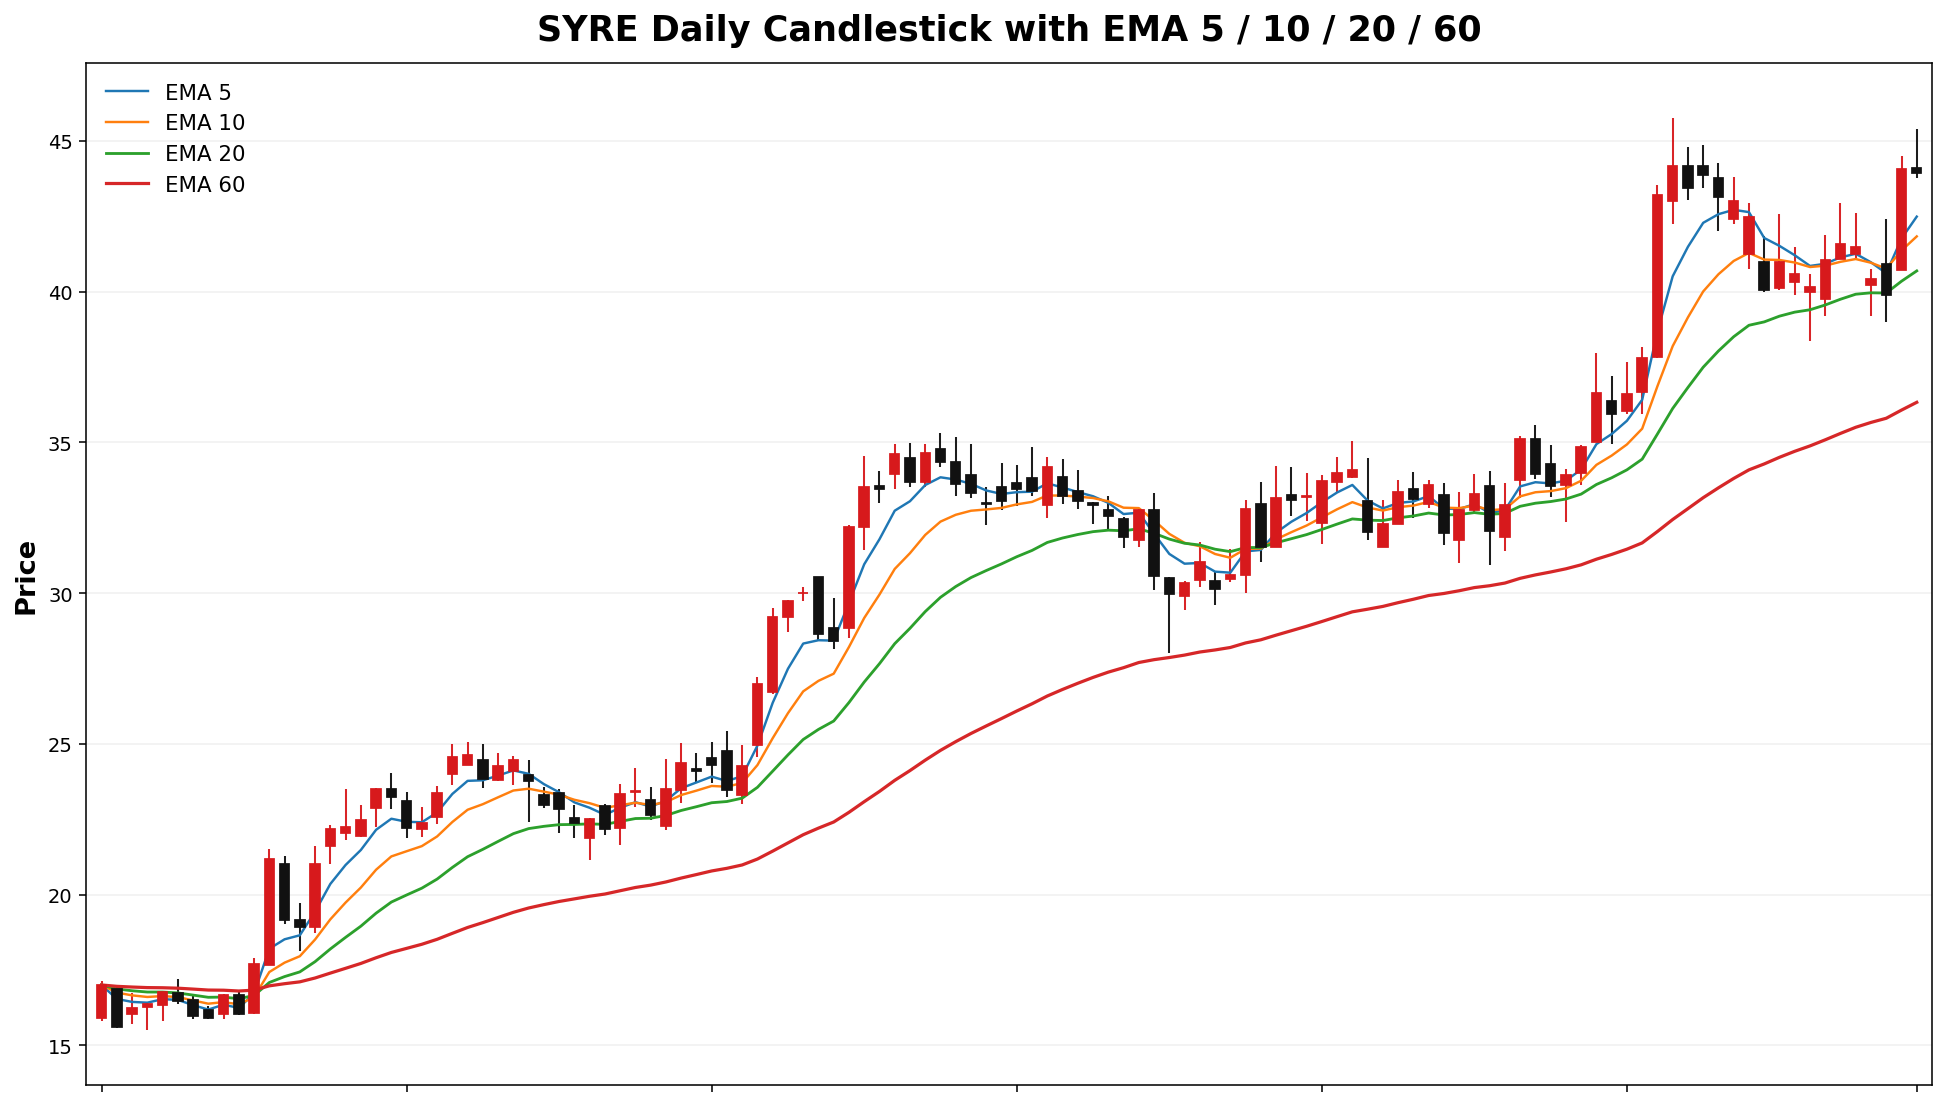
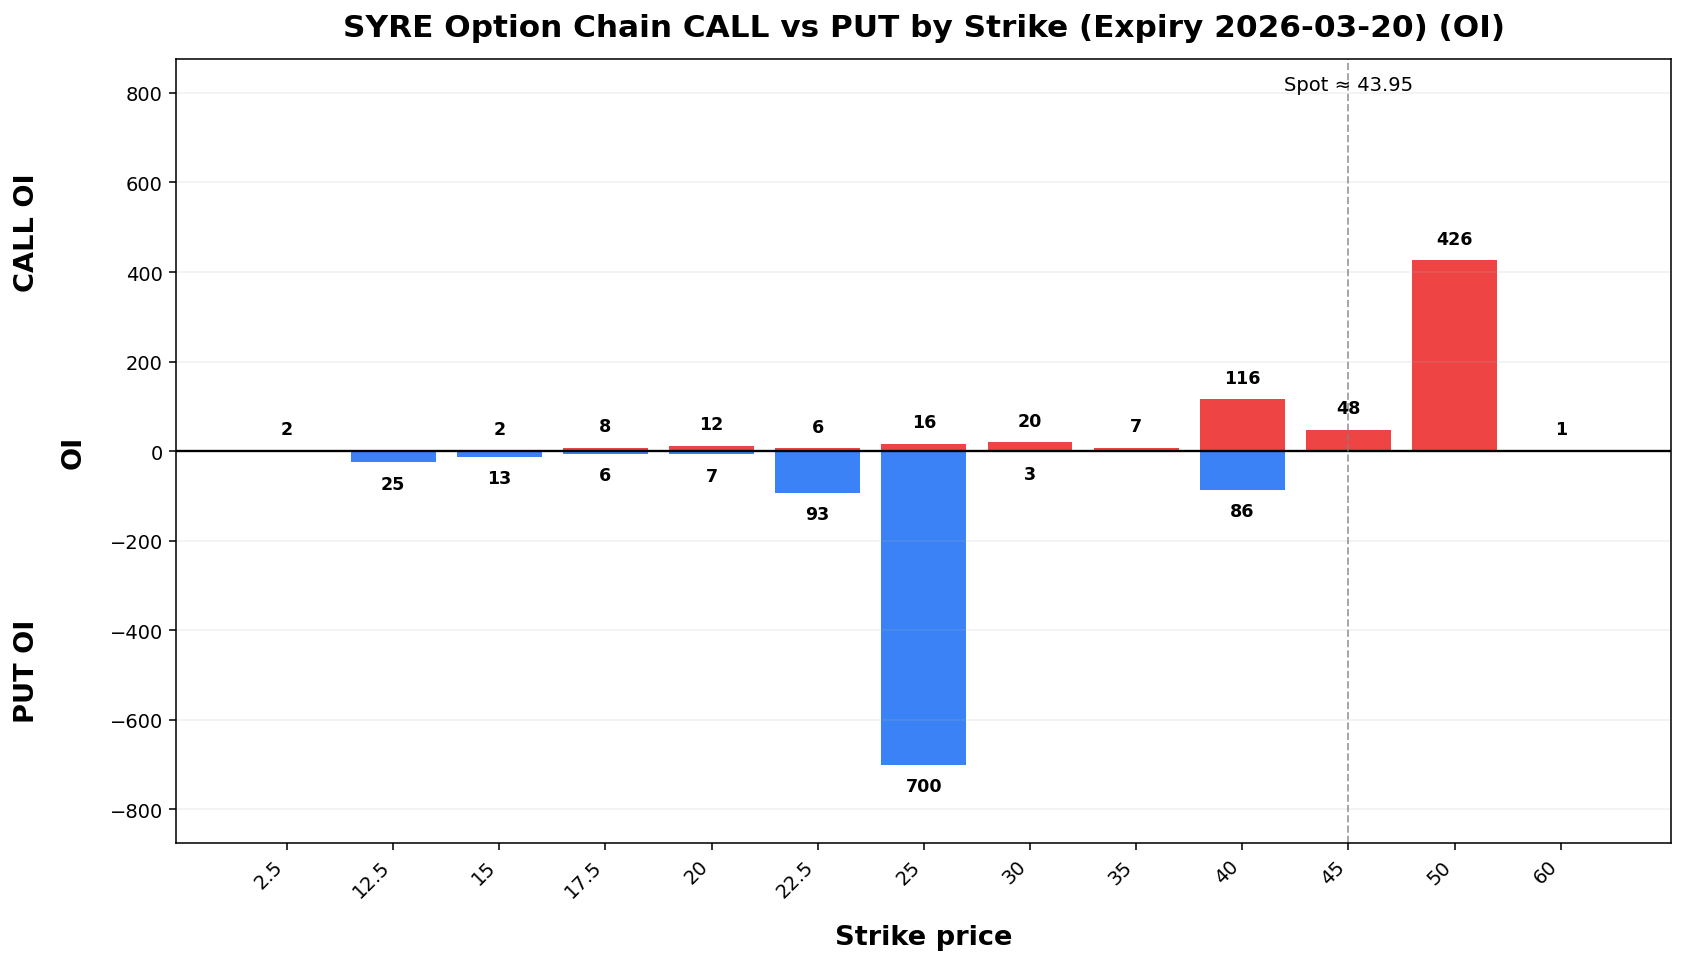
📌 SYRE @ 43.95 (2026-03-18 08:43 AM MYT)

• Current price is **43.95**. Key support is around **40.00**, and resistance is around **45.00**.
• For the next week, the model’s **68% expected range** is roughly **35.56 to 52.34**.
• A wider **90% range** is about **30.15 to 57.75**.
• Dealer positioning looks **LONG gamma**, so the market behavior is classified as **TRANSITION**.
• The estimated **gamma flip** is near **34.13**. Crossing and holding beyond this area can change the trading behavior.
• Approximate breakout odds: **above resistance 44.2%**, **below support 26.2%** by the target horizon.
• Options skew is tilted toward **calls**, which suggests upside speculation is relatively stronger.
• Near-term implied volatility is higher than the next expiry (**IV1 177.91% vs IV2 109.30%**), which suggests **near-term event stress / backwardation**.
• On the daily chart, the stock currently looks like **UP trend (expanding)**.
AXTI
Spot: 44.36
Report Time: 2026-03-18 08:43 AM MYT
Regime: TREND
Dealer Gamma: SHORT

Term Structure
Weekly Range
| 15. | |||
Structure & Probabilities
Flow & Skew
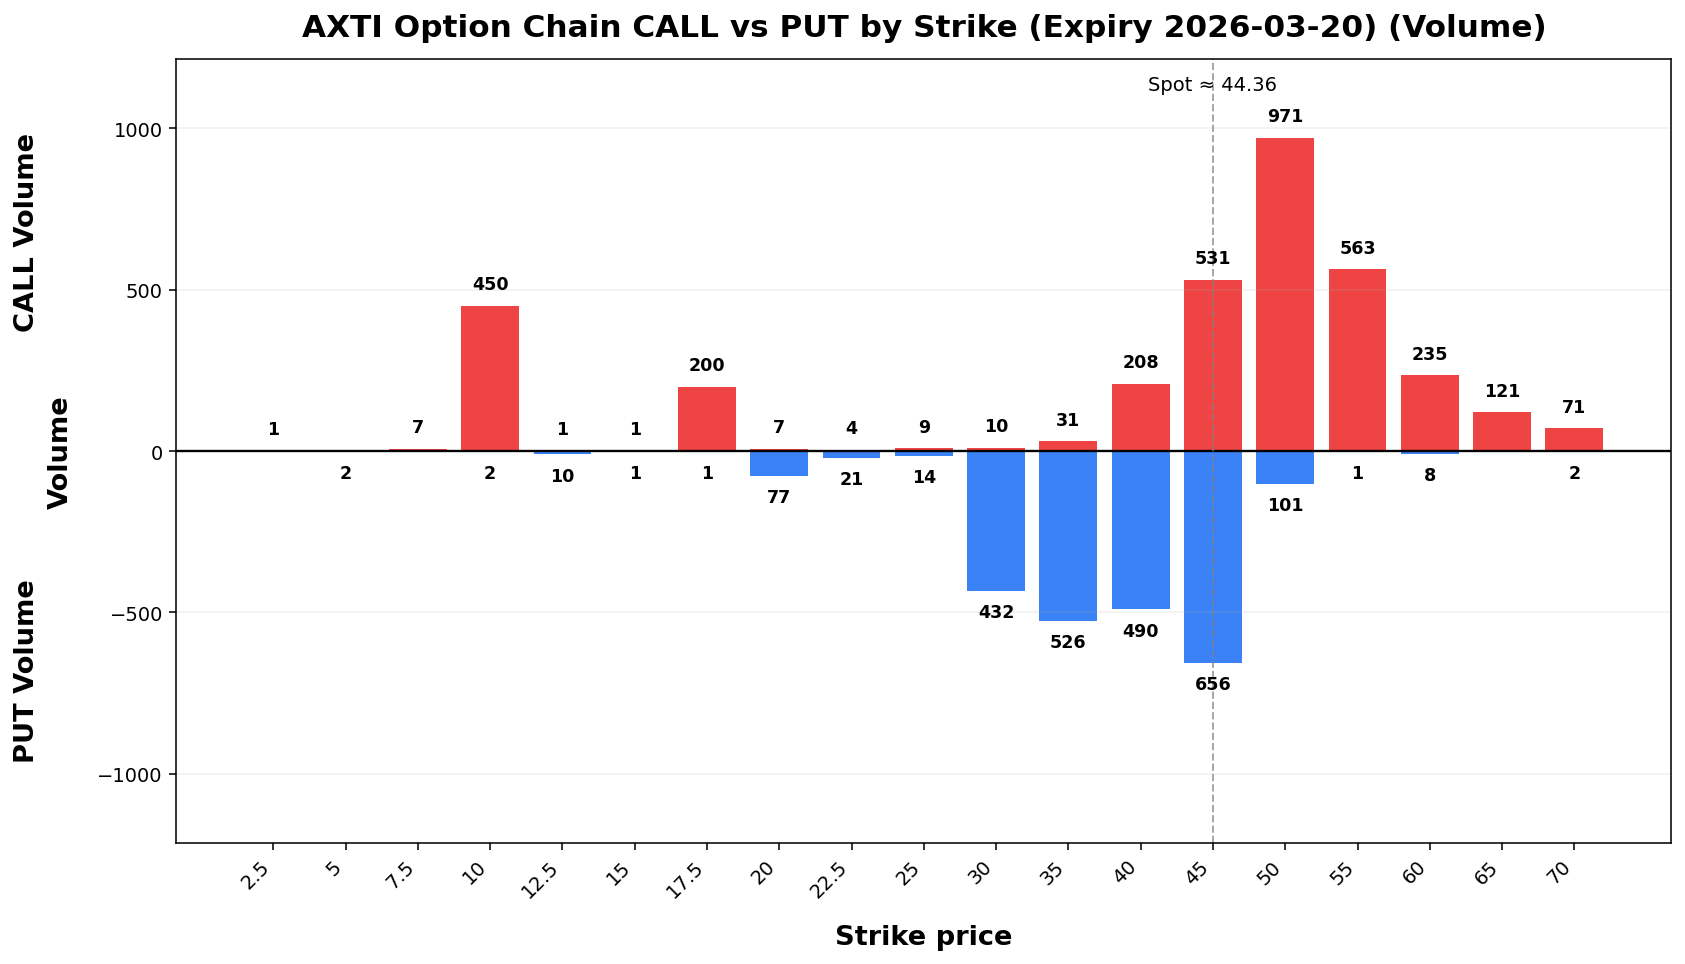
| Call Vol | Put Vol | Vol P/C | Call OI | Put OI | OI P/C | Skew | Skew Bias |
|---|---|---|---|---|---|---|---|
| 3,421 | 2,344 | 0.69 |
Tail Risk
| Q10 | Q50 | Q90 | Down Tail | Up Tail | Down/Up | |
|---|---|---|---|---|---|---|
| 19.91 |
Daily Technicals
| EMA20 | EMA50 | VWAP20 | BB Lower | BB Mid | BB Upper | BB Width | Vol Ratio | Path |
|---|---|---|---|---|---|---|---|---|
| 39.22 | 30.47 | 39.85 | 23.00 | 38.67 | 54.35 | 81.08% | 1.01 | UP trend (expanding) |
Day Plan
40.00-45.0036.68-52.04 range: fade extremes- >
45.00:52.04: chase only if hold + vol - <
40.00: risk expand; reduce size Regime: TRENDTech: UP trend (expanding)
Swing Plan
Accumulate: 40.00-40.00Trim: 45.00-45.00Add: close > 45.00Cut: close < 40.00Best for: trend regimeBias: upside breakout more favored
Raw Text Summary
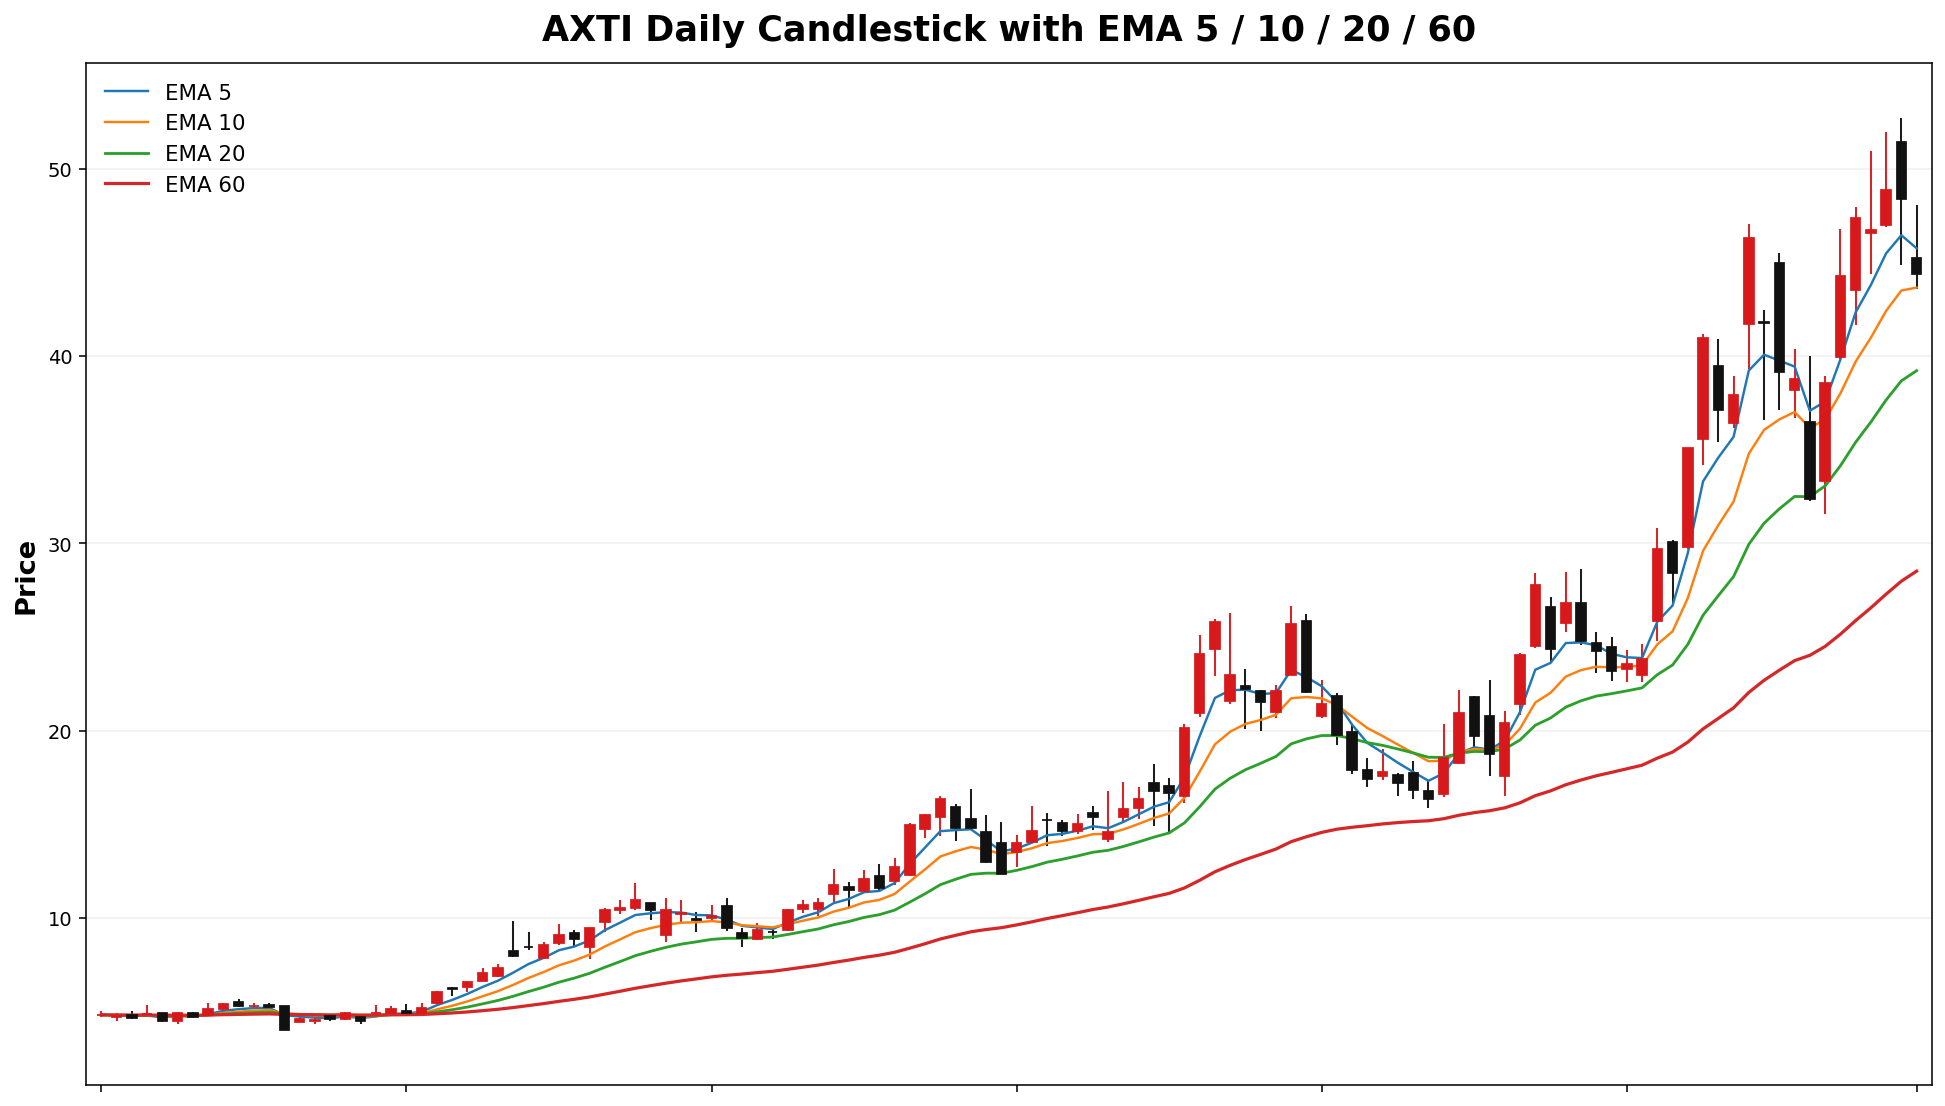
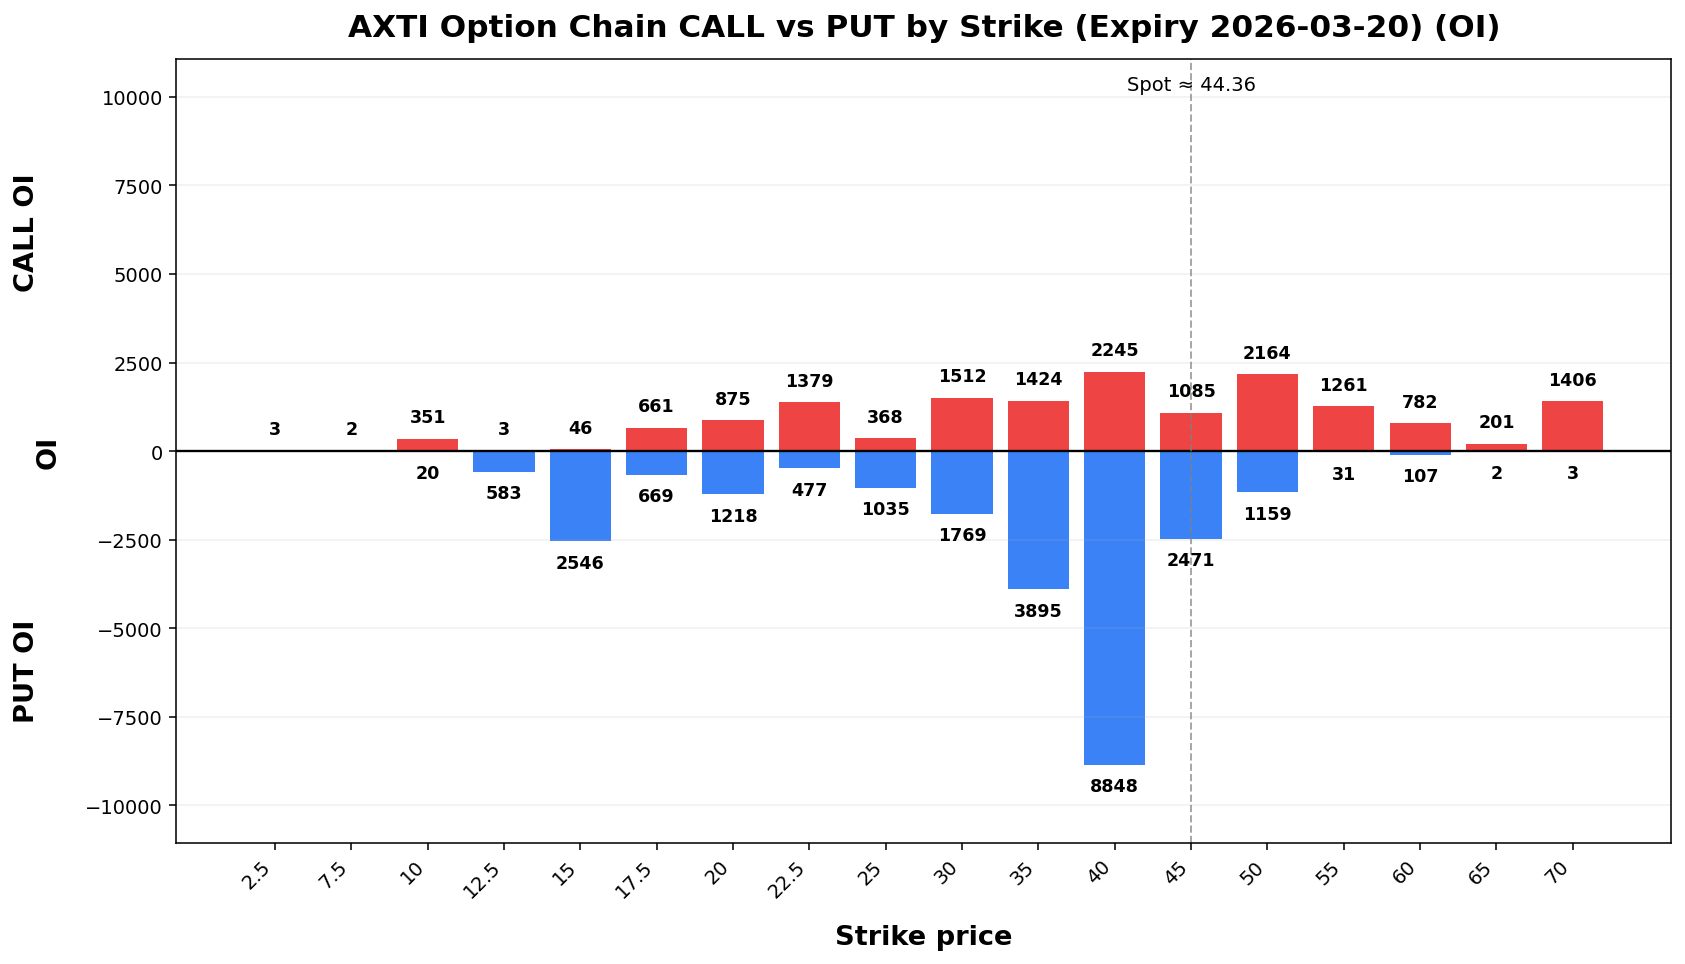
📌 AXTI @ 44.36 (2026-03-18 08:43 AM MYT)

• Current price is **44.36**. Key support is around **40.00**, and resistance is around **45.00**.
• For the next week, the model’s **68% expected range** is roughly **36.76 to 51.96**.
• A wider **90% range** is about **31.87 to 56.85**.
• Dealer positioning looks **SHORT gamma**, so the market behavior is classified as **TREND**.
• The estimated **gamma flip** is near **50.50**. Crossing and holding beyond this area can change the trading behavior.
• Approximate breakout odds: **above resistance 62.0%**, **below support 31.4%** by the target horizon.
• Options skew is tilted toward **calls**, which suggests upside speculation is relatively stronger.
• Near-term implied volatility is higher than the next expiry (**IV1 137.02% vs IV2 113.33%**), which suggests **near-term event stress / backwardation**.
• On the daily chart, the stock currently looks like **UP trend (expanding)**.
• The implied distribution is **fairly balanced** between upside and downside tails.
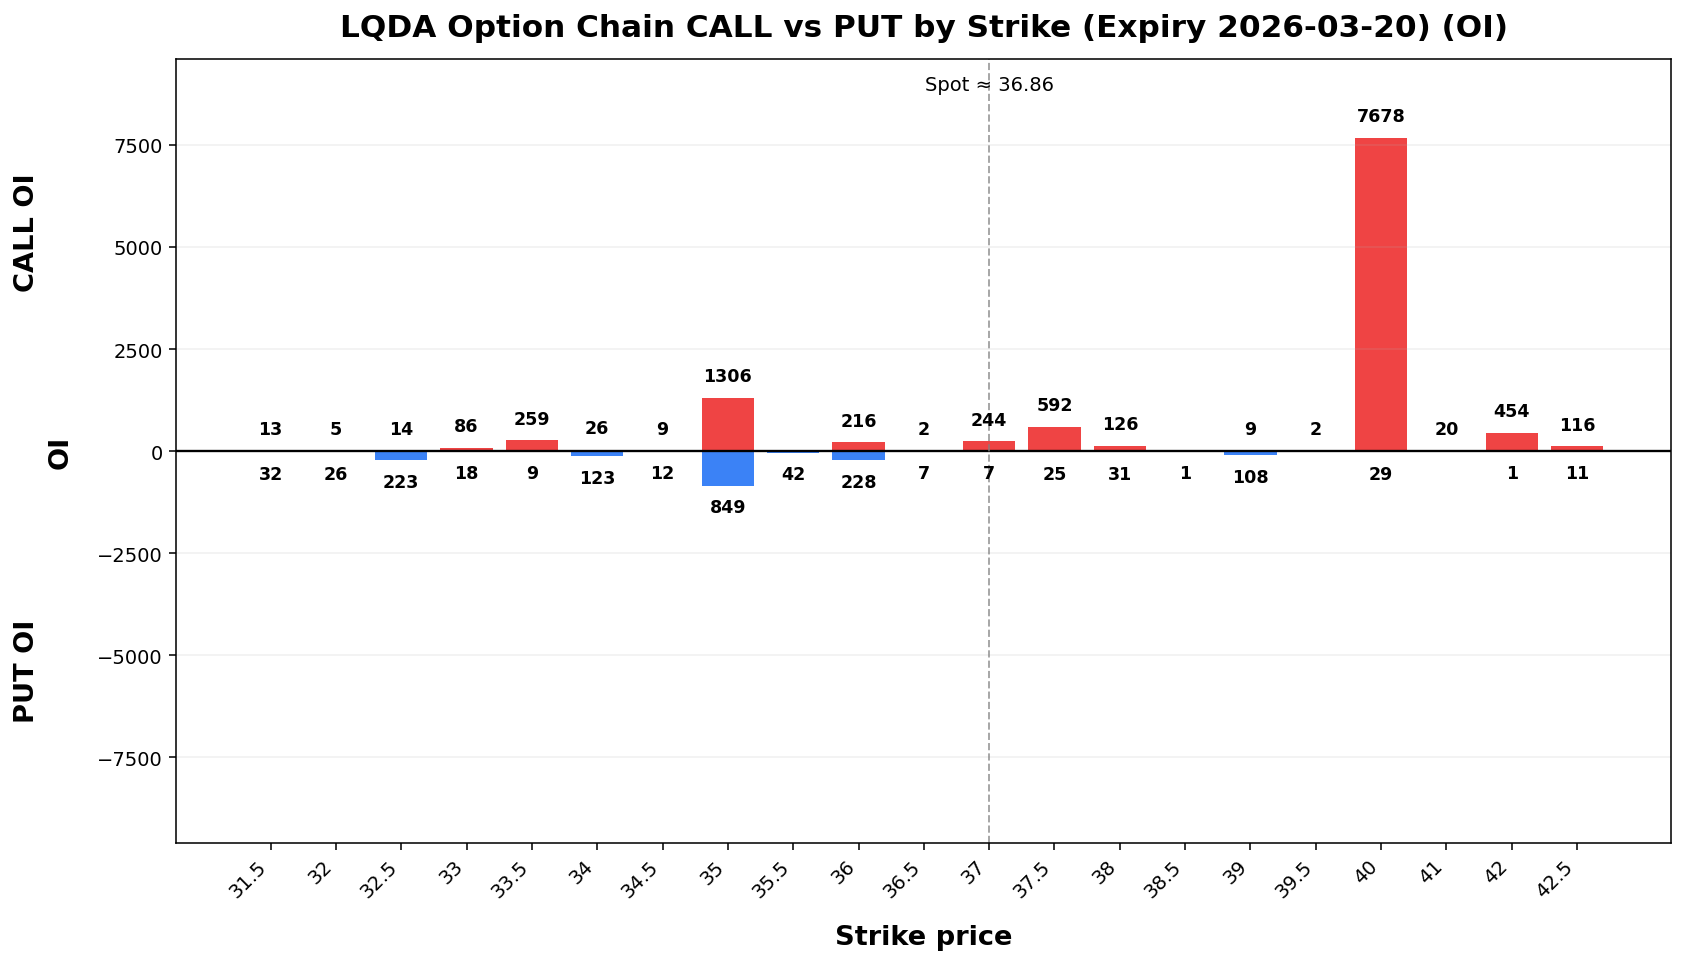
LQDA
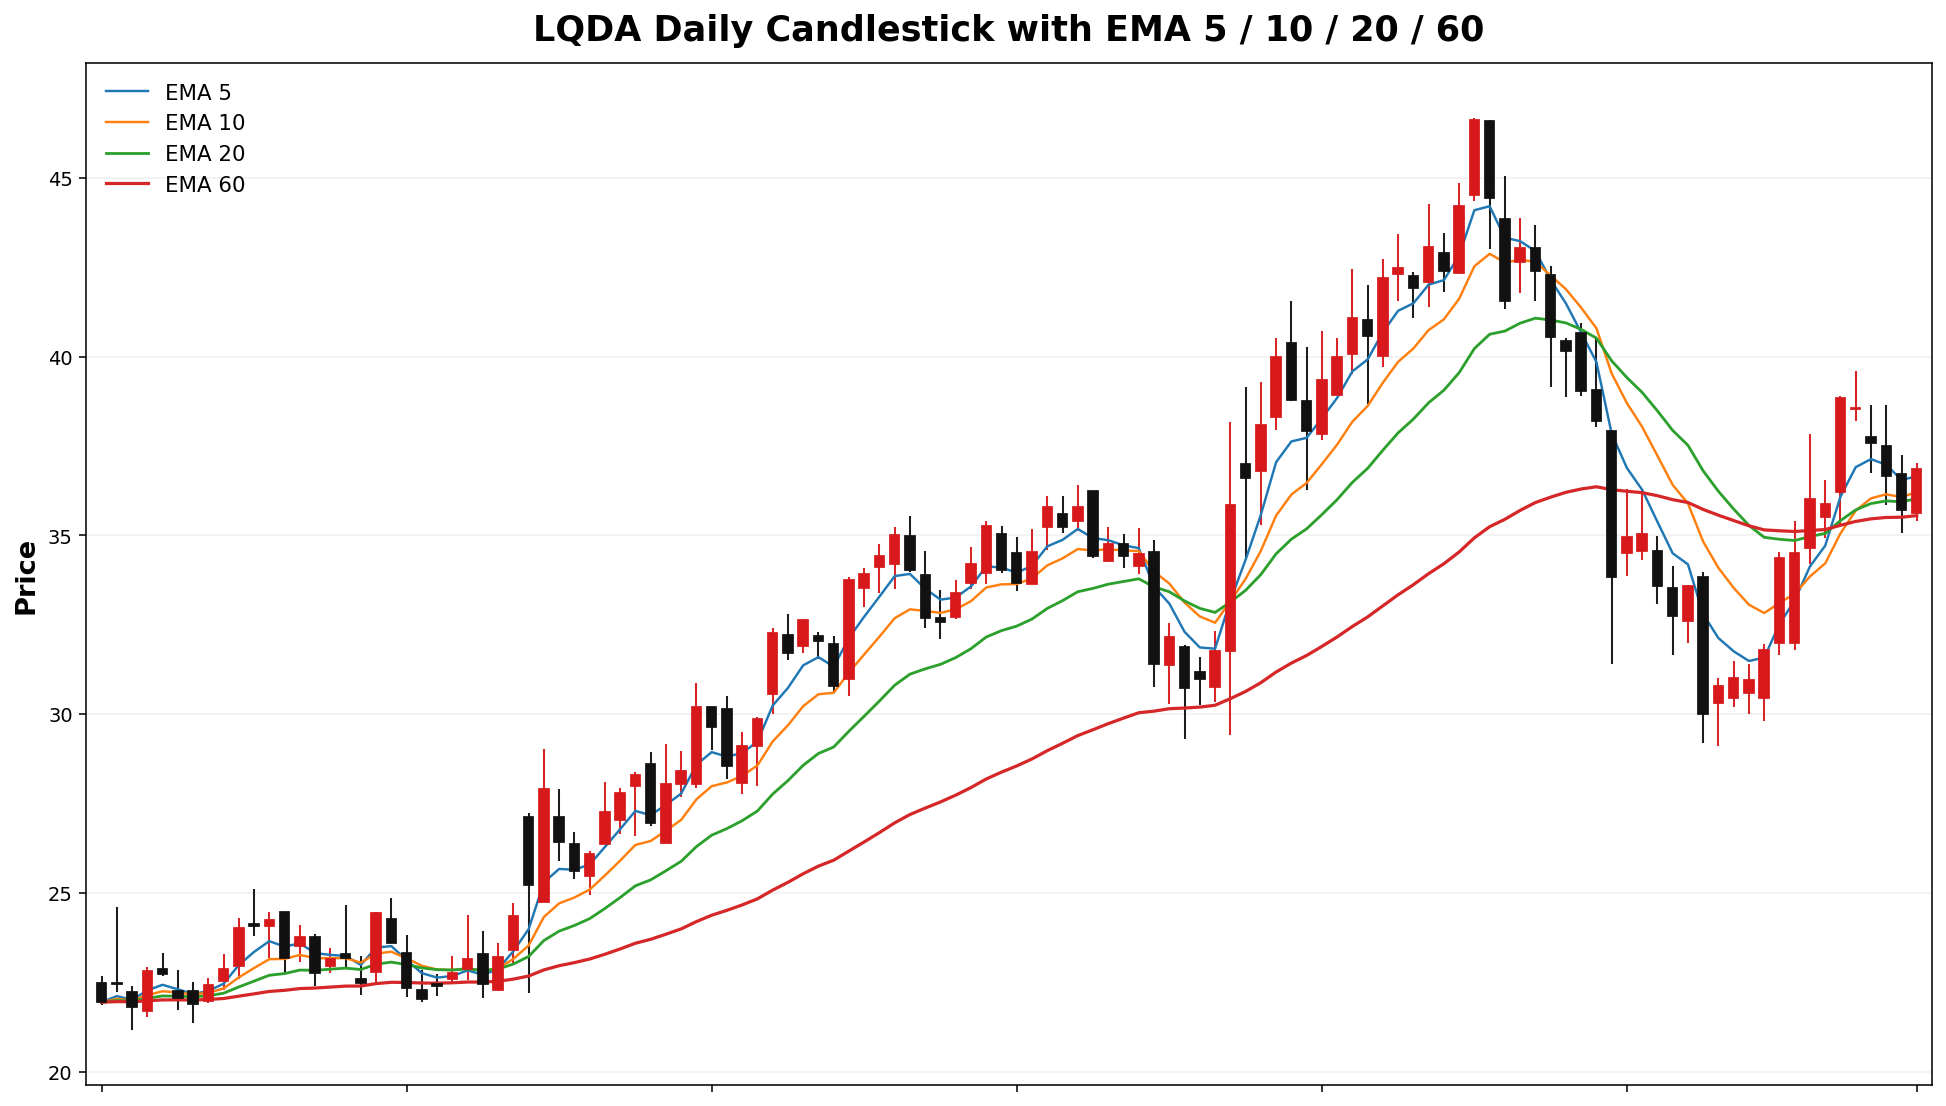
Spot: 36.86
Report Time: 2026-03-18 08:43 AM MYT
Regime: TRANSITION
Dealer Gamma: LONG
Term Structure
Weekly Range
Structure & Probabilities
Flow & Skew
Tail Risk
Daily Technicals
Day Plan
35.00-40.00 range: fade extremes> 40.00: chase only if hold + vol< 35.00:68: risk expand; reduce size- Regime: TRANSITION
- Tech: UP trend (expanding)
Swing Plan
- Accumulate:
35.00-35.0036.68-36.68 - Trim:
40.00-40.0052.04-52.04 - Add: close >
40.0052.04 - Cut: close <
35.0036.68 - Best for: transition regime
Raw Text Summary
📌 LQDAAXTI @ 36.8644.36 (2026-03-18 08:4303:42 AMPM MYT)

• Current price is **36.86*44.36**. Key support is around **35.00*36.68**, and resistance is around **40.00*52.04**.
• For the next week, the model’s **68% expected range** is roughly **31.5036.68 to 42.22*52.04**.
• A wider **90% range** is about **28.0531.73 to 45.67*56.99**.
• Dealer positioning looks **LONGNEUTRAL gamma**, so the market behavior is classified as **TRANSITION**.
• The estimated **gamma flip** is near **32.54*22.18**. Crossing and holding beyond this area can change the trading behavior.
• Approximate breakout odds: **above resistance 25.5%15.3%**, **below support 27.8%18.3%** by the target horizon.
• Options skew is tilted toward **calls*puts**, which suggests upsidetraders speculationare ispaying relativelymore stronger.for downside protection.
• Near-term implied volatility is higher than the next expiry (**IV1 154.84%146.79% vs IV2 91.91%111.85%**), which suggests **near-term event stress / backwardation**.
• Recent volume is only **0.58x** the 20-day average, so breakouts may be less reliable unless volume improves.
• On the daily chart, the stock currently looks like **UP trend (expanding)**.
• The implied distribution shows **heavier downside tail risk** than upside tail potential.