Analysis Report
Updated: 2026-03-1819 15:42:5508:43:09 MYT
Source File: combined-summary-20260318-154255.20260319-084309.md
Screening Source: screen-report-20260318-154246.20260319-084248.md
Extracted Symbols: AXTIVIXY, CRCA, AAOI
Topline Summary
| Symbol |
Spot |
Support |
Resistance |
Flip |
Regime |
P>Res |
P<Sup |
68% Range |
90% Range |
AXTIVIXY |
44.3633.59 |
36.6833.00 |
52.0435.00 |
22.1899 |
TRANSITION |
15.3%41.8% |
18.3%38.5% |
36.6826.05 - 52.0441.13 |
31.7321.19 - 56.45.99 |
| CRCA |
87.72 |
70.00 |
110.75 |
53.38 |
TRANSITION |
12.1% |
20.2% |
64.69 - 110.75 |
49.83 - 125.61 |
| AAOI |
92.63 |
90.00 |
100.00 |
87.23 |
TRANSITION |
24.0% |
41.5% |
79.12 - 106.14 |
70.41 - 114.85 |
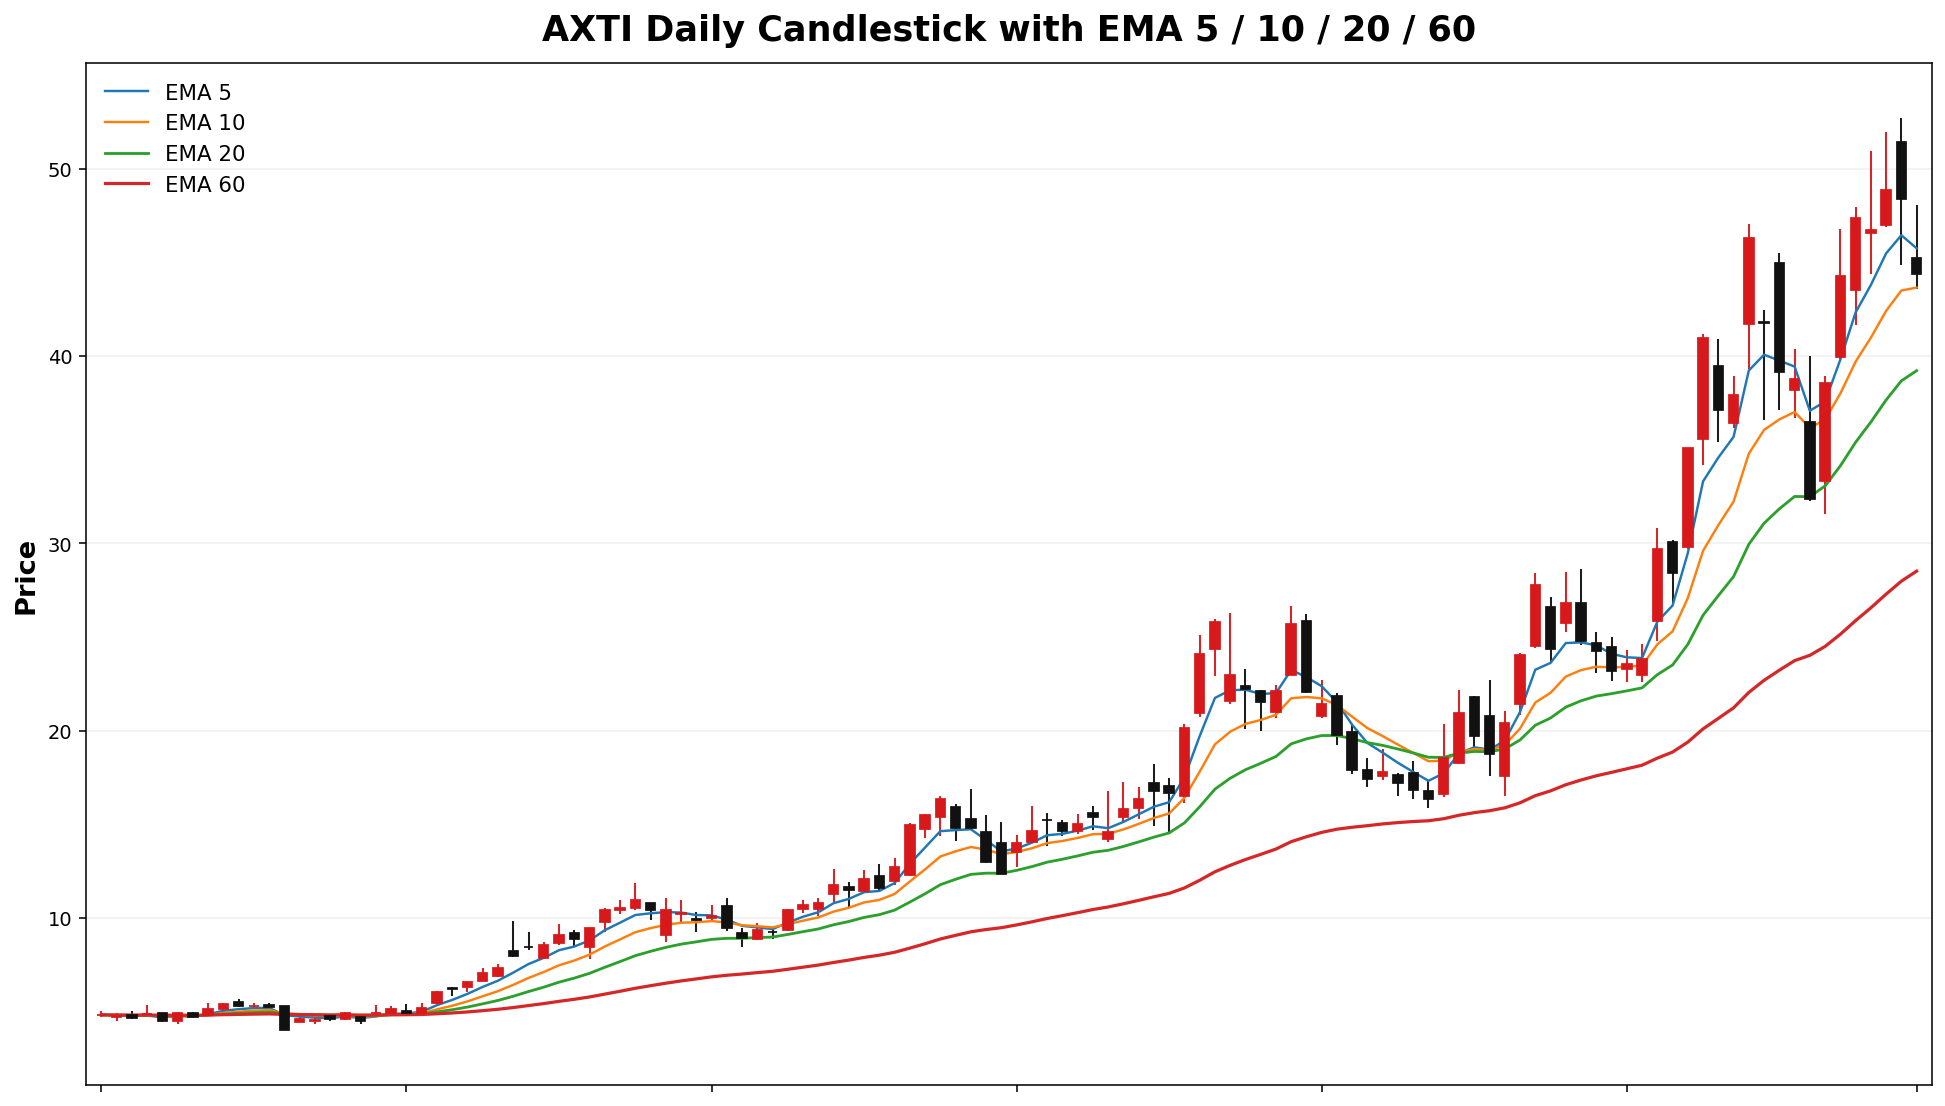
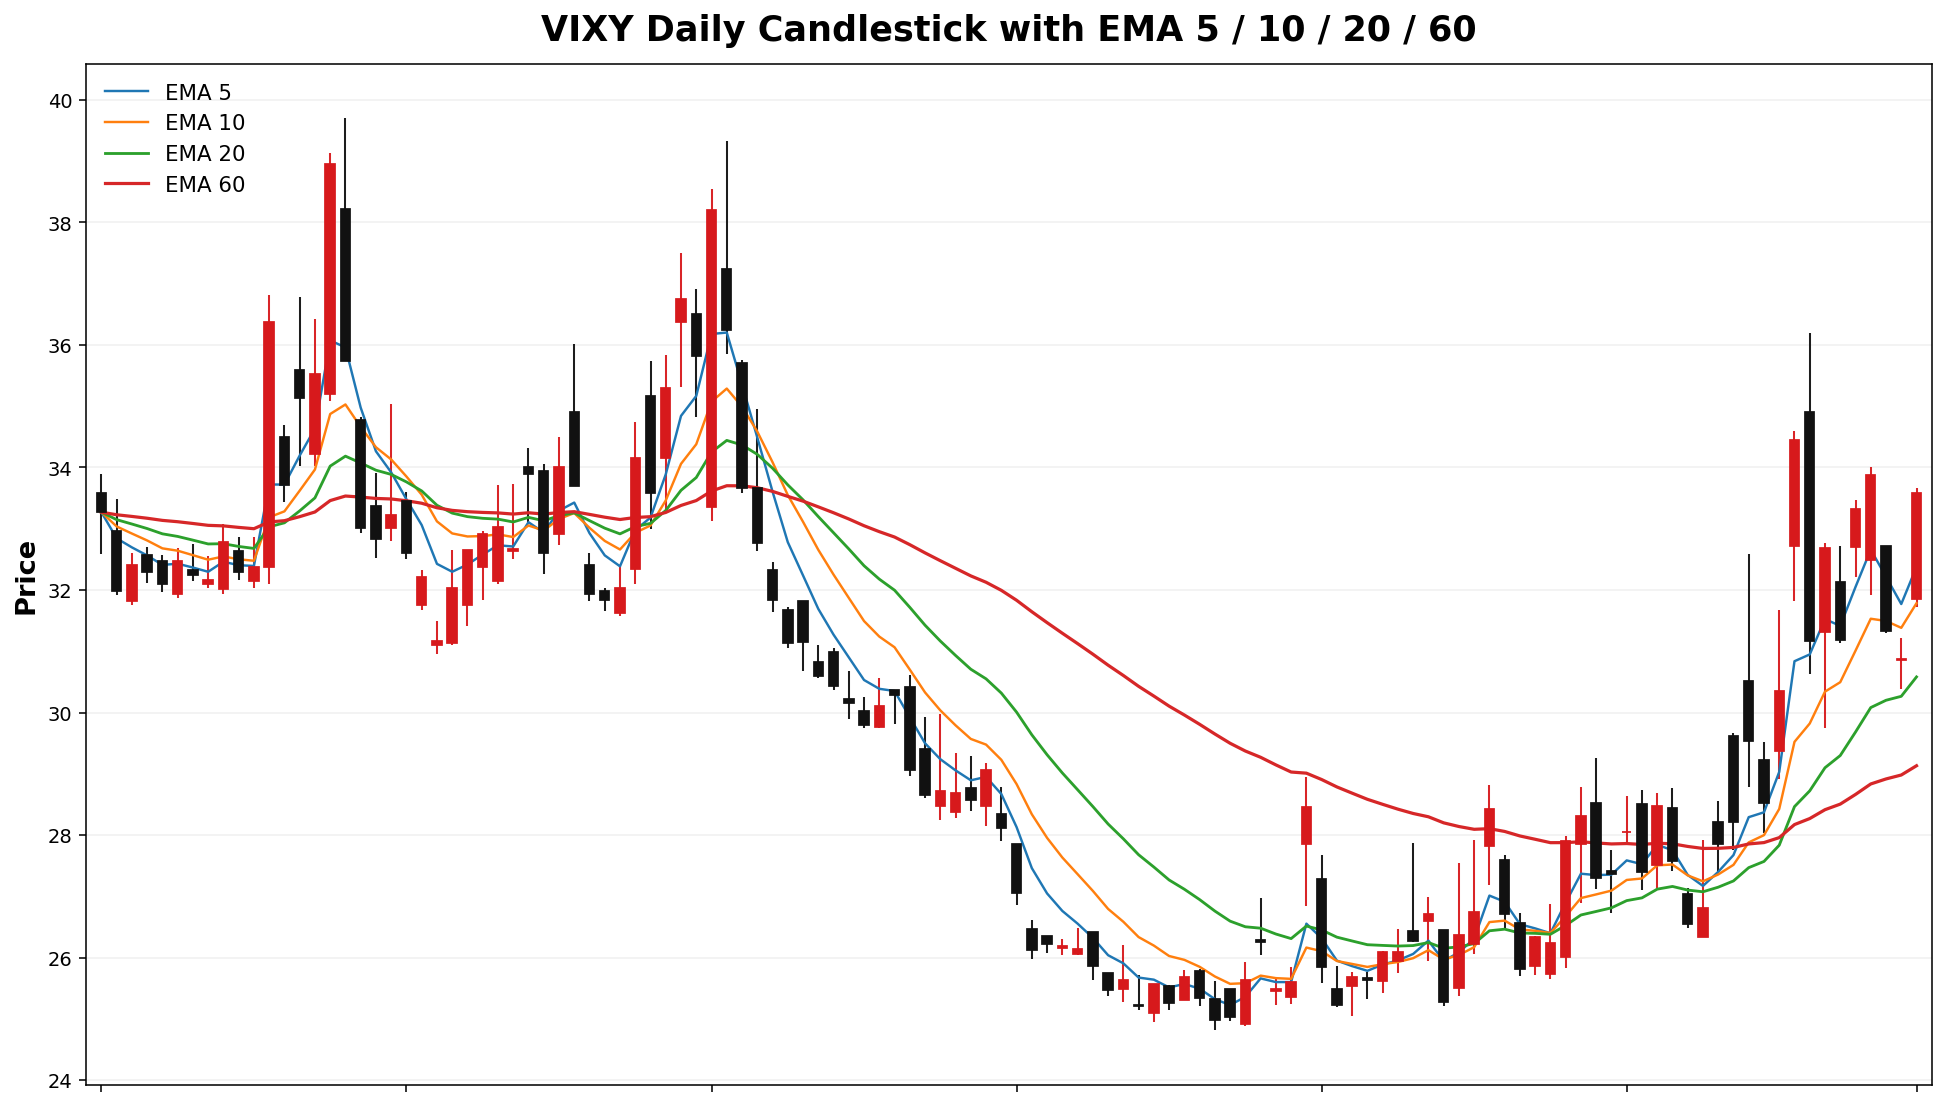
AXTIVIXY
Spot: 44.3633.59
Report Time: 2026-03-1819 03:08:42 PMAM MYT
Regime: TRANSITION
Dealer Gamma: NEUTRALLONG
Term Structure
| Expiry |
DTE |
Forward |
ATM IV |
ATM Straddle |
| 2026-03-20 |
32 |
44.6934.22 |
146.79%320.93% |
5.407.57 |
| 2026-04-17 |
30 |
33.31 |
45.0977.12% |
111.85% |
14.347.40 |
Weekly Range
| Confidence |
Low |
High |
Width |
| 68% |
36.6826.05 |
52.0441.13 |
15.3608 |
| 80% |
34.5223.93 |
54.2043.25 |
19.6933 |
| 90% |
31.7321.19 |
56.45.99 |
25.2724.81 |
| 95% |
29.3018.81 |
59.4248.37 |
30.1129.56 |
Structure & Probabilities
| Support |
Resistance |
Gamma Flip |
Max Pain |
P>Res |
P<Sup |
36.6833.00 |
52.0435.00 |
22.1899 |
2.5028.00 |
15.3%41.8% |
18.3%38.5% |
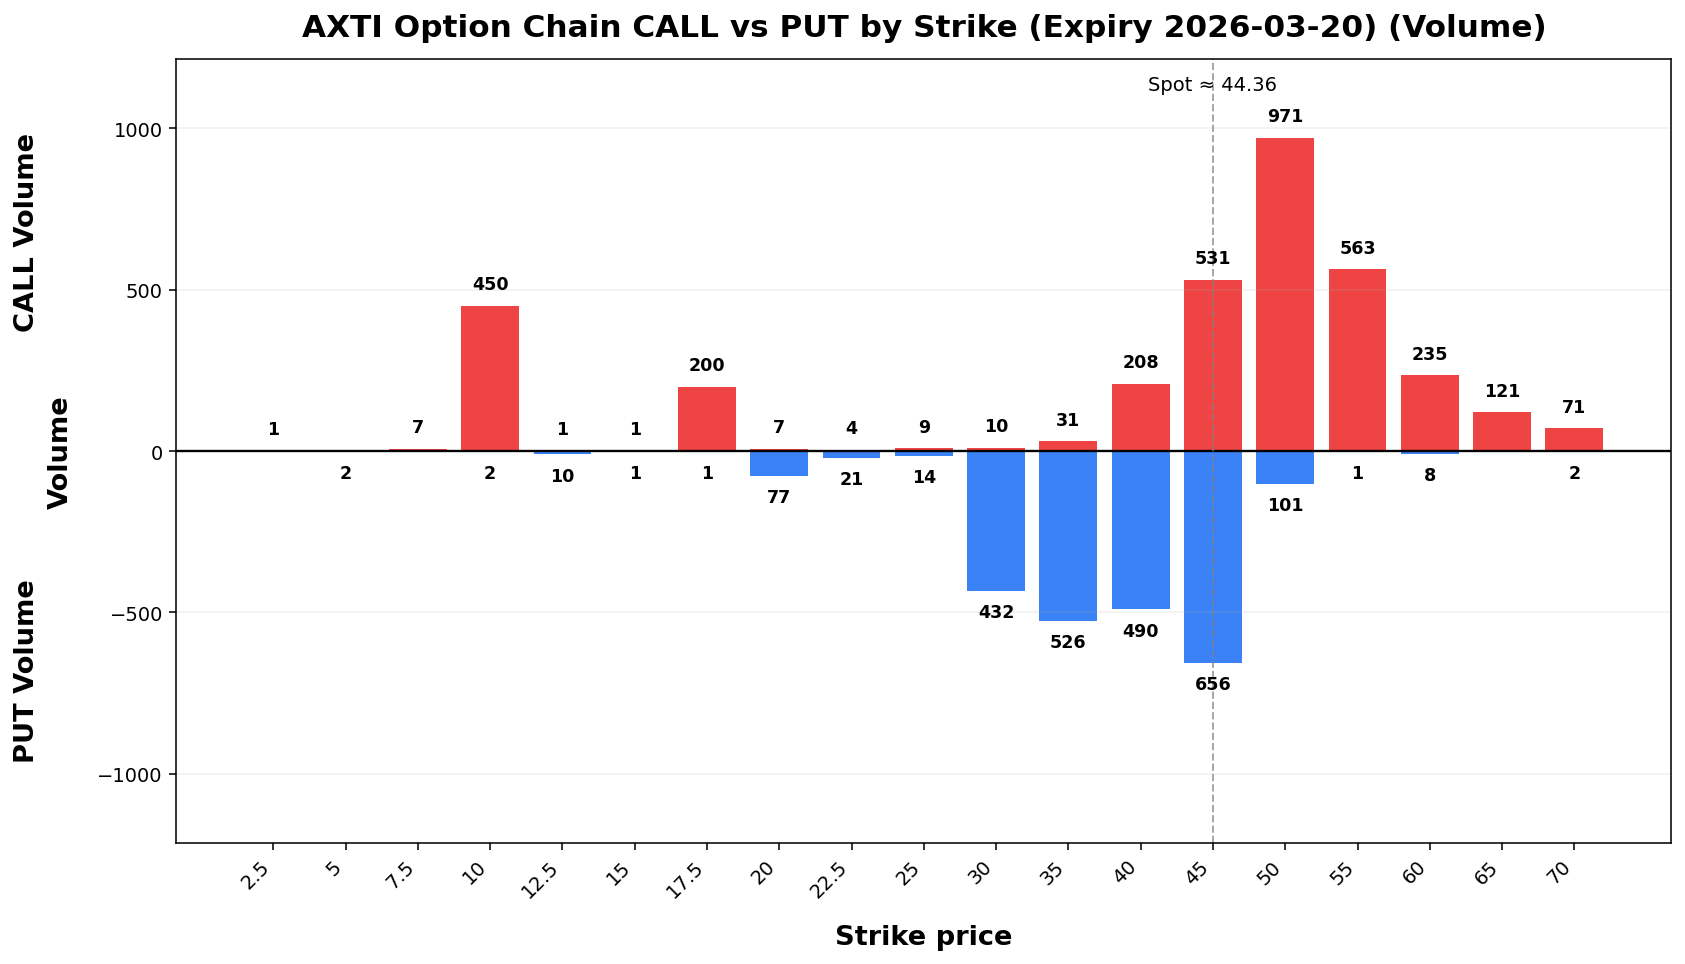
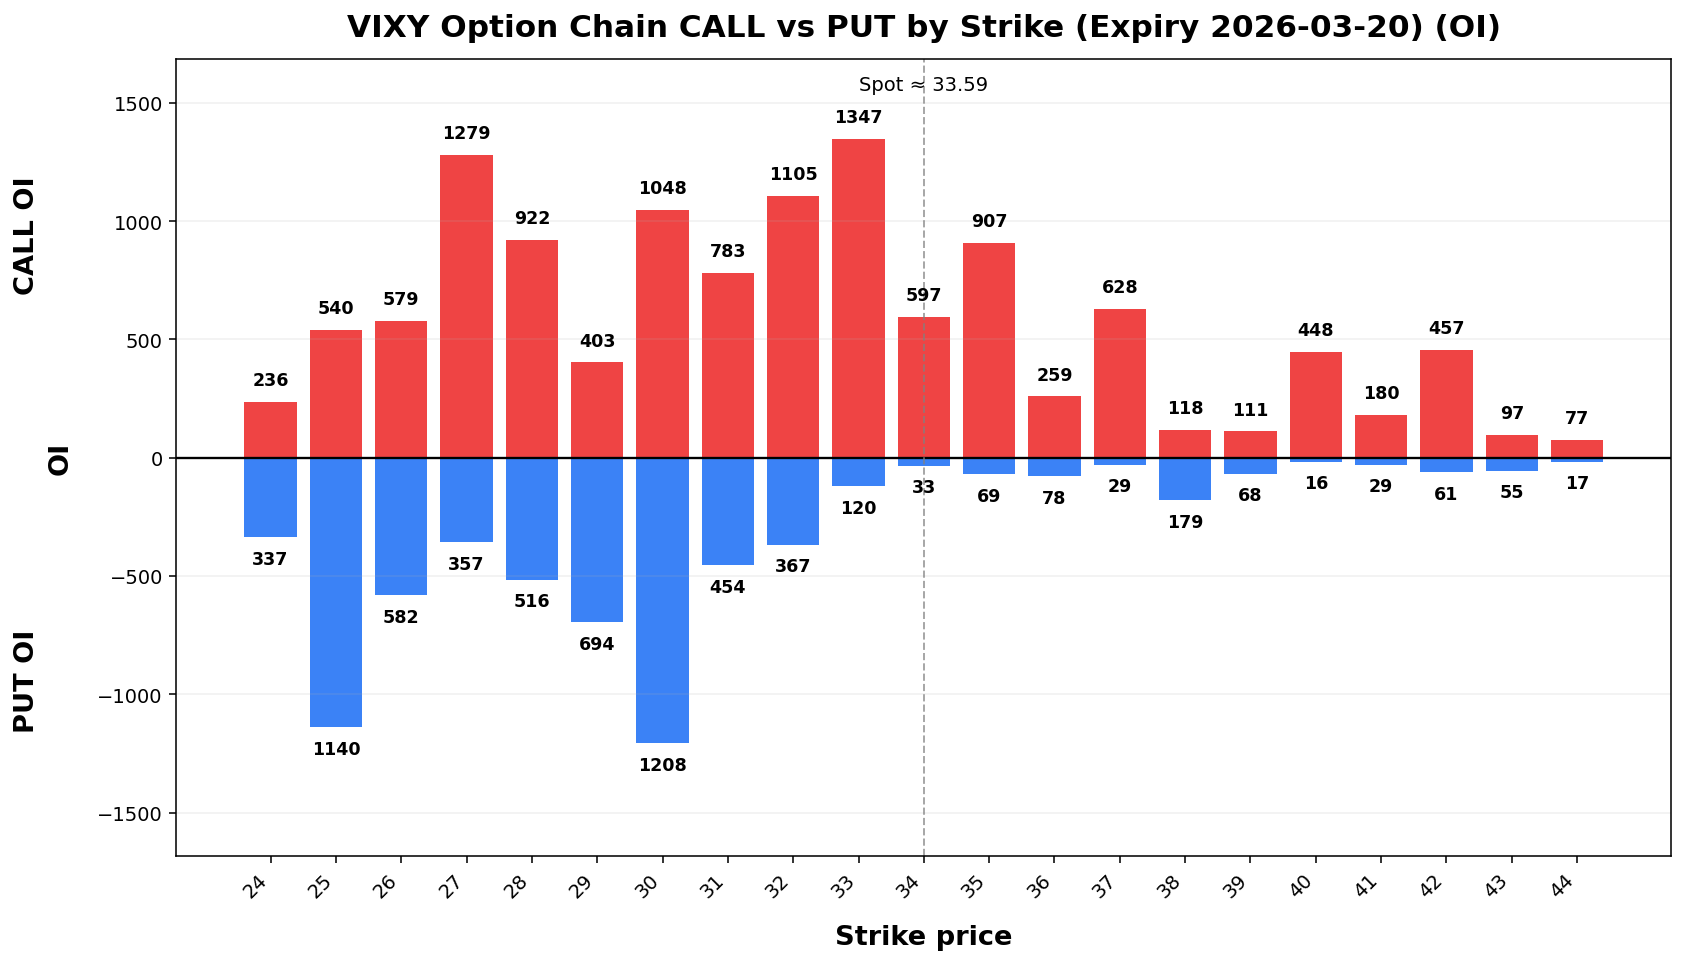
Flow & Skew
| Call Vol |
Put Vol |
Vol P/C |
Call OI |
Put OI |
OI P/C |
Skew |
Skew Bias |
3,4212,127 |
2,344316 |
0.6915 |
015,635 |
06,946 |
NA0.44 |
18.75-664.06 vol pts |
PUT_SKEWCALL_SKEW |
Tail Risk
| Q10 |
Q50 |
Q90 |
Down Tail |
Up Tail |
Down/Up |
5.5926.43 |
31.74 |
37.56 |
7.9416 |
46.31 |
38.773.97 |
1.95 |
19.9180 |
Daily Technicals
| EMA20 |
EMA50 |
VWAP20 |
BB Lower |
BB Mid |
BB Upper |
BB Width |
Vol Ratio |
Path |
39.30.58 |
29.22 |
30.47 |
39.85 |
23.0025.02 |
38.6730.09 |
54.3535.17 |
81.08%33.72% |
1.0121 |
UP trend (expanding) |
Day Plan
36.68-52.0433.00-35.00 range: fade extremes- >
52.04:35.00: chase only if hold + vol
- <
36.68:33.00: risk expand; reduce size
- Regime: TRANSITION
- Tech: UP trend (expanding)
Swing Plan
- Accumulate:
36.68-36.6833.00-33.00
- Trim:
52.04-52.0435.00-35.00
- Add: close >
52.0435.00
- Cut: close <
36.6833.00
- Best for: transition regime
Raw Text Summary
📌 AXTIVIXY @ 44.3633.59 (2026-03-1819 03:08:42 PMAM MYT)

• Current price is **44.36*33.59**. Key support is around **36.68*33.00**, and resistance is around **52.04*35.00**.
• For the next week, the model’s **68% expected range** is roughly **36.6826.05 to 52.04*41.13**.
• A wider **90% range** is about **31.7321.19 to 56.45.99**.
• Dealer positioning looks **NEUTRALLONG gamma**, so the market behavior is classified as **TRANSITION**.
• The estimated **gamma flip** is near **22.18*99**. Crossing and holding beyond this area can change the trading behavior.
• Approximate breakout odds: **above resistance 15.3%41.8%**, **below support 18.3%38.5%** by the target horizon.
• Options skew is tilted toward **puts*calls**, which suggests tradersupside arespeculation payingis morerelatively for downside protection.stronger.
• Near-term implied volatility is higher than the next expiry (**IV1 146.79%320.93% vs IV2 111.85%77.12%**), which suggests **near-term event stress / backwardation**.
• On the daily chart, the stock currently looks like **UP trend (expanding)**.
• The implied distribution shows **heavier downside tail risk** than upside tail potential.
CRCA
Spot: 87.72
Report Time: 2026-03-19 08:43 AM MYT
Regime: TRANSITION
Dealer Gamma: LONG
Term Structure
| Expiry |
DTE |
Forward |
ATM IV |
ATM Straddle |
| 2026-03-20 |
2 |
85.86 |
296.08% |
18.25 |
| 2026-04-17 |
30 |
87.31 |
146.56% |
36.72 |
Weekly Range
| Confidence |
Low |
High |
Width |
| 68% |
64.69 |
110.75 |
46.07 |
| 80% |
58.20 |
117.24 |
59.04 |
| 90% |
49.83 |
125.61 |
75.77 |
| 95% |
42.58 |
132.86 |
90.29 |
Structure & Probabilities
| Support |
Resistance |
Gamma Flip |
Max Pain |
P>Res |
P<Sup |
| 70.00 |
110.75 |
53.38 |
1.00 |
12.1% |
20.2% |
Flow & Skew
| Call Vol |
Put Vol |
Vol P/C |
Call OI |
Put OI |
OI P/C |
Skew |
Skew Bias |
| 1,276 |
288 |
0.23 |
5,873 |
637 |
0.11 |
32.03 vol pts |
PUT_SKEW |
Tail Risk
| Q10 |
Q50 |
Q90 |
Down Tail |
Up Tail |
Down/Up |
| 36.73 |
39.62 |
84.20 |
51.00 |
0.00 |
NA |
Daily Technicals
| EMA20 |
EMA50 |
VWAP20 |
BB Lower |
BB Mid |
BB Upper |
BB Width |
Vol Ratio |
Path |
| 58.26 |
48.85 |
46.81 |
10.05 |
52.59 |
95.12 |
161.76% |
0.45 |
UP trend (expanding) |
Day Plan
- 70.00-110.75 range: fade extremes
- > 110.75: chase only if hold + vol
- < 70.00: risk expand; reduce size
- Regime: TRANSITION
- Tech: UP trend (expanding)
Swing Plan
- Accumulate: 70.00-70.00
- Trim: 110.75-110.75
- Add: close > 110.75
- Cut: close < 70.00
- Best for: transition regime
Raw Text Summary
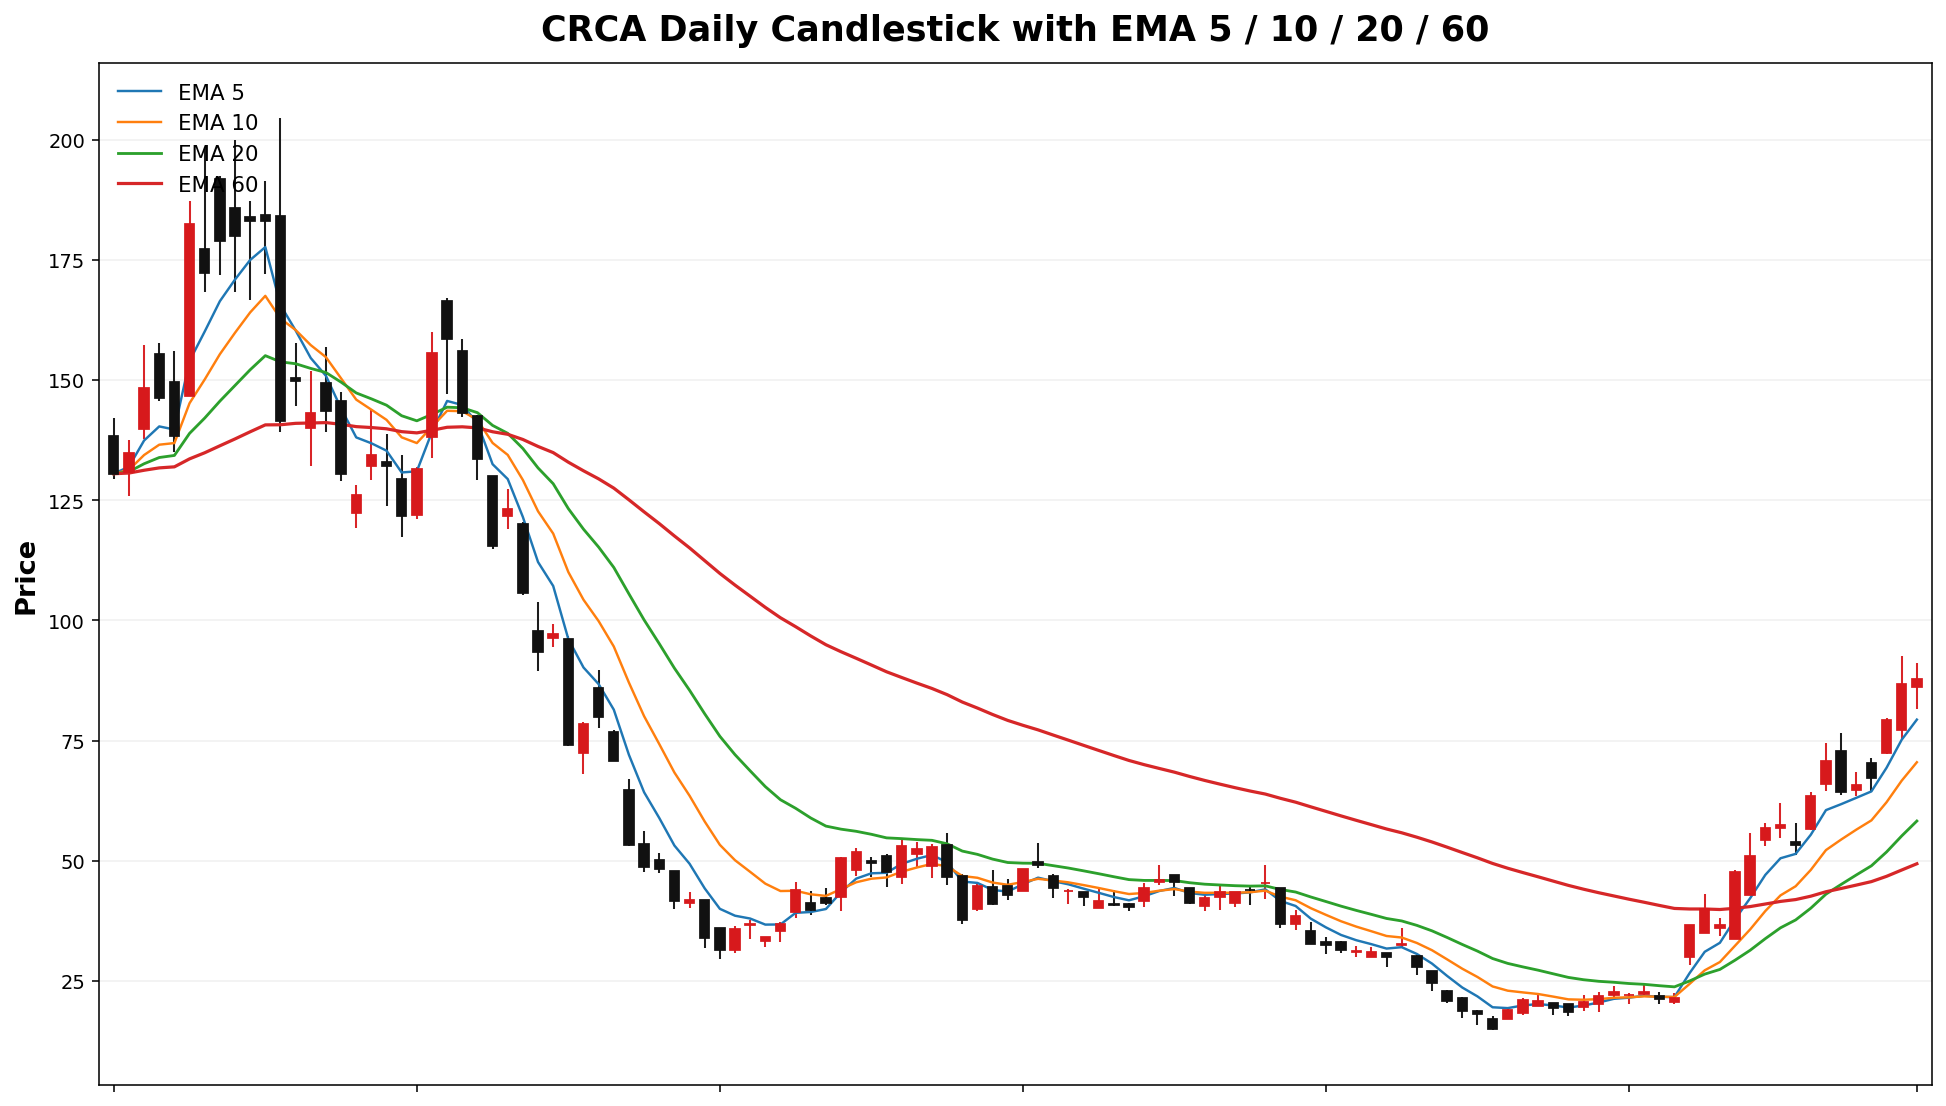
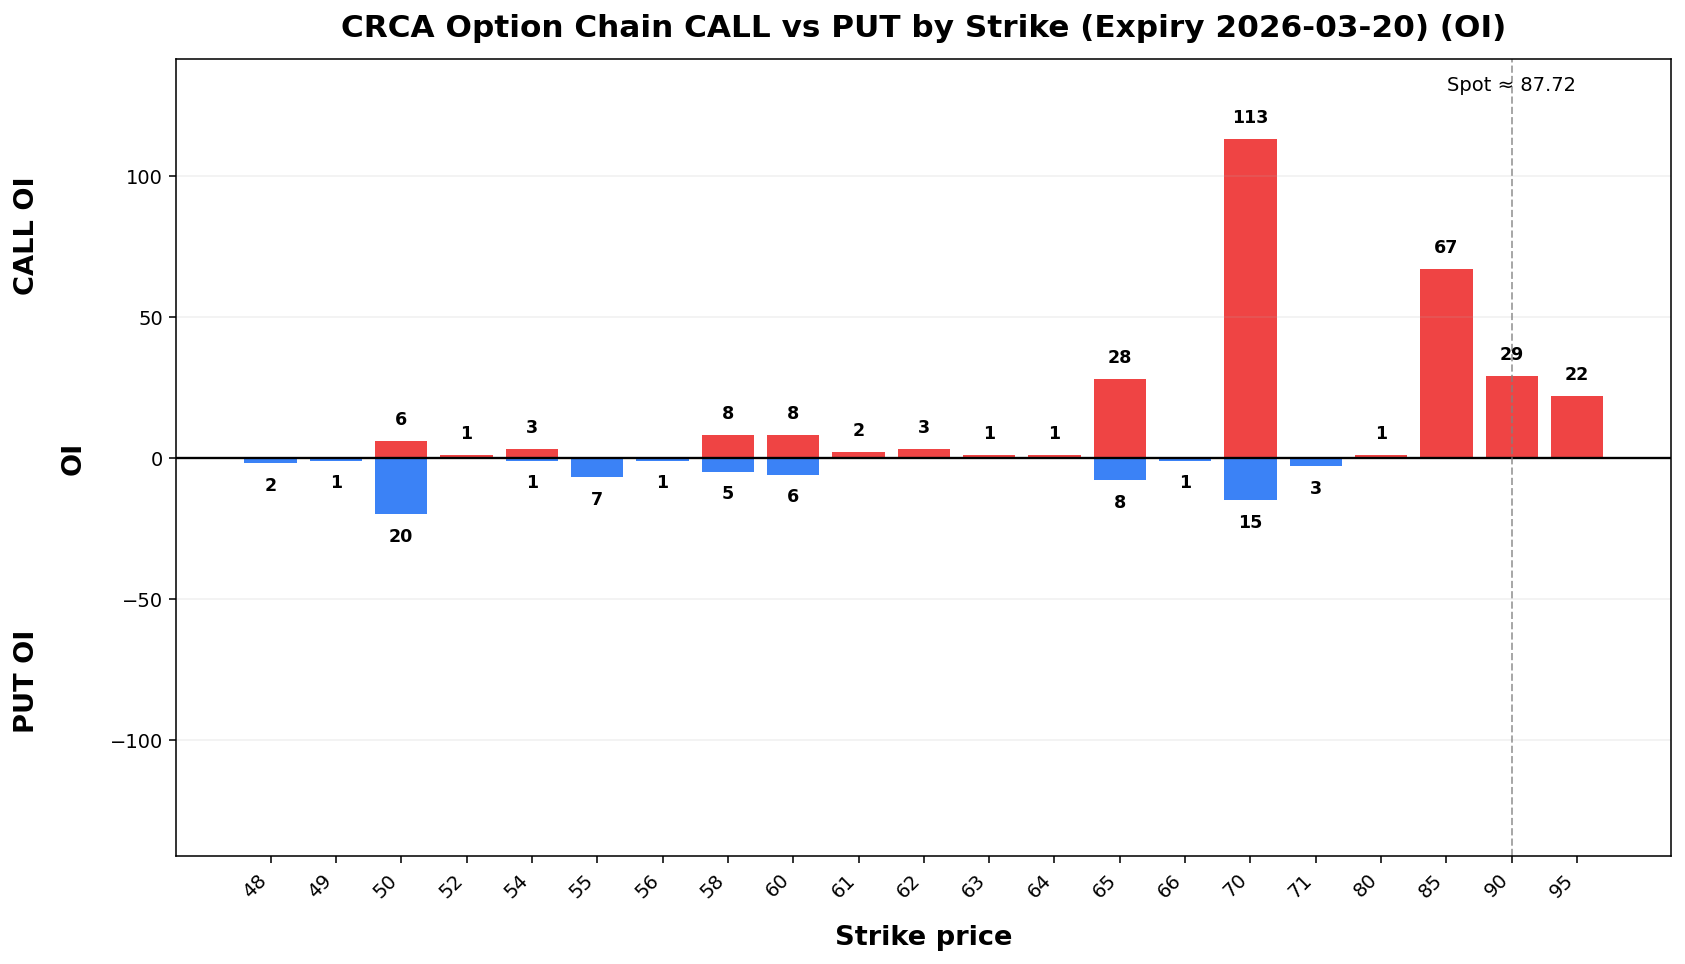
📌 CRCA @ 87.72 (2026-03-19 08:43 AM MYT)

• Current price is **87.72**. Key support is around **70.00**, and resistance is around **110.75**.
• For the next week, the model’s **68% expected range** is roughly **64.69 to 110.75**.
• A wider **90% range** is about **49.83 to 125.61**.
• Dealer positioning looks **LONG gamma**, so the market behavior is classified as **TRANSITION**.
• The estimated **gamma flip** is near **53.38**. Crossing and holding beyond this area can change the trading behavior.
• Approximate breakout odds: **above resistance 12.1%**, **below support 20.2%** by the target horizon.
• Options skew is tilted toward **puts**, which suggests traders are paying more for downside protection.
• Near-term implied volatility is higher than the next expiry (**IV1 296.08% vs IV2 146.56%**), which suggests **near-term event stress / backwardation**.
• Recent volume is only **0.45x** the 20-day average, so breakouts may be less reliable unless volume improves.
• On the daily chart, the stock currently looks like **UP trend (expanding)**.
AAOI
Spot: 92.63
Report Time: 2026-03-19 08:43 AM MYT
Regime: TRANSITION
Dealer Gamma: LONG
Term Structure
| Expiry |
DTE |
Forward |
ATM IV |
ATM Straddle |
| 2026-03-20 |
2 |
92.62 |
137.51% |
8.95 |
| 2026-03-27 |
9 |
92.68 |
101.18% |
14.55 |
Weekly Range
| Confidence |
Low |
High |
Width |
| 68% |
79.12 |
106.14 |
27.01 |
| 80% |
75.32 |
109.94 |
34.62 |
| 90% |
70.41 |
114.85 |
44.43 |
| 95% |
66.16 |
119.10 |
52.95 |
Structure & Probabilities
| Support |
Resistance |
Gamma Flip |
Max Pain |
P>Res |
P<Sup |
| 90.00 |
100.00 |
87.23 |
64.00 |
24.0% |
41.5% |
Flow & Skew
| Call Vol |
Put Vol |
Vol P/C |
Call OI |
Put OI |
OI P/C |
Skew |
Skew Bias |
| 19,608 |
10,464 |
0.53 |
44,568 |
34,583 |
0.78 |
14.65 vol pts |
PUT_SKEW |
Tail Risk
| Q10 |
Q50 |
Q90 |
Down Tail |
Up Tail |
Down/Up |
| 80.46 |
93.80 |
104.82 |
12.17 |
12.19 |
1.00 |
Daily Technicals
| EMA20 |
EMA50 |
VWAP20 |
BB Lower |
BB Mid |
BB Upper |
BB Width |
Vol Ratio |
Path |
| 87.42 |
66.98 |
93.12 |
37.66 |
86.67 |
135.67 |
113.08% |
1.23 |
UP trend (expanding) |
Day Plan
- 90.00-100.00 range: fade extremes
- > 100.00: chase only if hold + vol
- < 90.00: risk expand; reduce size
- Regime: TRANSITION
- Tech: UP trend (expanding)
Swing Plan
- Accumulate: 90.00-90.00
- Trim: 100.00-100.00
- Add: close > 100.00
- Cut: close < 90.00
- Best for: transition regime
Raw Text Summary
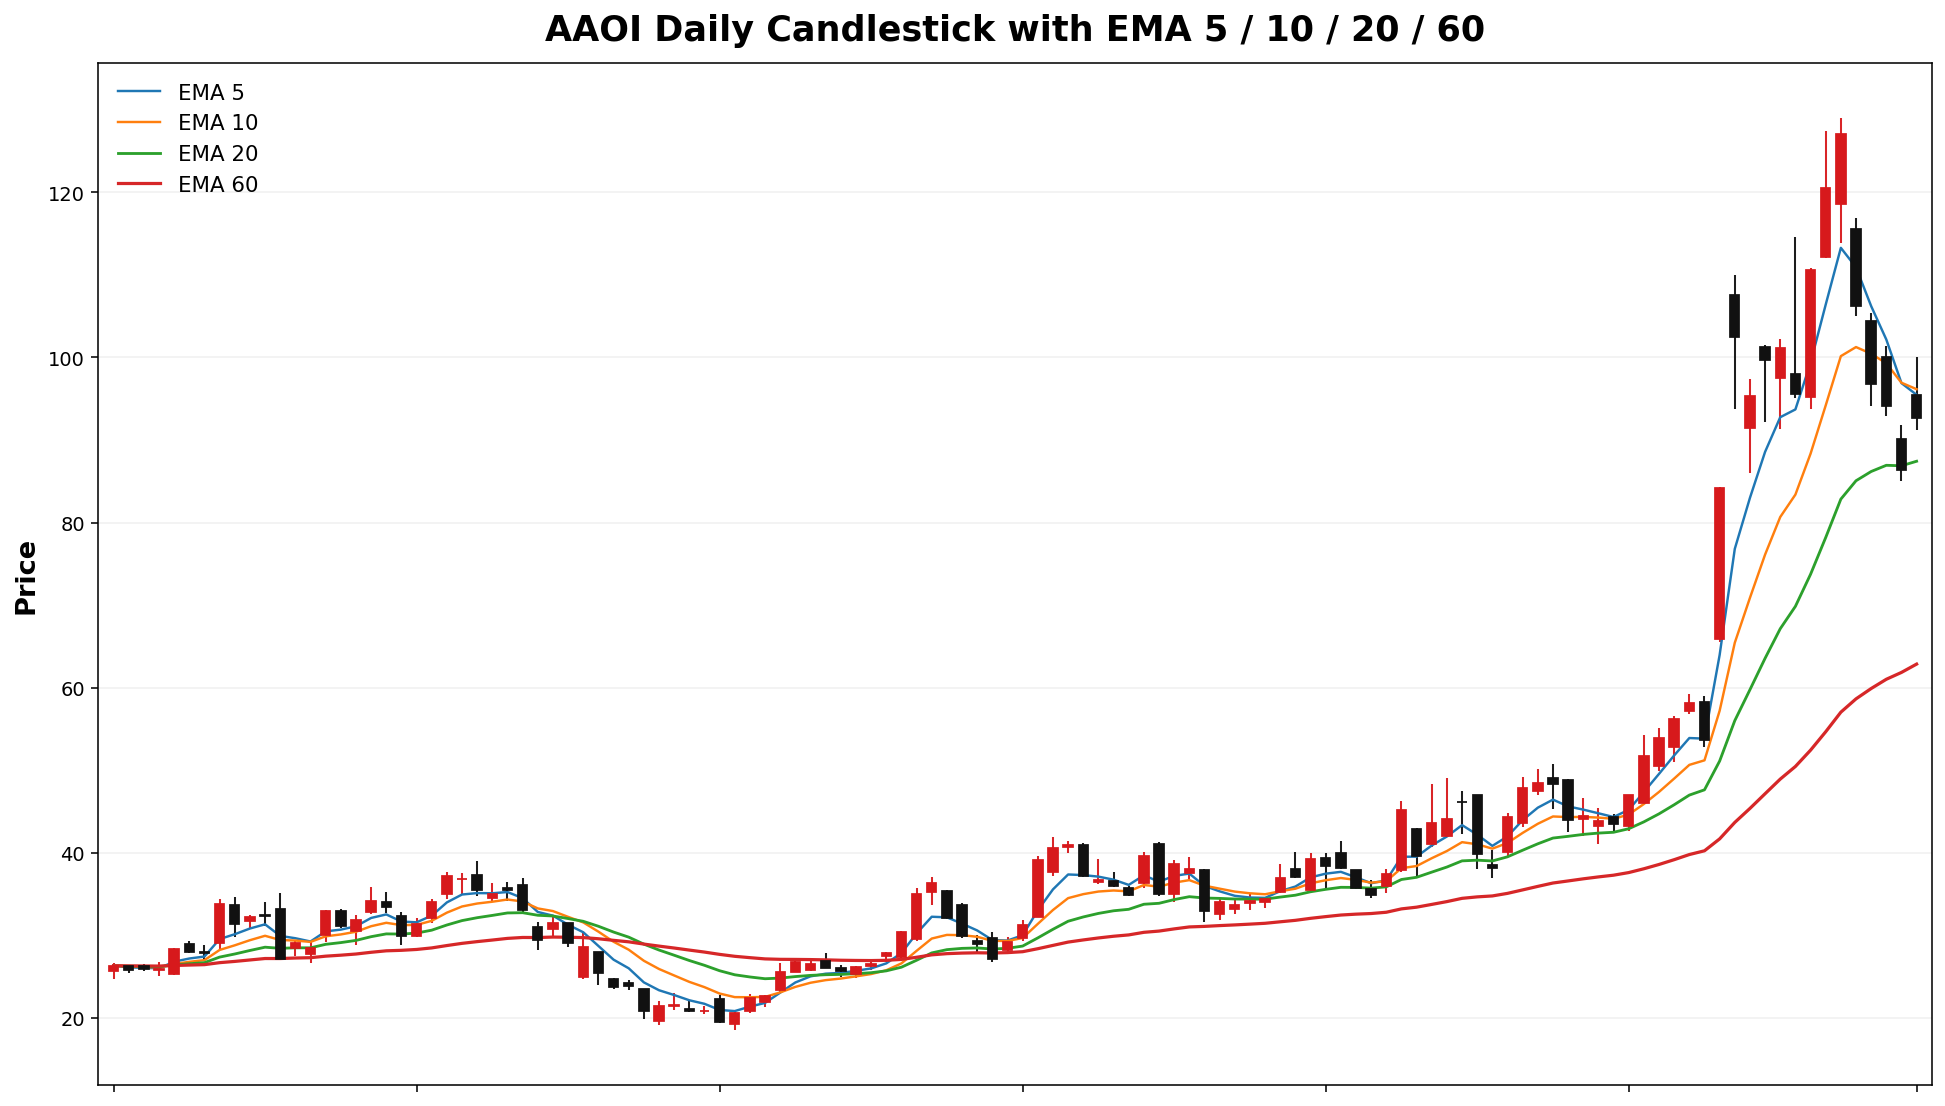
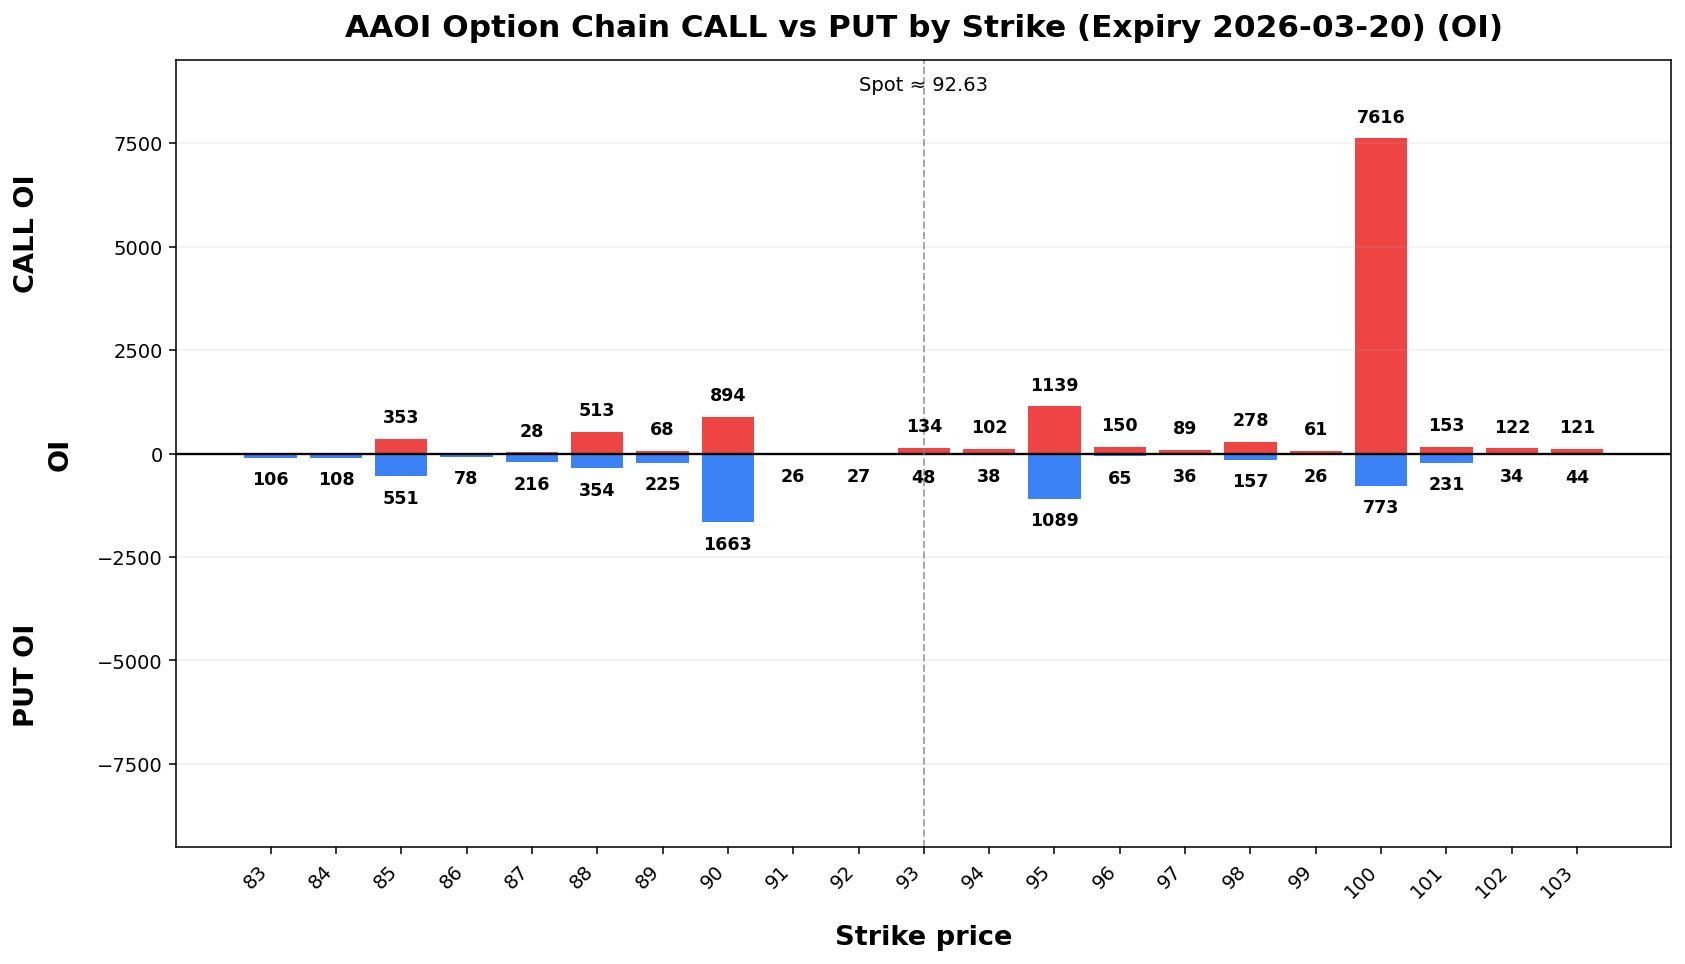
📌 AAOI @ 92.63 (2026-03-19 08:43 AM MYT)

• Current price is **92.63**. Key support is around **90.00**, and resistance is around **100.00**.
• For the next week, the model’s **68% expected range** is roughly **79.12 to 106.14**.
• A wider **90% range** is about **70.41 to 114.85**.
• Dealer positioning looks **LONG gamma**, so the market behavior is classified as **TRANSITION**.
• The estimated **gamma flip** is near **87.23**. Crossing and holding beyond this area can change the trading behavior.
• Approximate breakout odds: **above resistance 24.0%**, **below support 41.5%** by the target horizon.
• Options skew is tilted toward **puts**, which suggests traders are paying more for downside protection.
• Near-term implied volatility is higher than the next expiry (**IV1 137.51% vs IV2 101.18%**), which suggests **near-term event stress / backwardation**.
• On the daily chart, the stock currently looks like **UP trend (expanding)**.
• The implied distribution is **fairly balanced** between upside and downside tails.