Analysis Report
Updated: 2026-03-2324 08:43:0810 MYT
Source File: combined-summary-20260323-084308.20260324-084309.md
Screening Source: screen-report-20260323-084247.20260324-084249.md
Extracted Symbols: UVXY,AAOI, USO, LQDAUVXY
Topline Summary
| Symbol |
Spot |
Support |
Resistance |
Flip |
Regime |
P>Res |
P<Sup |
68% Range |
90% Range |
UVXYAAOI |
54.1095.76 |
52.95.00 |
55.97.00 |
29.7880.63 |
TRANSITIONTREND |
45.8%48.1% |
34.7%59.2% |
43.4181.38 - 64.79110.14 |
36.5172.10 - 71.69119.42 |
| USO |
121.43110.56 |
110.00 |
115.00 |
120.38 |
TREND |
42.1% |
64.4% |
96.16 - 124.96 |
86.87 - 134.25 |
| UVXY |
49.88 |
45.00 |
123.50.00 |
114.3928.64 |
TRANSITION |
37.5% |
45.2% |
107.18 - 135.68 |
97.99 - 144.87 |
LQDA |
36.41 |
33.00 |
42.00 |
28.71 |
TREND44.3% |
19.9% |
28.2%42.11 - 57.65 |
30.7637.10 - 42.06 |
27.12 - 45.7062.66 |
UVXYAAOI
Spot: 54.1095.76
Report Time: 2026-03-2324 08:42 AM MYT
Regime: TRANSITIONTREND
Dealer Gamma: LONGSHORT
Term Structure
| Expiry |
DTE |
Forward |
ATM IV |
ATM Straddle |
| 2026-03-27 |
54 |
53.6395.72 |
148.29%116.66% |
9.2011.40 |
| 2026-04-02 |
1110 |
53.6895.72 |
134.88%103.58% |
12.5516.25 |
Weekly Range
| Confidence |
Low |
High |
Width |
| 68% |
43.4181.38 |
64.79110.14 |
21.3828.77 |
| 80% |
40.4077.33 |
67.80114.19 |
27.4036.87 |
| 90% |
36.5172.10 |
71.69119.42 |
35.1747.32 |
| 95% |
33.1467.57 |
75.06123.95 |
41.9156.39 |
Structure & Probabilities
| Support |
Resistance |
Gamma Flip |
Max Pain |
P>Res |
P<Sup |
52.95.00 |
55.97.00 |
29.7880.63 |
42.90.00 |
45.8%48.1% |
34.7% |
Flow & Skew
Call Vol |
Put Vol |
Vol P/C |
Call OI |
Put OI |
OI P/C |
Skew |
Skew Bias |
|---|
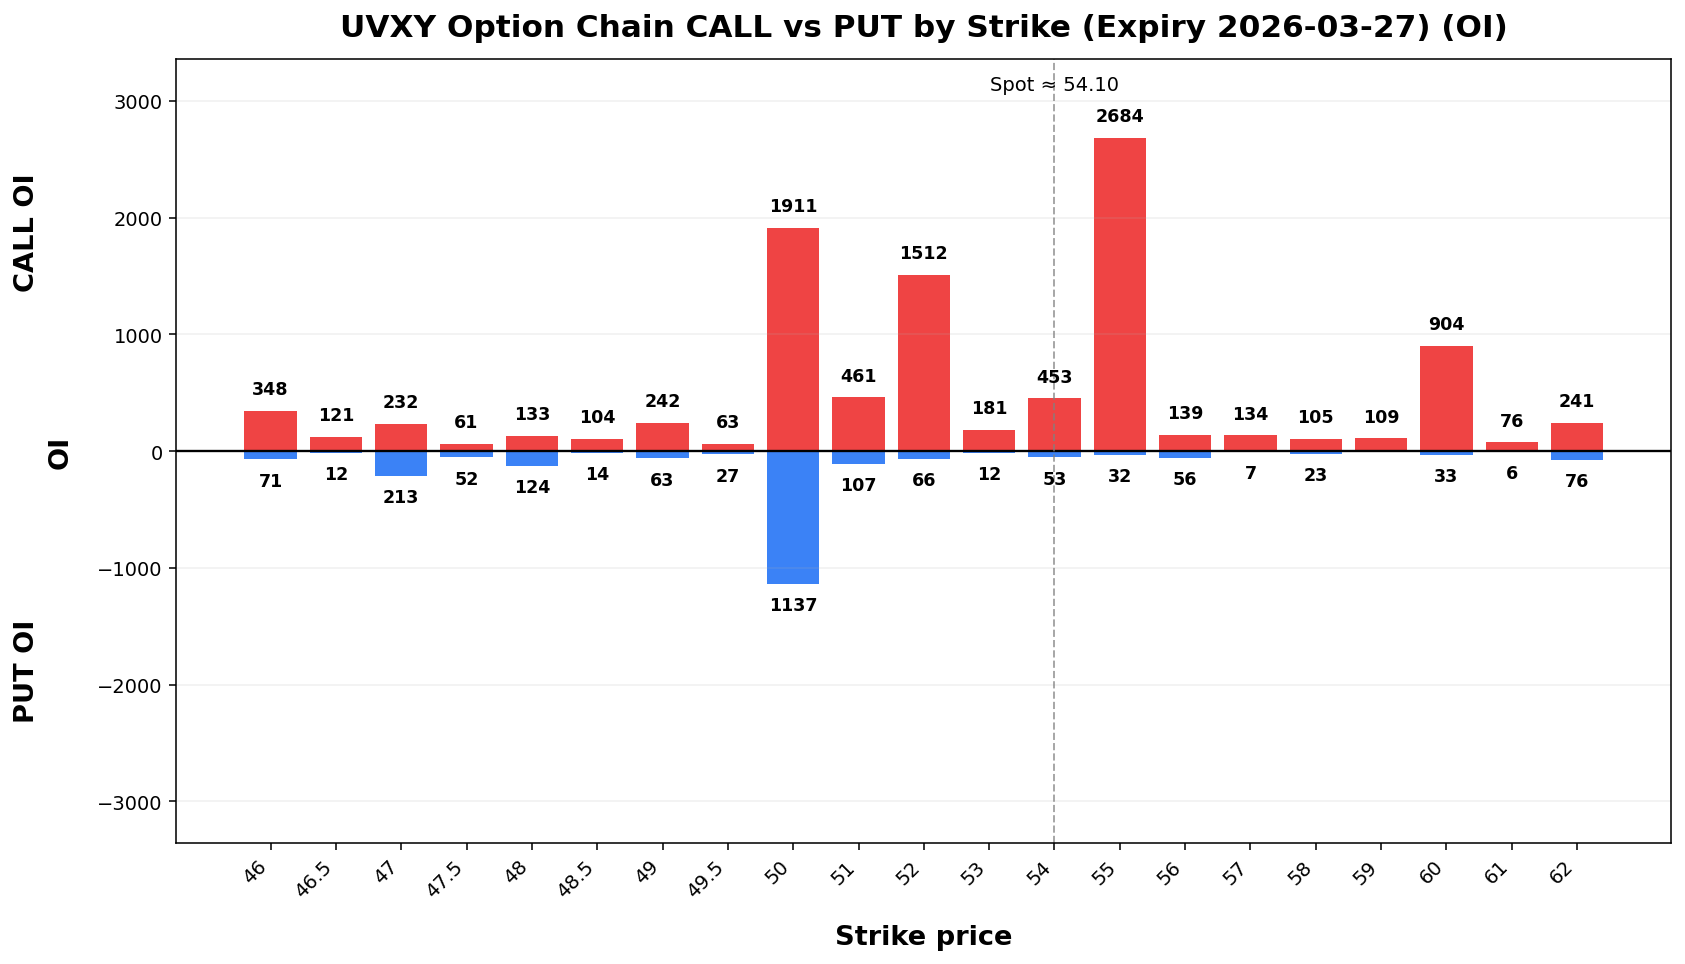
15,091 |
5,542 |
0.37 |
22,037 |
8,221 |
0.37 |
-38.67 vol pts |
CALL_SKEW |
Tail Risk
Q10 |
Q50 |
Q90 |
Down Tail |
Up Tail |
Down/Up |
|---|
28.98 |
48.34 |
68.45 |
25.12 |
14.35 |
1.75 |
Daily Technicals
EMA20 |
EMA50 |
VWAP20 |
BB Lower |
BB Mid |
BB Upper |
BB Width |
Vol Ratio |
Path |
|---|
46.31 |
43.38 |
45.55 |
34.30 |
45.36 |
56.43 |
48.79% |
0.90 |
UP trend (expanding) |
Day Plan
52.00-55.00 range: fade extremes
> 55.00: chase only if hold + vol
< 52.00: risk expand; reduce size
Regime: TRANSITION
Tech: UP trend (expanding)
Swing Plan
Accumulate: 52.00-52.00
Trim: 55.00-55.00
Add: close > 55.00
Cut: close < 52.00
Best for: transition regime
Raw Text Summary
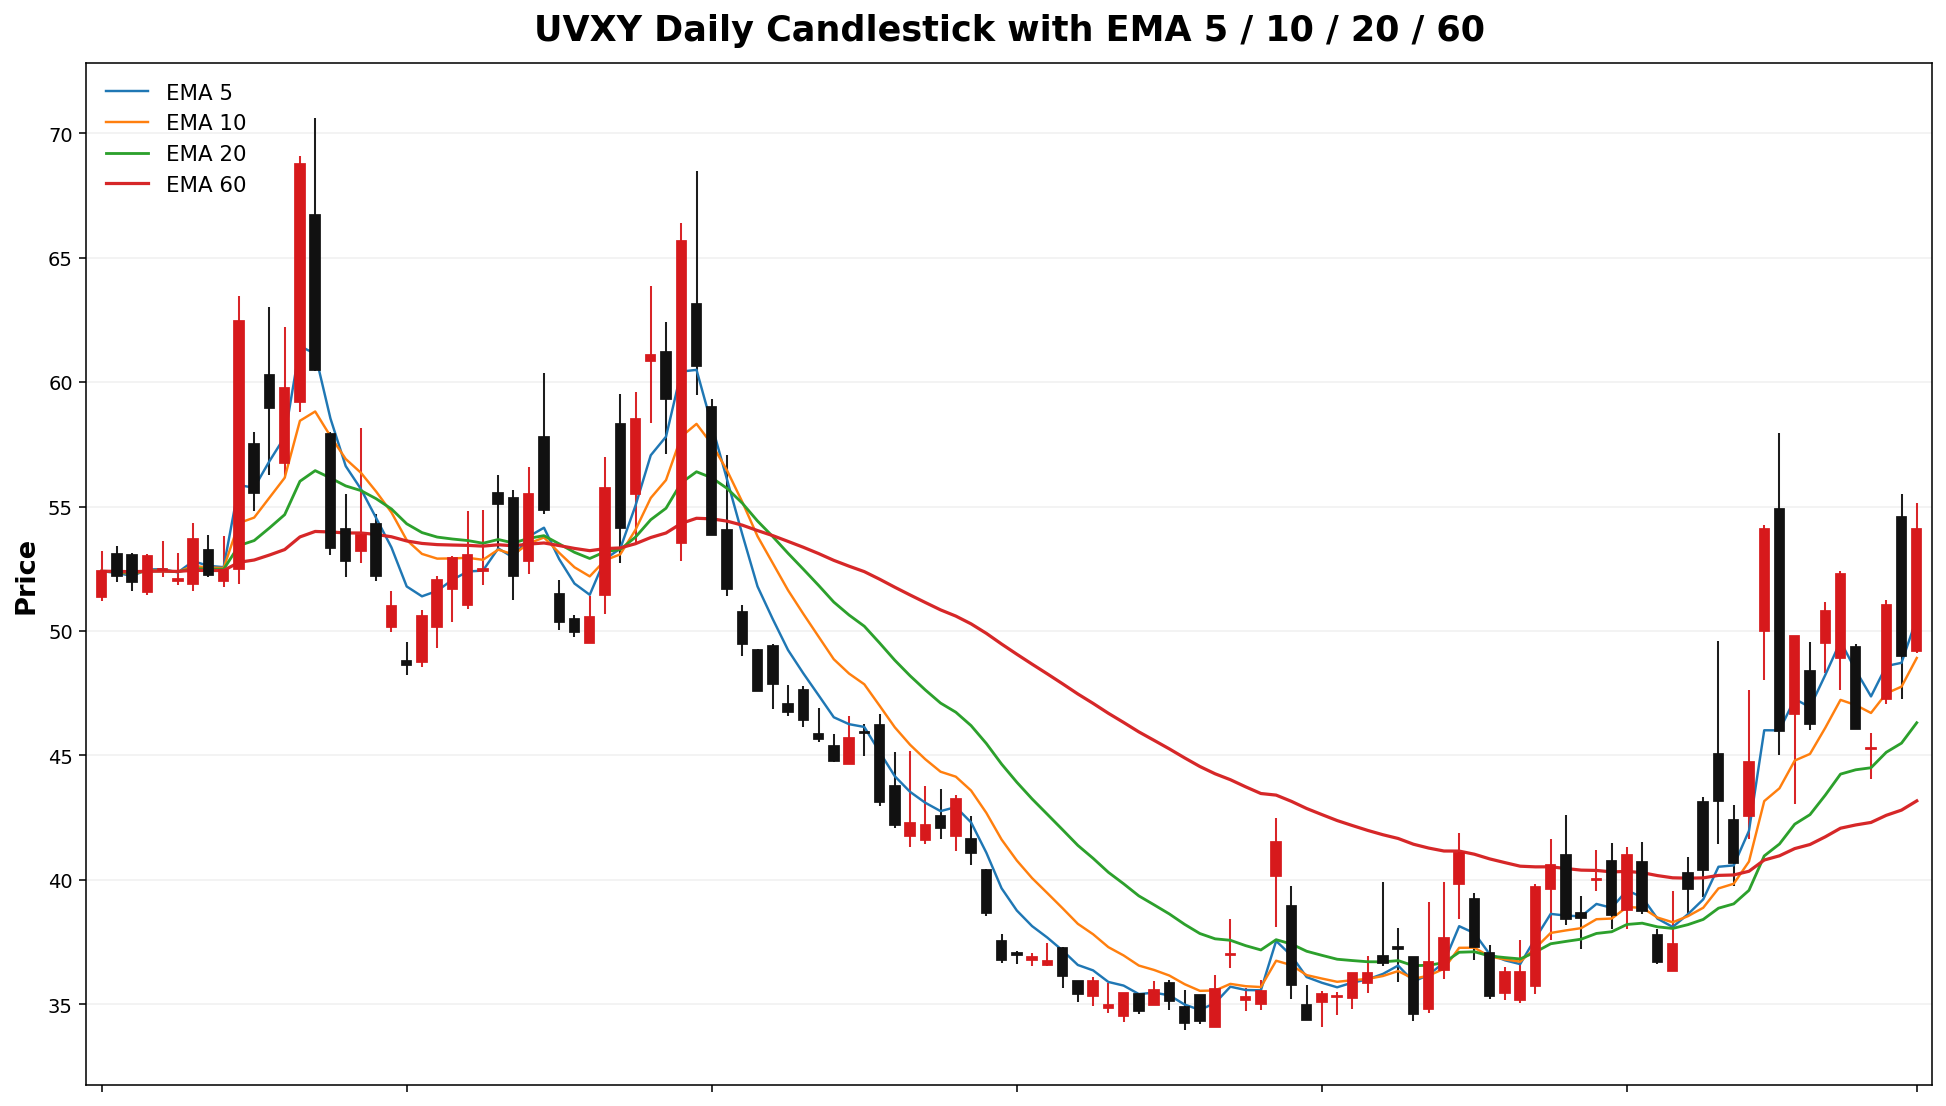
📌 UVXY @ 54.10 (2026-03-23 08:42 AM MYT)

• Current price is **54.10**. Key support is around **52.00**, and resistance is around **55.00**.
• For the next week, the model’s **68% expected range** is roughly **43.41 to 64.79**.
• A wider **90% range** is about **36.51 to 71.69**.
• Dealer positioning looks **LONG gamma**, so the market behavior is classified as **TRANSITION**.
• The estimated **gamma flip** is near **29.78**. Crossing and holding beyond this area can change the trading behavior.
• Approximate breakout odds: **above resistance 45.8%**, **below support 34.7%** by the target horizon.
• Options skew is tilted toward **calls**, which suggests upside speculation is relatively stronger.
• Near-term implied volatility is higher than the next expiry (**IV1 148.29% vs IV2 134.88%**), which suggests **near-term event stress / backwardation**.
• On the daily chart, the stock currently looks like **UP trend (expanding)**.
• The implied distribution shows **heavier downside tail risk** than upside tail potential.
USO
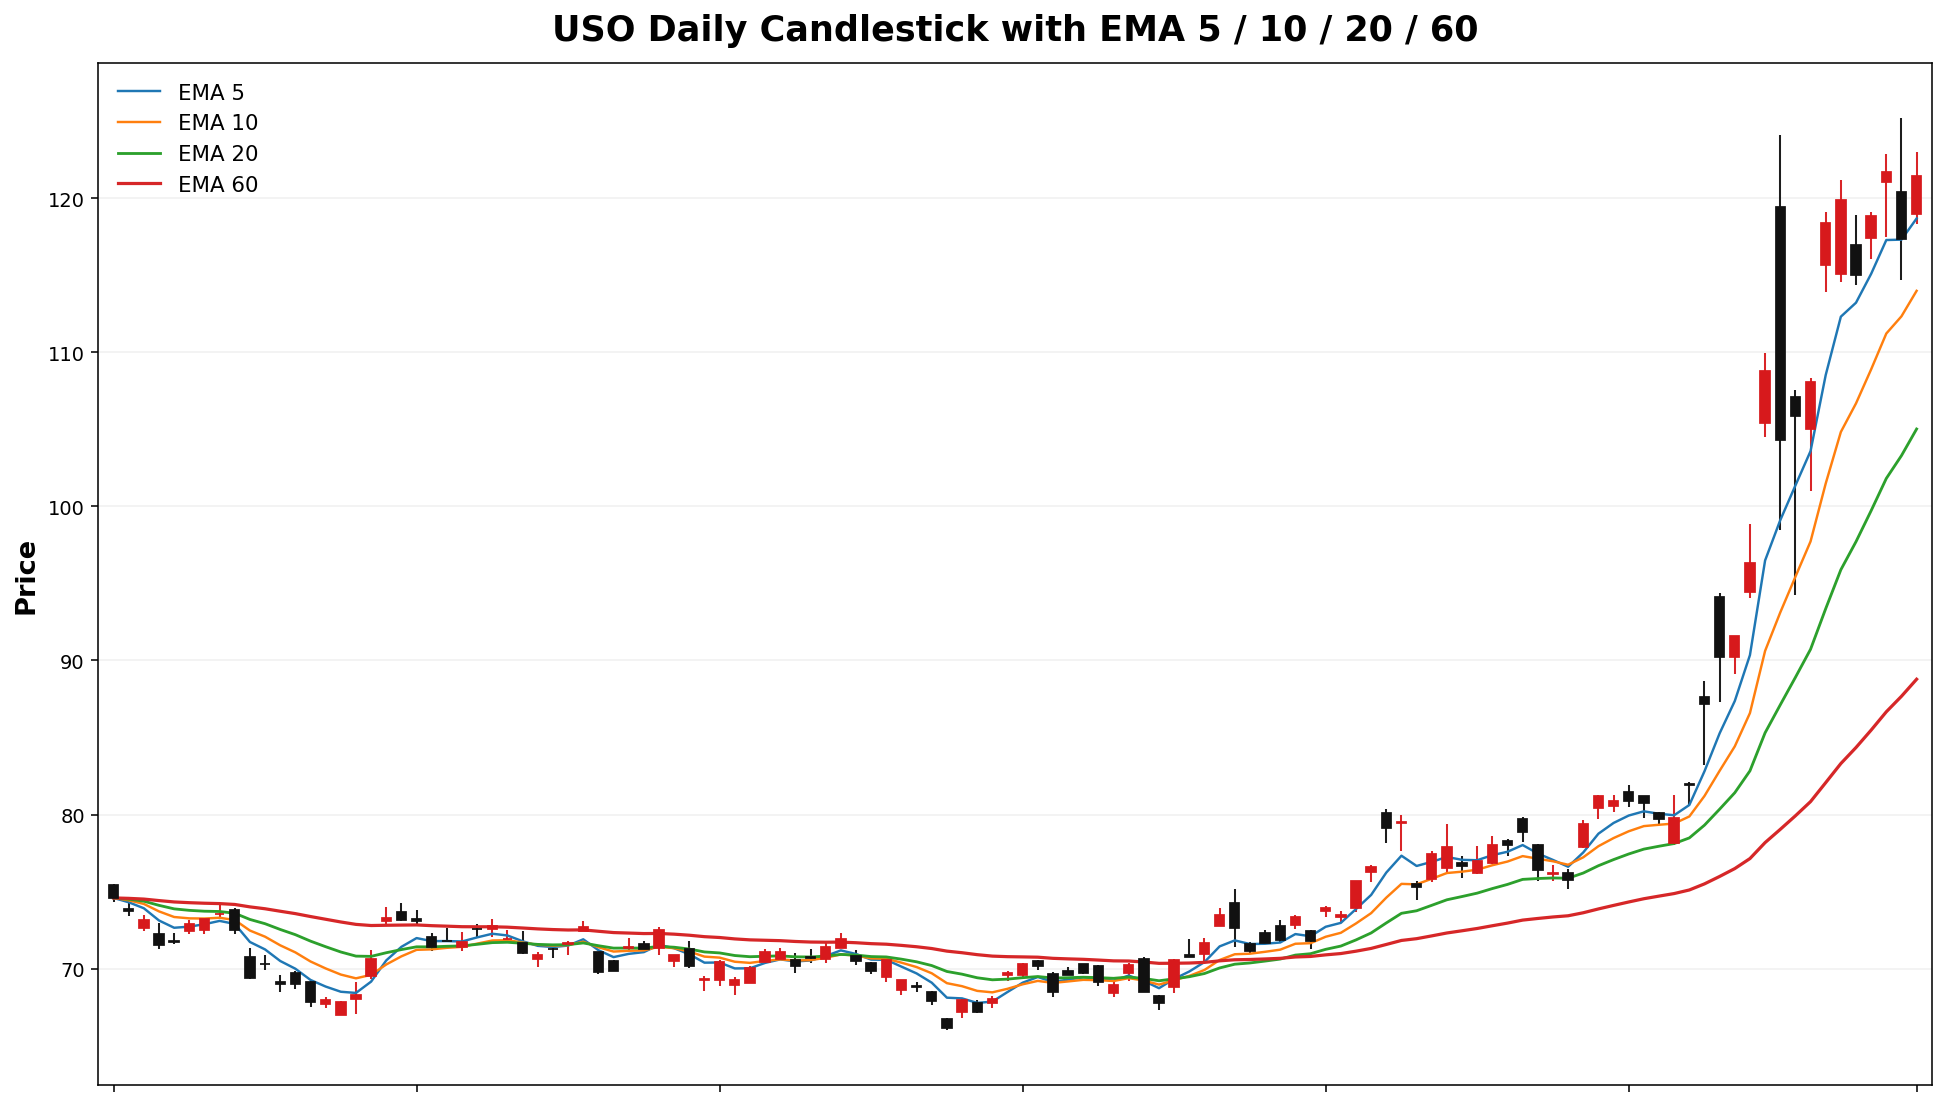
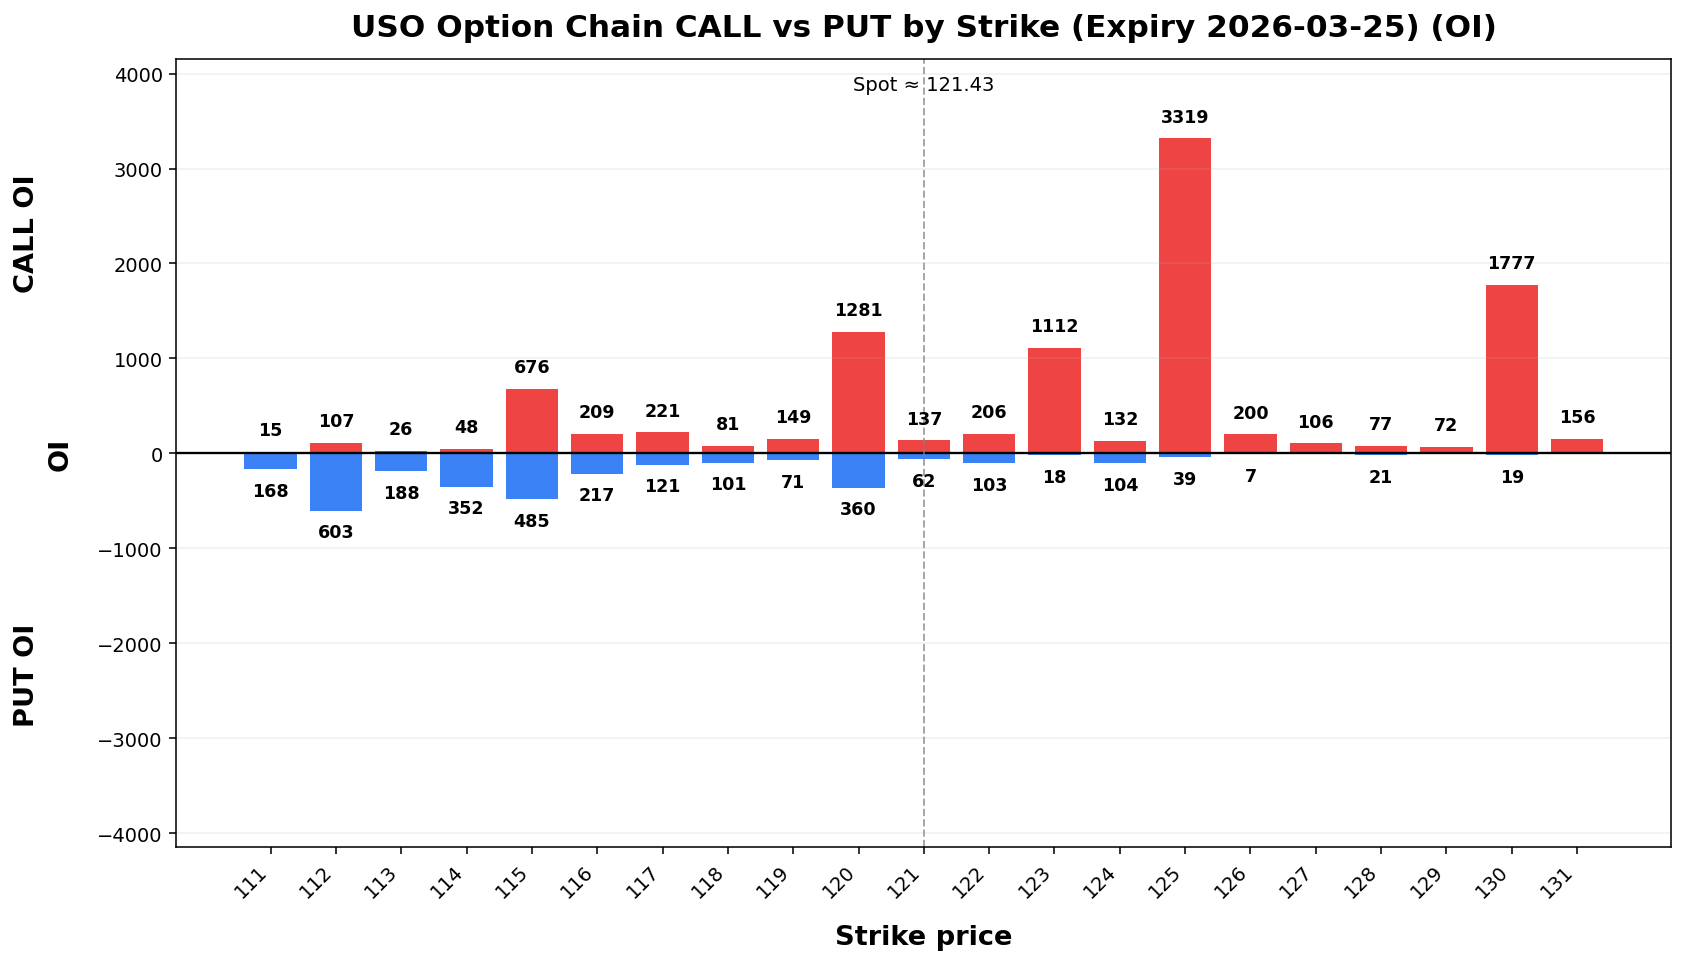
Spot: 121.43
Report Time: 2026-03-23 08:43 AM MYT
Regime: TRANSITION
Dealer Gamma: LONG
Term Structure
Expiry |
DTE |
Forward |
ATM IV |
ATM Straddle |
|---|
2026-03-25 |
3 |
121.53 |
100.11% |
10.65 |
2026-03-27 |
5 |
121.55 |
89.05% |
12.40 |
Weekly Range
Confidence |
Low |
High |
Width |
|---|
68% |
107.18 |
135.68 |
28.50 |
80% |
103.17 |
139.69 |
36.52 |
90% |
97.99 |
144.87 |
46.88 |
95% |
93.50 |
149.36 |
55.86 |
Structure & Probabilities
Support |
Resistance |
Gamma Flip |
Max Pain |
P>Res |
P<Sup |
|---|
120.00 |
123.00 |
114.39 |
115.00 |
37.5% |
45.59.2% |
Flow & Skew
| Call Vol |
Put Vol |
Vol P/C |
Call OI |
Put OI |
OI P/C |
Skew |
Skew Bias |
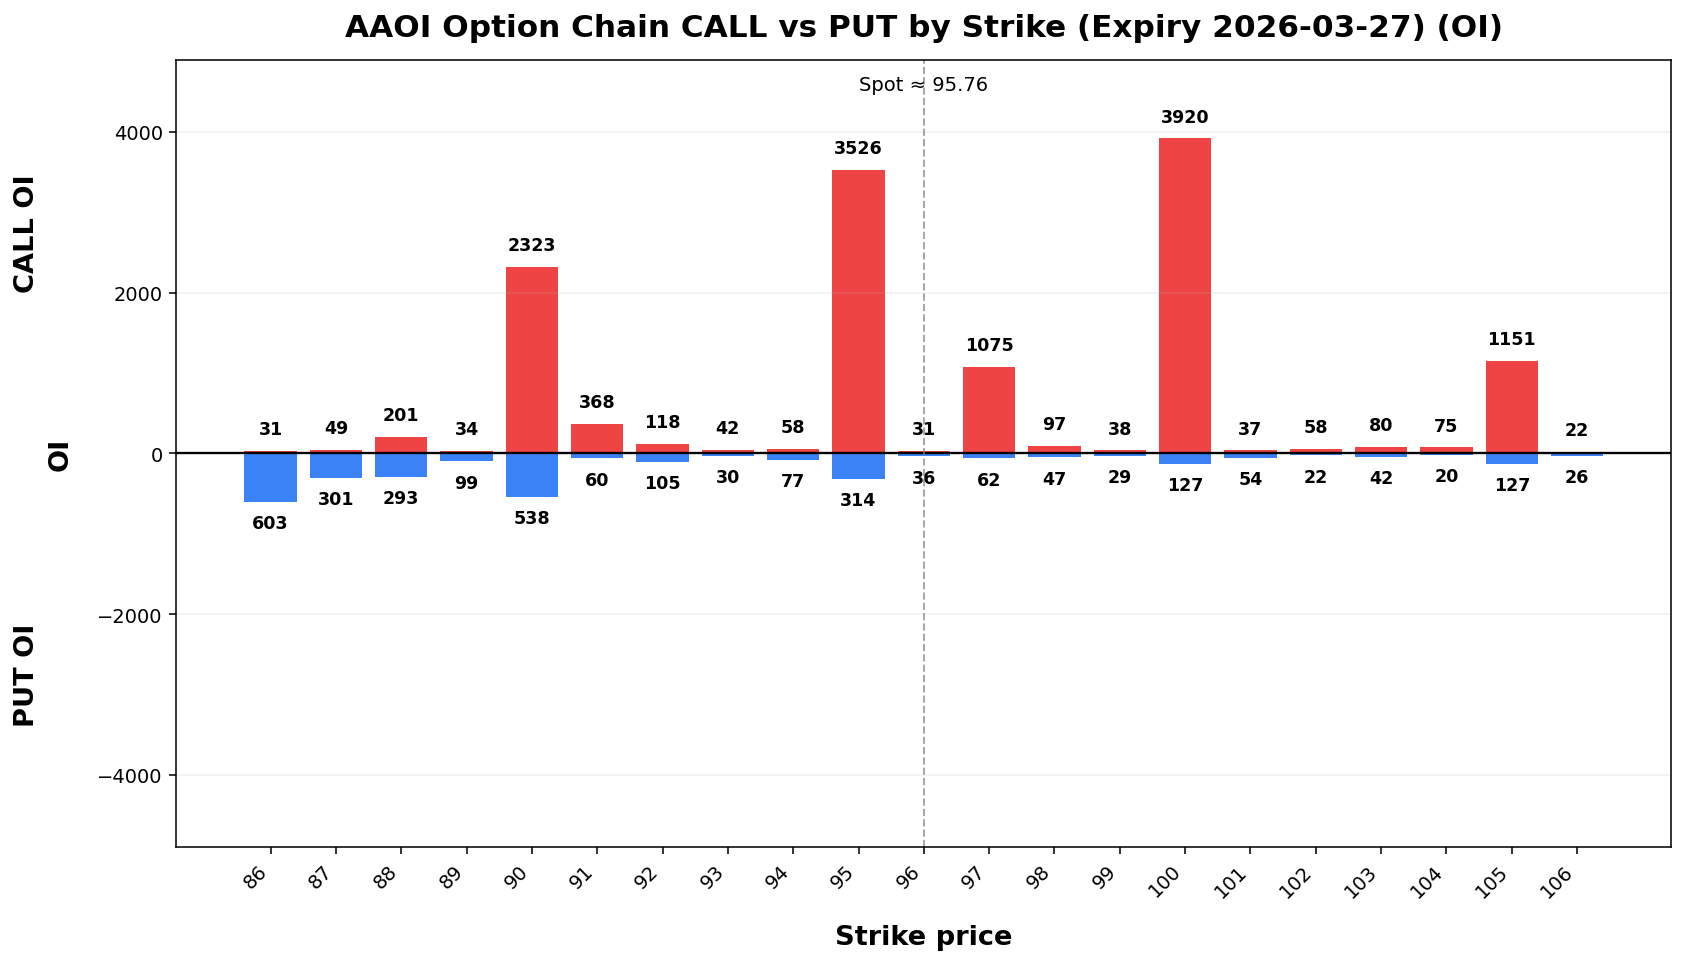
19,84618,570 |
29,7356,292 |
1.500.34 |
16,13919,289 |
18,05714,123 |
1.120.73 |
2.205.96 vol pts |
PUT_SKEW |
Tail Risk
| Q10 |
Q50 |
Q90 |
Down Tail |
Up Tail |
Down/Up |
58.1576.98 |
118.2596.08 |
135.25109.96 |
63.2818.78 |
13.8214.20 |
4.581.32 |
Daily Technicals
| EMA20 |
EMA50 |
VWAP20 |
BB Lower |
BB Mid |
BB Upper |
BB Width |
Vol Ratio |
Path |
105.0289.36 |
91.2170.15 |
107.9296.03 |
69.1954.98 |
101.4093.30 |
133.60131.62 |
63.52%82.14% |
0.8677 |
UP trend (expanding) |
Day Plan
120.95.00-123.97.00 range: fade extremes- >
123.97.00: chase only if hold + vol
- <
120.95.00: risk expand; reduce size
- Regime:
TRANSITIONTREND
- Tech: UP trend (expanding)
Swing Plan
- Accumulate:
120.95.00-120.95.00
- Trim:
123.97.00-123.97.00
- Add: close >
123.97.00
- Cut: close <
120.95.00
- Best for:
transitiontrend regime
Raw Text Summary
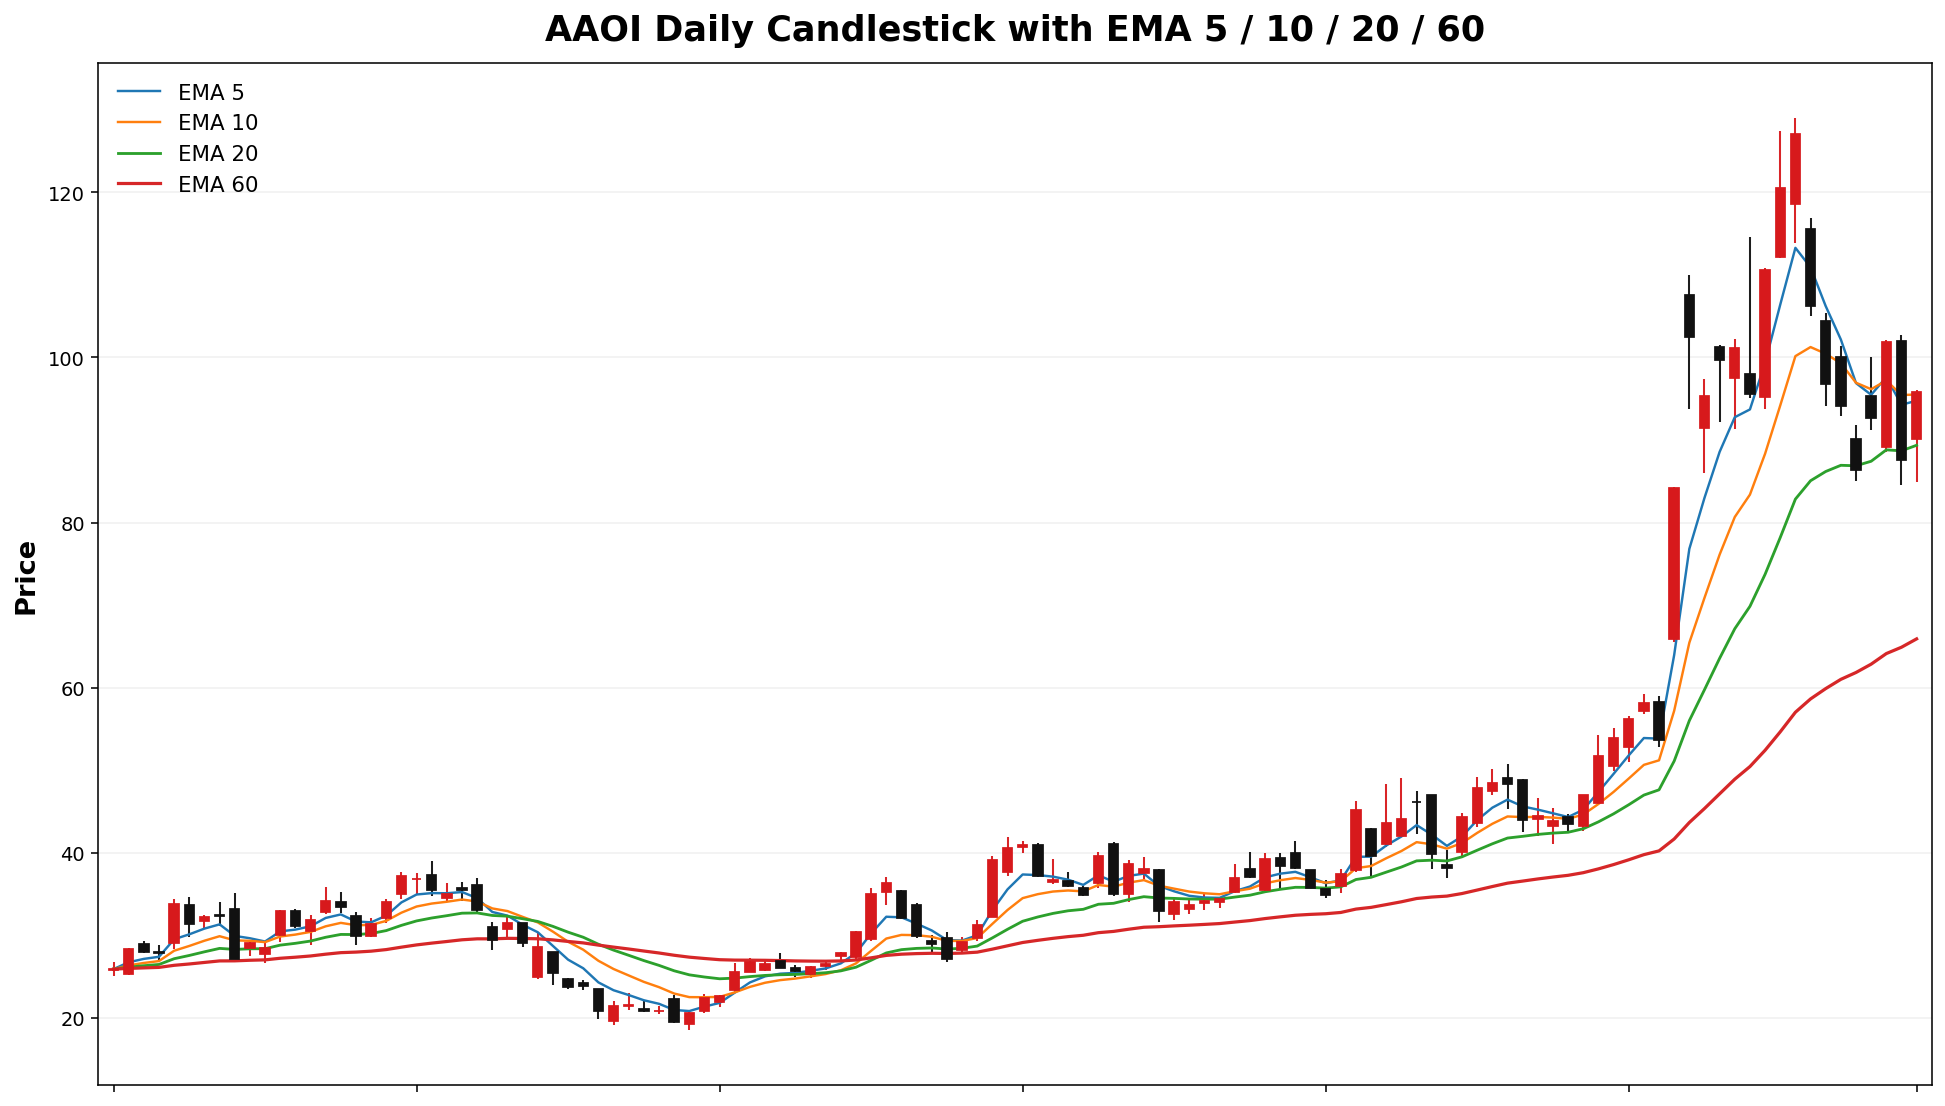
📌 USOAAOI @ 121.4395.76 (2026-03-2324 08:4342 AM MYT)

• Current price is **121.43*95.76**. Key support is around **120.95.00**, and resistance is around **123.97.00**.
• For the next week, the model’s **68% expected range** is roughly **107.1881.38 to 135.68*110.14**.
• A wider **90% range** is about **97.9972.10 to 144.87*119.42**.
• Dealer positioning looks **LONGSHORT gamma**, so the market behavior is classified as **TRANSITION*TREND**.
• The estimated **gamma flip** is near **114.39*80.63**. Crossing and holding beyond this area can change the trading behavior.
• Approximate breakout odds: **above resistance 37.5%48.1%**, **below support 45.59.2%** by the target horizon.
• Options skew is tilted toward **puts**, which suggests traders are paying more for downside protection.
• Near-term implied volatility is higher than the next expiry (**IV1 100.11%116.66% vs IV2 89.05%**), which suggests **near-term event stress / backwardation**.
• On the daily chart, the stock currently looks like **UP trend (expanding)**.
• The implied distribution shows **heavier downside tail risk** than upside tail potential.
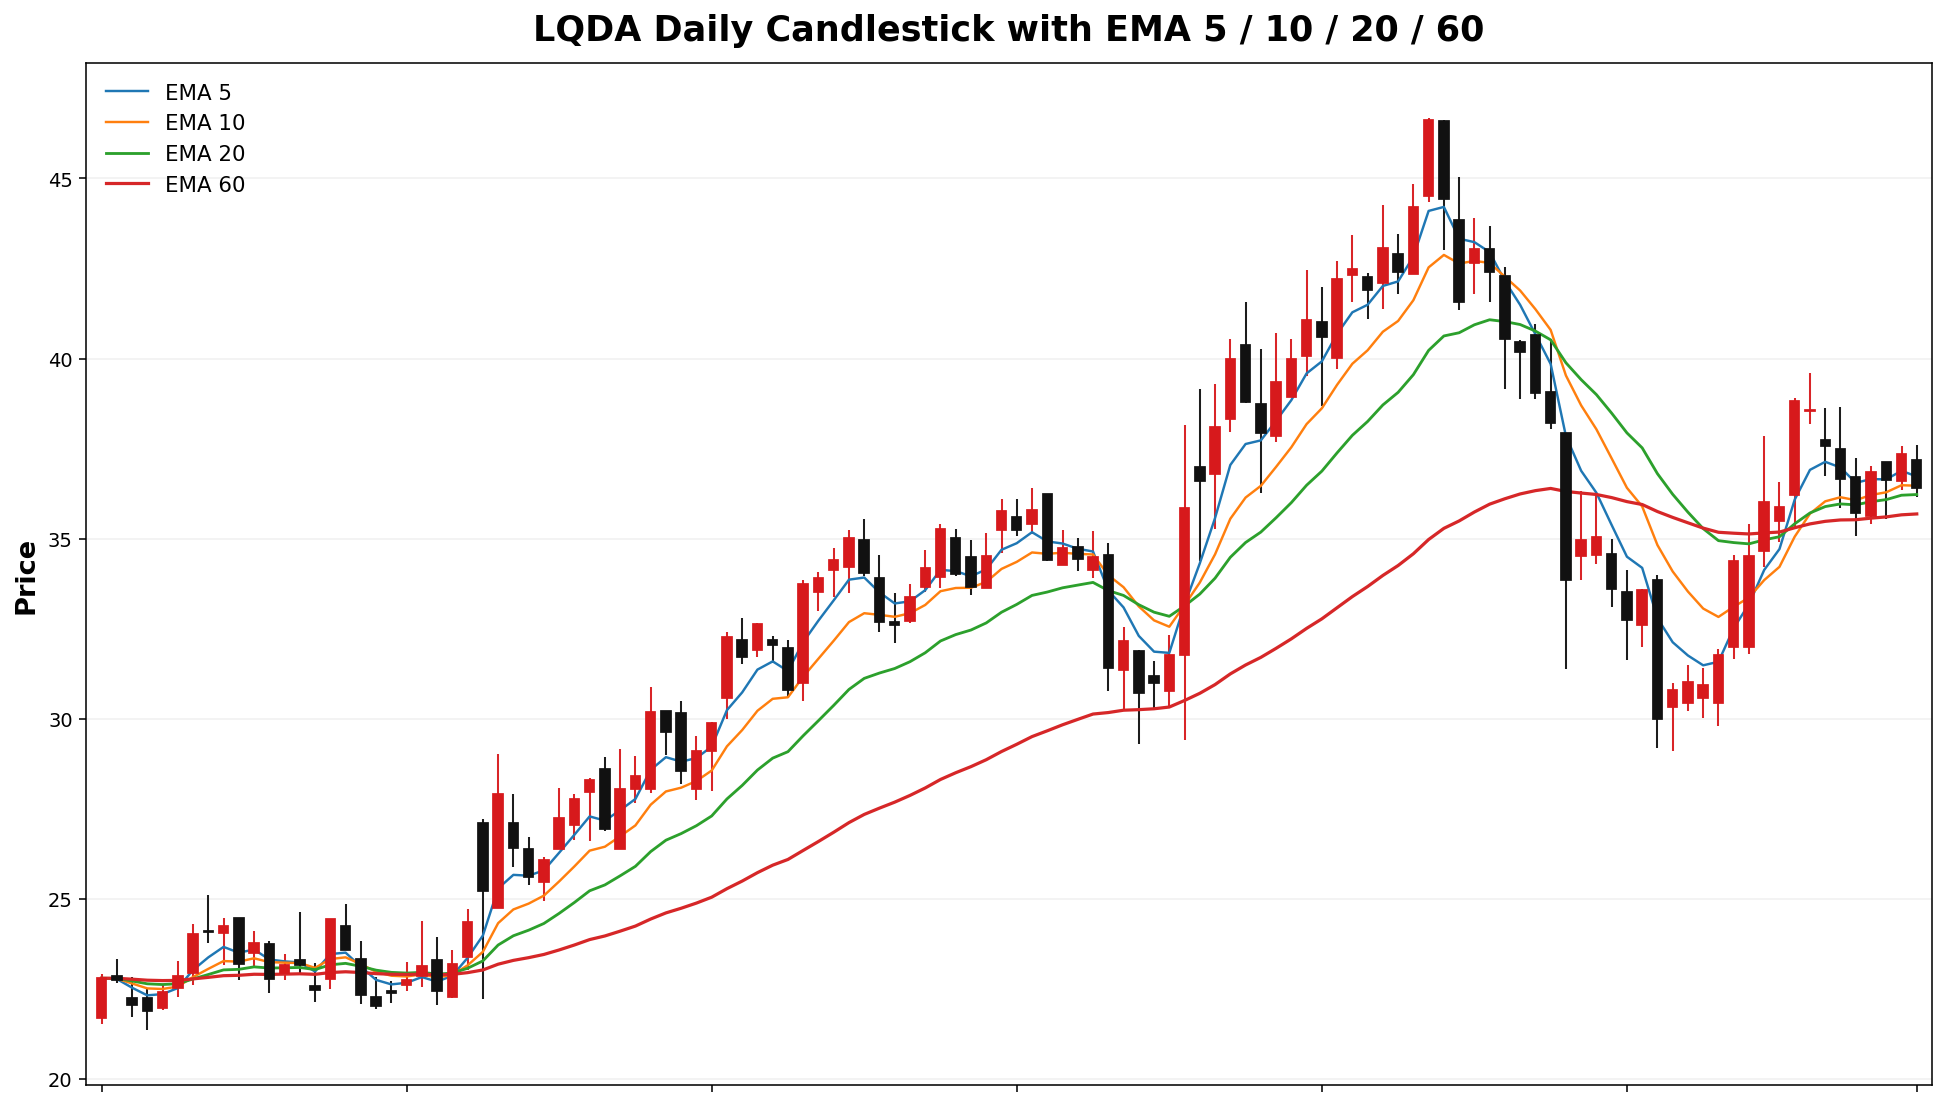
LQDA
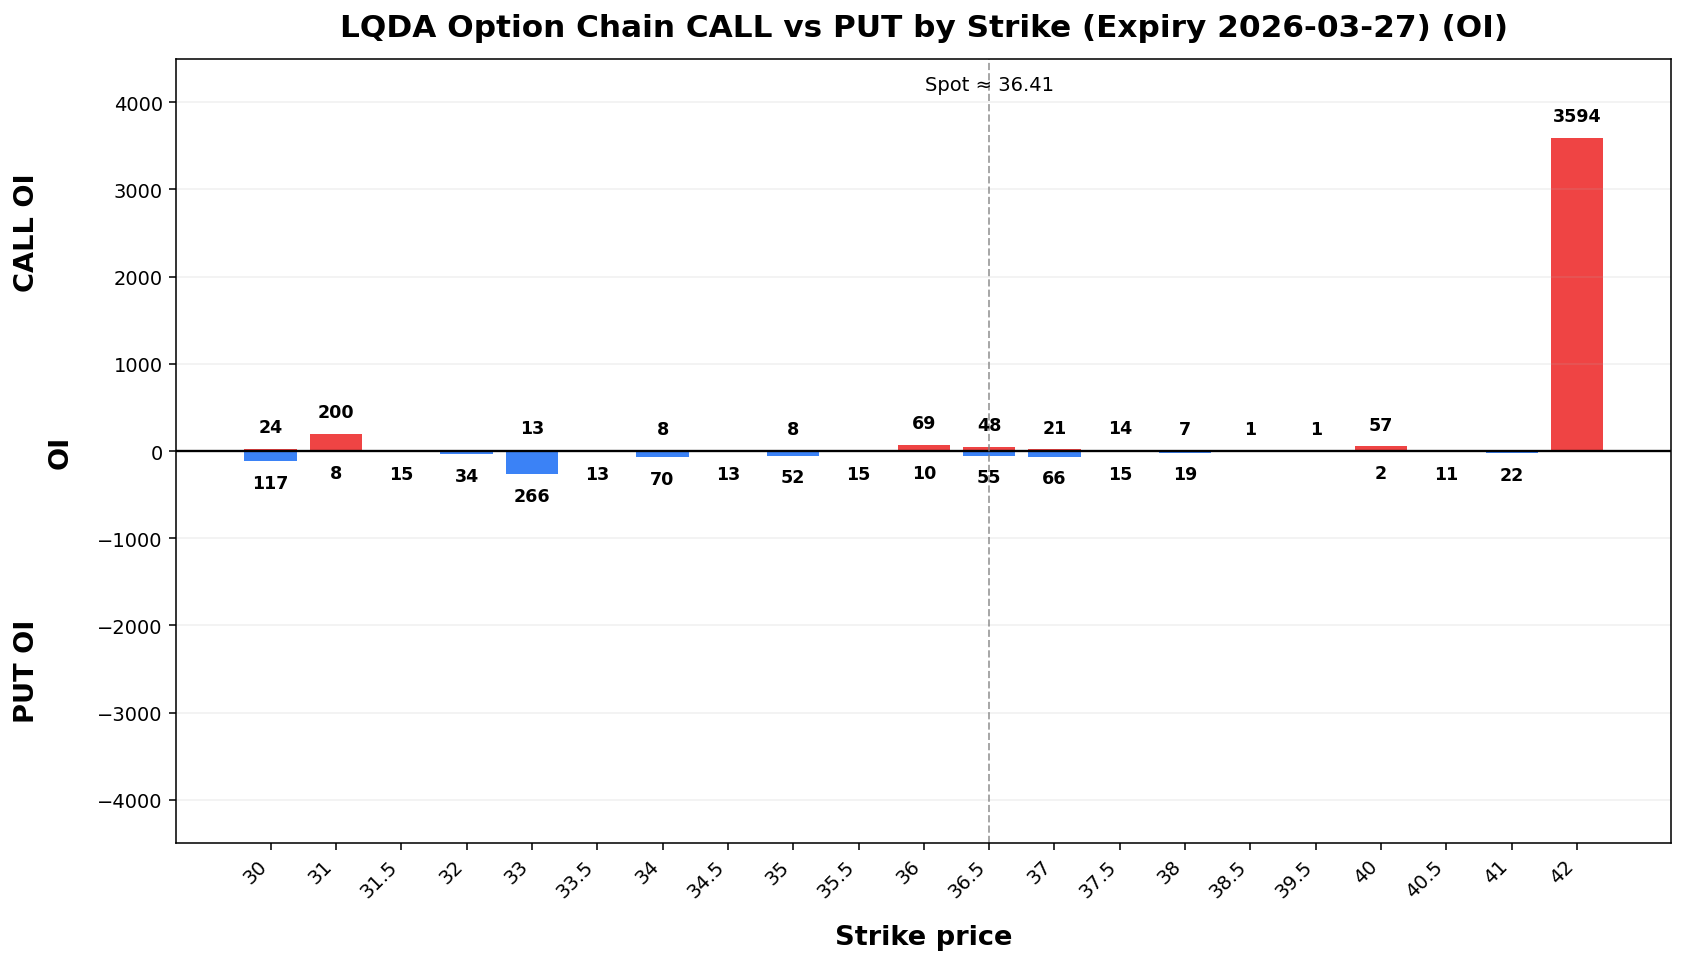
Spot: 36.41
Report Time: 2026-03-23 08:43 AM MYT
Regime: TREND
Dealer Gamma: SHORT
Term Structure
Expiry |
DTE |
Forward |
ATM IV |
ATM Straddle |
|---|
2026-03-27 |
5 |
36.53 |
120.95% |
5.05 |
2026-04-02 |
11 |
36.42 |
102.60% |
6.43 |
Weekly Range
Confidence |
Low |
High |
Width |
|---|
68% |
30.76 |
42.06 |
11.30 |
80% |
29.17 |
43.65 |
14.48 |
90% |
27.12 |
45.70 |
18.59 |
95% |
25.34 |
47.48 |
22.15 |
Structure & Probabilities
Support |
Resistance |
Gamma Flip |
Max Pain |
P>Res |
P<Sup |
|---|
33.00 |
42.00 |
28.71 |
34.50 |
19.9% |
28.2% |
Flow & Skew
Call Vol |
Put Vol |
Vol P/C |
Call OI |
Put OI |
OI P/C |
Skew |
Skew Bias |
|---|
855 |
618 |
0.72 |
4,650 |
1,595 |
0.34 |
-37.30 vol pts |
CALL_SKEW |
Tail Risk
Q10 |
Q50 |
Q90 |
Down Tail |
Up Tail |
Down/Up |
|---|
27.35 |
36.56 |
40.45 |
9.06 |
4.04 |
2.24 |
Daily Technicals
EMA20 |
EMA50 |
VWAP20 |
BB Lower |
BB Mid |
BB Upper |
BB Width |
Vol Ratio |
Path |
|---|
36.23 |
36.02 |
34.08 |
29.28 |
34.81 |
40.34 |
31.77% |
0.76 |
UP trend (expanding) |
Day Plan
33.00-42.00 range: fade extremes
> 42.00: chase only if hold + vol
< 33.00: risk expand; reduce size
Regime: TREND
Tech: UP trend (expanding)
Swing Plan
Accumulate: 33.00-33.00
Trim: 42.00-42.00
Add: close > 42.00
Cut: close < 33.00
Best for: trend regime
Raw Text Summary
📌 LQDA @ 36.41 (2026-03-23 08:43 AM MYT)

• Current price is **36.41**. Key support is around **33.00**, and resistance is around **42.00**.
• For the next week, the model’s **68% expected range** is roughly **30.76 to 42.06**.
• A wider **90% range** is about **27.12 to 45.70**.
• Dealer positioning looks **SHORT gamma**, so the market behavior is classified as **TREND**.
• The estimated **gamma flip** is near **28.71**. Crossing and holding beyond this area can change the trading behavior.
• Approximate breakout odds: **above resistance 19.9%**, **below support 28.2%** by the target horizon.
• Options skew is tilted toward **calls**, which suggests upside speculation is relatively stronger.
• Near-term implied volatility is higher than the next expiry (**IV1 120.95% vs IV2 102.60%103.58%**), which suggests **near-term event stress / backwardation**.
• Recent volume is only **0.76x*77x** the 20-day average, so breakouts may be less reliable unless volume improves.
• On the daily chart, the stock currently looks like **UP trend (expanding)**.
• The implied distribution shows **heavier downside tail risk** than upside tail potential.
USO
Spot: 110.56
Report Time: 2026-03-24 08:43 AM MYT
Regime: TREND
Dealer Gamma: SHORT
Term Structure
| Expiry |
DTE |
Forward |
ATM IV |
ATM Straddle |
| 2026-03-25 |
2 |
110.60 |
104.26% |
8.10 |
| 2026-03-27 |
4 |
110.55 |
96.17% |
10.85 |
Weekly Range
| Confidence |
Low |
High |
Width |
| 68% |
96.16 |
124.96 |
28.81 |
| 80% |
92.10 |
129.02 |
36.92 |
| 90% |
86.87 |
134.25 |
47.38 |
| 95% |
82.33 |
138.79 |
56.46 |
Structure & Probabilities
| Support |
Resistance |
Gamma Flip |
Max Pain |
P>Res |
P<Sup |
| 110.00 |
115.00 |
120.38 |
122.00 |
42.1% |
64.4% |
Flow & Skew
| Call Vol |
Put Vol |
Vol P/C |
Call OI |
Put OI |
OI P/C |
Skew |
Skew Bias |
| 46,306 |
47,356 |
1.02 |
25,936 |
35,119 |
1.35 |
8.25 vol pts |
PUT_SKEW |
Tail Risk
| Q10 |
Q50 |
Q90 |
Down Tail |
Up Tail |
Down/Up |
| 55.97 |
104.85 |
121.48 |
54.59 |
10.92 |
5.00 |
Daily Technicals
| EMA20 |
EMA50 |
VWAP20 |
BB Lower |
BB Mid |
BB Upper |
BB Width |
Vol Ratio |
Path |
| 105.55 |
91.97 |
108.25 |
71.95 |
102.88 |
133.82 |
60.14% |
1.49 |
UP trend (expanding) |
Day Plan
- 110.00-115.00 range: fade extremes
- > 115.00: chase only if hold + vol
- < 110.00: risk expand; reduce size
- Regime: TREND
- Tech: UP trend (expanding)
Swing Plan
- Accumulate: 110.00-110.00
- Trim: 115.00-115.00
- Add: close > 115.00
- Cut: close < 110.00
- Best for: trend regime
- Bias: downside break risk elevated
Raw Text Summary
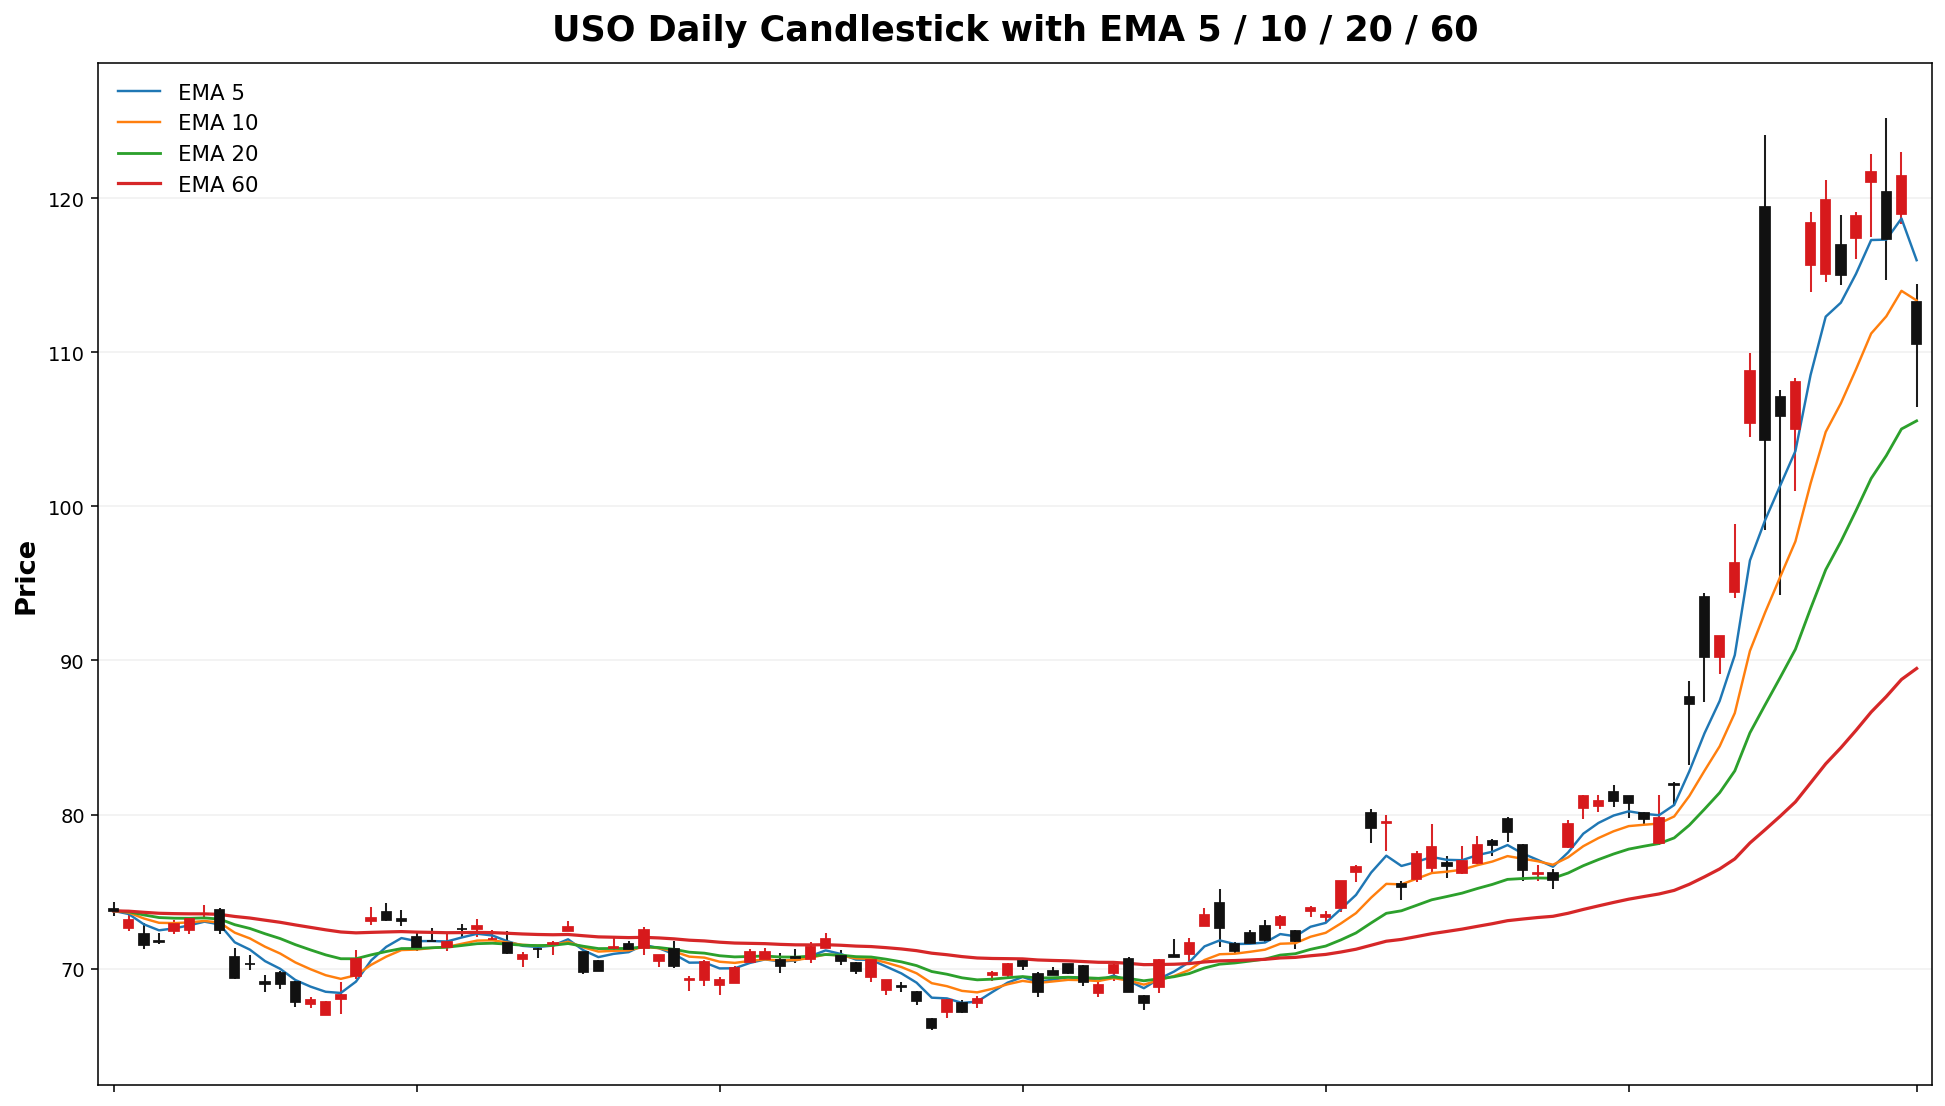
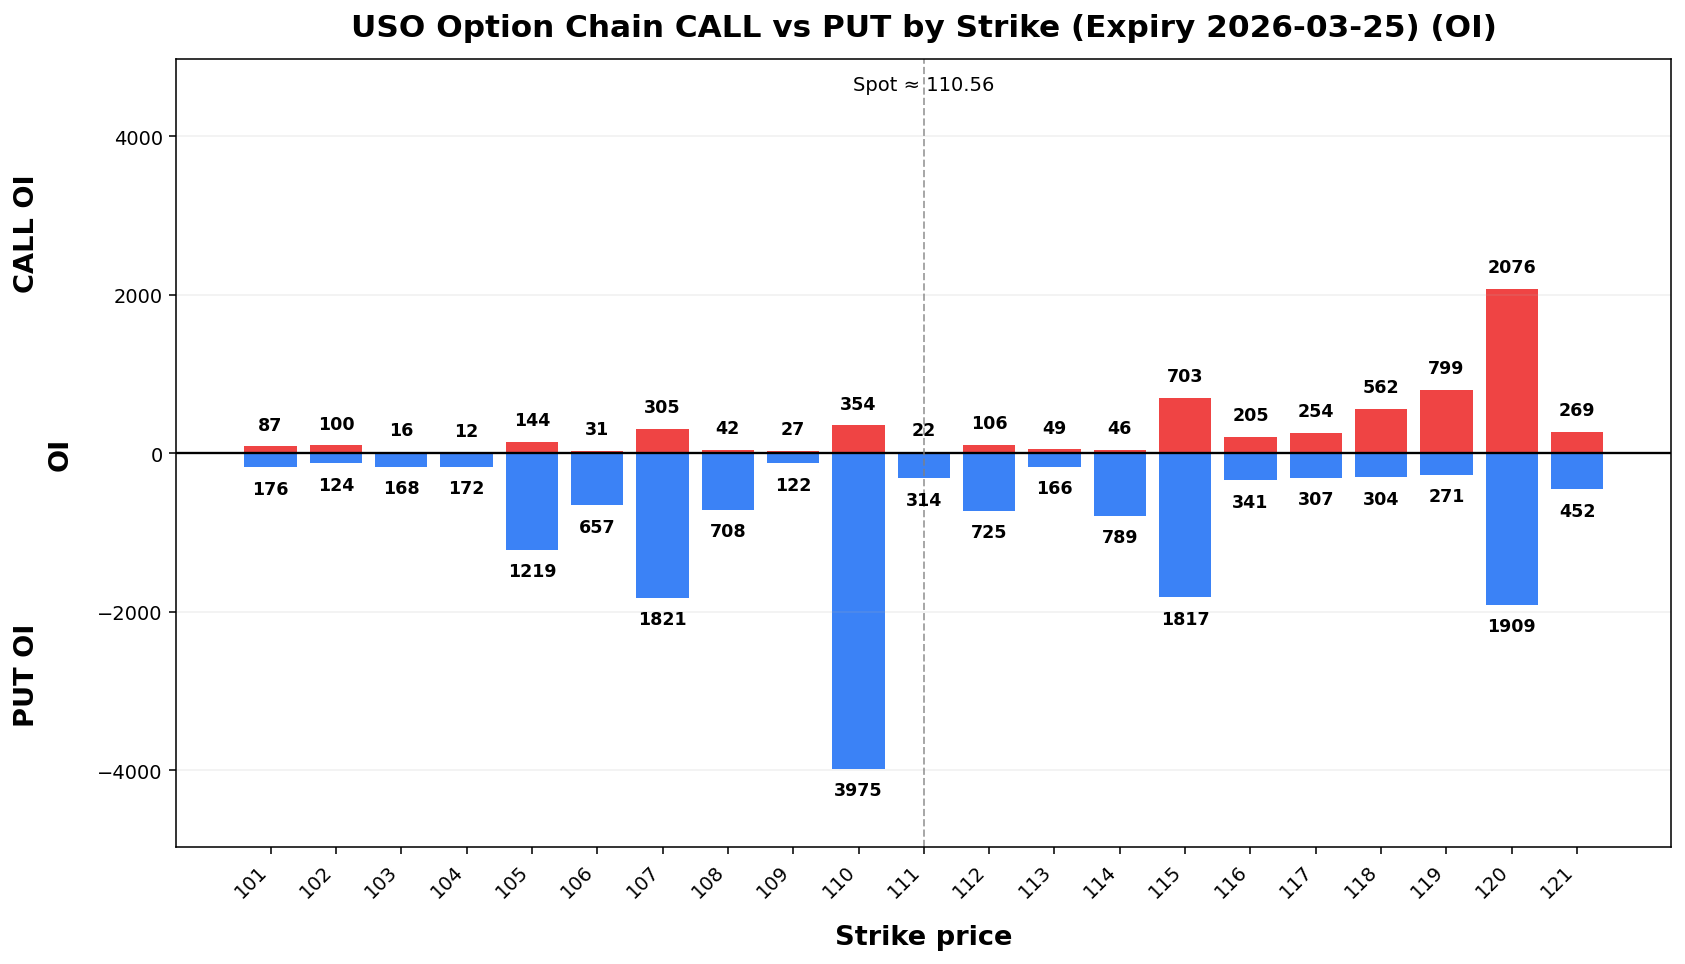
📌 USO @ 110.56 (2026-03-24 08:43 AM MYT)

• Current price is **110.56**. Key support is around **110.00**, and resistance is around **115.00**.
• For the next week, the model’s **68% expected range** is roughly **96.16 to 124.96**.
• A wider **90% range** is about **86.87 to 134.25**.
• Dealer positioning looks **SHORT gamma**, so the market behavior is classified as **TREND**.
• The estimated **gamma flip** is near **120.38**. Crossing and holding beyond this area can change the trading behavior.
• Approximate breakout odds: **above resistance 42.1%**, **below support 64.4%** by the target horizon.
• Options skew is tilted toward **puts**, which suggests traders are paying more for downside protection.
• Near-term implied volatility is higher than the next expiry (**IV1 104.26% vs IV2 96.17%**), which suggests **near-term event stress / backwardation**.
• On the daily chart, the stock currently looks like **UP trend (expanding)**.
• The implied distribution shows **heavier downside tail risk** than upside tail potential.
UVXY
Spot: 49.88
Report Time: 2026-03-24 08:43 AM MYT
Regime: TRANSITION
Dealer Gamma: LONG
Term Structure
| Expiry |
DTE |
Forward |
ATM IV |
ATM Straddle |
| 2026-03-27 |
4 |
49.93 |
109.14% |
5.55 |
| 2026-04-02 |
10 |
49.73 |
111.05% |
9.07 |
Weekly Range
| Confidence |
Low |
High |
Width |
| 68% |
42.11 |
57.65 |
15.55 |
| 80% |
39.92 |
59.84 |
19.92 |
| 90% |
37.10 |
62.66 |
25.57 |
| 95% |
34.65 |
65.11 |
30.47 |
Structure & Probabilities
| Support |
Resistance |
Gamma Flip |
Max Pain |
P>Res |
P<Sup |
| 45.00 |
50.00 |
28.64 |
45.00 |
44.3% |
19.9% |
Flow & Skew
| Call Vol |
Put Vol |
Vol P/C |
Call OI |
Put OI |
OI P/C |
Skew |
Skew Bias |
| 15,045 |
7,802 |
0.52 |
29,387 |
11,133 |
0.38 |
-49.32 vol pts |
CALL_SKEW |
Tail Risk
| Q10 |
Q50 |
Q90 |
Down Tail |
Up Tail |
Down/Up |
| 41.26 |
48.17 |
58.41 |
8.62 |
8.53 |
1.01 |
Daily Technicals
| EMA20 |
EMA50 |
VWAP20 |
BB Lower |
BB Mid |
BB Upper |
BB Width |
Vol Ratio |
Path |
| 46.65 |
43.63 |
46.01 |
34.77 |
45.81 |
56.85 |
48.20% |
0.91 |
UP trend (expanding) |
Day Plan
- 45.00-50.00 range: fade extremes
- > 50.00: chase only if hold + vol
- < 45.00: risk expand; reduce size
- Regime: TRANSITION
- Tech: UP trend (expanding)
Swing Plan
- Accumulate: 45.00-45.00
- Trim: 50.00-50.00
- Add: close > 50.00
- Cut: close < 45.00
- Best for: transition regime
Raw Text Summary
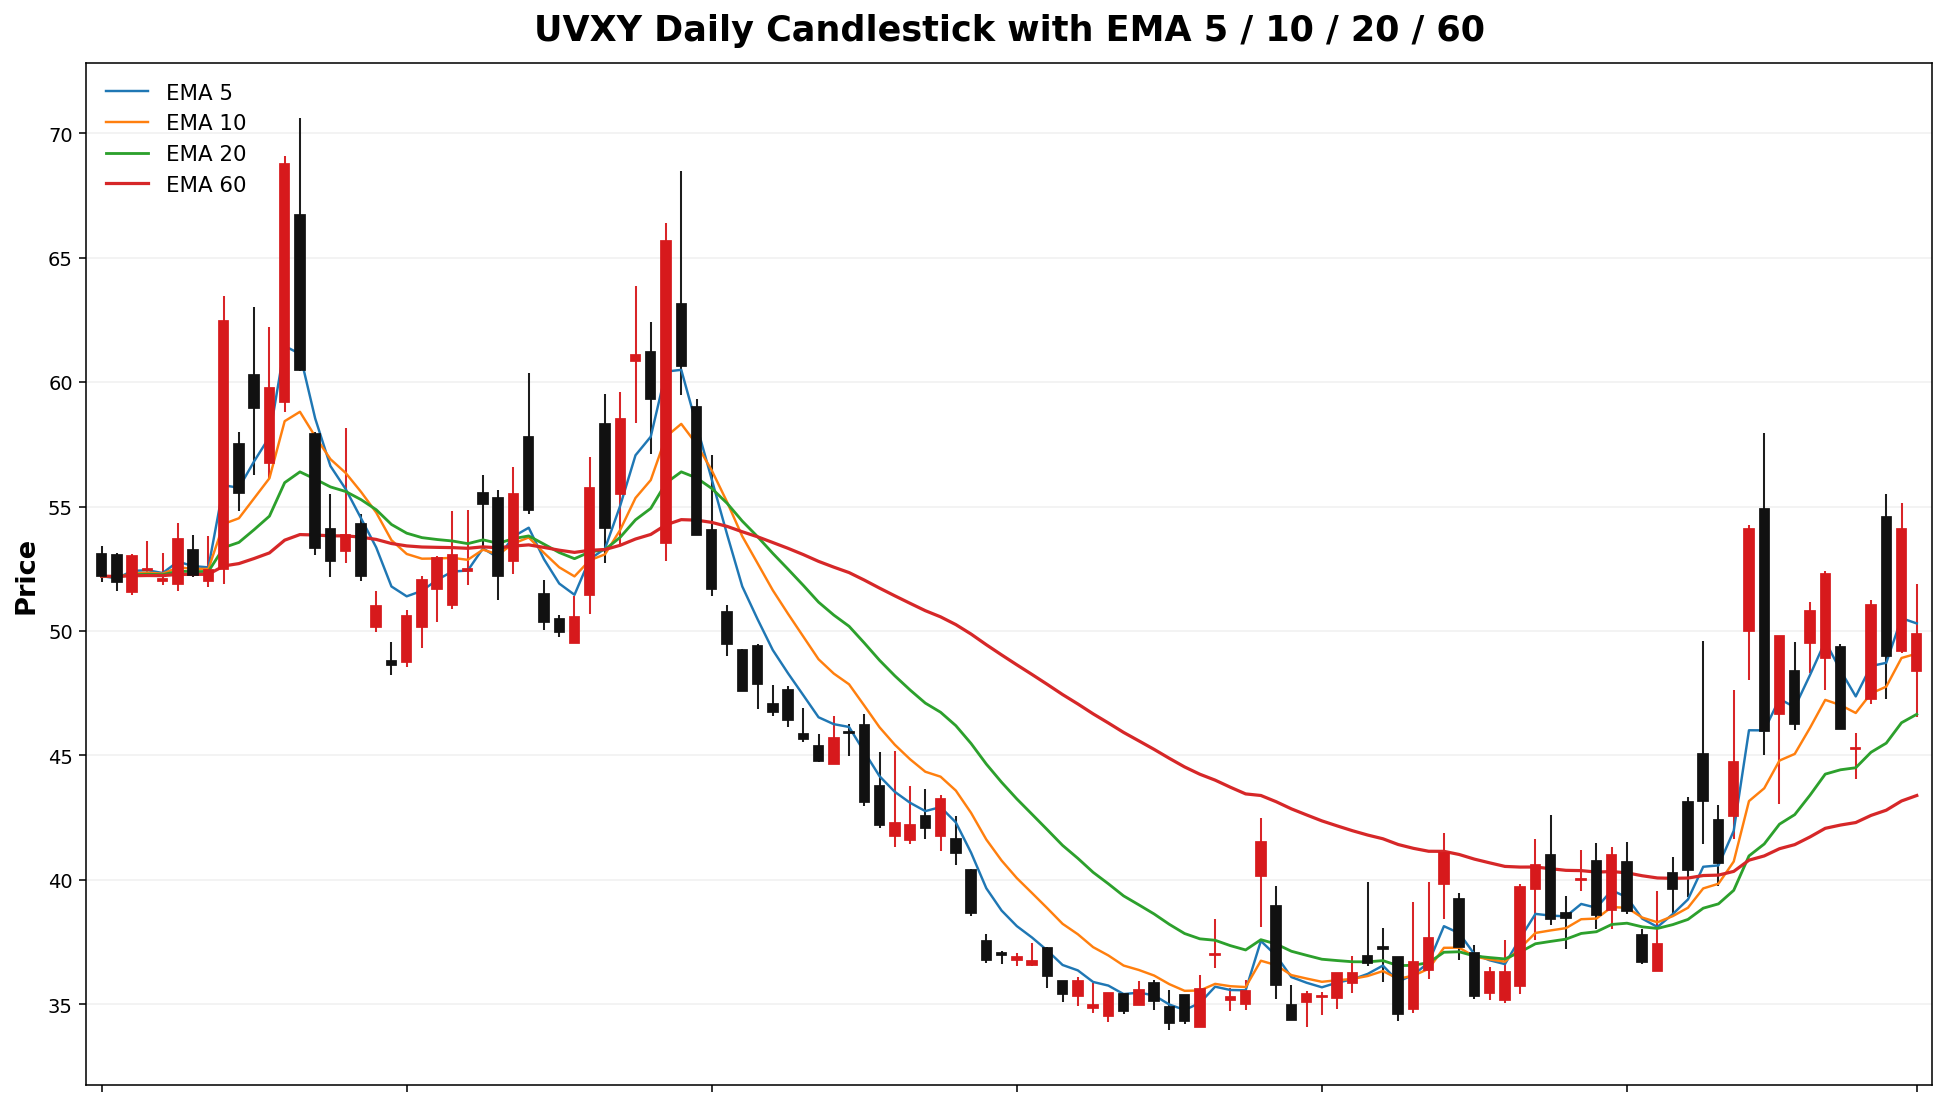
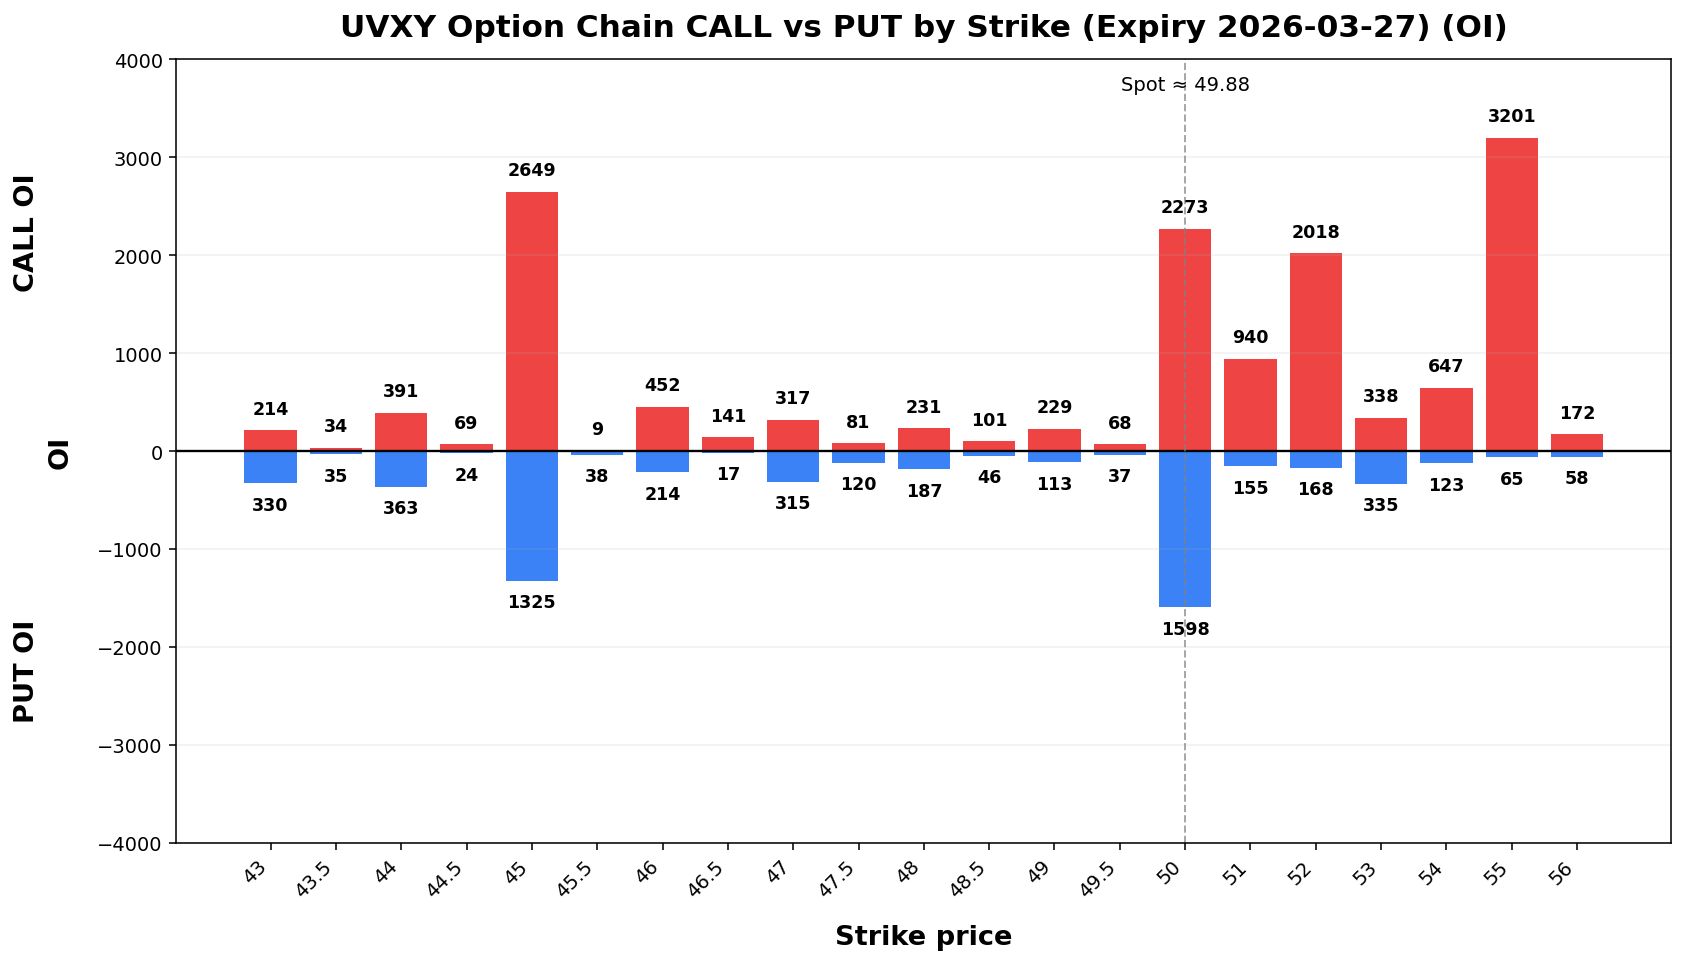
📌 UVXY @ 49.88 (2026-03-24 08:43 AM MYT)

• Current price is **49.88**. Key support is around **45.00**, and resistance is around **50.00**.
• For the next week, the model’s **68% expected range** is roughly **42.11 to 57.65**.
• A wider **90% range** is about **37.10 to 62.66**.
• Dealer positioning looks **LONG gamma**, so the market behavior is classified as **TRANSITION**.
• The estimated **gamma flip** is near **28.64**. Crossing and holding beyond this area can change the trading behavior.
• Approximate breakout odds: **above resistance 44.3%**, **below support 19.9%** by the target horizon.
• Options skew is tilted toward **calls**, which suggests upside speculation is relatively stronger.
• Near-term implied volatility is lower than the next expiry (**IV1 109.14% vs IV2 111.05%**), which suggests a **contango / calmer front expiry** setup.
• On the daily chart, the stock currently looks like **UP trend (expanding)**.
• The implied distribution is **fairly balanced** between upside and downside tails.