Raw Text Summary
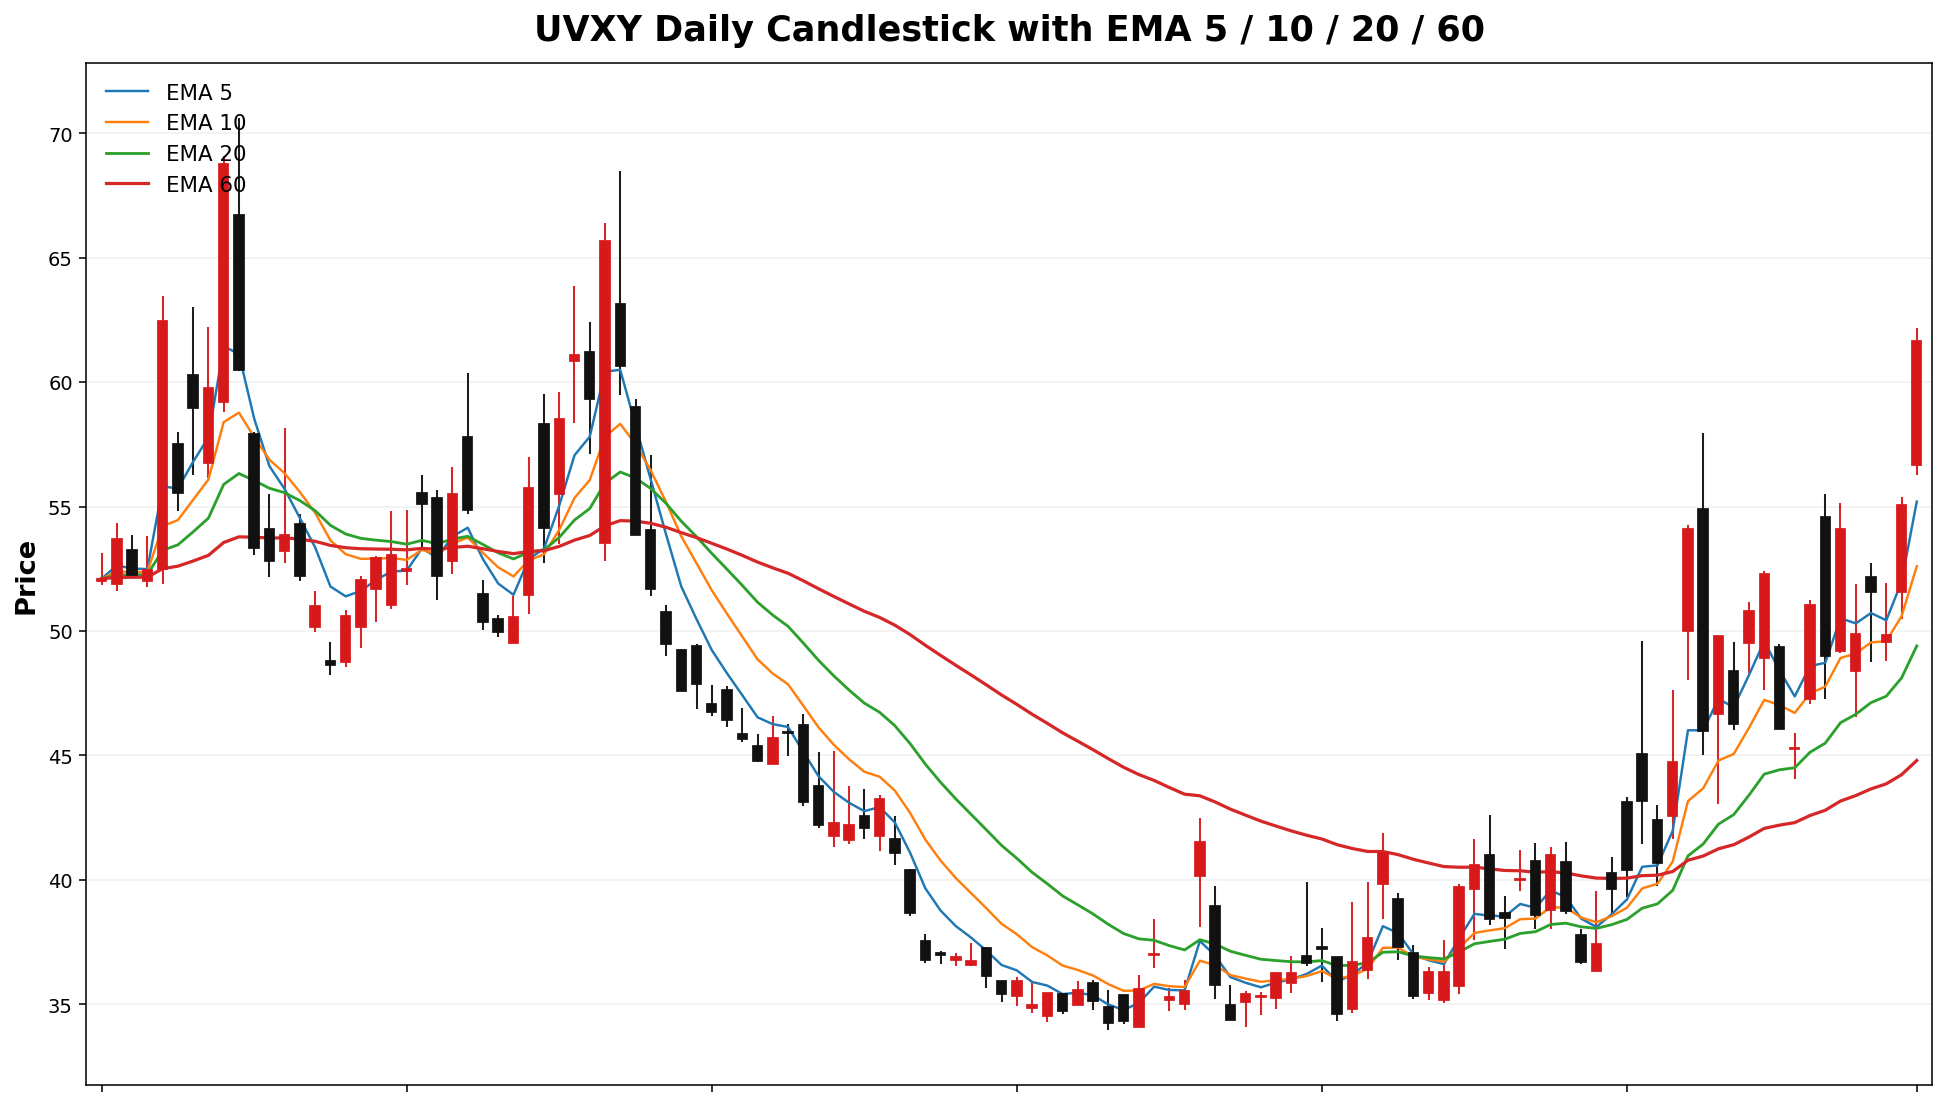
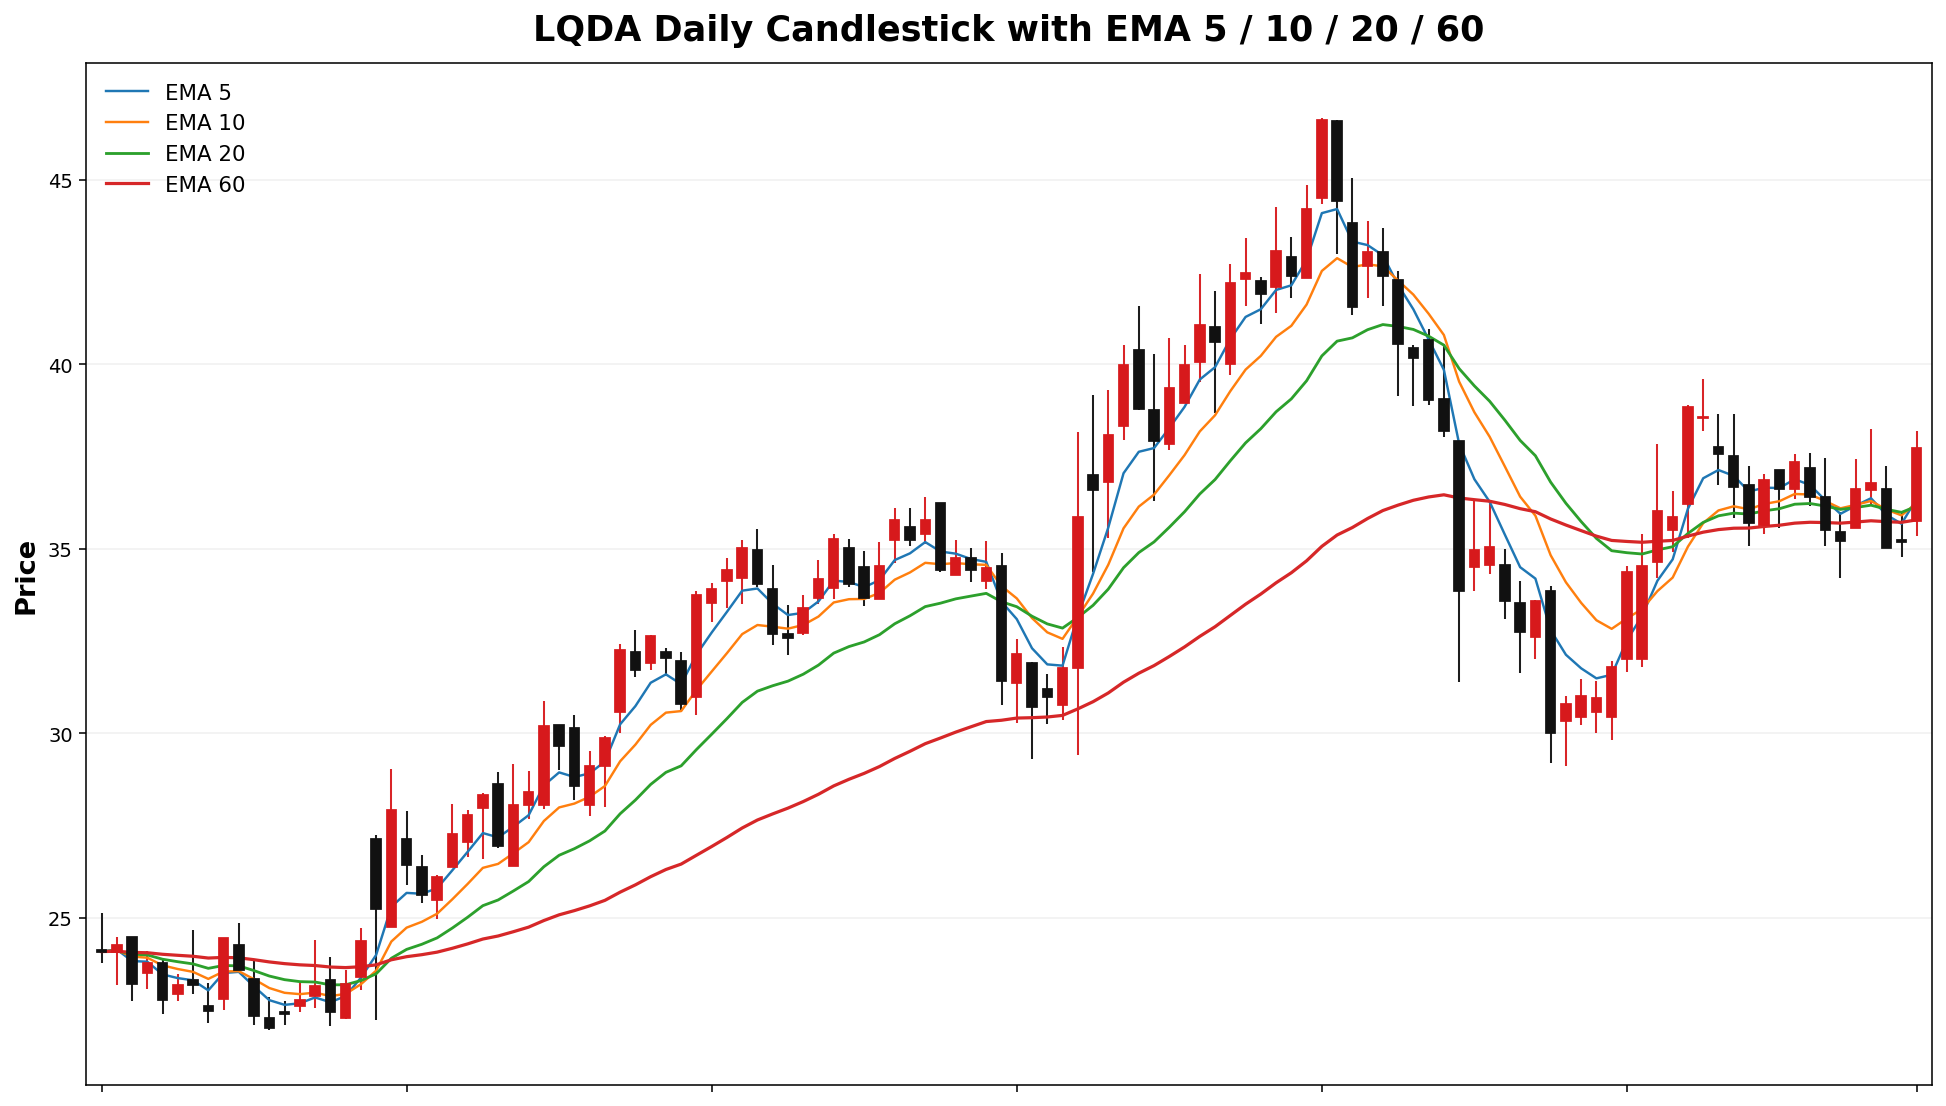
📌 UVXYLQDA @ 61.6537.74 (2026-03-2904-01 08:43 AM MYT)
• Current price is **61.65*37.74**. Key support is around **60.35.00**, and resistance is around **65.40.00**.
• For the next week, the model’s **68% expected range** is roughly **48.8732.50 to 74.43*42.98**.
• A wider **90% range** is about **40.6329.13 to 82.67*46.35**.
• Dealer positioning looks **LONGSHORT gamma**, so the market behavior is classified as **TRANSITION*TREND**.
• The estimated **gamma flip** is near **38.43*31.23**. Crossing and holding beyond this area can change the trading behavior.
• Approximate breakout odds: **above resistance 38.9%44.2%**, **below support 36.8%33.4%** by the target horizon.
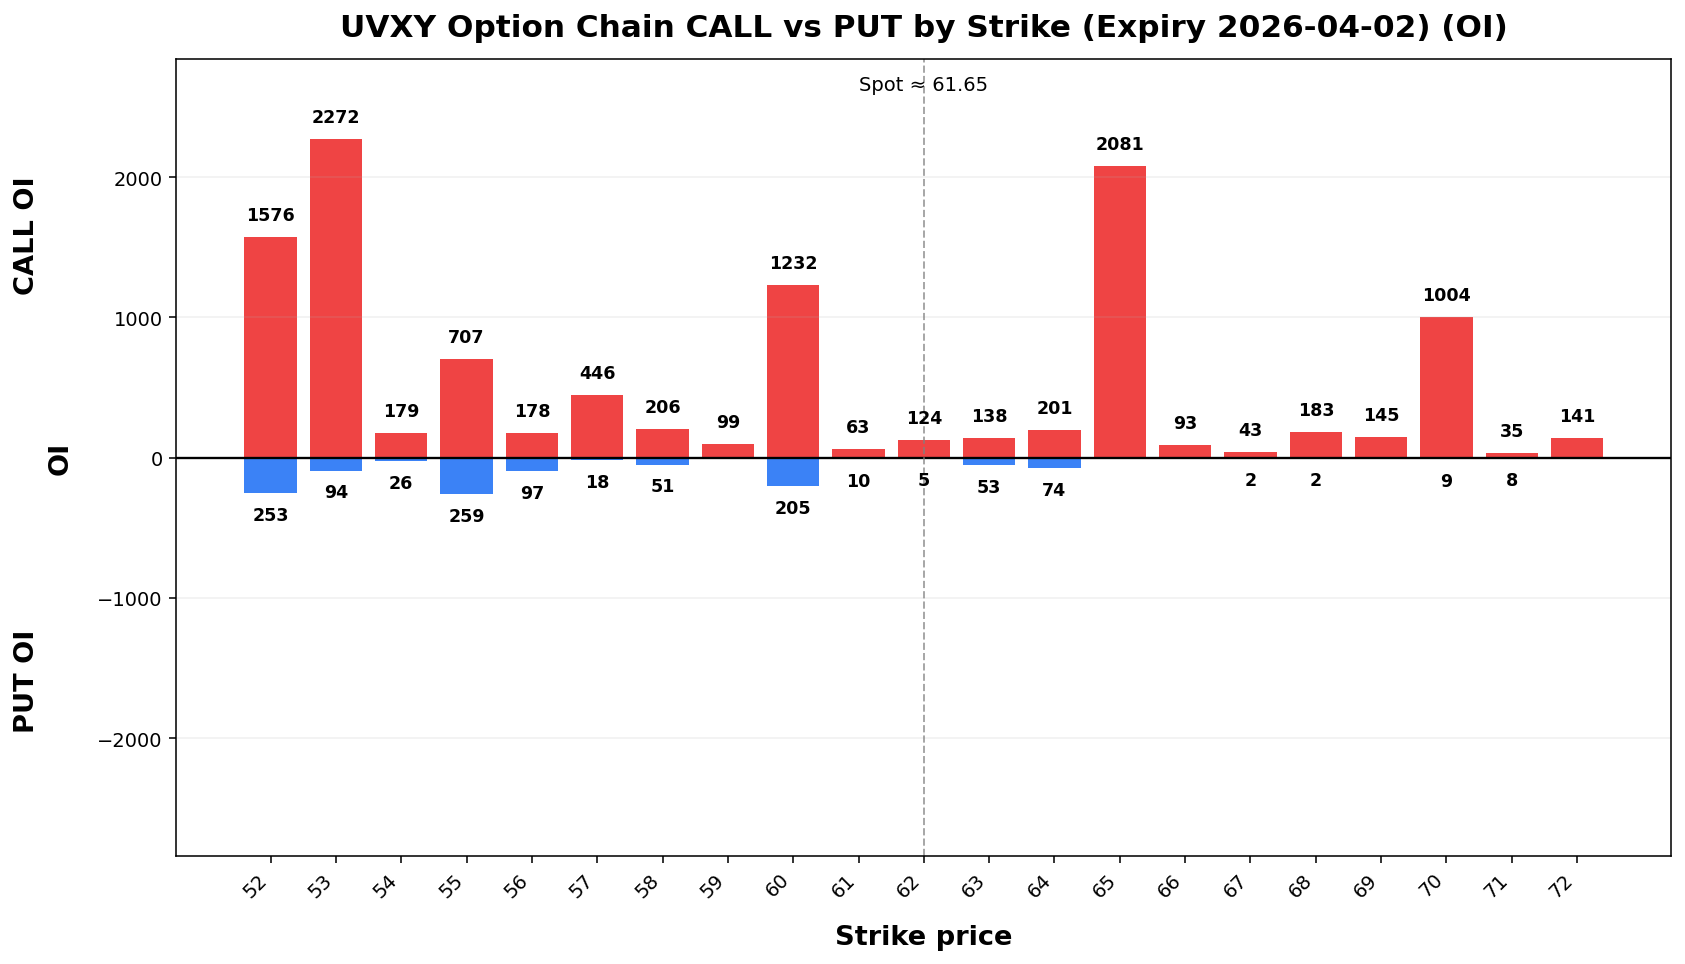
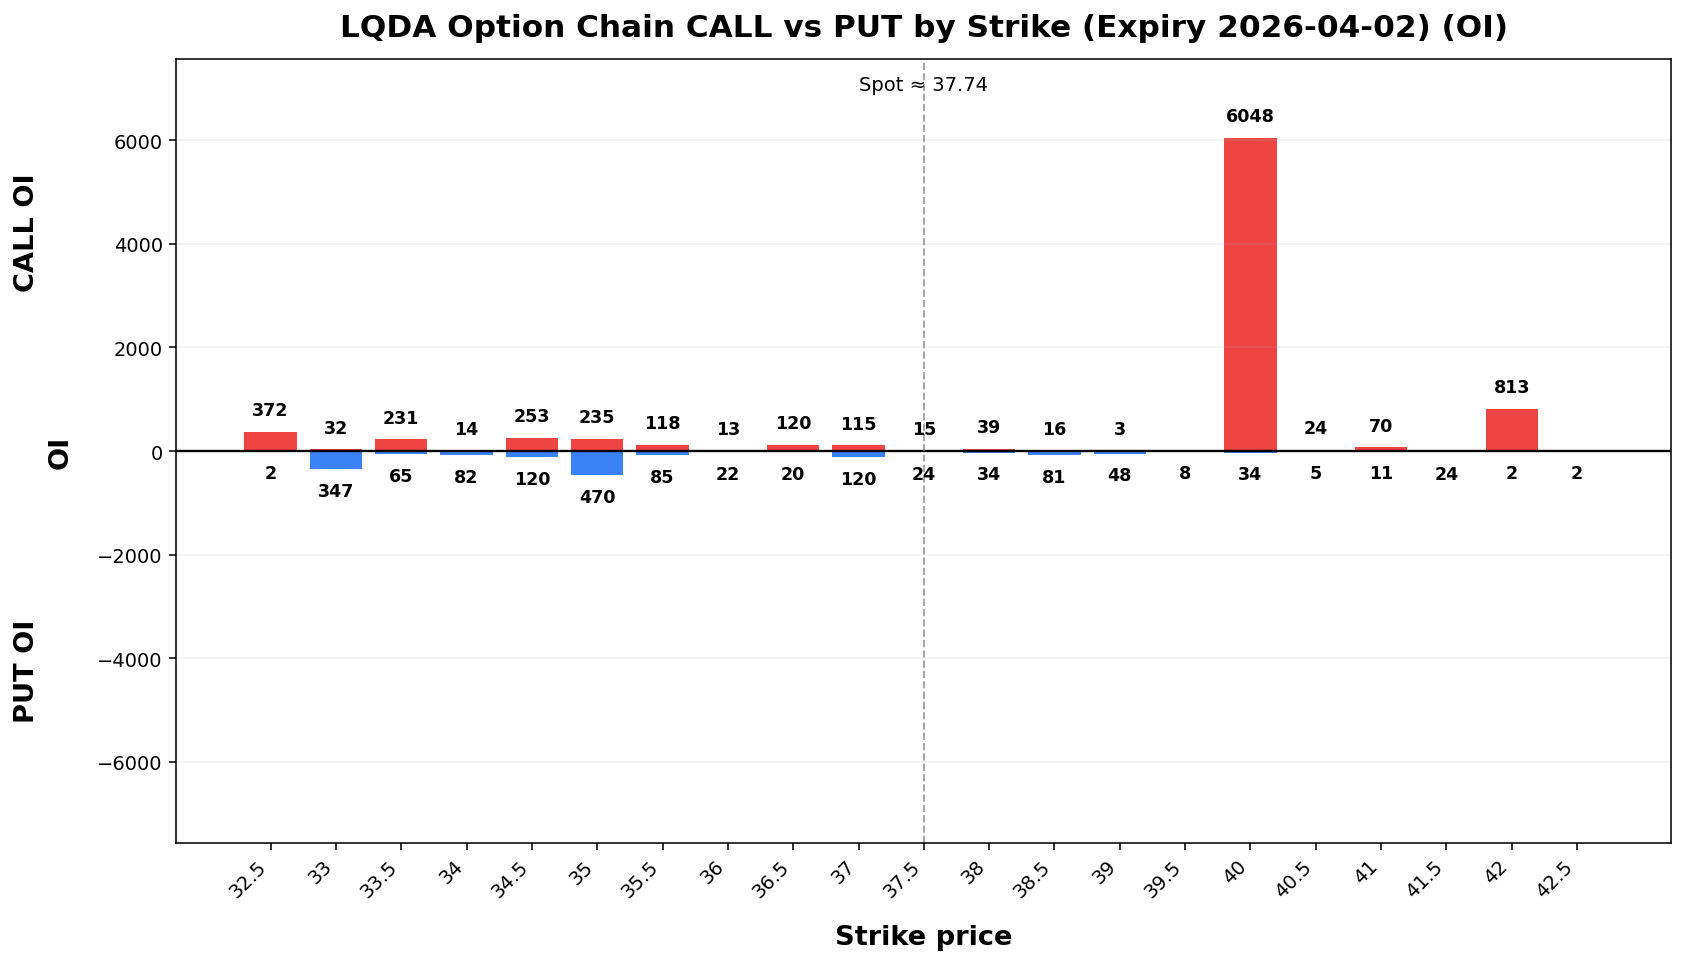
• Options skew is tilted toward **calls**, which suggests upside speculation is relatively stronger.
• Near-term implied volatility is higher than the next expiry (**IV1 153.82%192.33% vs IV2 141.22%85.72%**), which suggests **near-term event stress / backwardation**.
• On the daily chart, the stock currently looks like **UP trend (expanding)*bias**.
• The implied distribution shows **moreheavier downside tail risk** than upside tail potential** than downside tail risk.potential.
Raw Text Summary
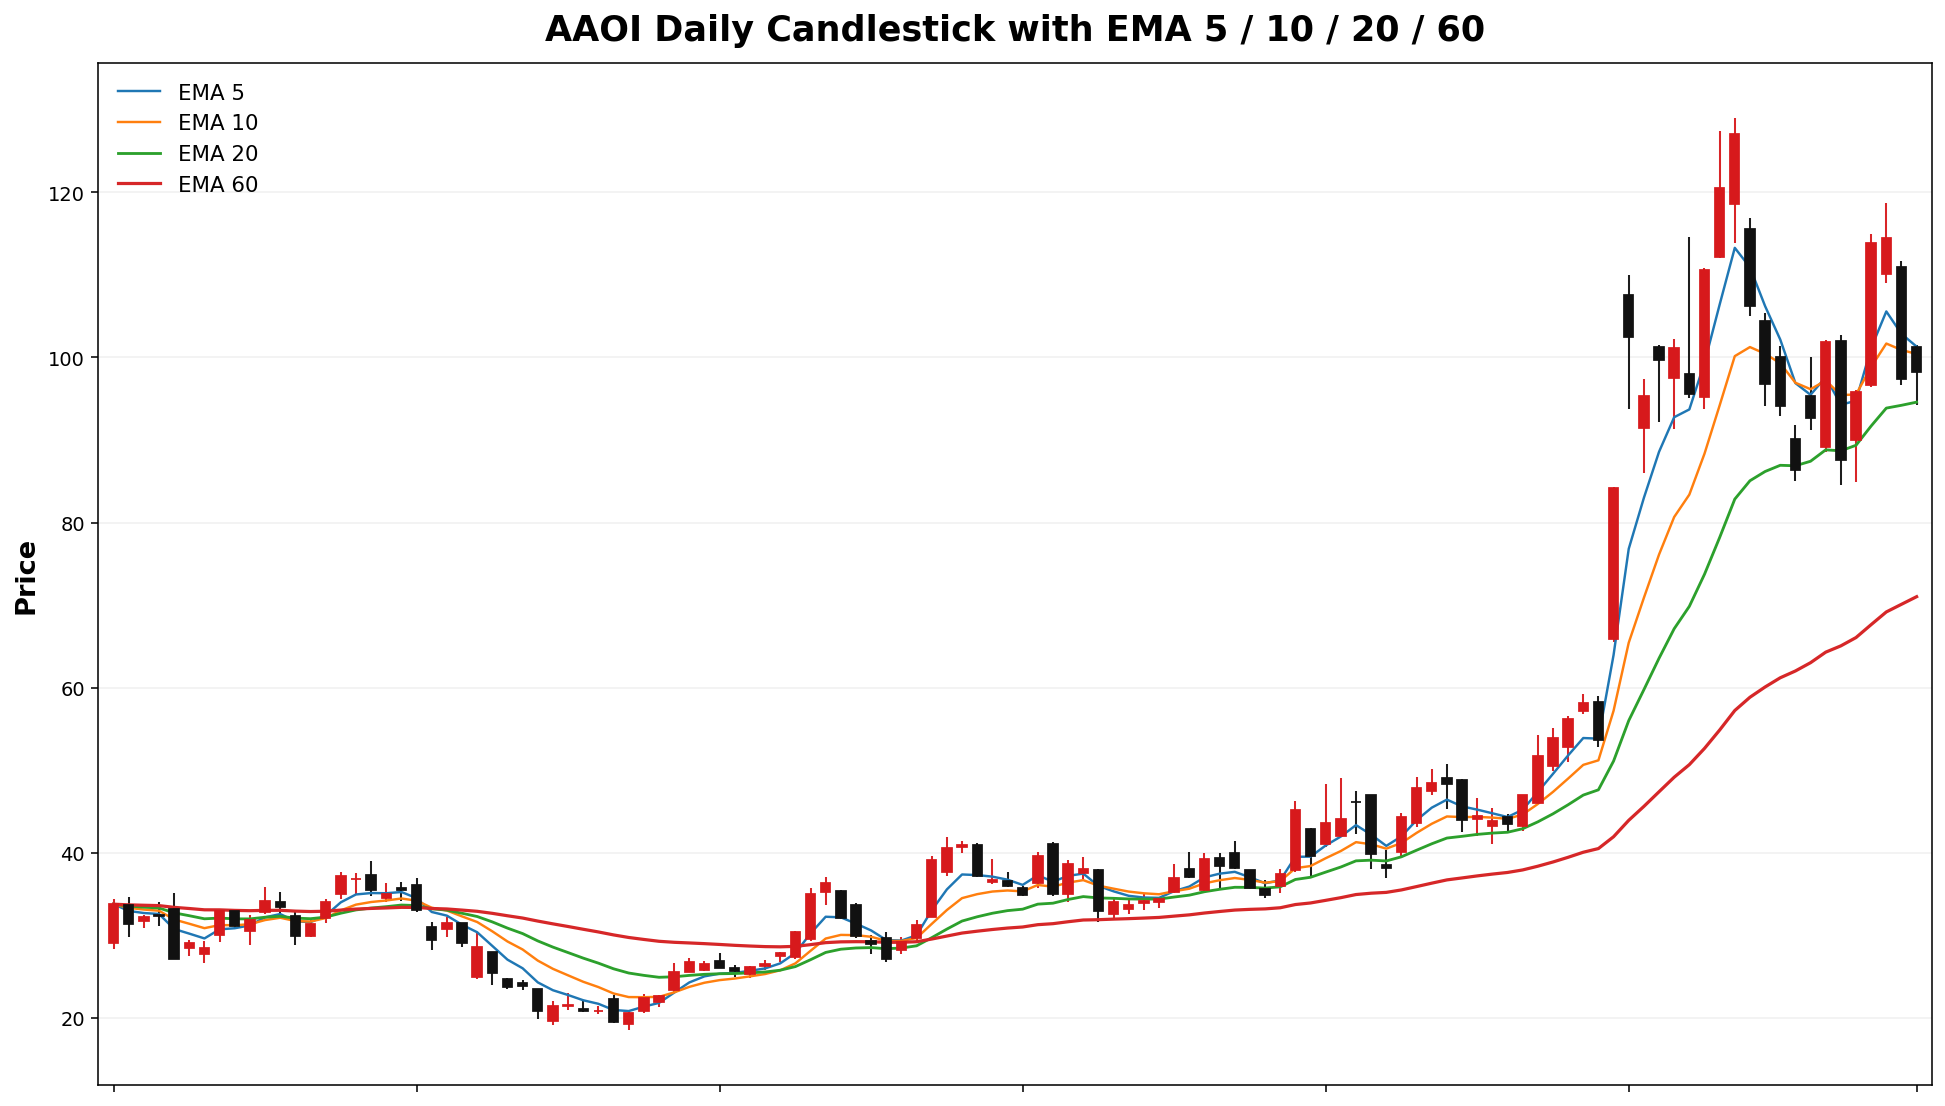
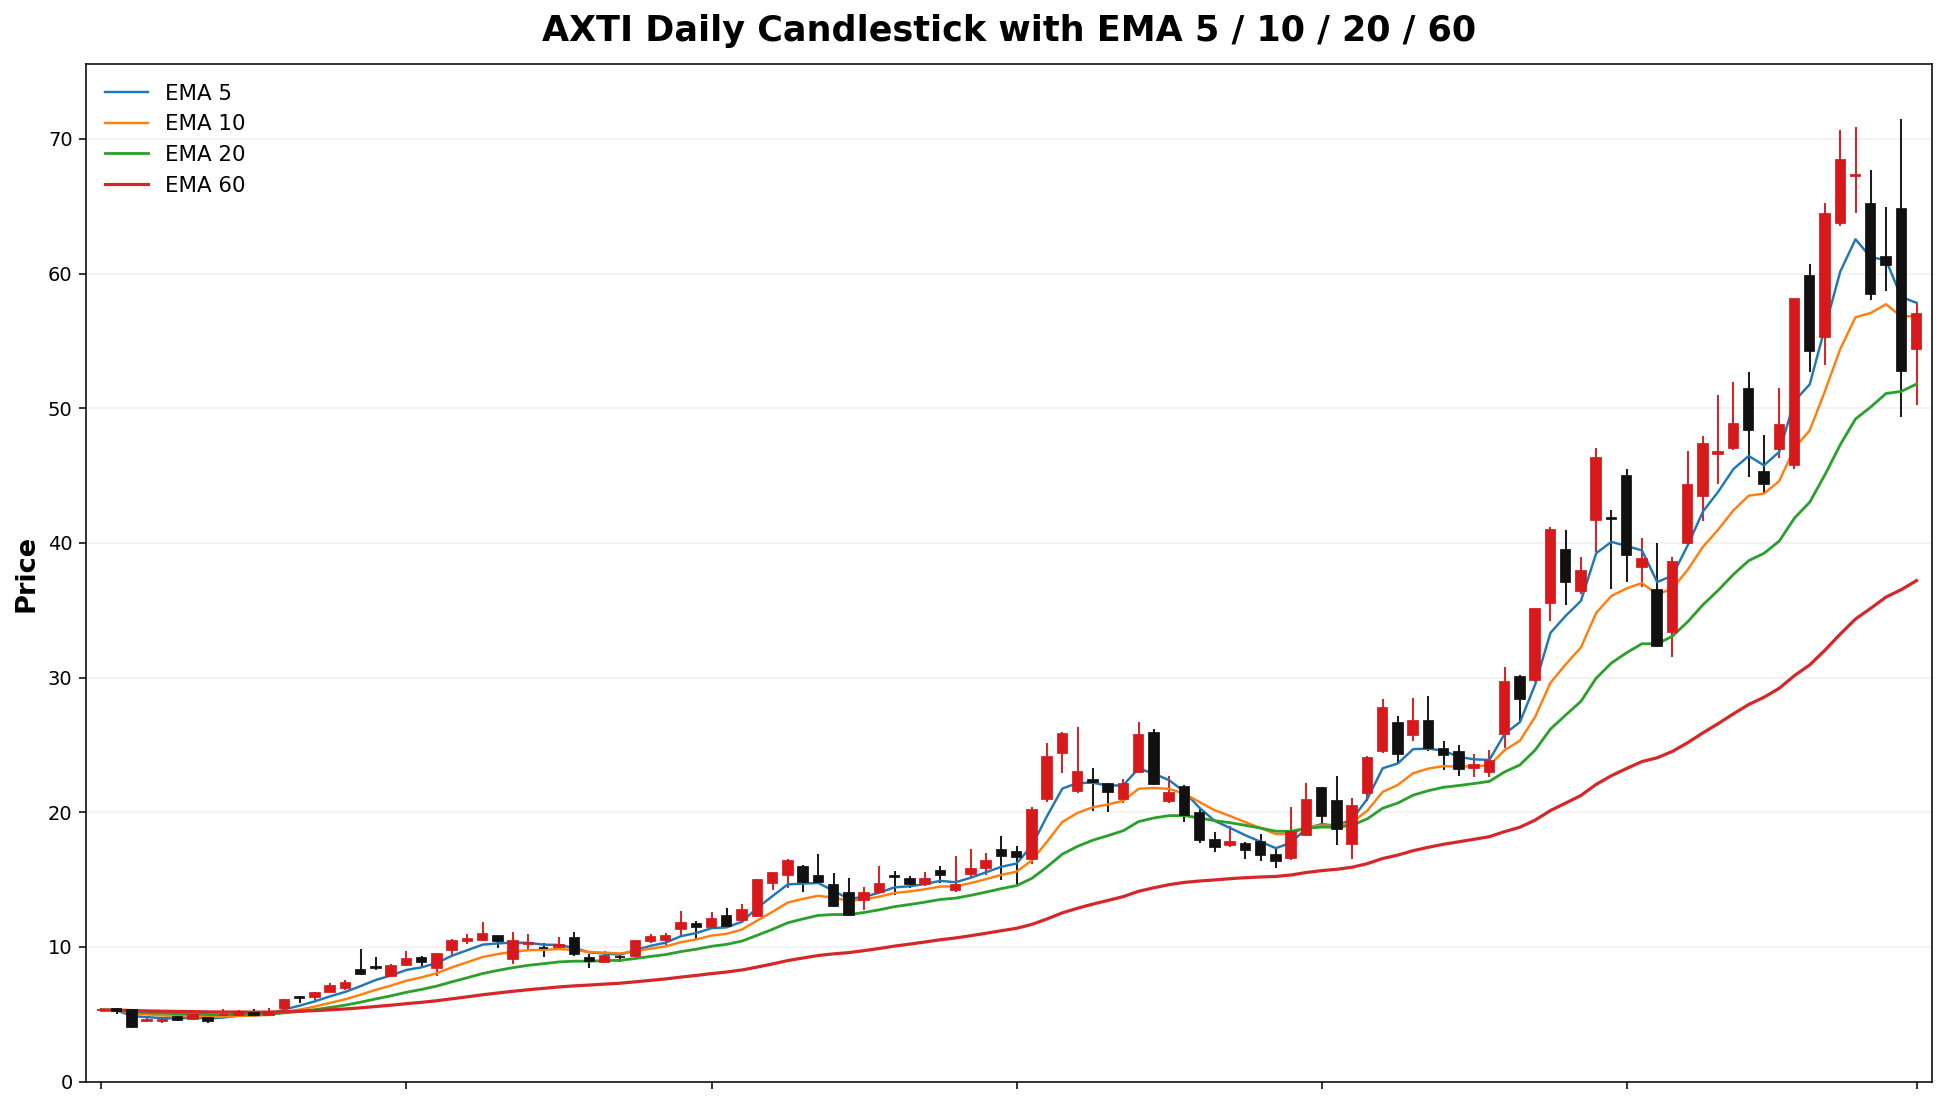
📌 AAOIAXTI @ 98.2156.98 (2026-03-2904-01 08:43 AM MYT)
• Current price is **98.21*56.98**. Key support is around **95.56.00**, and resistance is around **100.58.00**.
• For the next week, the model’s **68% expected range** is roughly **82.6746.42 to 113.75*67.54**.
• A wider **90% range** is about **72.6539.61 to 123.77*74.35**.
• Dealer positioning looks **LONGSHORT gamma**, so the market behavior is classified as **TRANSITION*TREND**.
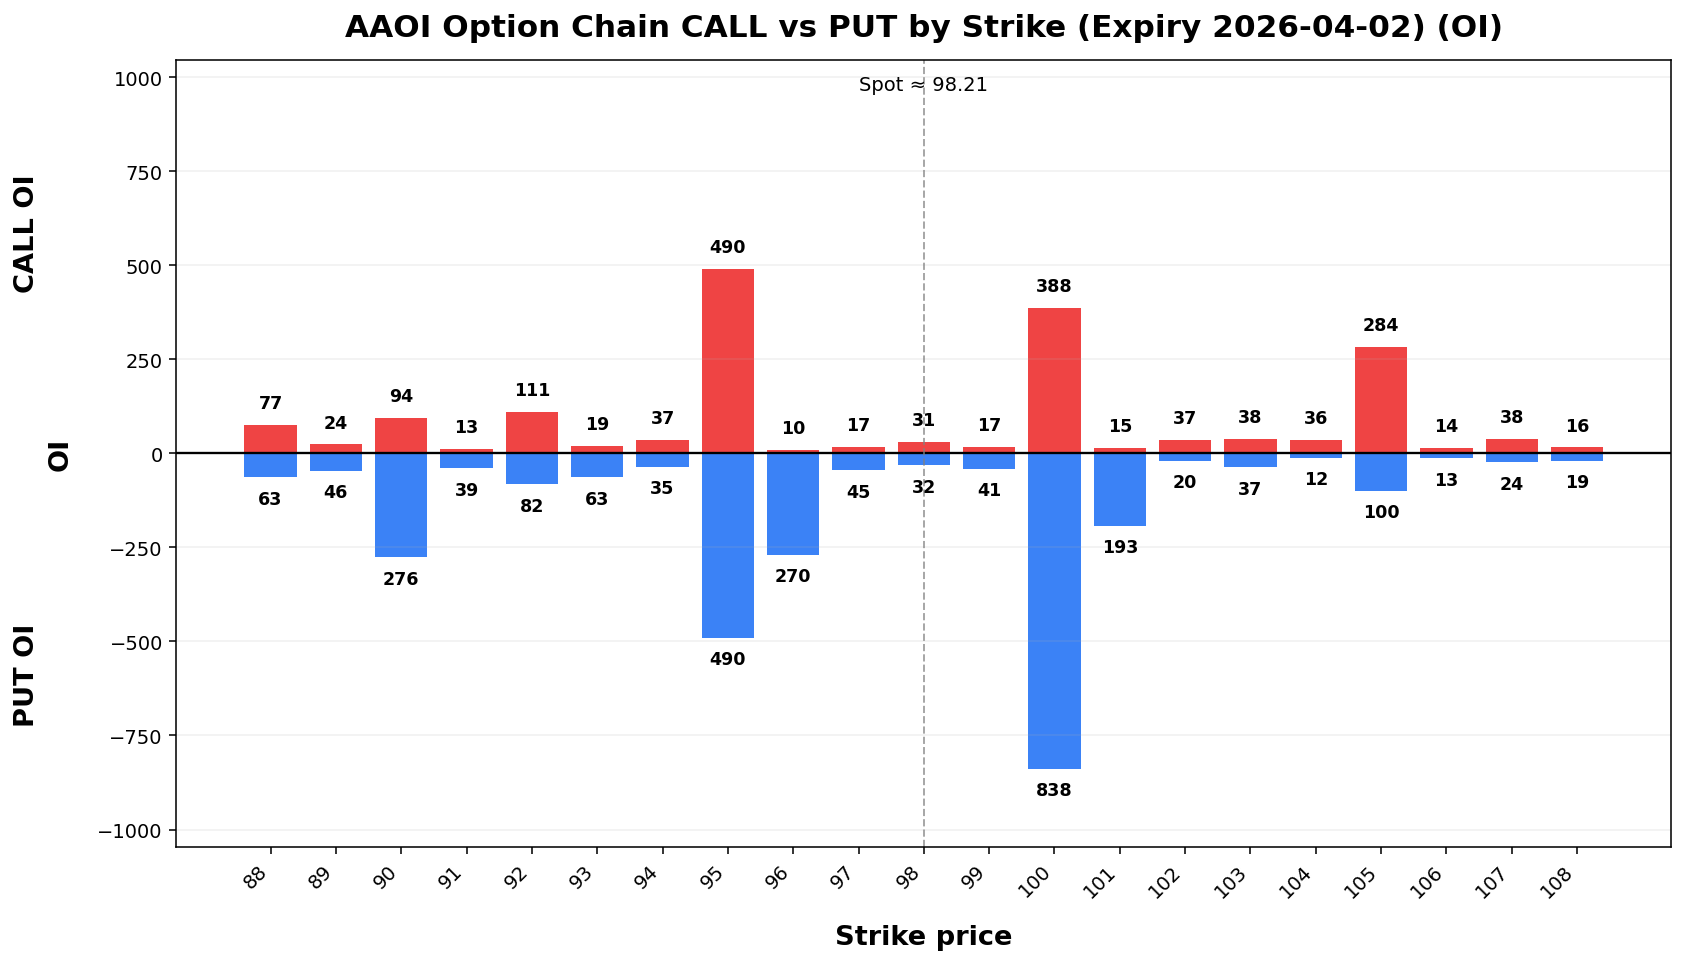
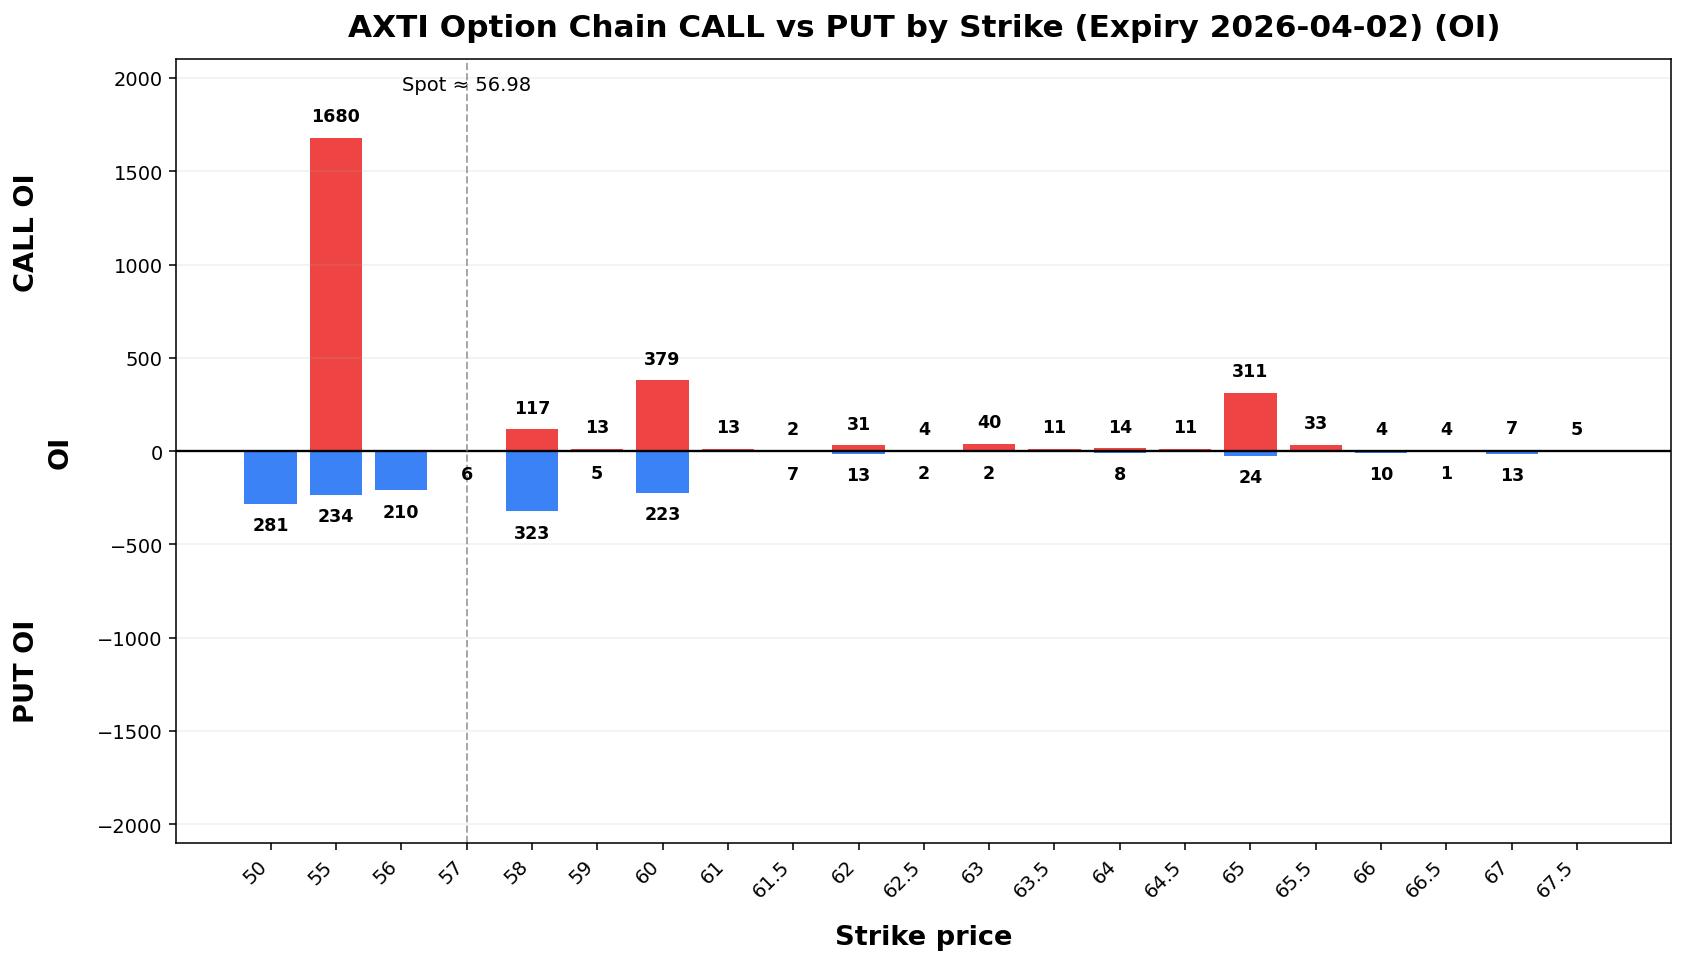
• The estimated **gamma flip** is near **102.03*44.39**. Crossing and holding beyond this area can change the trading behavior.
• Approximate breakout odds: **above resistance 34.7%51.3%**, **below support 38.2%61.5%** by the target horizon.
• Options skew is tilted toward **puts**, which suggests traders are paying more for downside protection.
• Near-term implied volatility is higher than the next expiry (**IV1 118.09%167.36% vs IV2 107.14%128.01%**), which suggests **near-term event stress / backwardation**.
• Recent volume is only **0.56x** the 20-day average, so breakouts may be less reliable unless volume improves.
• On the daily chart, the stock currently looks like **UP trend (expanding)**.
• The implied distribution shows **heavier downside tail risk** than upside tail potential.