Analysis Report
Updated: 2026-04-0105 08:43:3507:37 MYT
Source File: combined-summary-20260401-084335.20260405-080036.md
CombinedReport
Overview
Screening Source:Generated:2026-04-05 08:00 AM MYTscreen-report-20260401-084320.mdExtractedSymbolsSymbols:Covered:LQDA,6AXTI- Format:
Toplinemarkdown Summary
briefing
At a Glance
| Symbol | Spot | Path | Weekly 68% | Support / Resistance | ||||||||
|---|---|---|---|---|---|---|---|---|---|---|---|---|
| UP trend (expanding) | 86.55 – 121.27 | 80.00 / 100.00 | ||||||||||
| Sideways / Range | 81.04 – 104.20 | 85.00 / 95.00 | ||||||||||
| RKLB | 67.73 | LONG_GAMMA_PIN | DOWN trend (expanding) | 60.17 – 75.29 | 60.00 / 70.00 | |||||||
| SATS | 117.40 – 139.96 | 94.00 / 123.00 | 63.7% / 0.1% | |||||||||
| VSAT | 53.69 | LONG_GAMMA_PIN | UP trend (expanding) | 48.17 – 59.21 | 45.00 / 40.00 | 100.0% / 6.2% | ||||||
| INTC | 50.38 | LONG_GAMMA_PIN | UP bias | 46. |
32.2% / 16.1% |
Analyst Notes
Read the At a Glance table first, then jump into each symbol section for the full setup, risk map, and trade plan.
LQDA1. AAOI
Spot:Quick Take:37.74
这周大概率在 86.5–121.3 区间来回走。
Snapshot
| Item | Value |
|---|---|
| Spot | 103.91 |
| Report |
2026-04- |
| Execution Regime | LONG_GAMMA_PIN |
| Dealer |
LONG |
| Trend Path | UP trend (expanding) |
Trading Map
| Zone | Level / Range | Note |
|---|---|---|
| Weekly 68% | 86.55 – 121.27 | 1σ move 17.36 |
| Weekly 90% | 75.35 – 132.47 | wider risk band |
| Support | 80.00 | downside defense |
| Resistance | 100.00 | upside supply |
| Gamma Flip | 101.91 | regime pivot |
| Max Pain | NA | pin magnet |
Options & Probability Dashboard
| Metric | Value | Interpretation |
|---|---|---|
| Breakout Up | 49.9% | close above upper band |
| Breakout Down | 11.1% | close below lower band |
| Put/Call Volume | 0.95 | directional flow |
| Put/Call OI | 1.56 | positioning bias |
| Total Option Volume | 17,628 | nearest expiry |
| Total Open Interest | 13,668 | nearest expiry |
Term Structure
| Leg | Expiry | DTE | Forward | ATM IV | |
|---|---|---|---|---|---|
| 2026-04-10 | |||||
| E2 | 13 | 103.87 | 112.66% |
Weekly Range
StructureDistribution & Probabilities
Flow & Skew
Tail Risk
| Q10 | Q90 | |||||||
|---|---|---|---|---|---|---|---|---|
| 127.77 | 2.03 | 23.05 volpts |
DailyExecutive Technicals
Day PlanSummary
35.00-40.00这周大概率在 86.5–121.3 区间来回走。- 极端情况下可能到 75.4 或 132.5 附近。
- 80 是关键支撑(收盘跌破,下行风险会变大)。
- 100 是关键压力(收盘站上去才算转强)。
- 目前在分界线(约 101.91)上方;跌破它会更危险。
- 市场更倾向突破压力,而不是跌破支撑。
Trade Plans
Day Trade Plan
- 100-105 range: fade extremes
>40.00:100: chase only if hold + vol
- <
35.00:80: risk expand; reduce size Regime: TREND- Tech: UP
biastrend (expanding) - Vol: elevated (breakout odds↑)
Swing Trade Plan
- Accumulate:
35.00-35.0080-100 - Trim:
40.00-40.00100.0-100 - Add: close >
40.00100 - Cut: close <
35.00 Best for: trend regime80
Raw Text Summary
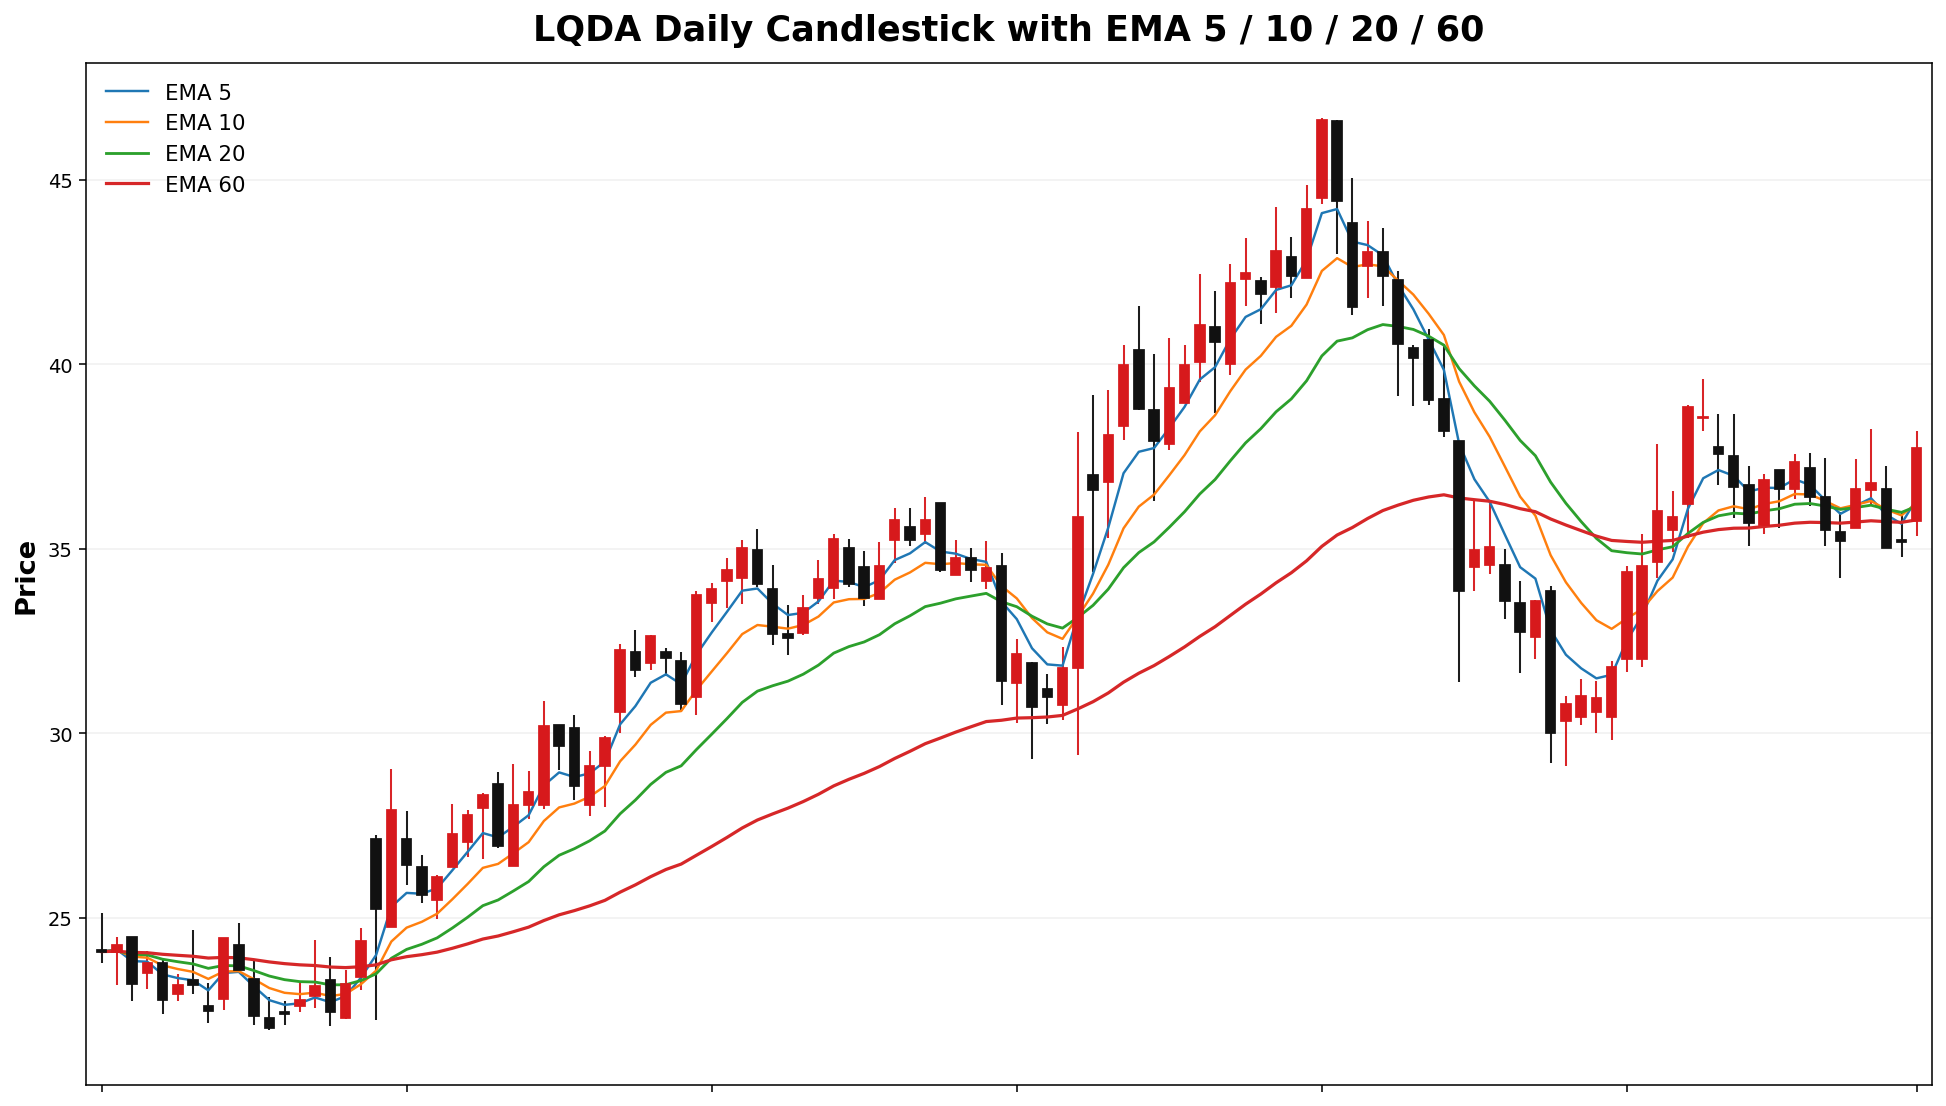
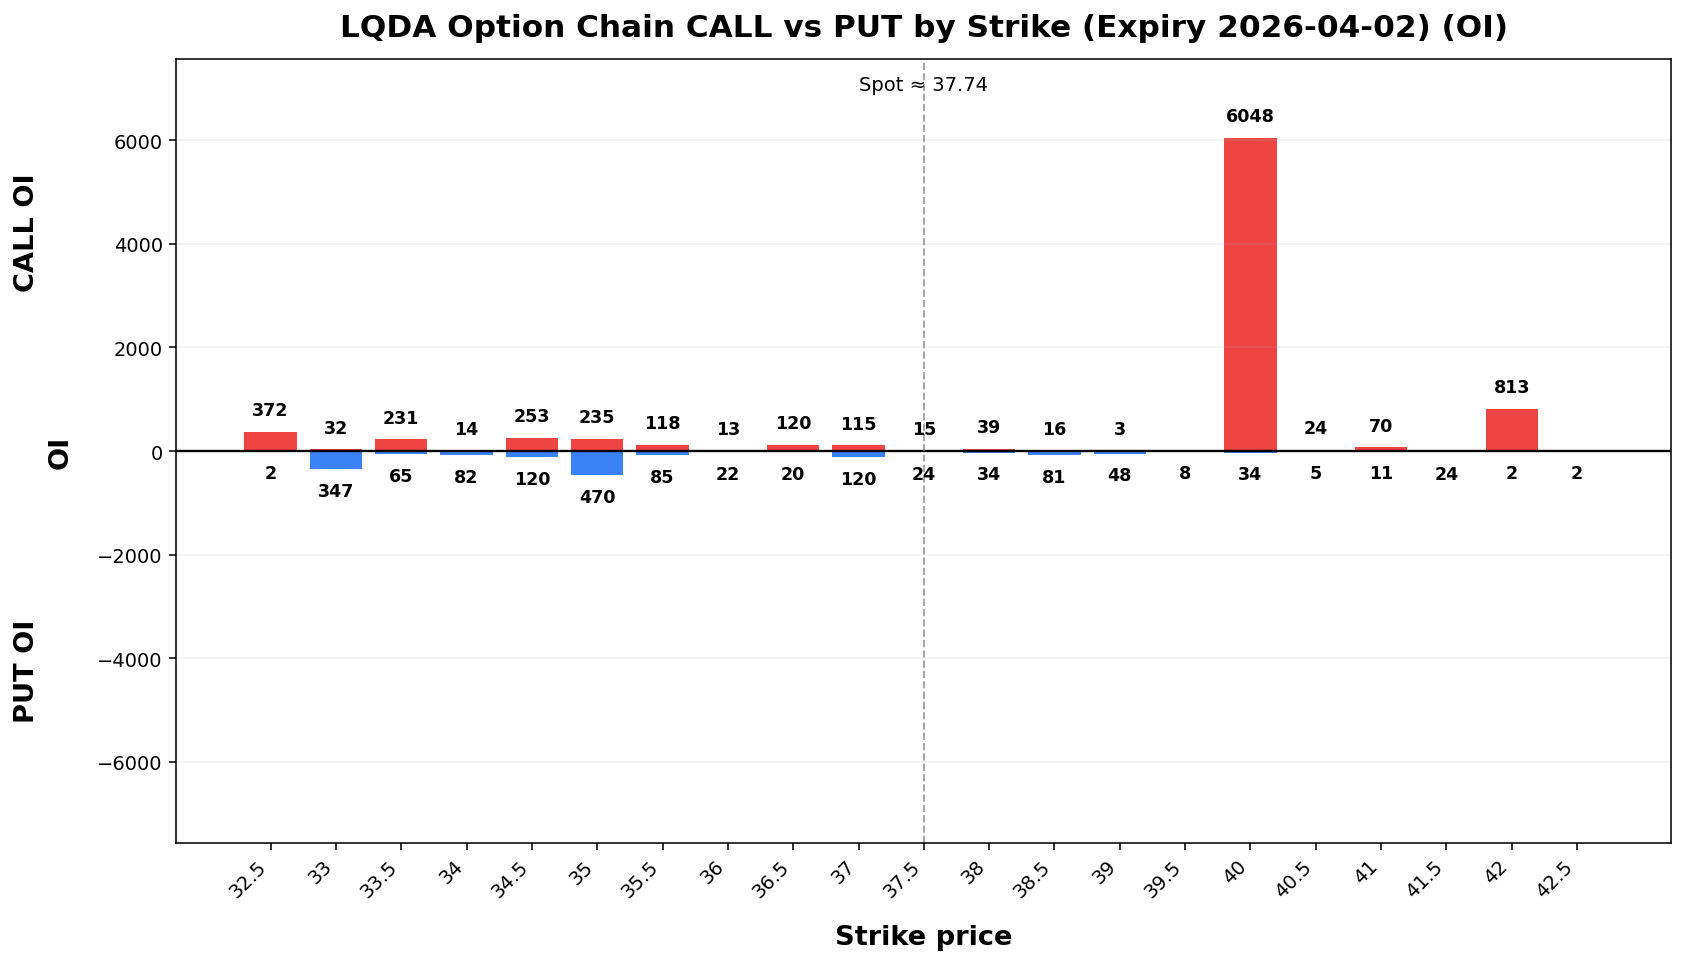
📌 LQDA @ 37.74 (2026-04-01 08:43 AM MYT)

• Current price is **37.74**. Key support is around **35.00**, and resistance is around **40.00**.
• For the next week, the model’s **68% expected range** is roughly **32.50 to 42.98**.
• A wider **90% range** is about **29.13 to 46.35**.
• Dealer positioning looks **SHORT gamma**, so the market behavior is classified as **TREND**.
• The estimated **gamma flip** is near **31.23**. Crossing and holding beyond this area can change the trading behavior.
• Approximate breakout odds: **above resistance 44.2%**, **below support 33.4%** by the target horizon.
• Options skew is tilted toward **calls**, which suggests upside speculation is relatively stronger.
• Near-term implied volatility is higher than the next expiry (**IV1 192.33% vs IV2 85.72%**), which suggests **near-term event stress / backwardation**.
• On the daily chart, the stock currently looks like **UP bias**.
• The implied distribution shows **heavier downside tail risk** than upside tail potential.
AXTI2. ASTS
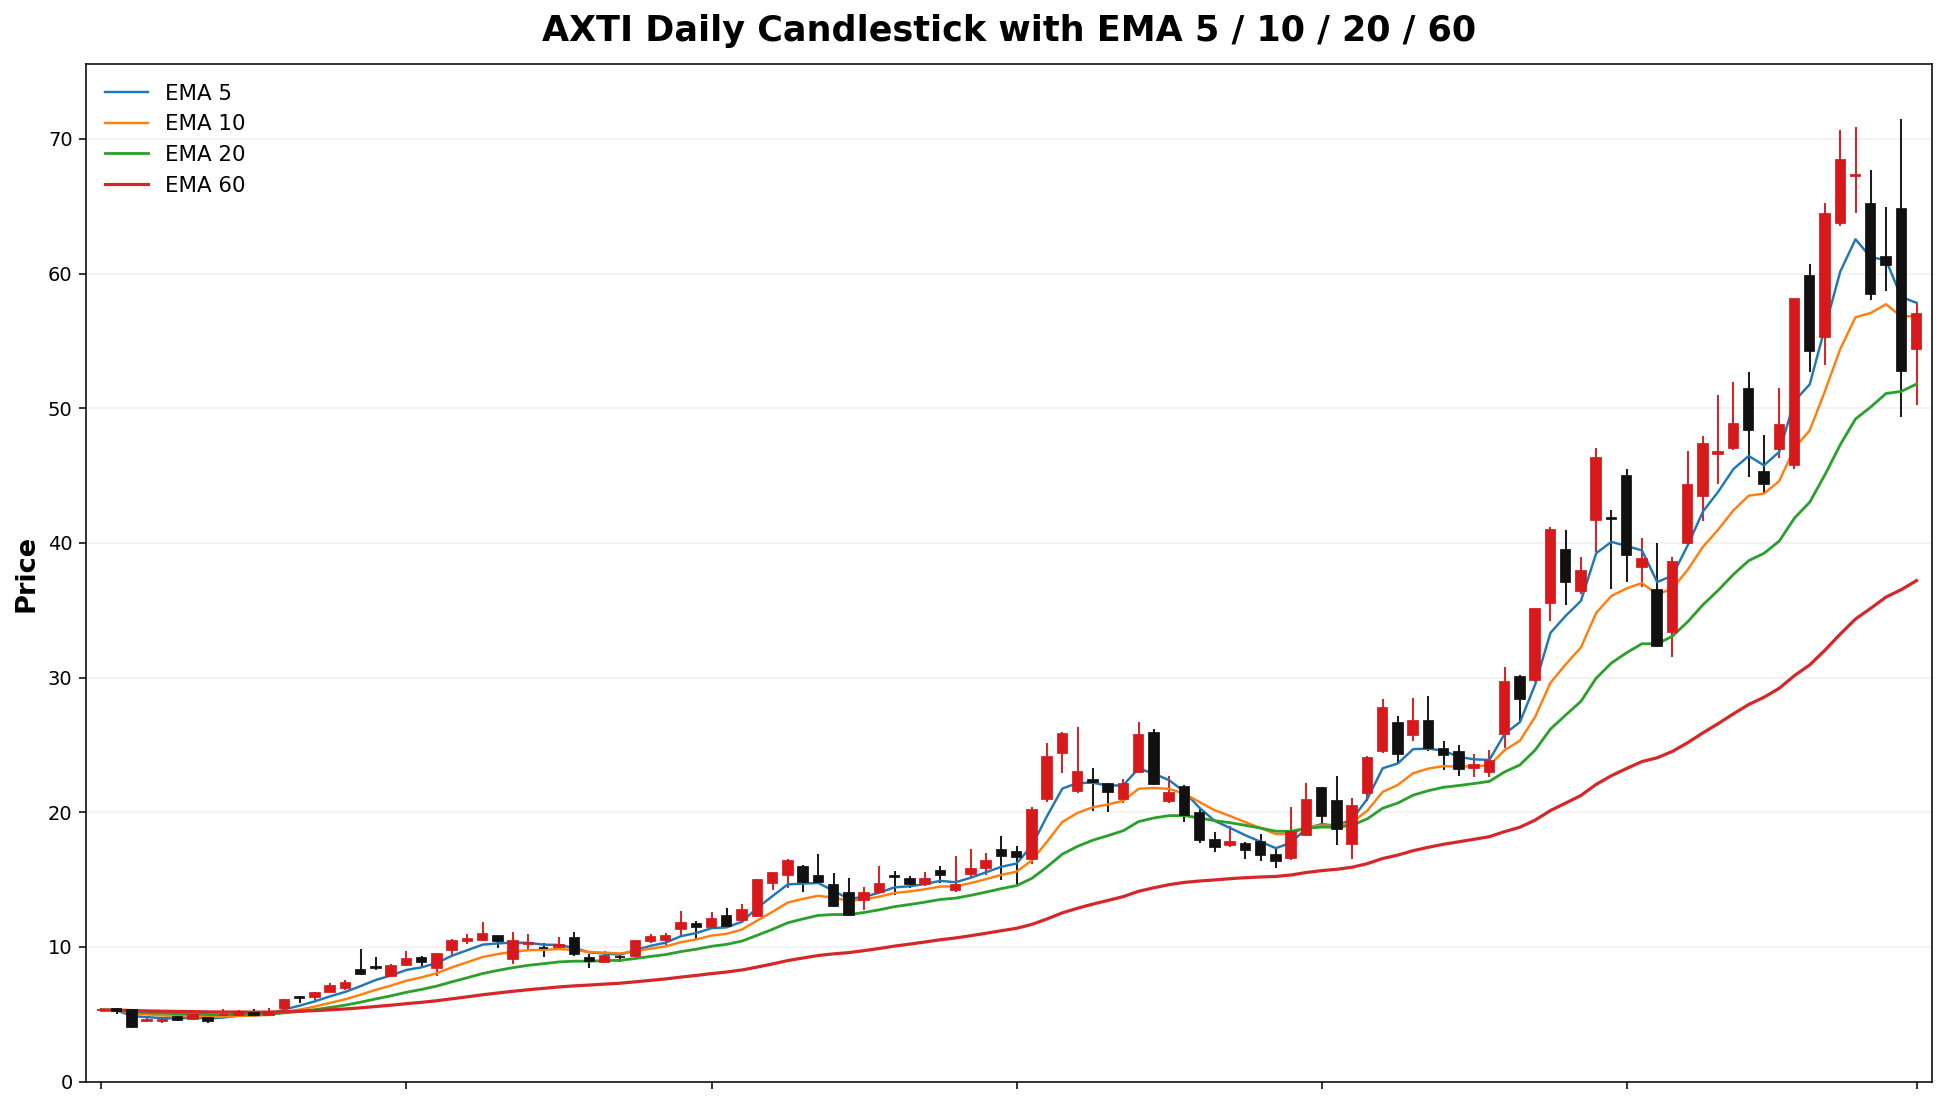
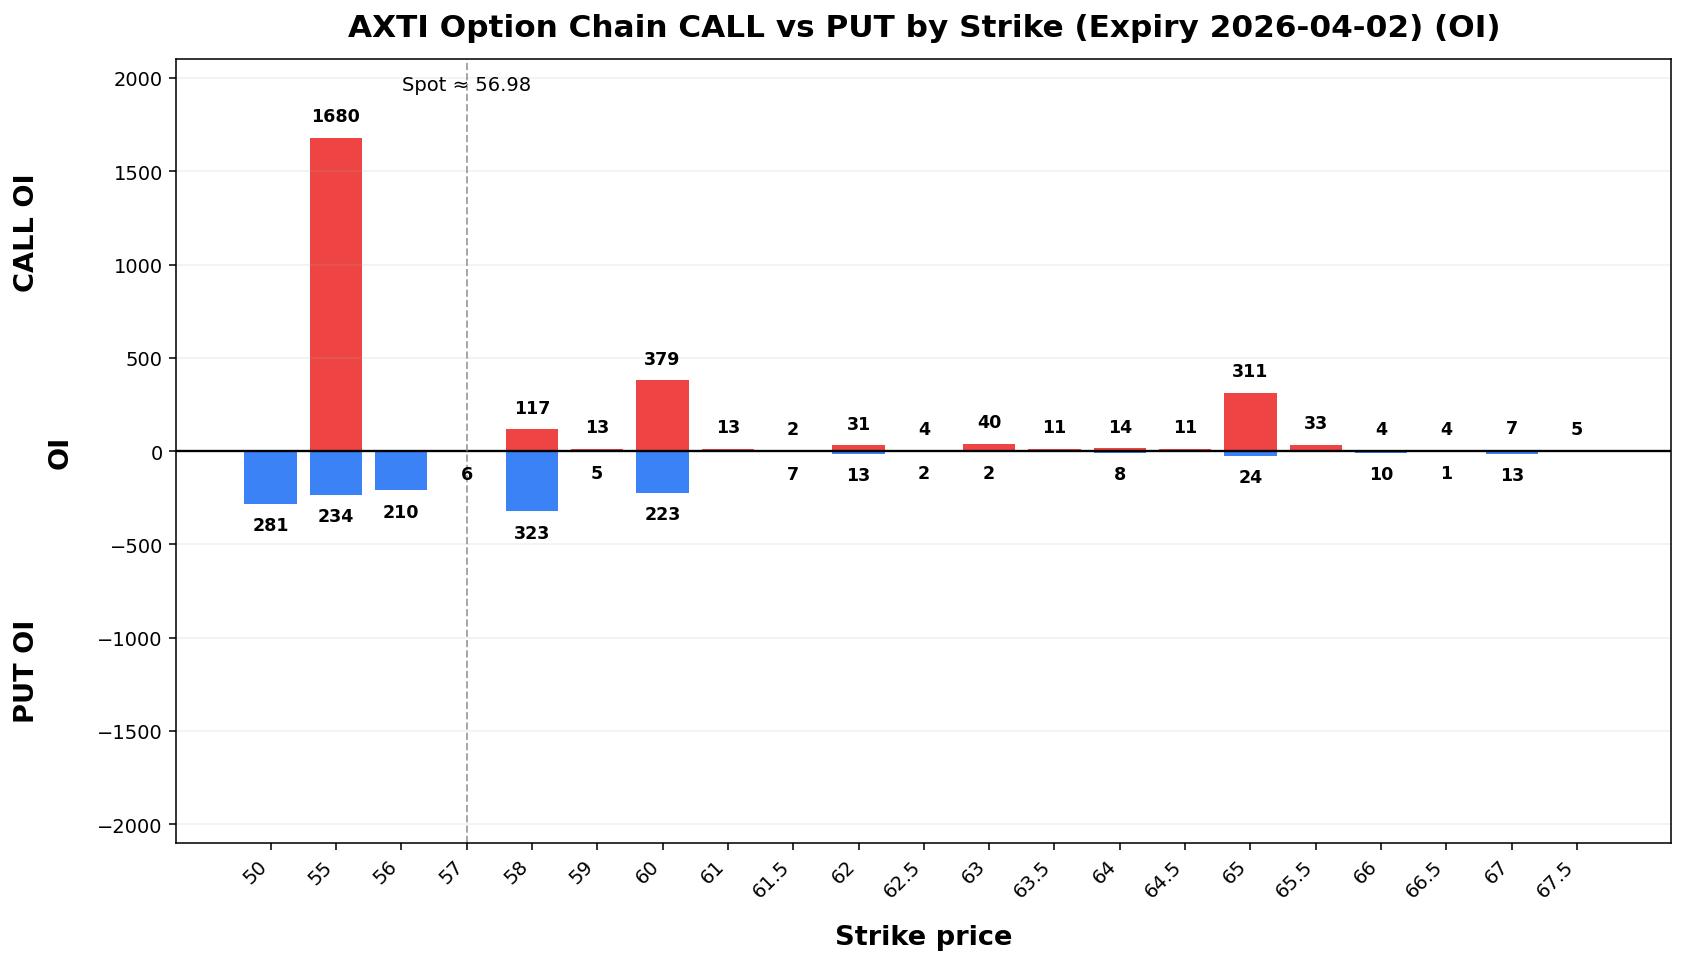
Spot:Quick Take:56.98
这周大概率在 81.0–104.2 区间来回走。
Snapshot
| Item | Value |
|---|---|
| Spot | 92.62 |
| Report |
2026-04- |
| Execution Regime | LONG_GAMMA_PIN |
| Dealer |
LONG |
| Trend Path | Sideways / Range |
Trading Map
| Zone | Level / Range | Note |
|---|---|---|
| Weekly 68% | 81.04 – 104.20 | 1σ move 11.58 |
| Weekly 90% | 73.57 – 111.67 | wider risk band |
| Support | 85.00 | downside defense |
| Resistance | 95.00 | upside supply |
| Gamma Flip | 85.90 | regime pivot |
| Max Pain | NA | pin magnet |
Options & Probability Dashboard
| Metric | Value | Interpretation |
|---|---|---|
| Breakout Up | 30.2% | close above upper band |
| Breakout Down | 24.4% | close below lower band |
| Put/Call Volume | 0.55 | directional flow |
| Put/Call OI | 0.58 | positioning bias |
| Total Option Volume | 32,561 | nearest expiry |
| Total Open Interest | 39,653 | nearest expiry |
Term Structure
| Leg | Expiry | DTE | Forward | ATM IV | |
|---|---|---|---|---|---|
| 2026-04-10 | |||||
| E2 | 13 | 92.72 | 85.94% |
Weekly Range
StructureDistribution & Probabilities
Flow & Skew
Tail Risk
| Q10 | Q90 | ||||
|---|---|---|---|---|---|
DailyExecutive TechnicalsSummary
- 这周大概率在 81.0–104.2 区间来回走。
- 极端情况下可能到 73.6 或 111.7 附近。
- 85 是关键支撑(收盘跌破,下行风险会变大)。
- 95 是关键压力(收盘站上去才算转强)。
- 目前在分界线(约 85.90)上方;跌破它会更危险。
- 市场更倾向突破压力,而不是跌破支撑。
Trade Plans
Day Trade Plan
- 90-95 range: fade extremes
-
95: chase only if hold + vol
- < 85: risk expand; reduce size
- Tech: Sideways / Range
Swing Trade Plan
- Accumulate: 85-90
- Trim: 94.5-95
- Add: close > 95
- Cut: close < 85
3. RKLB
Quick Take: 这周大概率在 60.2–75.3 区间来回走。
Snapshot
| Report Time | ||||||||
| Execution Regime | ||||||||
| Dealer Gamma | ||||||||
| Trend Path |
Trading Map
| Zone | Level / Range | Note |
|---|---|---|
| Weekly 68% | 60.17 – 75.29 | 1σ move 7.56 |
| Weekly 90% | 55.29 – 80.17 | wider risk band |
| Support | 60.00 | downside defense |
| Resistance | 70.00 | upside supply |
| Gamma Flip | 64.21 | regime pivot |
| Max Pain | NA | pin magnet |
Options & Probability Dashboard
| Metric | Value | Interpretation |
|---|---|---|
| Breakout Up | 29.3% | close above upper band |
| Breakout Down | 13.8% | close below lower band |
| Put/Call Volume | 0.52 | directional flow |
| Put/Call OI | 0.55 | positioning bias |
| Total Option Volume | 31,749 | nearest expiry |
| Total Open Interest | 40,436 | nearest expiry |
Term Structure
| Leg | Expiry | DTE | Forward | ATM IV |
|---|---|---|---|---|
| E1 | 2026-04-10 | 67.71 | 80.29% | |
| E2 | 2026-04-17 | 13 | 67.61 | 77.36% |
Distribution & Tail Risk
| Q10 | Median | Q90 | Tail Asymmetry | Skew (25ΔP-25ΔC) |
|---|---|---|---|---|
| 52.78 | 63.60 | 78.83 | 1.35 | 2.93 volpts |
Executive Summary
- 这周大概率在 60.2–75.3 区间来回走。
- 极端情况下可能到 55.3 或 80.2 附近。
- 60 是关键支撑(收盘跌破,下行风险会变大)。
- 70 是关键压力(收盘站上去才算转强)。
- 目前在分界线(约 64.21)上方;跌破它会更危险。
- 市场更倾向突破压力,而不是跌破支撑。
Trade Plans
Day Trade Plan
- 67-70 range: fade extremes
-
70: chase only if hold + vol
- < 60: risk expand; reduce size
- Tech: DOWN trend (expanding)
Swing Trade Plan
- Accumulate: 60-67
- Trim: 69.5-70
- Add: close > 70
- Cut: close < 60
4. SATS
Quick Take: 这周大概率在 117.4–140.0 区间来回走。
Snapshot
| Item | Value |
|---|---|
| Spot | 128.68 |
| Report Time | 2026-04-05 08:00 AM MYT |
| Execution Regime | LONG_GAMMA_PIN |
| Dealer Gamma | LONG |
| Trend Path | UP trend (expanding) |
DayTrading PlanMap
| Zone | Level / Range | Note |
|---|---|---|
| Weekly 68% | 117.40 – 139.96 | 1σ move 11.28 |
| Weekly 90% | 110.13 – 147.23 | wider risk band |
| Support | 94.00 | downside defense |
| Resistance | 123.00 | upside supply |
| Gamma Flip | 127.11 | regime pivot |
| Max Pain | NA | pin magnet |
Options & Probability Dashboard
| Metric | Value | Interpretation |
|---|---|---|
| Breakout Up | 63.7% | close above upper band |
| Breakout Down | 0.1% | close below lower band |
| Put/Call Volume | 0.16 | directional flow |
| Put/Call OI | 1.08 | positioning bias |
| Total Option Volume | 6,156 | nearest expiry |
| Total Open Interest | 4,079 | nearest expiry |
Term Structure
| Leg | Expiry | DTE | Forward | ATM IV |
|---|---|---|---|---|
| E1 | 2026-04-10 | 6 | 129.06 | 64.24% |
| E2 | 2026-04-17 | 13 | 127.98 | 58.44% |
Distribution & Tail Risk
| Q10 | Median | Q90 | Tail Asymmetry | Skew (25ΔP-25ΔC) |
|---|---|---|---|---|
| 113.43 | 124.81 | 150.35 | 0.70 | -0.46 volpts |
Executive Summary
56.00-58.00这周大概率在 117.4–140.0 区间来回走。- 极端情况下可能到 110.1 或 147.2 附近。
- 94 是关键支撑(收盘跌破,下行风险会变大)。
- 123 是关键压力(收盘站上去才算转强)。
- 目前在分界线(约 127.11)上方;跌破它会更危险。
- 市场更倾向突破压力,而不是跌破支撑。
Trade Plans
Day Trade Plan
- 123-131 range: fade extremes
>58.00:123: chase only if hold + vol
- <
56.00:94: risk expand; reduce size Regime: TREND- Tech: UP trend (expanding)
Swing Trade Plan
- Accumulate:
56.00-56.0094-123 - Trim:
58.00-58.00123.0-123 - Add: close >
58.00123 - Cut: close <
56.00 Best for: trend regimeBias: downside break risk elevated94
Raw5. TextVSAT
Summary
📌Quick
AXTITake:@这周大概率在56.9848.2–59.2(区间来回走。
Snapshot
| Item | Value |
|---|---|
| Spot | 53.69 |
| Report Time | 2026-04- |
| Execution |
LONG_GAMMA_PIN |
| Dealer |
LONG |
| Trend |
UP trend (expanding) |
Trading showsMap
| Zone | Level / Range | Note |
|---|---|---|
| Weekly 68% | 48.17 – 59.21 | 1σ move 5.52 |
| Weekly 90% | 44.61 – 62.77 | wider risk band |
| Support | 45.00 | downside |
| Resistance | 40.00 | upside |
| Gamma Flip | 49.00 | regime pivot |
| Max Pain | NA | pin magnet |
Options & Probability Dashboard
| Metric | Value | Interpretation |
|---|---|---|
| Breakout Up | 100.0% | close above upper band |
| Breakout Down | 6.2% | close below lower band |
| Put/Call Volume | 0.15 | directional flow |
| Put/Call OI | 0.20 | positioning bias |
| Total Option Volume | 5,966 | nearest expiry |
| Total Open Interest | 32,002 | nearest expiry |
Term Structure
| Leg | Expiry | DTE | Forward | ATM IV |
|---|---|---|---|---|
| E1 | 2026-04-17 | 13 | 53.13 | 72.51% |
| E2 | 2026-05-15 | 41 | 53.37 | 72.11% |
Distribution & Tail Risk
| Q10 | Median | Q90 | Tail Asymmetry | Skew (25ΔP-25ΔC) |
|---|---|---|---|---|
| 40.39 | 51.39 | 61.68 | 1.66 | 0.34 volpts |
Executive Summary
- 这周大概率在 48.2–59.2 区间来回走。
- 极端情况下可能到 44.6 或 62.8 附近。
- 45 是关键支撑(收盘跌破,下行风险会变大)。
- 40 是关键压力(收盘站上去才算转强)。
- 目前在分界线(约 49.00)上方;跌破它会更危险。
- 市场更倾向突破压力,而不是跌破支撑。
Trade Plans
Day Trade Plan
- 48-55 range: fade extremes
-
40: chase only if hold + vol
- < 45: risk expand; reduce size
- Tech: UP trend (expanding)
- Vol: elevated (breakout odds↑)
Swing Trade Plan
- Accumulate: 45-48
- Trim: 40.0-40
- Add: close > 40
- Cut: close < 45
6. INTC
Quick Take: 这周大概率在 46.5–54.3 区间来回走。
Snapshot
| Item | Value |
|---|---|
| Spot | 50.38 |
| Report Time | 2026-04-05 08:00 AM MYT |
| Execution Regime | LONG_GAMMA_PIN |
| Dealer Gamma | LONG |
| Trend Path | UP bias |
Trading Map
| Zone | Level / Range | Note |
|---|---|---|
| Weekly 68% | 46.50 – 54.26 | 1σ move 3.88 |
| Weekly 90% | 44.00 – 56.76 | wider risk band |
| Support | 48.00 | downside defense |
| Resistance | 50.00 | upside supply |
| Gamma Flip | 44.86 | regime pivot |
| Max Pain | NA | pin magnet |
Options & Probability Dashboard
| Metric | Value | Interpretation |
|---|---|---|
| Breakout Up | 32.2% | close above upper band |
| Breakout Down | 16.1% | close below lower band |
| Put/Call Volume | 1.01 | directional flow |
| Put/Call OI | 0.63 | positioning bias |
| Total Option Volume | 155,198 | nearest expiry |
| Total Open Interest | 134,385 | nearest expiry |
Term Structure
| Leg | Expiry | DTE | Forward | ATM IV |
|---|---|---|---|---|
| E1 | 2026-04-10 | 6 | 50.40 | 55.51% |
| E2 | 2026-04-17 | 13 | 50.43 | 53.09% |
Distribution & Tail Risk
| Q10 | Median | Q90 | Tail Asymmetry | Skew (25ΔP-25ΔC) |
|---|---|---|---|---|
| 40.45 | 50.07 | 55.95 | 1.78 | -1.46 volpts |
Executive Summary
- 这周大概率在 46.5–54.3 区间来回走。
- 极端情况下可能到 44.0 或 56.8 附近。
- 48 是关键支撑(收盘跌破,下行风险会变大)。
- 50 是关键压力(收盘站上去才算转强)。
- 目前在分界线(约 44.86)上方;跌破它会更危险。
- 市场更倾向突破压力,而不是跌破支撑。
Trade Plans
Day Trade Plan
- 50-52 range: fade extremes
-
50: chase only if hold + vol
- < 48: risk expand; reduce size
- Tech: UP bias
Swing Trade Plan
- Accumulate: 48-50
- Trim: 50.0-50
- Add: close > 50
- Cut: close < 48
Generated by stocks-automation (Markdown edition)