Analysis Report
Updated: 2026-04-05 08:07:3718:52:27 MYT
Source File: combined-summary-20260405-080036.185212.md
Report
Overview
Screening
Generated:Source: 2026-04-05screen-report-20260405-161723.md
08:00Extracted AM MYT
Symbols Covered:Symbols: 6Format:TSEM, CombinedUSO, markdownPL, briefing
NBIS, AtFSLY, aSEDG, Glance
AA, AAOI, CRWV, DOCN, UVXY, GSAT, GUSH, SQQQ, BE, ASTS, SATS, BKSY, SOXL, VIAV, RKLB, ALB, AU, NUGT, LABU, EWY, PBF, CRDO
Topline Summary
| Symbol |
Spot |
Support |
Resistance |
Flip |
Regime |
PathP>Res |
Weekly 68%P<Sup |
Support68% / ResistanceRange |
Breakout90% ↑ / ↓Range |
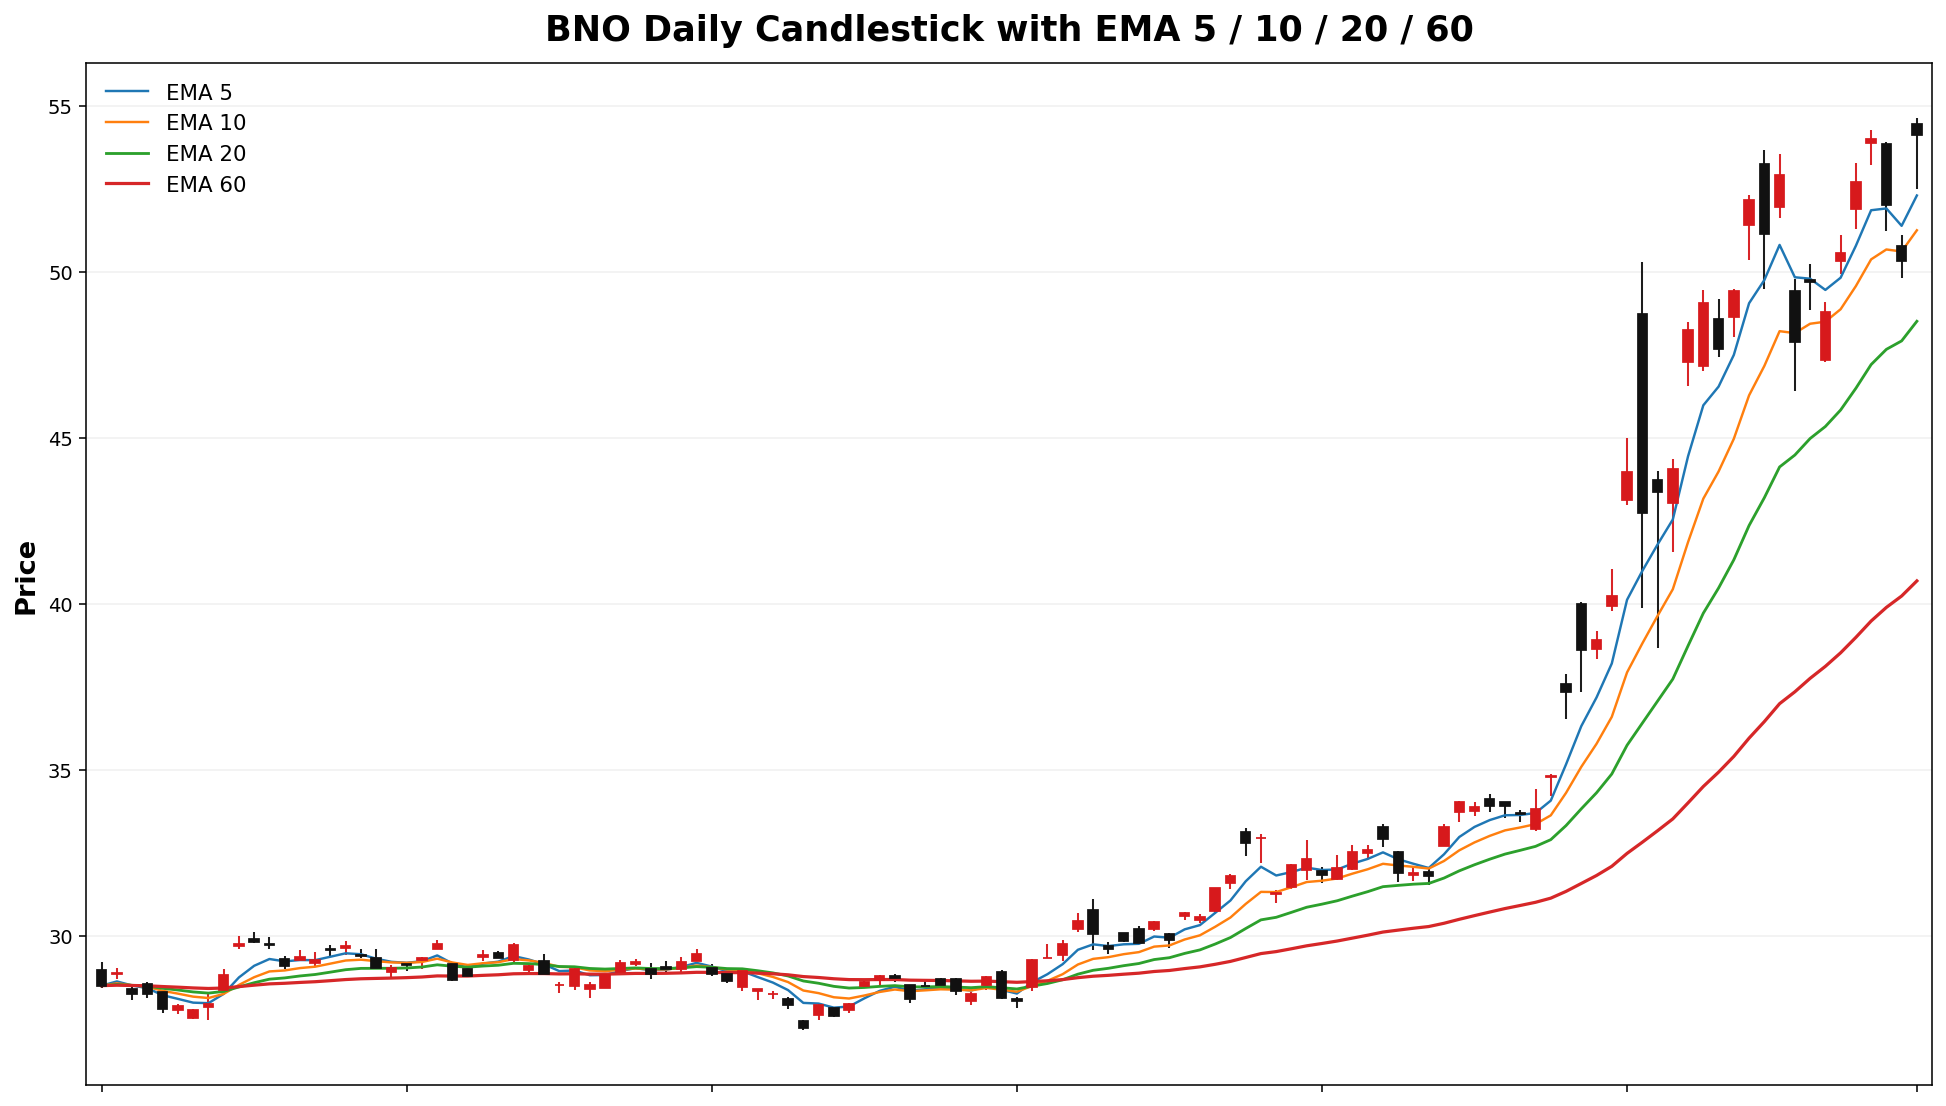
| BNO |
54.12 |
54.00 |
55.00 |
33.10 |
TRANSITION |
45.1% |
40.6% |
45.39 - 62.85 |
39.76 - 68.48 |
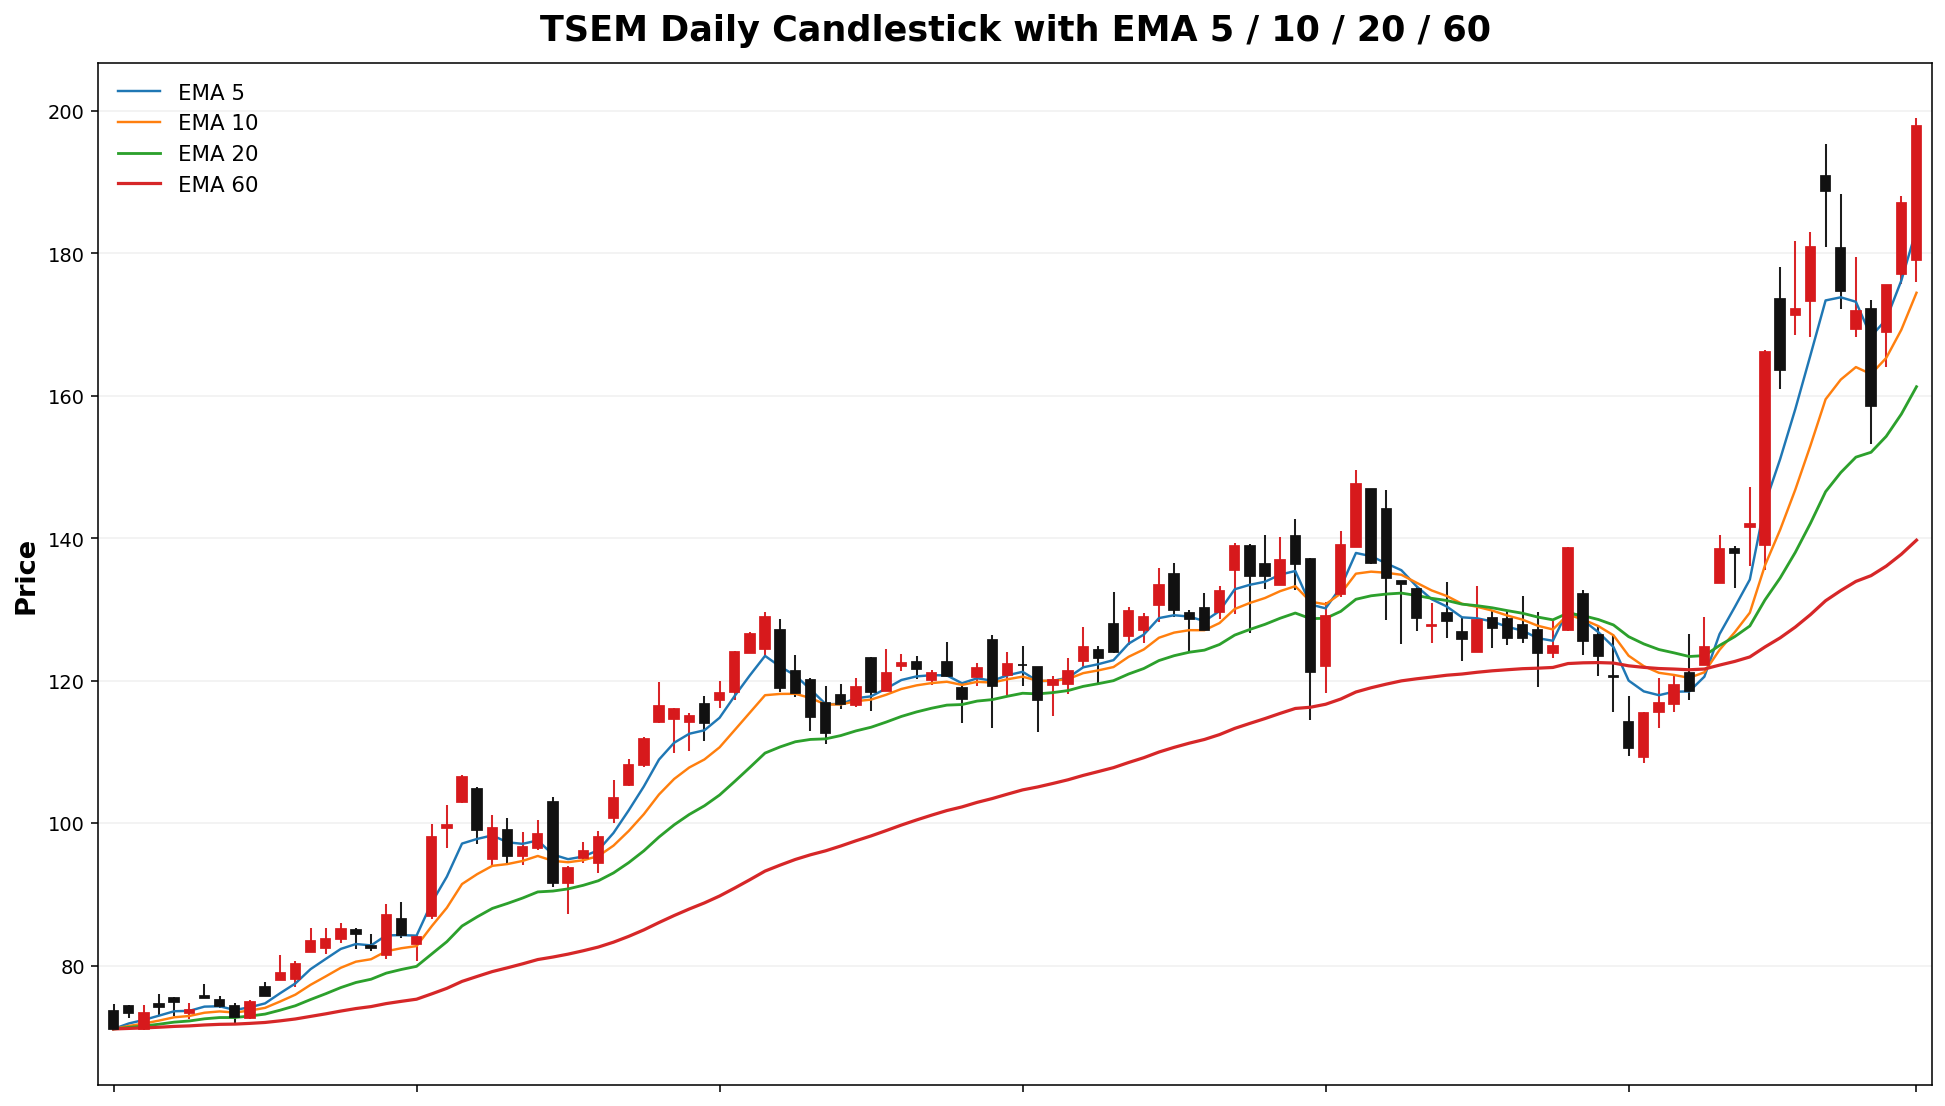
| TSEM |
197.80 |
180.00 |
200.00 |
173.50 |
TRANSITION |
34.4% |
18.0% |
176.60 - 219.00 |
162.93 - 232.67 |
| USO |
137.92 |
135.00 |
140.00 |
117.44 |
TRANSITION |
44.6% |
35.8% |
119.66 - 156.18 |
107.88 - 167.96 |
| PL |
35.88 |
35.00 |
40.91 |
31.03 |
TREND |
17.6% |
57.2% |
30.85 - 40.91 |
27.61 - 44.15 |
| UCO |
39.66 |
35.00 |
40.00 |
27.95 |
TRANSITION |
43.7% |
17.4% |
33.40 - 45.92 |
29.36 - 49.96 |
| NBIS |
108.82 |
105.00 |
110.00 |
103.79 |
TRANSITION |
35.0% |
33.5% |
97.61 - 120.03 |
90.38 - 127.26 |
| FSLY |
33.50 |
33.00 |
35.00 |
26.95 |
TRANSITION |
32.9% |
40.7% |
29.02 - 37.98 |
26.13 - 40.87 |
| SEDG |
48.75 |
48.00 |
50.00 |
47.91 |
TREND |
46.3% |
50.2% |
43.09 - 54.41 |
39.44 - 58.06 |
| AA |
71.53 |
71.00 |
72.00 |
59.71 |
TRANSITION |
35.3% |
41.9% |
65.23 - 77.83 |
61.17 - 81.89 |
| AAOI |
103.91 |
LONG_GAMMA_PIN100.00 |
UP105.00 |
trend105.89 |
(expanding)PIN |
43.7% |
45.4% |
86.5513 –- 121.2769 |
74.66 - 133.16 |
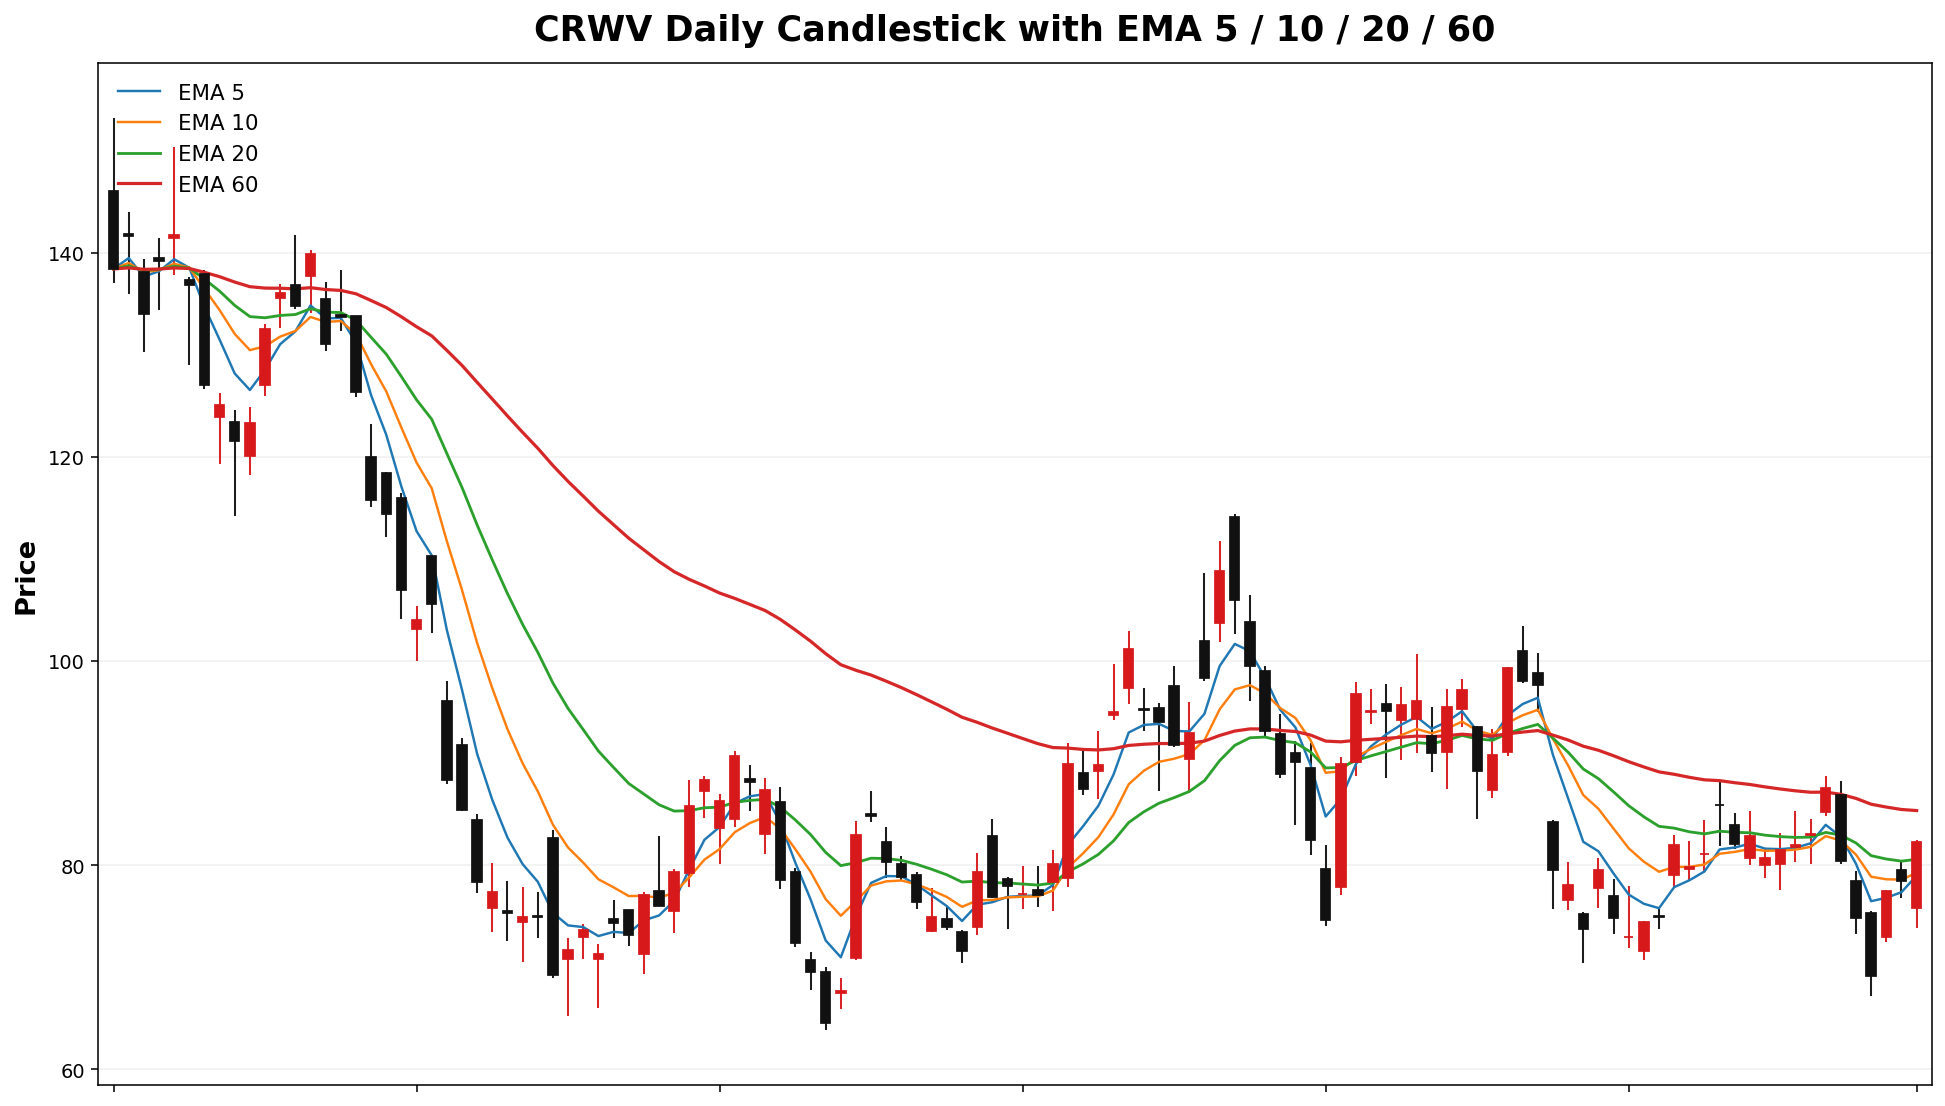
| CRWV |
82.24 |
80.00 |
/ 100.85.00 |
79.69 |
TRANSITION |
30.8% |
39.1% |
73.54 - 90.94 |
67.93 - 96.55 |
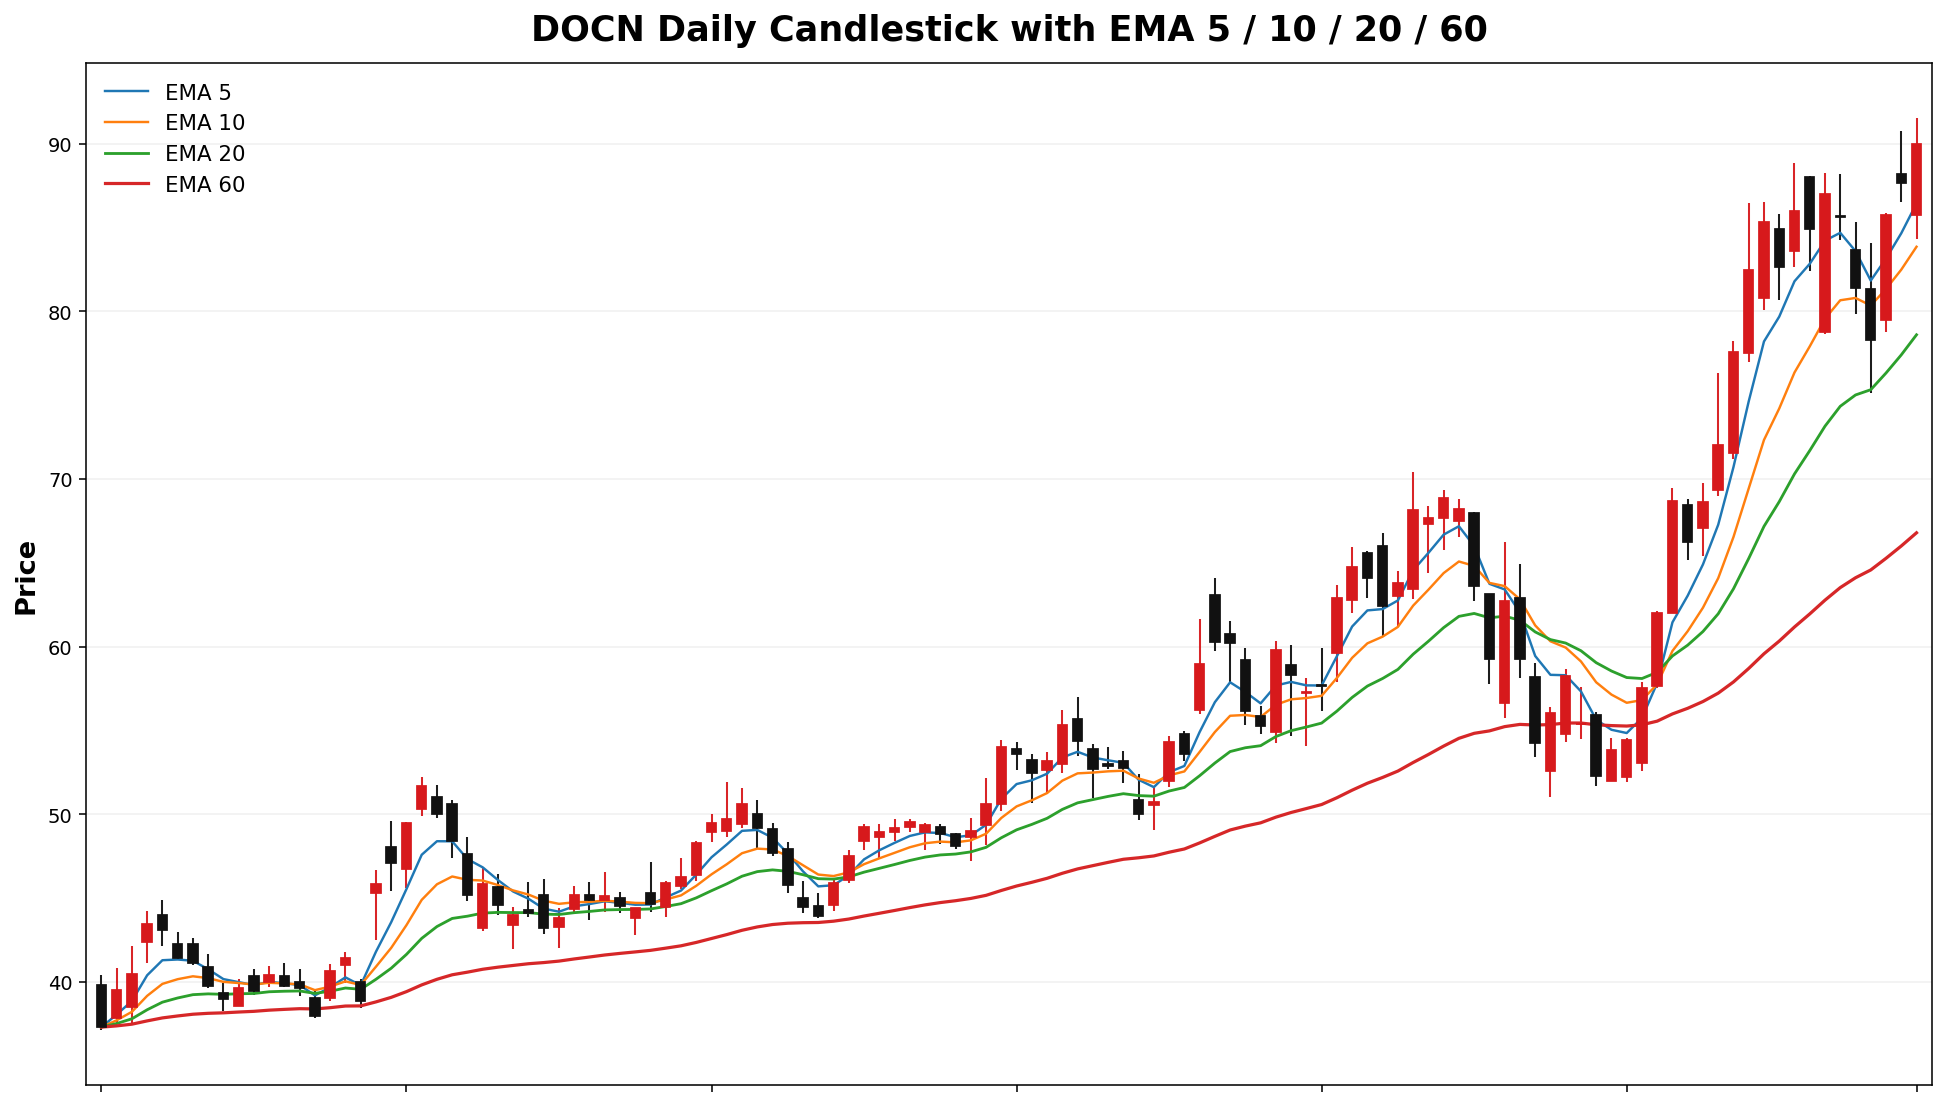
| DOCN |
90.01 |
90.00 |
99.60 |
66.90 |
TRANSITION |
12.1% |
45.6% |
80.42 - 99.60 |
74.23 - 105.79 |
| UVXY |
50.53 |
50.00 |
55.00 |
44.89 |
TRANSITION |
27.6% |
36.3% |
41.92 - 59.14 |
36.37 - 64.69 |
| GSAT |
77.73 |
70.00 |
80.00 |
52.51 |
TRANSITION |
41.2% |
22.5% |
67.47 - 87.99 |
60.86 - 94.60 |
| GUSH |
42.16 |
40.00 |
43.00 |
NA |
TRANSITION |
35.0% |
31.1% |
37.64 - 46.68 |
34.72 - 49.60 |
| SQQQ |
77.29 |
77.00 |
80.00 |
78.00 |
PIN |
34.3% |
39.7% |
70.27 - 84.31 |
65.74 - 88.84 |
| BE |
135.63 |
135.00 |
150.00 |
141.98 |
TREND |
20.6% |
59.9% |
/118.62 11.1%- 152.64 |
107.65 - 163.61 |
| ASTS |
92.62 |
LONG_GAMMA_PIN |
Sideways / Range |
81.04 – 104.20 |
85.00 / 95.90.00 |
93.00 |
78.42 |
TRANSITION |
40.0% |
40.5% |
80.73 - 104.51 |
73.06 - 112.18 |
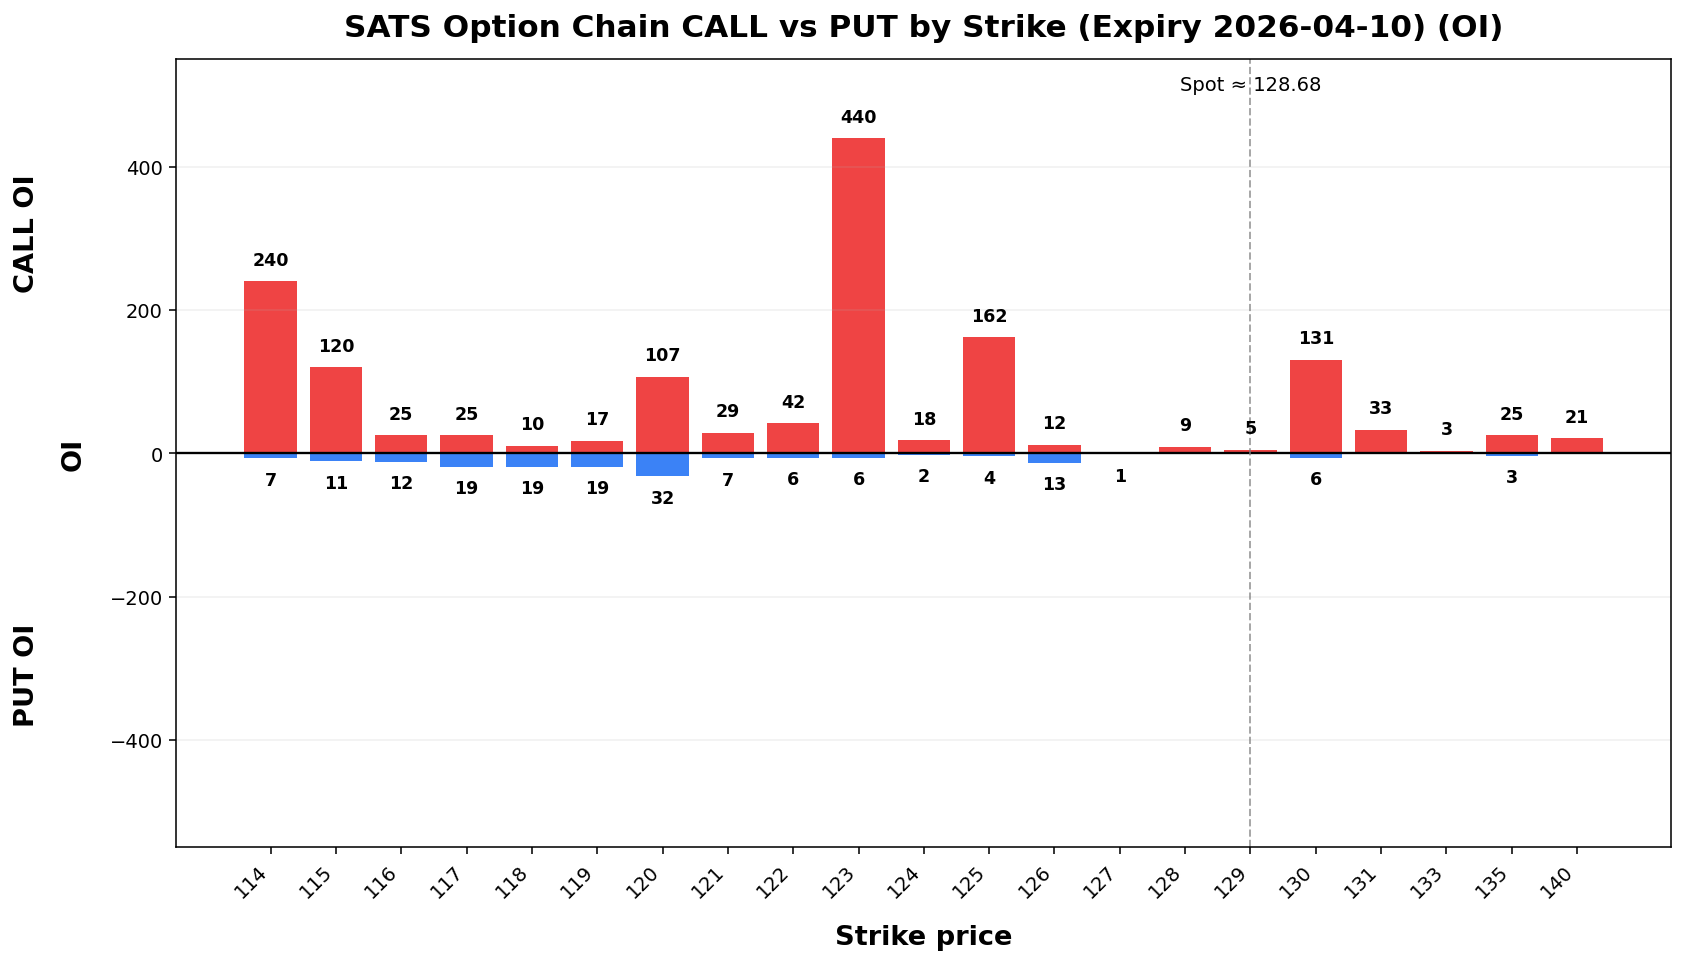
| SATS |
128.68 |
125.00 |
130.00 |
107.33 |
TRANSITION |
40.6% |
33.5% |
117.14 - 140.22 |
109.70 - 147.66 |
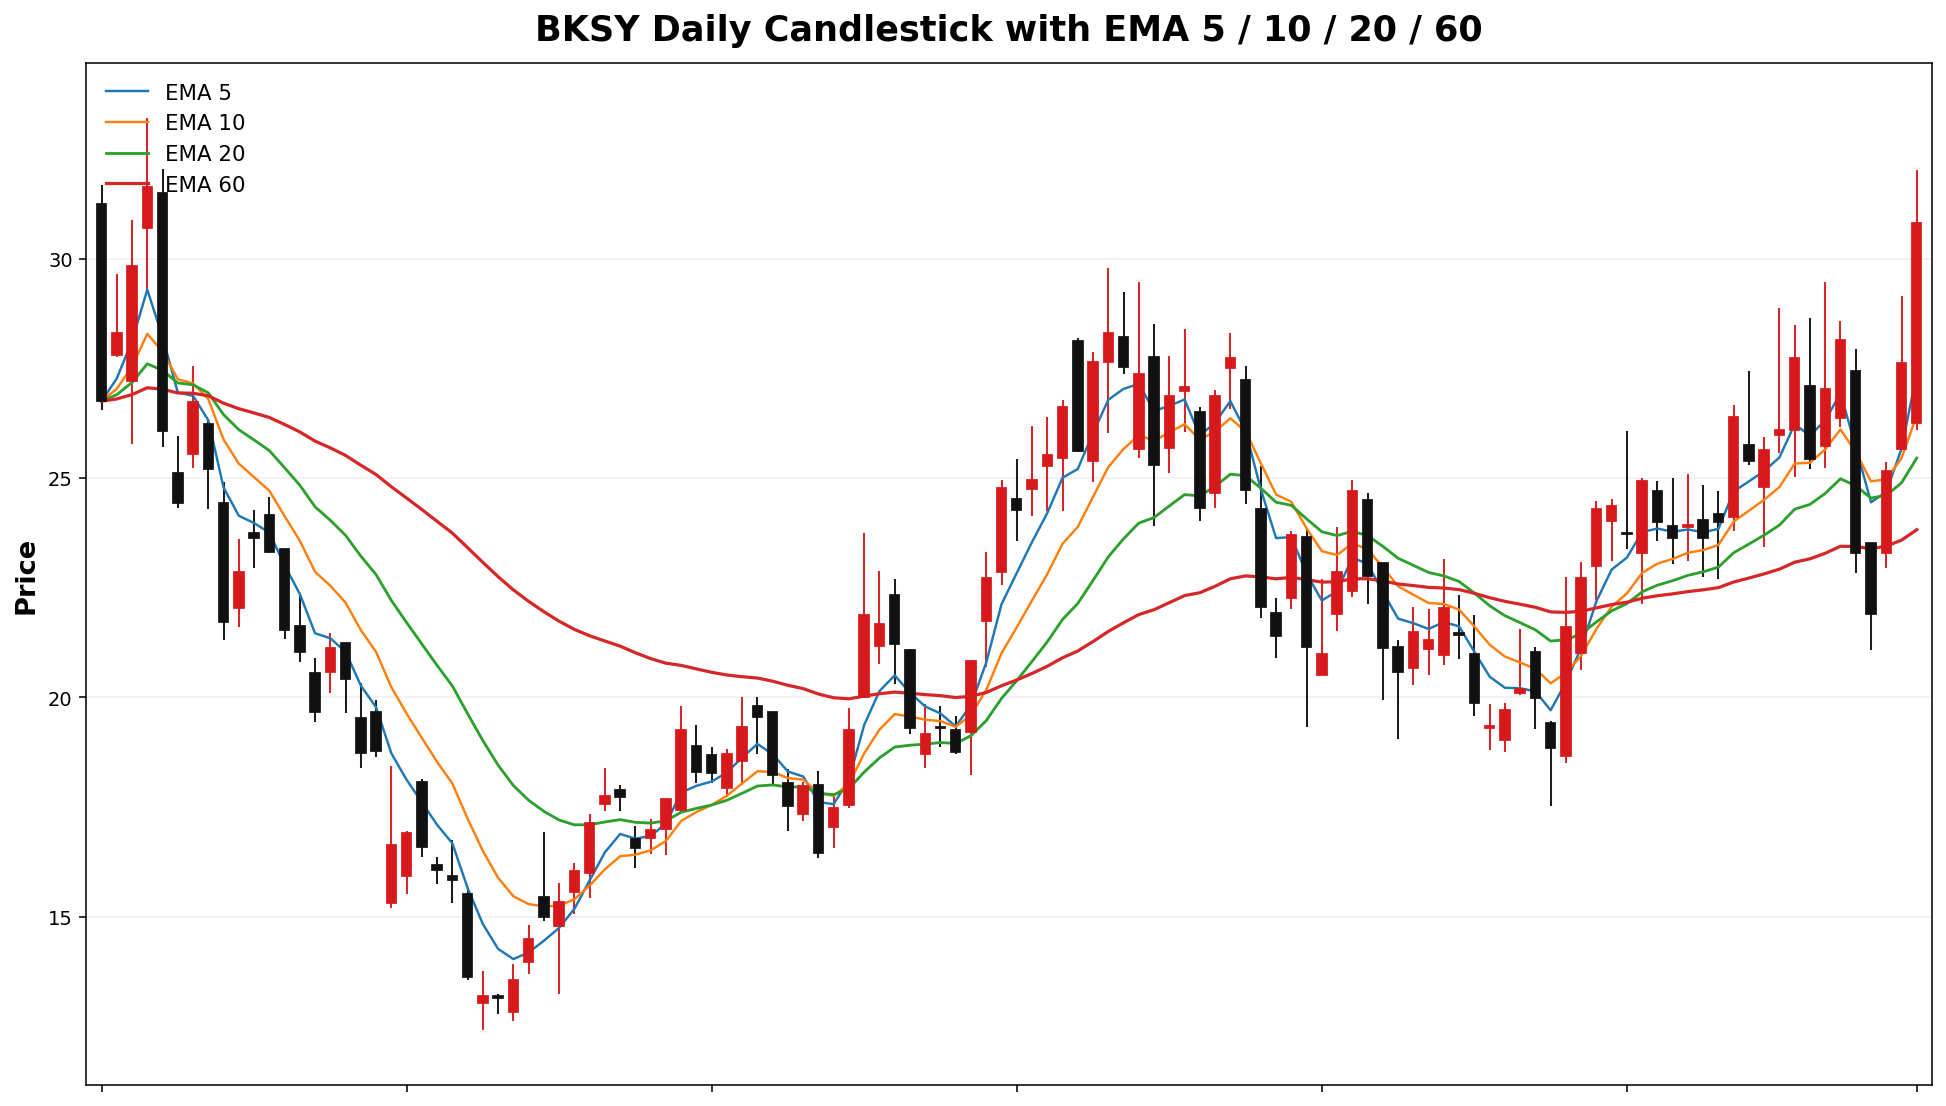
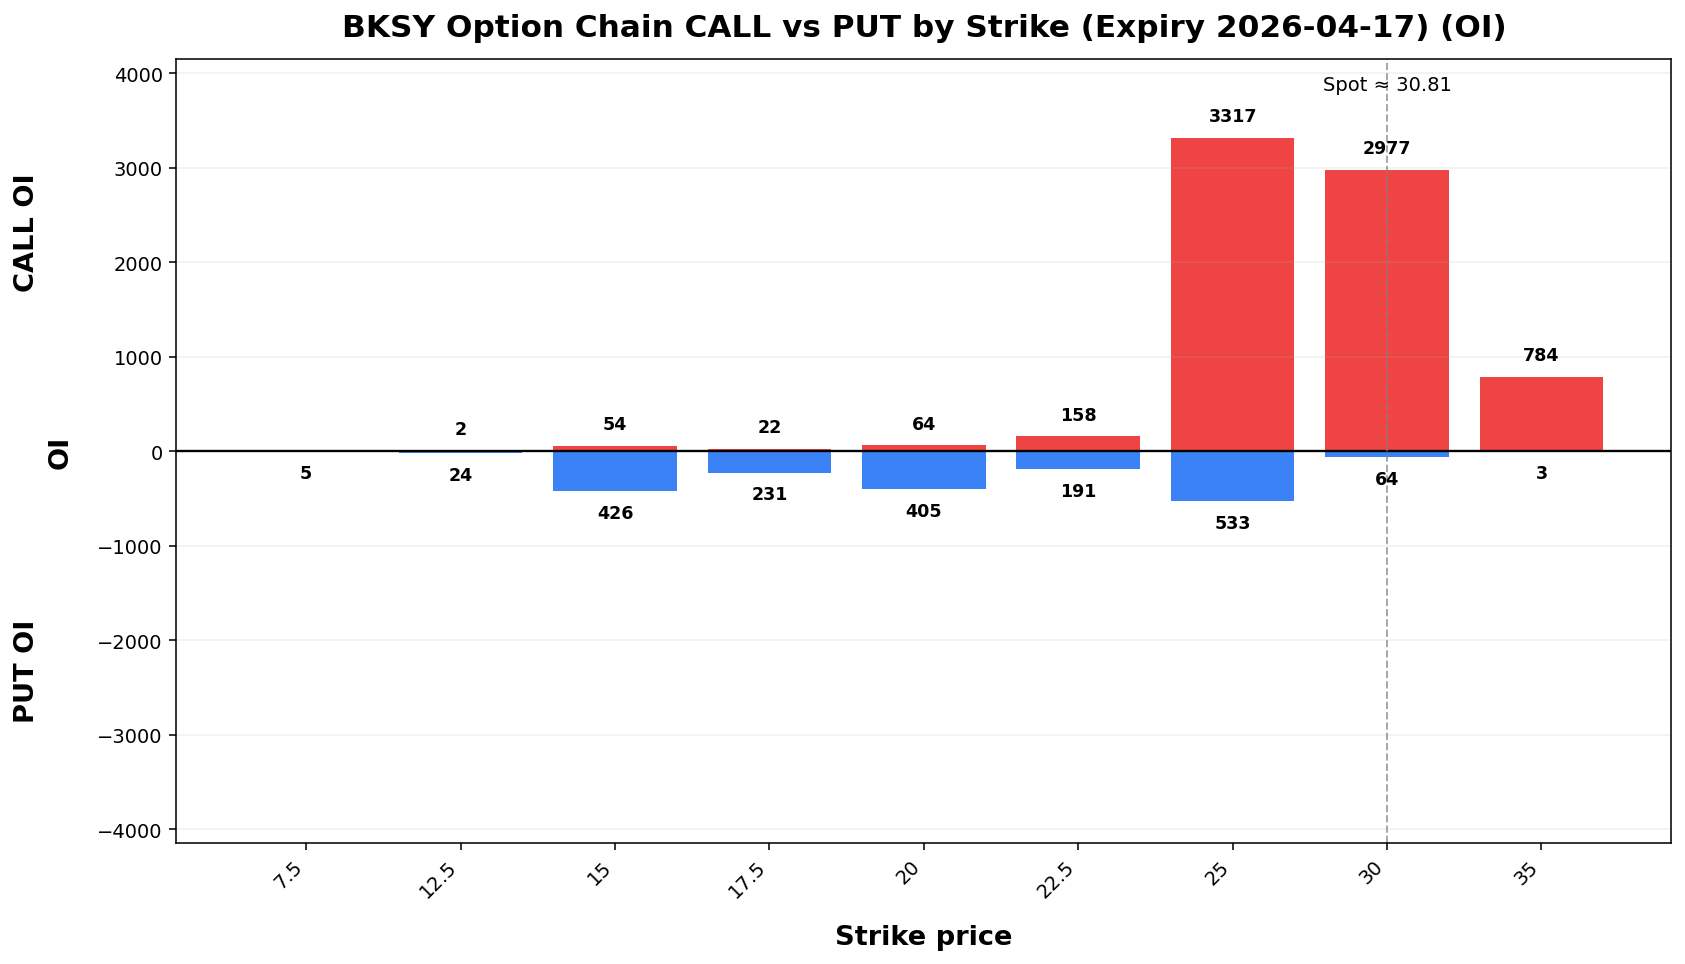
| BKSY |
30.2%81 |
/30.00 |
24.35.00 |
16.56 |
TRANSITION |
16.9% |
47.4% |
26.17 - 35.45 |
23.17 - 38.45 |
| SOXL |
52.75 |
50.00 |
56.00 |
48.12 |
TRANSITION |
27.9% |
35.7% |
44.86 - 60.64 |
39.77 - 65.73 |
| VIAV |
36.89 |
36.00 |
38.00 |
32.76 |
TRANSITION |
33.0% |
34.6% |
32.64 - 41.14 |
29.90 - 43.88 |
| RKLB |
67.73 |
LONG_GAMMA_PIN65.00 |
DOWN trend (expanding) |
60.17 – 75.29 |
60.00 / 70.00 |
29.3%62.19 |
/TRANSITION |
13.8%31.6% |
35.6% |
59.96 - 75.50 |
54.95 - 80.51 |
SATSALB |
128.178.09 |
160.00 |
180.00 |
182.68 |
LONG_GAMMA_PINTRANSITION |
UP trend (expanding)34.2% |
117.40 – 139.969.9% |
94.00163.45 /- 123.00192.73 |
63.7%154.02 /- 0.1%202.16 |
VSATAU |
53.69101.22 |
LONG_GAMMA_PIN |
UP trend (expanding) |
48.17 – 59.21 |
45.00 / 40.100.00 |
100.0%110.00 |
/95.76 |
6.2%TRANSITION |
11.9% |
40.5% |
92.55 - 109.89 |
86.97 - 115.47 |
INTCNUGT |
50.38199.37 |
LONG_GAMMA_PIN190.00 |
UP200.00 |
bias191.69 |
TRANSITION |
40.3% |
36.3% |
171.23 - 227.51 |
153.08 - 245.66 |
| LABU |
171.64 |
170.00 |
175.00 |
137.78 |
TRANSITION |
36.2% |
46.50 – 54.262% |
48.00149.13 /- 50.194.15 |
134.61 - 208.67 |
| EWY |
122.87 |
120.00 |
32.2%125.00 |
/135.02 |
TREND |
42.9% |
47.8% |
112.88 - 132.86 |
106.44 - 139.30 |
| PBF |
45.39 |
40.00 |
49.00 |
38.31 |
TRANSITION |
16.1%9% |
8.9% |
41.04 - 49.74 |
38.24 - 52.54 |
| CRDO |
101.45 |
100.00 |
103.00 |
92.60 |
TRANSITION |
33.7% |
40.6% |
90.93 - 111.97 |
84.15 - 118.75 |
Analyst Notes
Read the At a Glance table first, then jump into each symbol section for the full setup, risk map, and trade plan.
1. AAOIBNO
Quick Take:Spot: 这周大概率在54.12
86.5–121.3 区间来回走。
Snapshot
Item |
Value |
|---|
Spot |
103.91 |
Report Time | Time: 2026-04-05 08:0006:49 AMPM MYT |
Regime: TRANSITION
Execution Regime |
LONG_GAMMA_PIN |
Dealer Gamma | Gamma: LONG |
Trend Path |
UP trend (expanding) |
Trading Map
Zone |
Level / Range |
Note |
|---|
Weekly 68% |
86.55 – 121.27 |
1σ move 17.36 |
Weekly 90% |
75.35 – 132.47 |
wider risk band |
Support |
80.00 |
downside defense |
Resistance |
100.00 |
upside supply |
Gamma Flip |
101.91 |
regime pivot |
Max Pain |
NA |
pin magnet |
Options & Probability Dashboard
Metric |
Value |
Interpretation |
|---|
Breakout Up |
49.9% |
close above upper band |
Breakout Down |
11.1% |
close below lower band |
Put/Call Volume |
0.95 |
directional flow |
Put/Call OI |
1.56 |
positioning bias |
Total Option Volume |
17,628 |
nearest expiry |
Total Open Interest |
13,668 |
nearest expiry |
Term Structure
Leg |
Expiry |
DTE |
Forward |
ATM IV |
ATM Straddle |
|---|
E12026-04-17 |
13 |
54.22 |
98.85% |
9.85 |
| 2026-05-15 |
41 |
54.24 |
80.58% |
14.50 |
Weekly Range
| Confidence |
Low |
High |
Width |
| 68% |
45.39 |
62.85 |
17.46 |
| 80% |
42.93 |
65.31 |
22.38 |
| 90% |
39.76 |
68.48 |
28.73 |
| 95% |
37.00 |
71.24 |
34.23 |
Structure & Probabilities
| Support |
Resistance |
Gamma Flip |
Max Pain |
P>Res |
P<Sup |
| 54.00 |
55.00 |
33.10 |
43.00 |
45.1% |
40.6% |
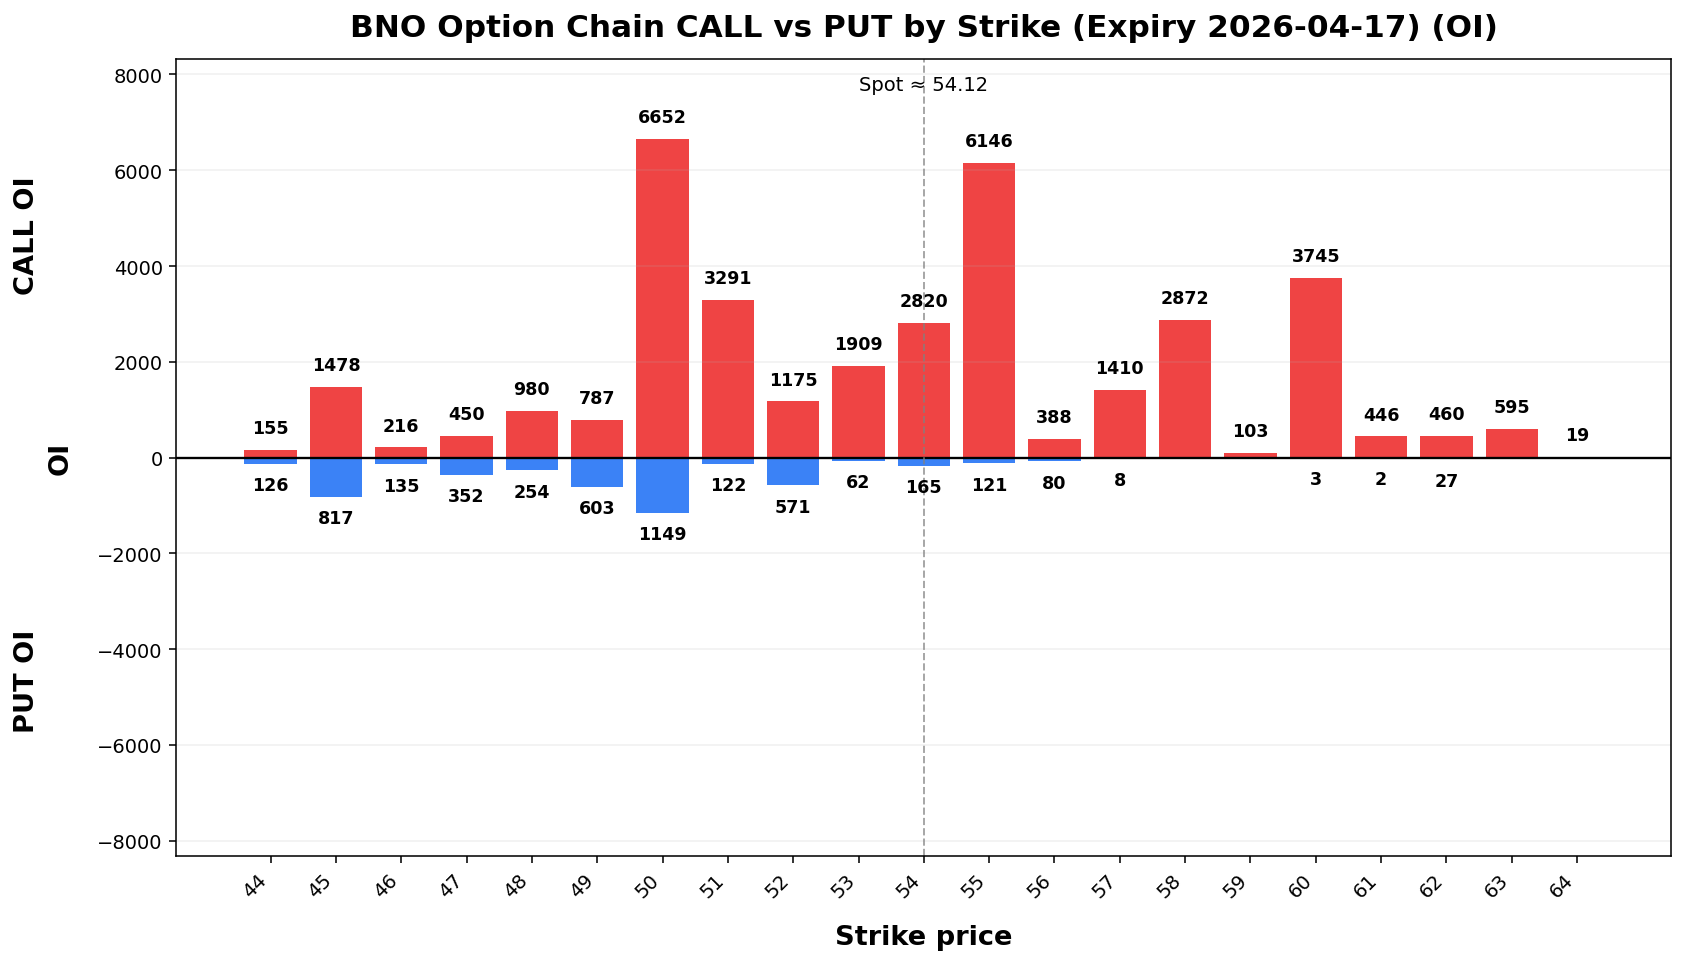
Flow & Skew
| Call Vol |
Put Vol |
Vol P/C |
Call OI |
Put OI |
OI P/C |
Skew |
Skew Bias |
| 14,735 |
4,467 |
0.30 |
46,654 |
13,733 |
0.29 |
-11.87 vol pts |
CALL_SKEW |
Tail Risk
| Q10 |
Q50 |
Q90 |
Down Tail |
Up Tail |
Down/Up |
| 15.67 |
18.33 |
51.30 |
38.45 |
0.00 |
NA |
Daily Technicals
| EMA20 |
EMA50 |
VWAP20 |
BB Lower |
BB Mid |
BB Upper |
BB Width |
Vol Ratio |
Path |
| 48.50 |
42.08 |
48.78 |
42.24 |
49.24 |
56.23 |
28.41% |
1.04 |
UP trend (expanding) |
Day Plan
- 54.00-55.00 range: fade extremes
- > 55.00: chase only if hold + vol
- < 54.00: risk expand; reduce size
- Regime: TRANSITION
- Tech: UP trend (expanding)
Swing Plan
- Accumulate: 54.00-54.00
- Trim: 55.00-55.00
- Add: close > 55.00
- Cut: close < 54.00
- Best for: transition regime
Raw Text Summary
📌 BNO @ 54.12 (2026-04-05 06:49 PM MYT)

• Current price is **54.12**. Key support is around **54.00**, and resistance is around **55.00**.
• For the next week, the model’s **68% expected range** is roughly **45.39 to 62.85**.
• A wider **90% range** is about **39.76 to 68.48**.
• Dealer positioning looks **LONG gamma**, so the market behavior is classified as **TRANSITION**.
• The estimated **gamma flip** is near **33.10**. Crossing and holding beyond this area can change the trading behavior.
• Approximate breakout odds: **above resistance 45.1%**, **below support 40.6%** by the target horizon.
• Options skew is tilted toward **calls**, which suggests upside speculation is relatively stronger.
• Near-term implied volatility is higher than the next expiry (**IV1 98.85% vs IV2 80.58%**), which suggests **near-term event stress / backwardation**.
• On the daily chart, the stock currently looks like **UP trend (expanding)**.
TSEM
Spot: 197.80
Report Time: 2026-04-05 06:49 PM MYT
Regime: TRANSITION
Dealer Gamma: LONG
Term Structure
| Expiry |
DTE |
Forward |
ATM IV |
ATM Straddle |
| 2026-04-17 |
13 |
198.00 |
78.39% |
28.55 |
| 2026-05-15 |
41 |
198.70 |
80.58% |
53.00 |
Weekly Range
| Confidence |
Low |
High |
Width |
| 68% |
176.60 |
219.00 |
42.40 |
| 80% |
170.63 |
224.97 |
54.34 |
| 90% |
162.93 |
232.67 |
69.74 |
| 95% |
156.25 |
239.35 |
83.10 |
Structure & Probabilities
| Support |
Resistance |
Gamma Flip |
Max Pain |
P>Res |
P<Sup |
| 180.00 |
200.00 |
173.50 |
160.00 |
34.4% |
18.0% |
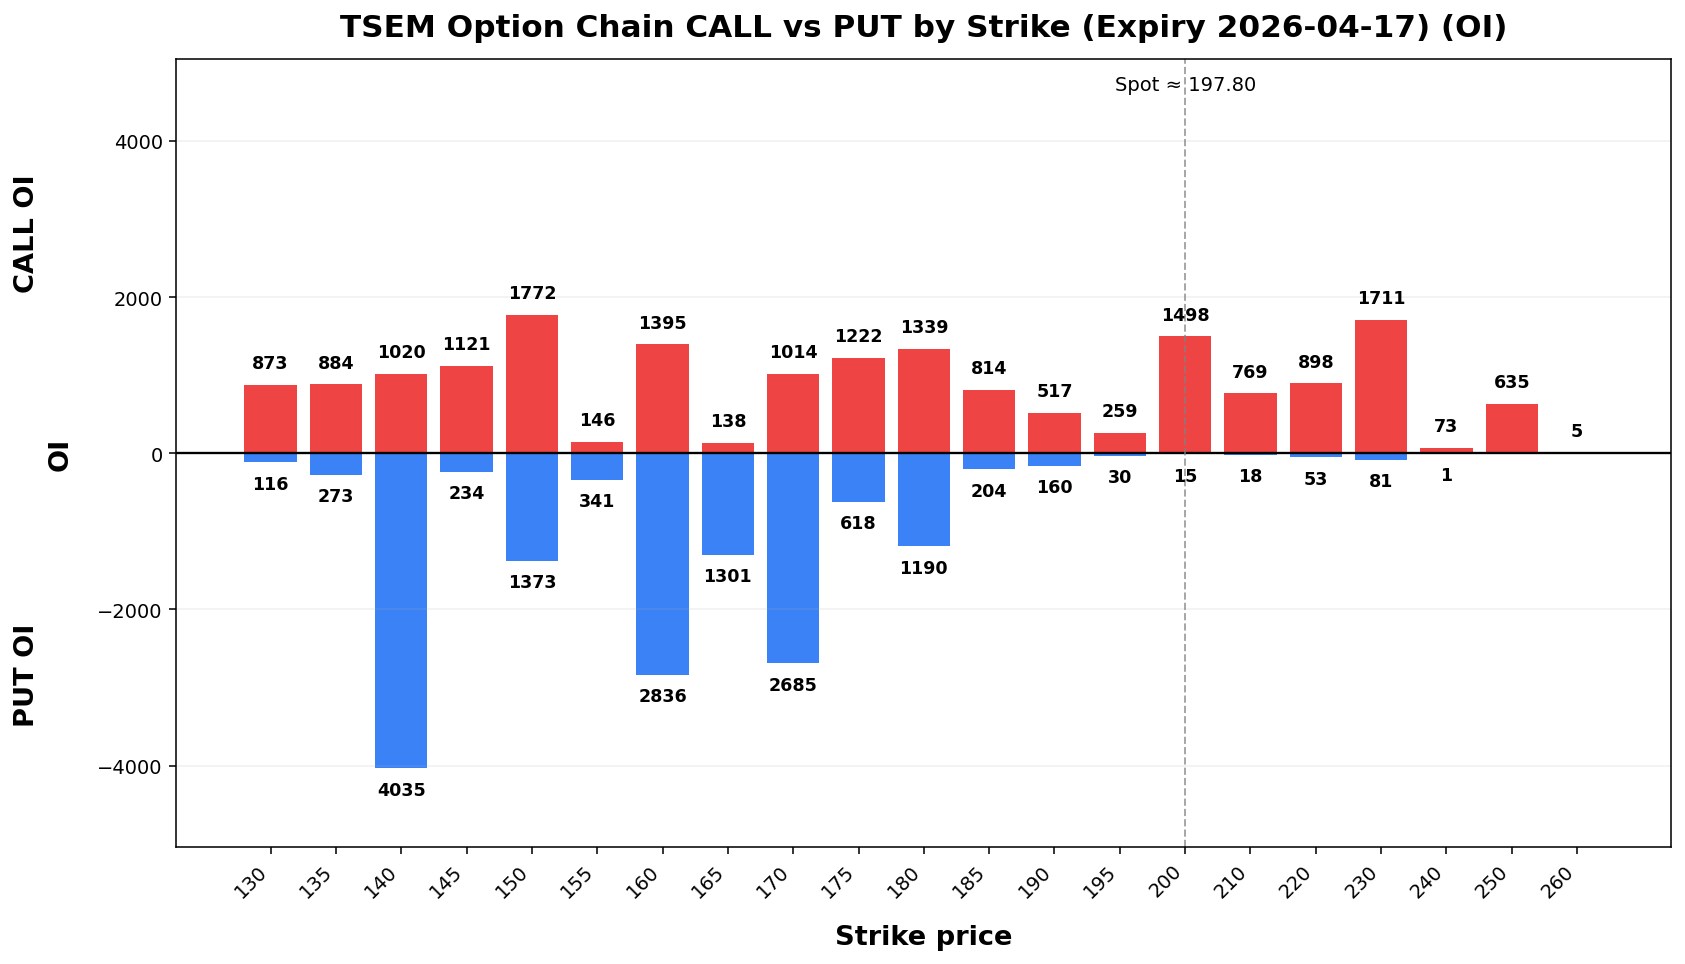
Flow & Skew
| Call Vol |
Put Vol |
Vol P/C |
Call OI |
Put OI |
OI P/C |
Skew |
Skew Bias |
| 10,560 |
444 |
0.04 |
21,419 |
27,270 |
1.27 |
6.66 vol pts |
PUT_SKEW |
Tail Risk
| Q10 |
Q50 |
Q90 |
Down Tail |
Up Tail |
Down/Up |
| 38.45 |
40.25 |
189.23 |
159.35 |
0.00 |
NA |
Daily Technicals
| EMA20 |
EMA50 |
VWAP20 |
BB Lower |
BB Mid |
BB Upper |
BB Width |
Vol Ratio |
Path |
| 161.25 |
143.38 |
159.86 |
96.06 |
153.04 |
210.02 |
74.46% |
0.89 |
UP trend (expanding) |
Day Plan
- 180.00-200.00 range: fade extremes
- > 200.00: chase only if hold + vol
- < 180.00: risk expand; reduce size
- Regime: TRANSITION
- Tech: UP trend (expanding)
Swing Plan
- Accumulate: 180.00-180.00
- Trim: 200.00-200.00
- Add: close > 200.00
- Cut: close < 180.00
- Best for: transition regime
Raw Text Summary
📌 TSEM @ 197.80 (2026-04-05 06:49 PM MYT)

• Current price is **197.80**. Key support is around **180.00**, and resistance is around **200.00**.
• For the next week, the model’s **68% expected range** is roughly **176.60 to 219.00**.
• A wider **90% range** is about **162.93 to 232.67**.
• Dealer positioning looks **LONG gamma**, so the market behavior is classified as **TRANSITION**.
• The estimated **gamma flip** is near **173.50**. Crossing and holding beyond this area can change the trading behavior.
• Approximate breakout odds: **above resistance 34.4%**, **below support 18.0%** by the target horizon.
• Options skew is tilted toward **puts**, which suggests traders are paying more for downside protection.
• Near-term implied volatility is lower than the next expiry (**IV1 78.39% vs IV2 80.58%**), which suggests a **contango / calmer front expiry** setup.
• On the daily chart, the stock currently looks like **UP trend (expanding)**.
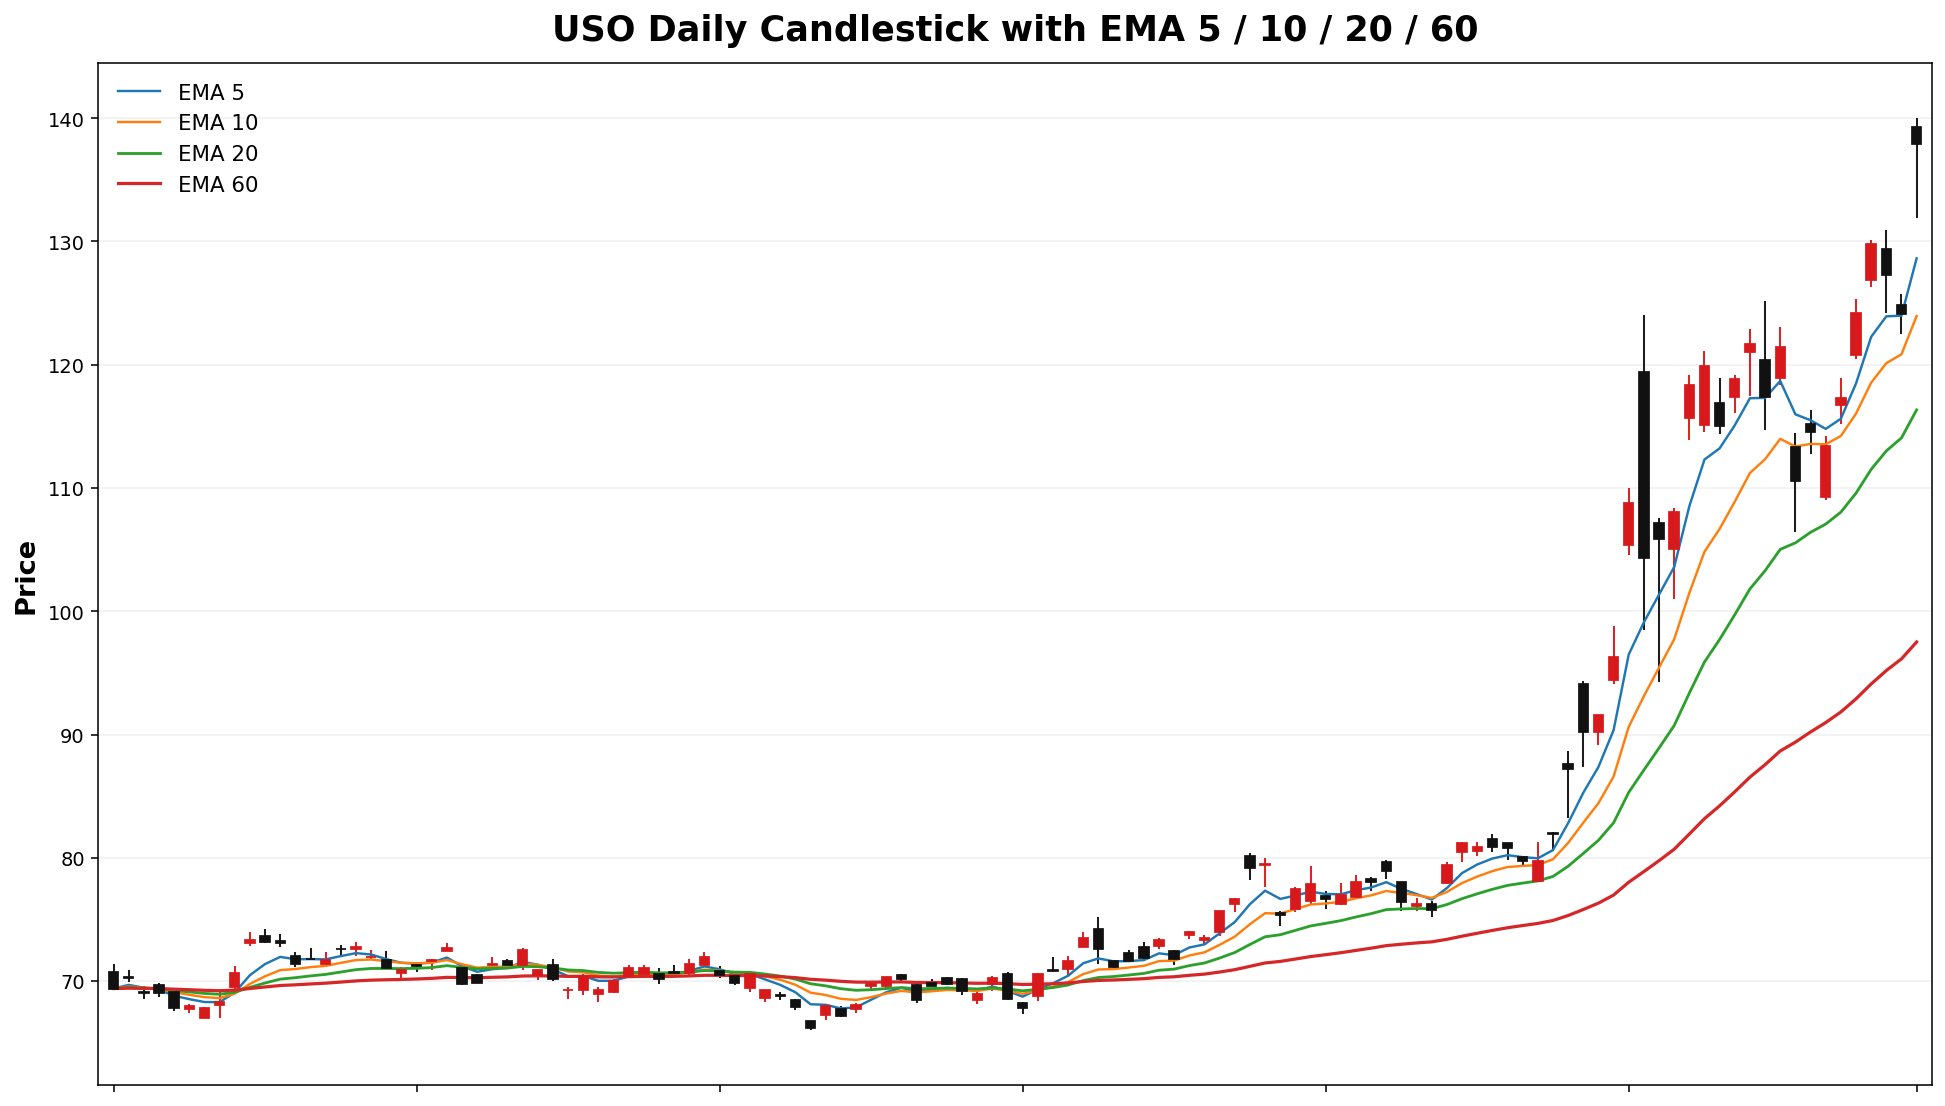
USO
Spot: 137.92
Report Time: 2026-04-05 06:49 PM MYT
Regime: TRANSITION
Dealer Gamma: LONG
Term Structure
| Expiry |
DTE |
Forward |
ATM IV |
ATM Straddle |
| 2026-04-08 |
4 |
137.91 |
106.05% |
14.07 |
| 2026-04-10 |
6 |
137.84 |
97.81% |
16.38 |
Weekly Range
| Confidence |
Low |
High |
Width |
| 68% |
119.66 |
156.18 |
36.52 |
| 80% |
114.52 |
161.32 |
46.80 |
| 90% |
107.88 |
167.96 |
60.07 |
| 95% |
102.13 |
173.71 |
71.58 |
Structure & Probabilities
| Support |
Resistance |
Gamma Flip |
Max Pain |
P>Res |
P<Sup |
| 135.00 |
140.00 |
117.44 |
122.00 |
44.6% |
35.8% |
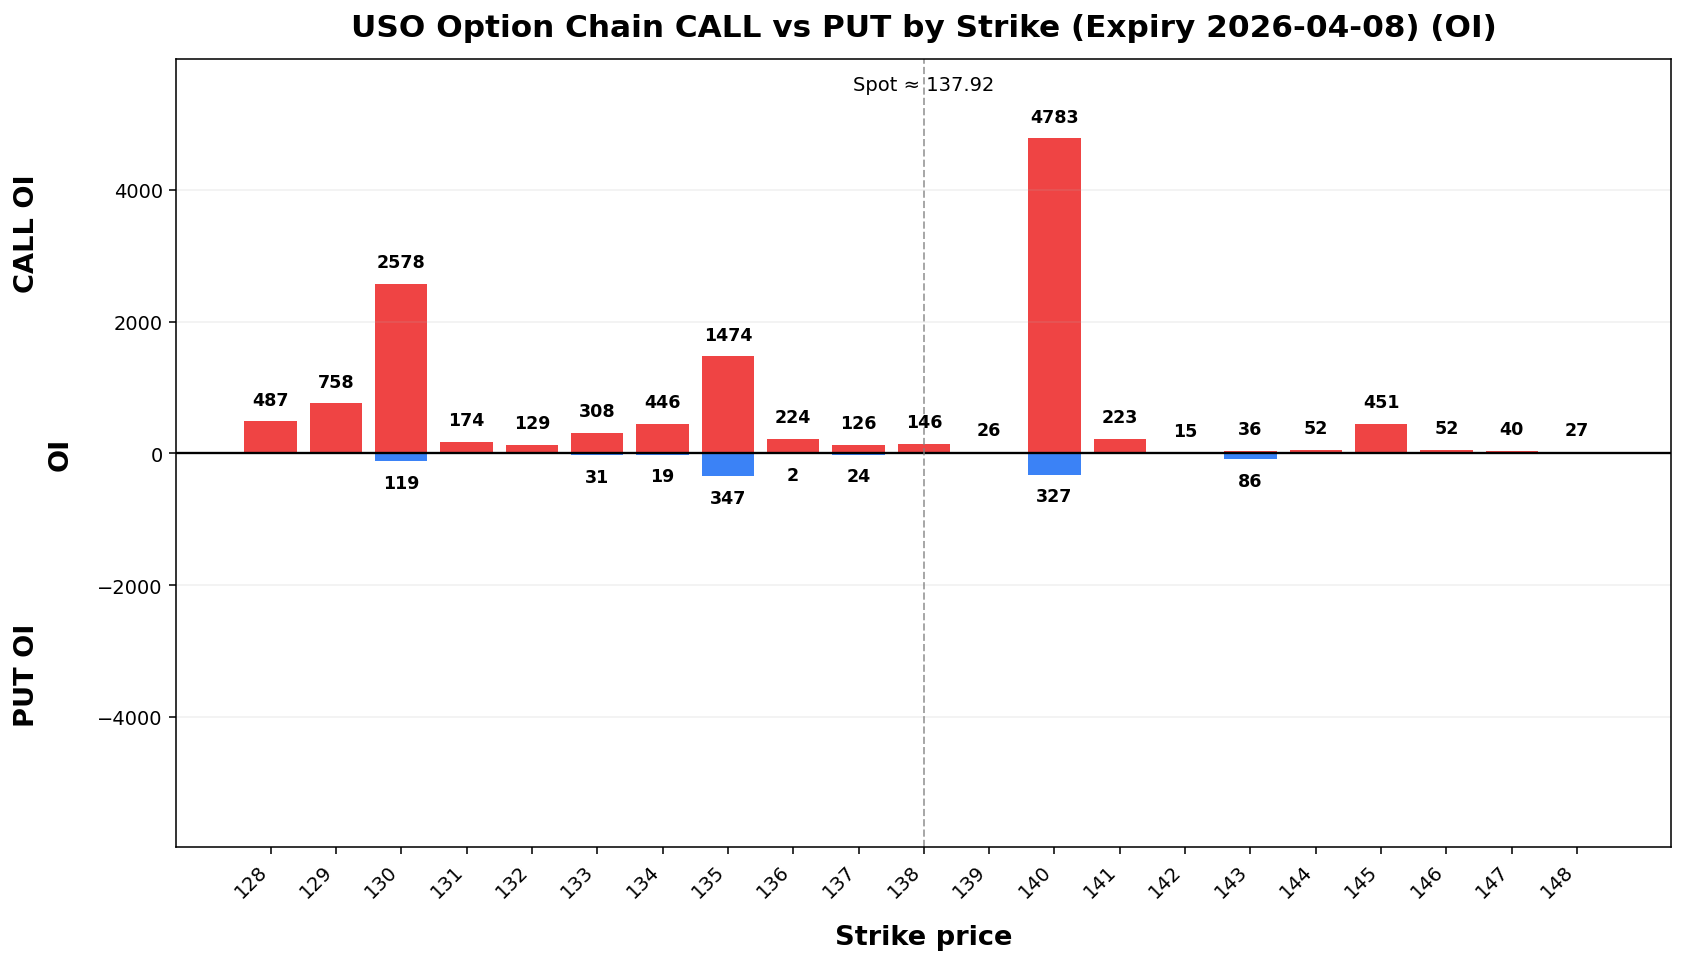
Flow & Skew
| Call Vol |
Put Vol |
Vol P/C |
Call OI |
Put OI |
OI P/C |
Skew |
Skew Bias |
| 25,711 |
29,056 |
1.13 |
20,630 |
16,676 |
0.81 |
-3.39 vol pts |
CALL_SKEW |
Tail Risk
| Q10 |
Q50 |
Q90 |
Down Tail |
Up Tail |
Down/Up |
| 114.39 |
133.92 |
151.27 |
23.53 |
13.35 |
1.76 |
Daily Technicals
| EMA20 |
EMA50 |
VWAP20 |
BB Lower |
BB Mid |
BB Upper |
BB Width |
Vol Ratio |
Path |
| 116.34 |
100.79 |
115.58 |
101.11 |
117.93 |
134.76 |
28.53% |
0.93 |
UP trend (expanding) |
Day Plan
- 135.00-140.00 range: fade extremes
- > 140.00: chase only if hold + vol
- < 135.00: risk expand; reduce size
- Regime: TRANSITION
- Tech: UP trend (expanding)
Swing Plan
- Accumulate: 135.00-135.00
- Trim: 140.00-140.00
- Add: close > 140.00
- Cut: close < 135.00
- Best for: transition regime
Raw Text Summary
📌 USO @ 137.92 (2026-04-05 06:49 PM MYT)

• Current price is **137.92**. Key support is around **135.00**, and resistance is around **140.00**.
• For the next week, the model’s **68% expected range** is roughly **119.66 to 156.18**.
• A wider **90% range** is about **107.88 to 167.96**.
• Dealer positioning looks **LONG gamma**, so the market behavior is classified as **TRANSITION**.
• The estimated **gamma flip** is near **117.44**. Crossing and holding beyond this area can change the trading behavior.
• Approximate breakout odds: **above resistance 44.6%**, **below support 35.8%** by the target horizon.
• Options skew is tilted toward **calls**, which suggests upside speculation is relatively stronger.
• Near-term implied volatility is higher than the next expiry (**IV1 106.05% vs IV2 97.81%**), which suggests **near-term event stress / backwardation**.
• On the daily chart, the stock currently looks like **UP trend (expanding)**.
• The implied distribution shows **heavier downside tail risk** than upside tail potential.
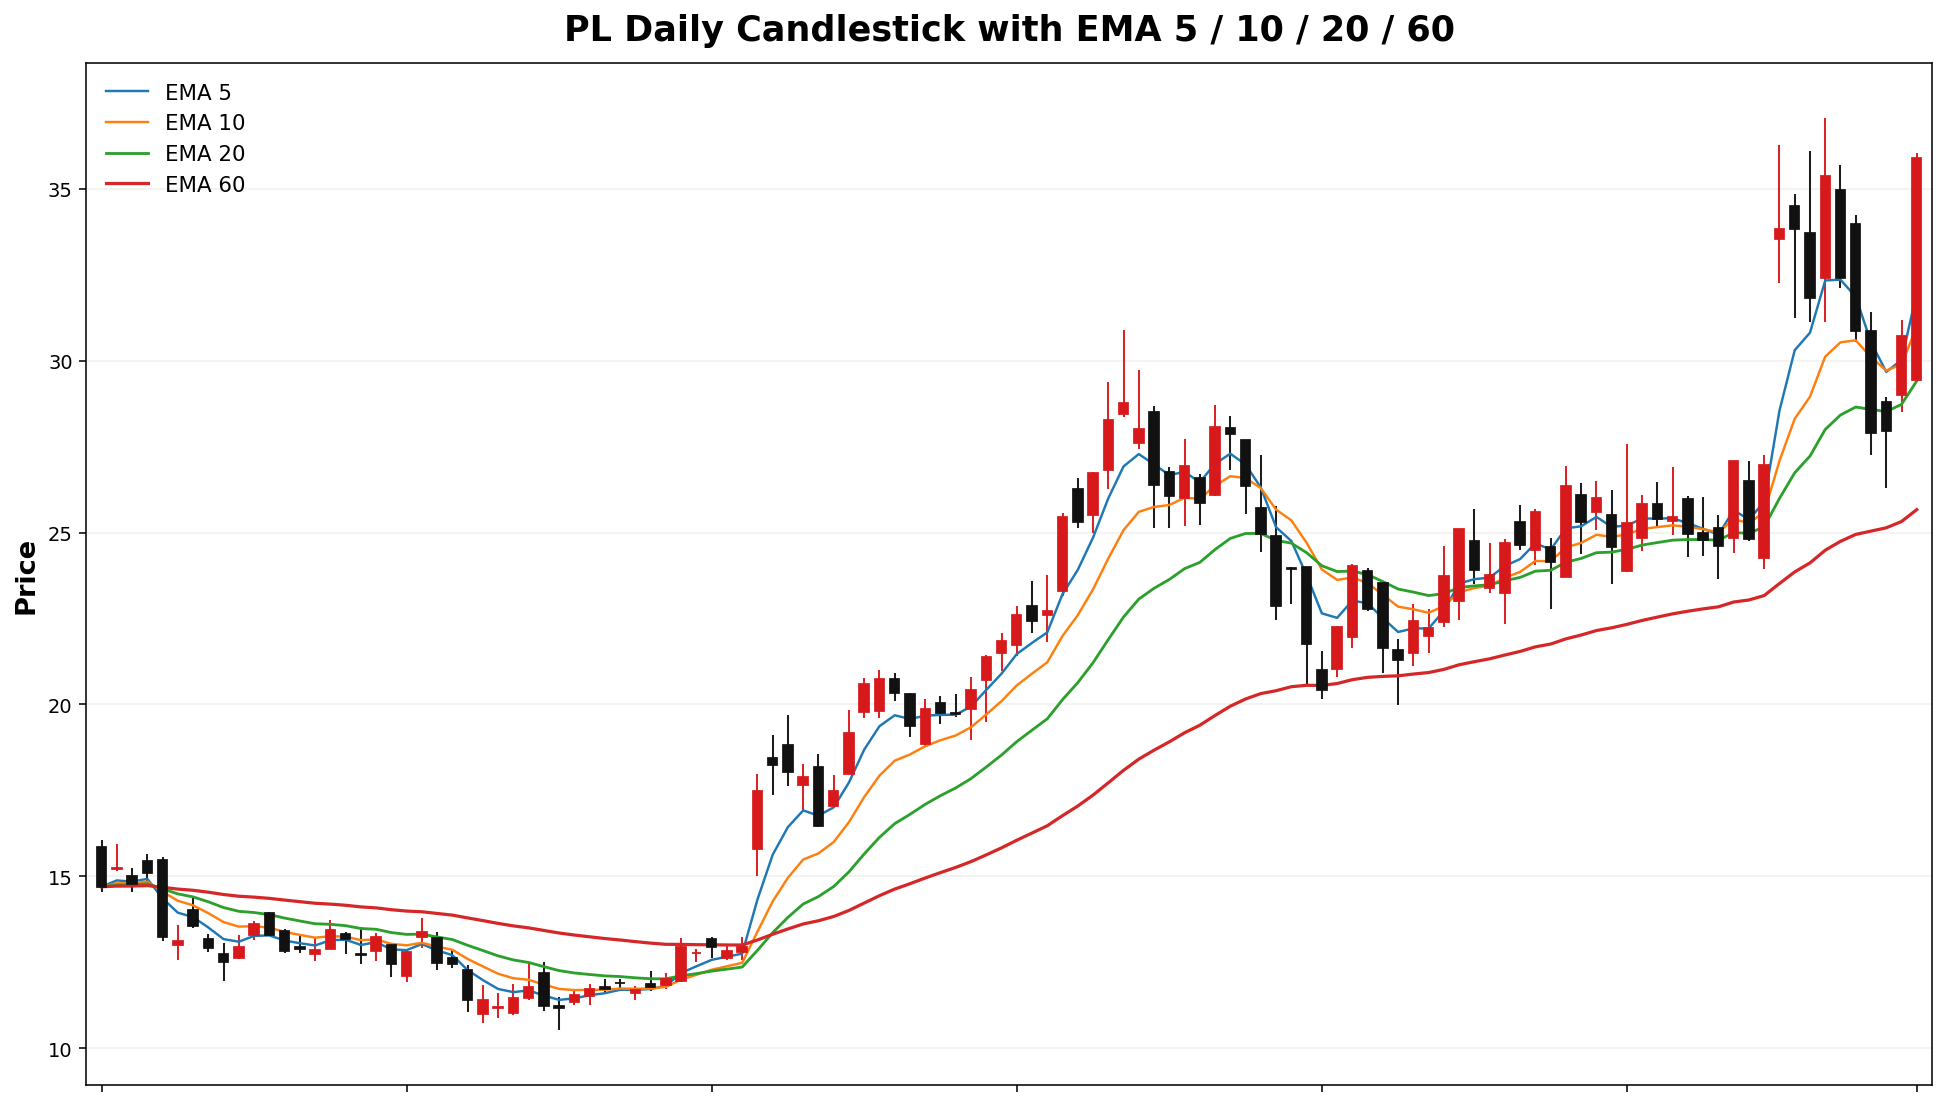
PL
Spot: 35.88
Report Time: 2026-04-05 06:49 PM MYT
Regime: TREND
Dealer Gamma: SHORT
Term Structure
| Expiry |
DTE |
Forward |
ATM IV |
ATM Straddle |
| 2026-04-10 |
6 |
35.69 |
103.32% |
4.50 |
| 2026-04-17 |
13 |
35.70 |
94.61% |
6.25 |
Weekly Range
| Confidence |
Low |
High |
Width |
| 68% |
30.85 |
40.91 |
10.05 |
| 80% |
29.44 |
42.32 |
12.88 |
| 90% |
27.61 |
44.15 |
16.53 |
| 95% |
26.03 |
45.73 |
19.70 |
Structure & Probabilities
| Support |
Resistance |
Gamma Flip |
Max Pain |
P>Res |
P<Sup |
| 35.00 |
40.91 |
31.03 |
29.00 |
17.6% |
57.2% |
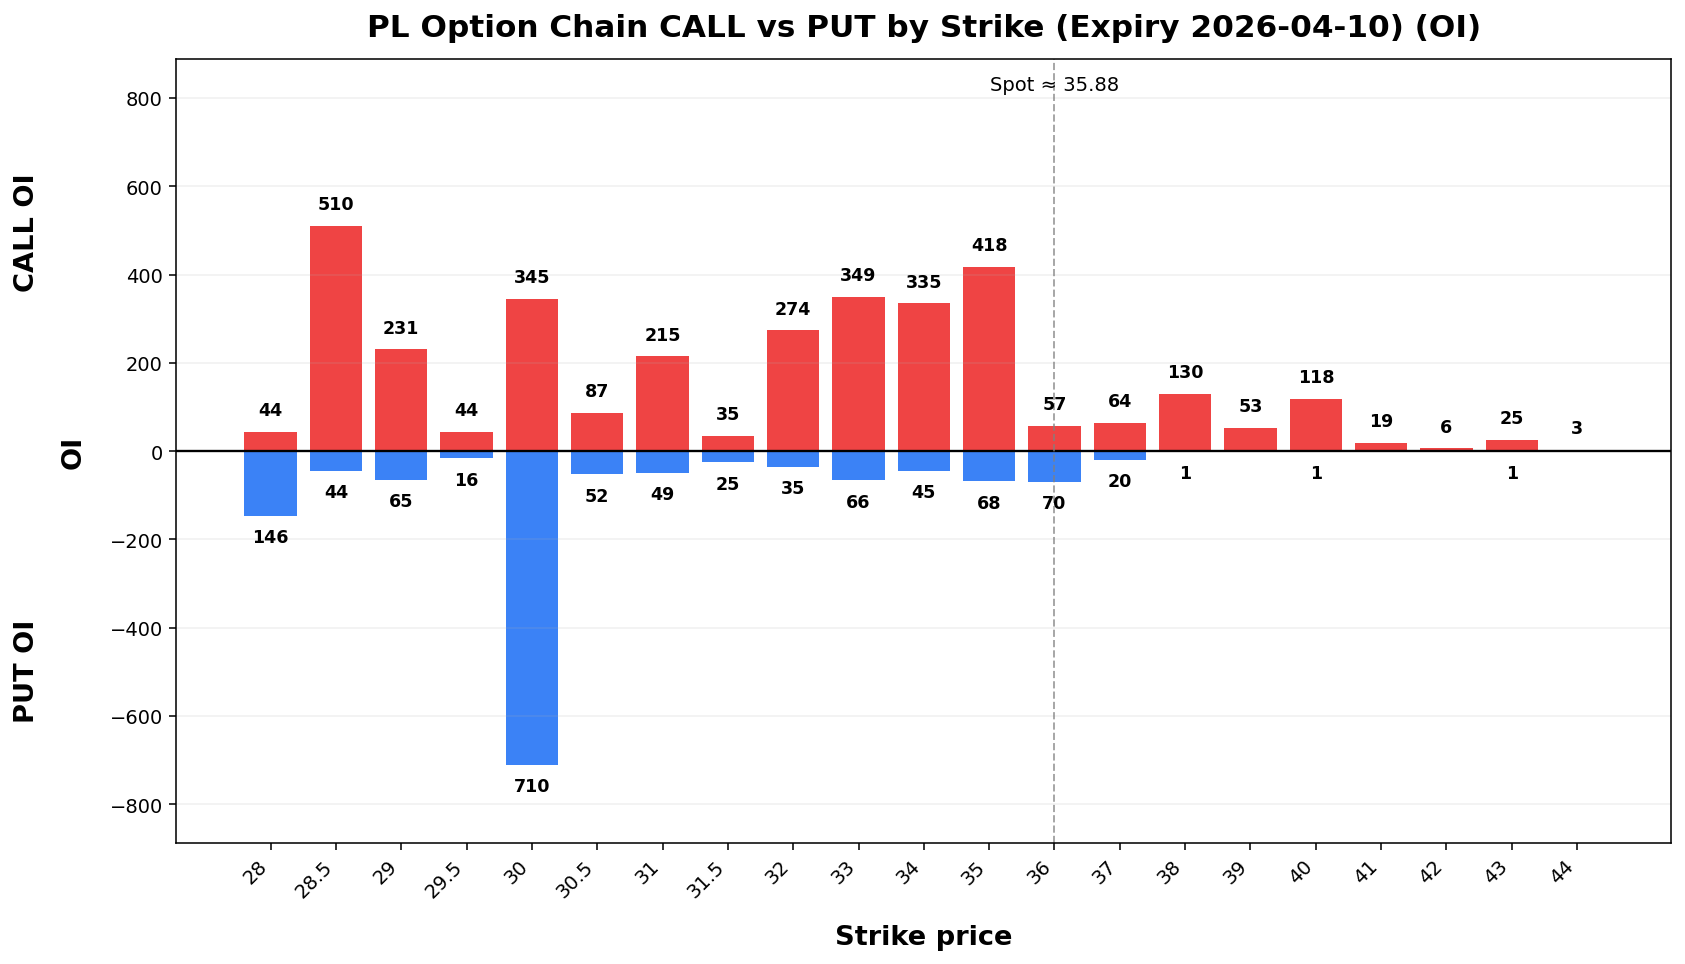
Flow & Skew
| Call Vol |
Put Vol |
Vol P/C |
Call OI |
Put OI |
OI P/C |
Skew |
Skew Bias |
| 3,802 |
4,355 |
1.15 |
4,010 |
6,281 |
1.57 |
3.12 vol pts |
PUT_SKEW |
Tail Risk
| Q10 |
Q50 |
Q90 |
Down Tail |
Up Tail |
Down/Up |
| 26.80 |
33.75 |
41.64 |
9.08 |
5.76 |
1.58 |
Daily Technicals
| EMA20 |
EMA50 |
VWAP20 |
BB Lower |
BB Mid |
BB Upper |
BB Width |
Vol Ratio |
Path |
| 29.41 |
26.40 |
30.31 |
20.97 |
28.78 |
36.60 |
54.30% |
1.39 |
UP trend (expanding) |
Day Plan
- 35.00-40.91 range: fade extremes
- > 40.91: chase only if hold + vol
- < 35.00: risk expand; reduce size
- Regime: TREND
- Tech: UP trend (expanding)
Swing Plan
- Accumulate: 35.00-35.00
- Trim: 40.91-40.91
- Add: close > 40.91
- Cut: close < 35.00
- Best for: trend regime
Raw Text Summary
📌 PL @ 35.88 (2026-04-05 06:49 PM MYT)

• Current price is **35.88**. Key support is around **35.00**, and resistance is around **40.91**.
• For the next week, the model’s **68% expected range** is roughly **30.85 to 40.91**.
• A wider **90% range** is about **27.61 to 44.15**.
• Dealer positioning looks **SHORT gamma**, so the market behavior is classified as **TREND**.
• The estimated **gamma flip** is near **31.03**. Crossing and holding beyond this area can change the trading behavior.
• Approximate breakout odds: **above resistance 17.6%**, **below support 57.2%** by the target horizon.
• Options skew is tilted toward **puts**, which suggests traders are paying more for downside protection.
• Near-term implied volatility is higher than the next expiry (**IV1 103.32% vs IV2 94.61%**), which suggests **near-term event stress / backwardation**.
• On the daily chart, the stock currently looks like **UP trend (expanding)**.
• The implied distribution shows **heavier downside tail risk** than upside tail potential.
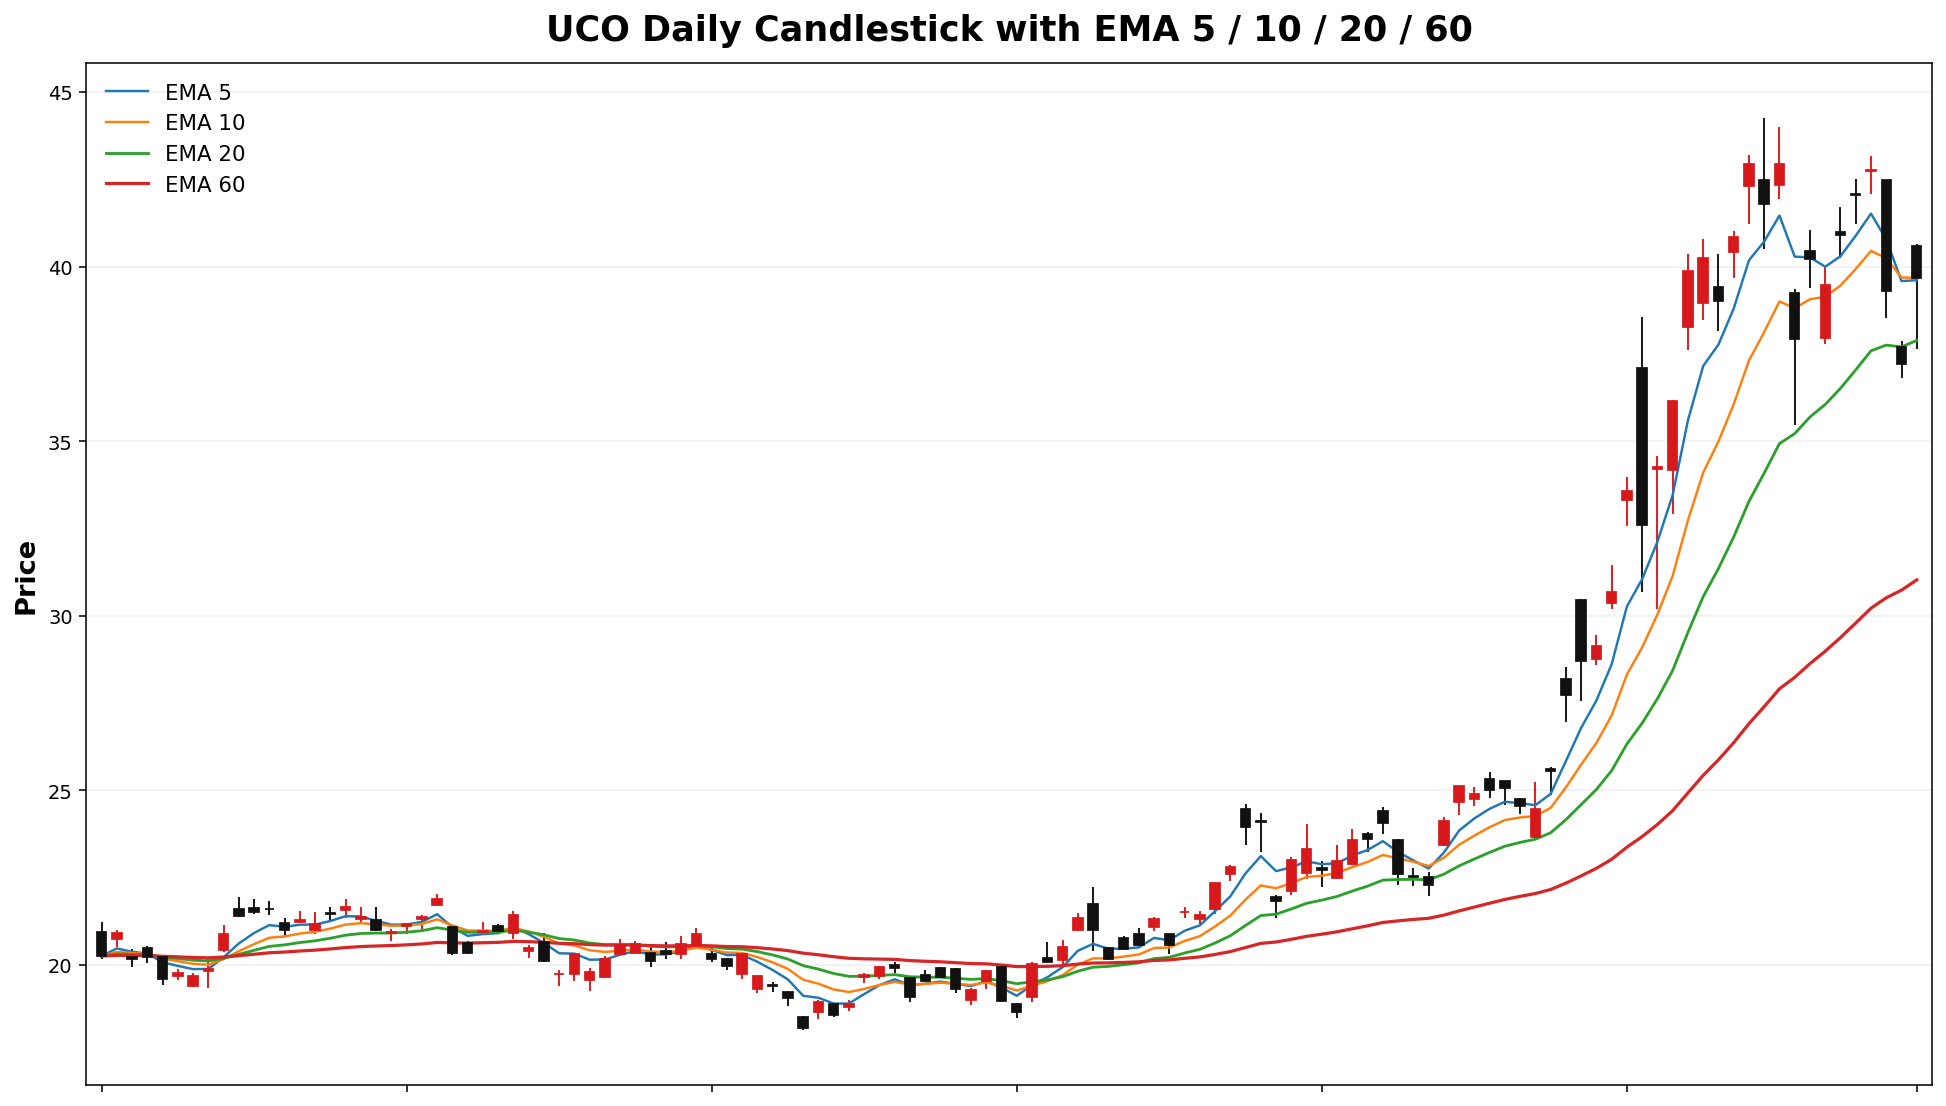
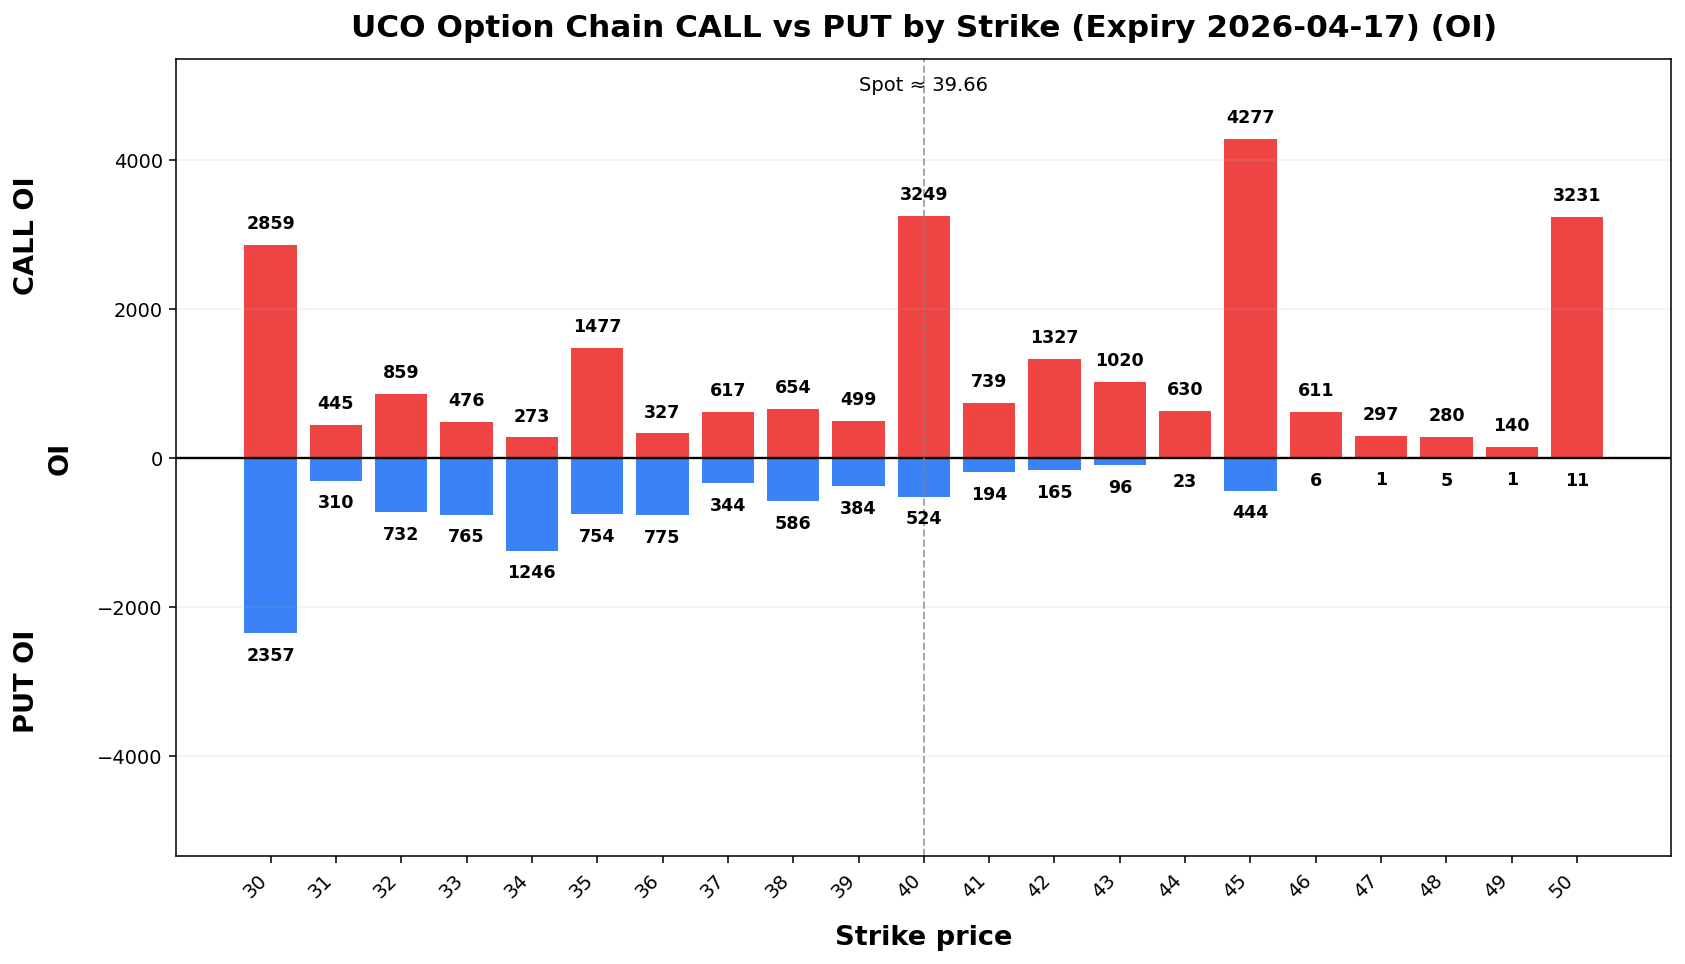
UCO
Spot: 39.66
Report Time: 2026-04-05 06:49 PM MYT
Regime: TRANSITION
Dealer Gamma: LONG
Term Structure
| Expiry |
DTE |
Forward |
ATM IV |
ATM Straddle |
| 2026-04-17 |
13 |
39.46 |
104.76% |
7.65 |
| 2026-05-15 |
41 |
39.67 |
97.06% |
12.80 |
Weekly Range
| Confidence |
Low |
High |
Width |
| 68% |
33.40 |
45.92 |
12.52 |
| 80% |
31.64 |
47.68 |
16.05 |
| 90% |
29.36 |
49.96 |
20.60 |
| 95% |
27.39 |
51.93 |
24.54 |
Structure & Probabilities
| Support |
Resistance |
Gamma Flip |
Max Pain |
P>Res |
P<Sup |
| 35.00 |
40.00 |
27.95 |
30.00 |
43.7% |
17.4% |
Flow & Skew
| Call Vol |
Put Vol |
Vol P/C |
Call OI |
Put OI |
OI P/C |
Skew |
Skew Bias |
| 4,909 |
2,790 |
0.57 |
36,506 |
21,001 |
0.58 |
-6.20 vol pts |
CALL_SKEW |
Tail Risk
| Q10 |
Q50 |
Q90 |
Down Tail |
Up Tail |
Down/Up |
| 27.00 |
37.86 |
50.14 |
12.66 |
10.48 |
1.21 |
Daily Technicals
| EMA20 |
EMA50 |
VWAP20 |
BB Lower |
BB Mid |
BB Upper |
BB Width |
Vol Ratio |
Path |
| 37.89 |
32.30 |
37.77 |
33.05 |
39.19 |
45.32 |
31.31% |
0.80 |
UP trend (expanding) |
Day Plan
- 35.00-40.00 range: fade extremes
- > 40.00: chase only if hold + vol
- < 35.00: risk expand; reduce size
- Regime: TRANSITION
- Tech: UP trend (expanding)
Swing Plan
- Accumulate: 35.00-35.00
- Trim: 40.00-40.00
- Add: close > 40.00
- Cut: close < 35.00
- Best for: transition regime
Raw Text Summary
📌 UCO @ 39.66 (2026-04-05 06:49 PM MYT)

• Current price is **39.66**. Key support is around **35.00**, and resistance is around **40.00**.
• For the next week, the model’s **68% expected range** is roughly **33.40 to 45.92**.
• A wider **90% range** is about **29.36 to 49.96**.
• Dealer positioning looks **LONG gamma**, so the market behavior is classified as **TRANSITION**.
• The estimated **gamma flip** is near **27.95**. Crossing and holding beyond this area can change the trading behavior.
• Approximate breakout odds: **above resistance 43.7%**, **below support 17.4%** by the target horizon.
• Options skew is tilted toward **calls**, which suggests upside speculation is relatively stronger.
• Near-term implied volatility is higher than the next expiry (**IV1 104.76% vs IV2 97.06%**), which suggests **near-term event stress / backwardation**.
• Recent volume is only **0.80x** the 20-day average, so breakouts may be less reliable unless volume improves.
• On the daily chart, the stock currently looks like **UP trend (expanding)**.
• The implied distribution shows **heavier downside tail risk** than upside tail potential.
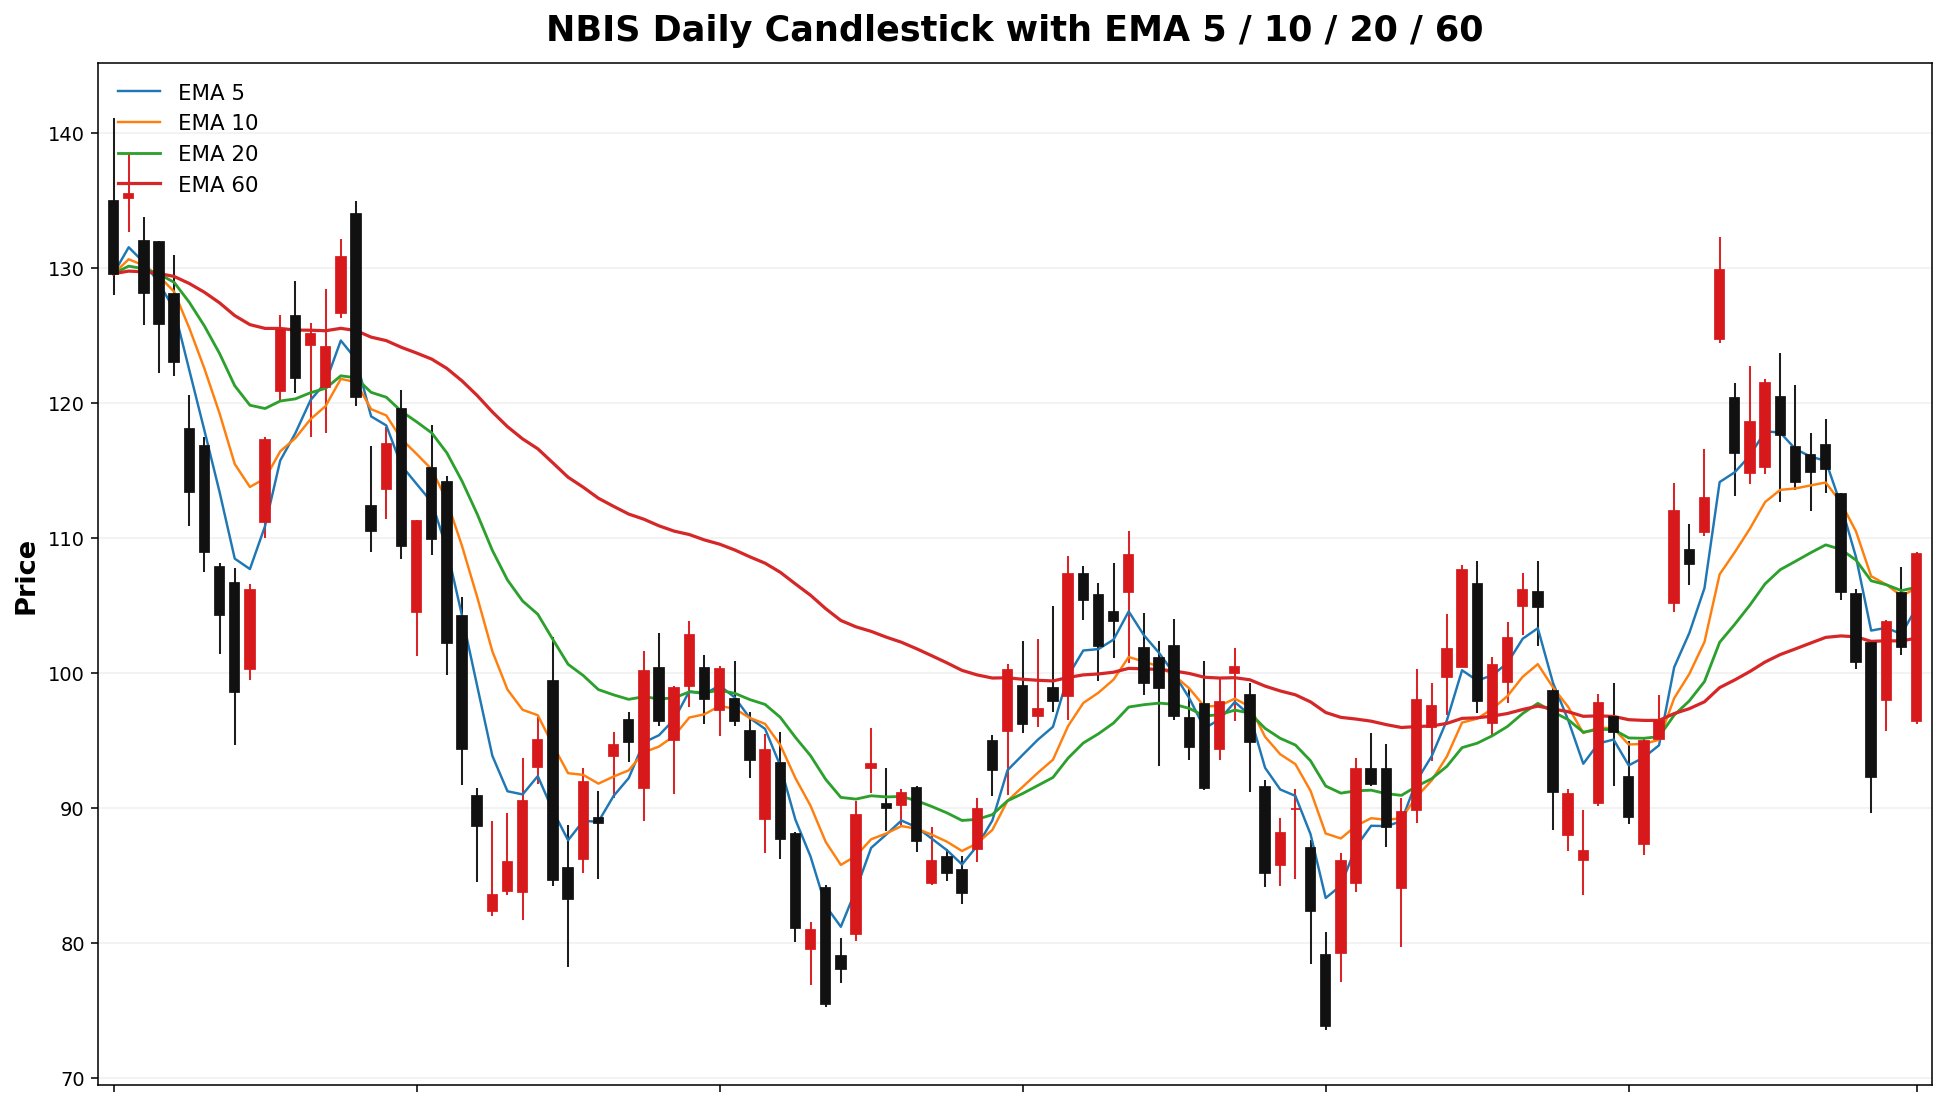
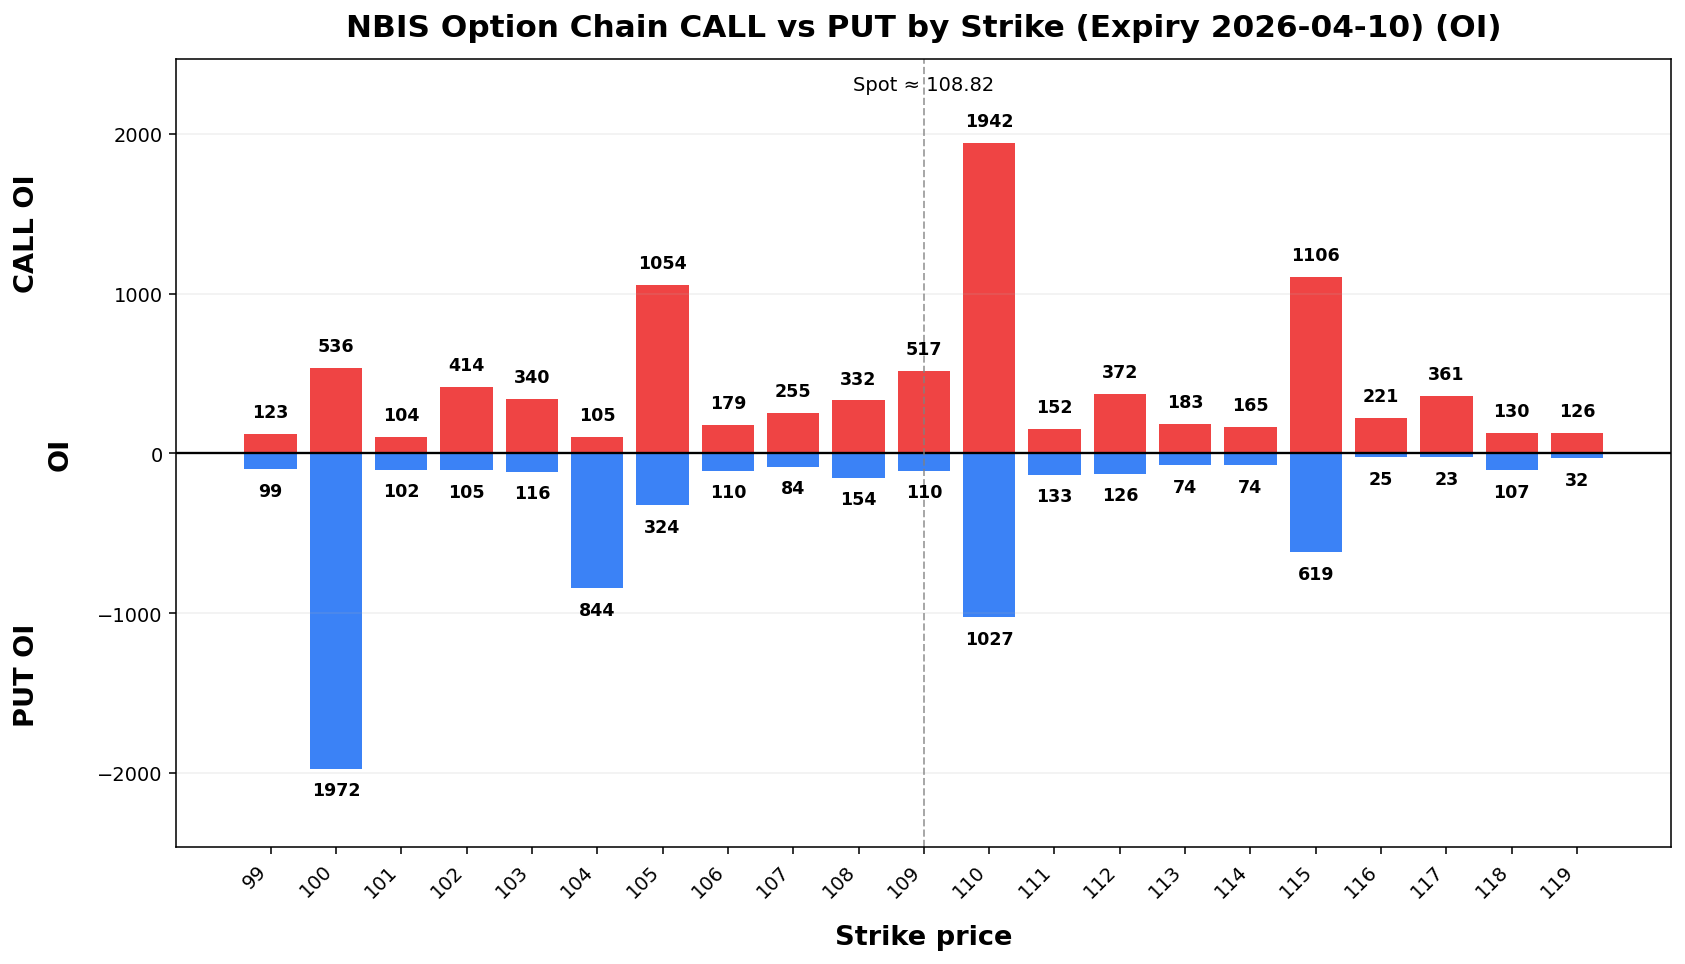
NBIS
Spot: 108.82
Report Time: 2026-04-05 06:49 PM MYT
Regime: TRANSITION
Dealer Gamma: LONG
Term Structure
| Expiry |
DTE |
Forward |
ATM IV |
ATM Straddle |
| 2026-04-10 |
6 |
108.81 |
74.76% |
9.88 |
| 2026-04-17 |
13 |
108.88 |
71.12% |
14.25 |
Weekly Range
| Confidence |
Low |
High |
Width |
| 68% |
97.61 |
120.03 |
22.42 |
| 80% |
94.46 |
123.18 |
28.73 |
| 90% |
90.38 |
127.26 |
36.87 |
| 95% |
86.85 |
130.79 |
43.94 |
Structure & Probabilities
| Support |
Resistance |
Gamma Flip |
Max Pain |
P>Res |
P<Sup |
| 105.00 |
110.00 |
103.79 |
105.00 |
35.0% |
33.5% |
Flow & Skew
| Call Vol |
Put Vol |
Vol P/C |
Call OI |
Put OI |
OI P/C |
Skew |
Skew Bias |
| 20,545 |
11,978 |
0.58 |
17,282 |
17,255 |
1.00 |
8.40 vol pts |
PUT_SKEW |
Tail Risk
| Q10 |
Q50 |
Q90 |
Down Tail |
Up Tail |
Down/Up |
| 89.87 |
108.84 |
124.05 |
18.95 |
15.23 |
1.24 |
Daily Technicals
| EMA20 |
EMA50 |
VWAP20 |
BB Lower |
BB Mid |
BB Upper |
BB Width |
Vol Ratio |
Path |
| 106.36 |
102.68 |
111.95 |
87.69 |
108.76 |
129.84 |
38.76% |
0.73 |
Sideways / Range |
Day Plan
- 105.00-110.00 range: fade extremes
- > 110.00: chase only if hold + vol
- < 105.00: risk expand; reduce size
- Regime: TRANSITION
- Tech: Sideways / Range
Swing Plan
- Accumulate: 105.00-105.00
- Trim: 110.00-110.00
- Add: close > 110.00
- Cut: close < 105.00
- Best for: transition regime
Raw Text Summary
📌 NBIS @ 108.82 (2026-04-05 06:49 PM MYT)

• Current price is **108.82**. Key support is around **105.00**, and resistance is around **110.00**.
• For the next week, the model’s **68% expected range** is roughly **97.61 to 120.03**.
• A wider **90% range** is about **90.38 to 127.26**.
• Dealer positioning looks **LONG gamma**, so the market behavior is classified as **TRANSITION**.
• The estimated **gamma flip** is near **103.79**. Crossing and holding beyond this area can change the trading behavior.
• Approximate breakout odds: **above resistance 35.0%**, **below support 33.5%** by the target horizon.
• Options skew is tilted toward **puts**, which suggests traders are paying more for downside protection.
• Near-term implied volatility is higher than the next expiry (**IV1 74.76% vs IV2 71.12%**), which suggests **near-term event stress / backwardation**.
• Recent volume is only **0.73x** the 20-day average, so breakouts may be less reliable unless volume improves.
• On the daily chart, the stock currently looks like **Sideways / Range**.
• The implied distribution shows **heavier downside tail risk** than upside tail potential.
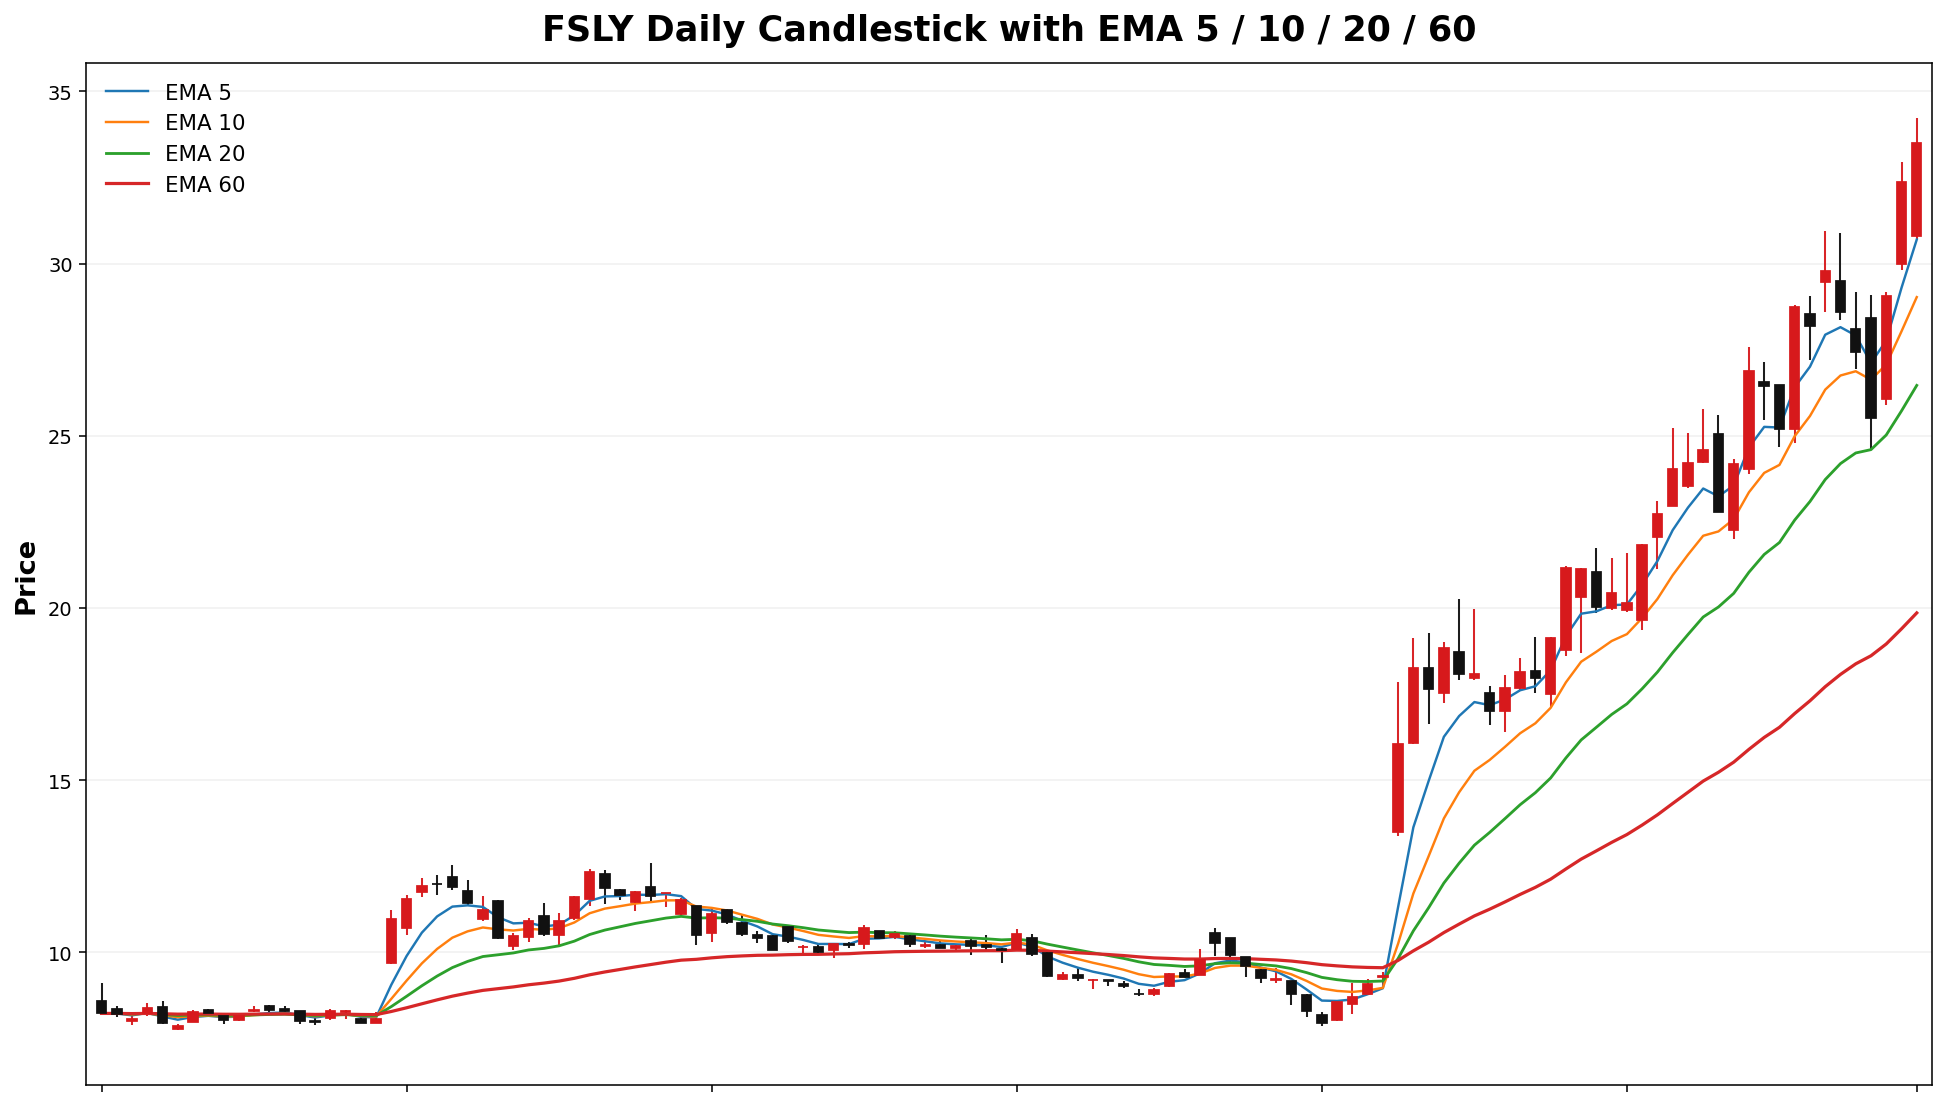
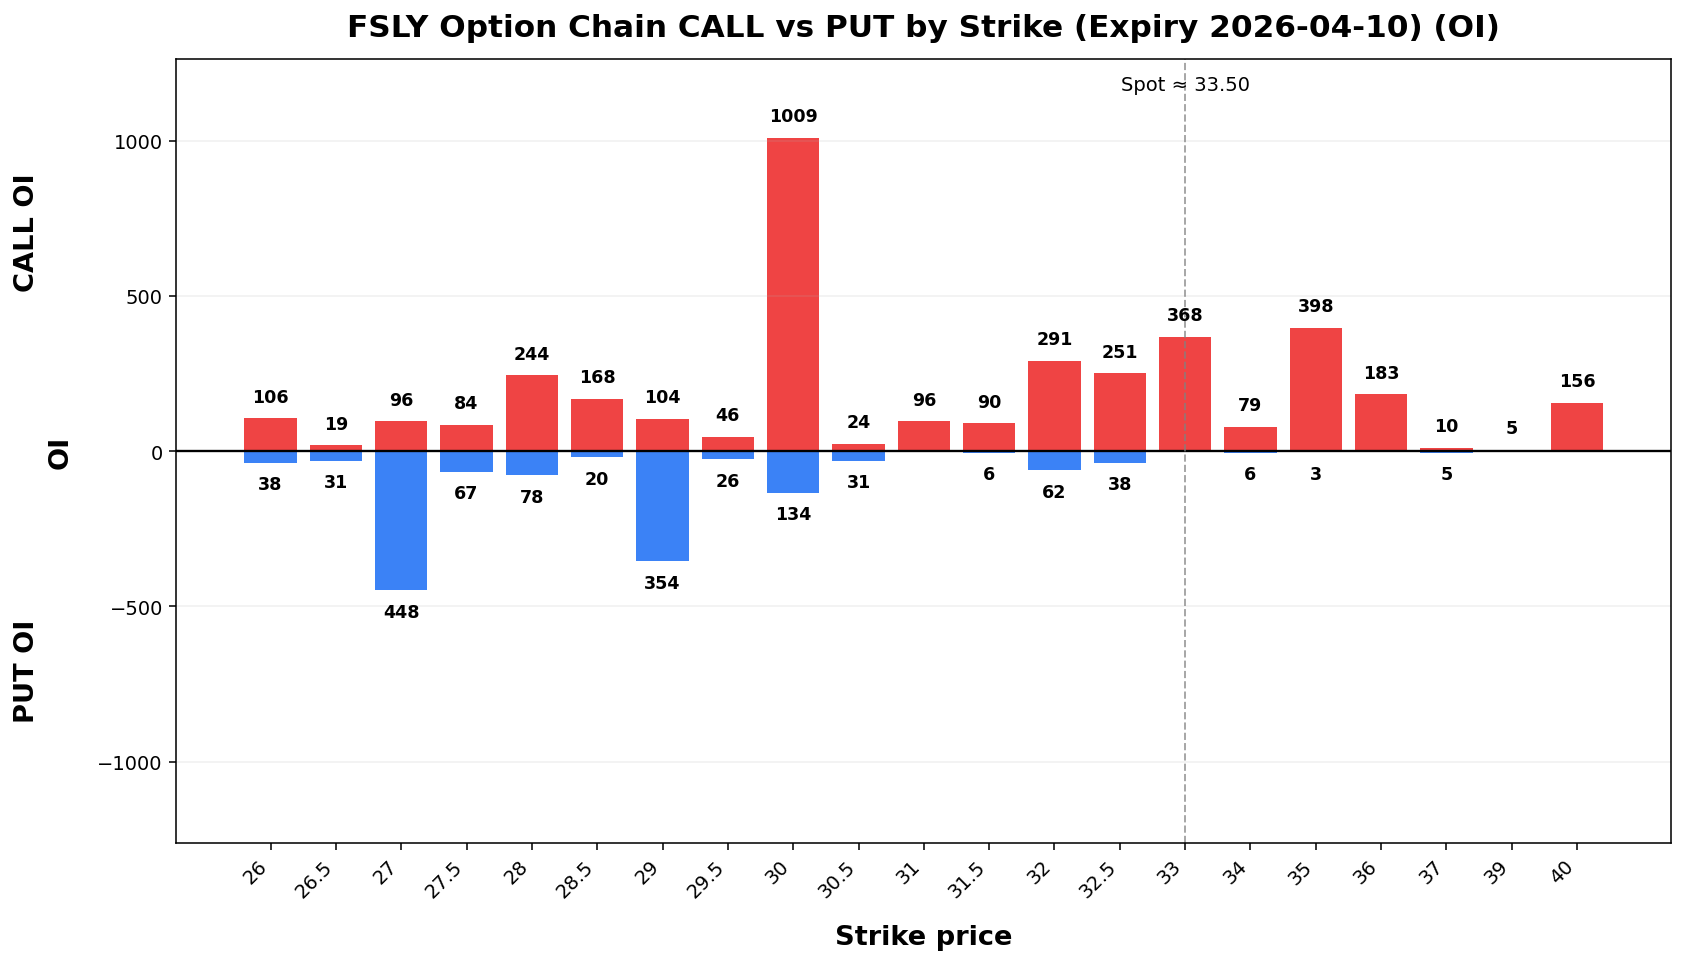
FSLY
Spot: 33.50
Report Time: 2026-04-05 06:49 PM MYT
Regime: TRANSITION
Dealer Gamma: LONG
Term Structure
| Expiry |
DTE |
Forward |
ATM IV |
ATM Straddle |
| 2026-04-10 |
6 |
33.46 |
97.13% |
3.95 |
| 2026-04-17 |
13 |
33.47 |
92.41% |
5.70 |
Weekly Range
| Confidence |
Low |
High |
Width |
| 68% |
29.02 |
37.98 |
8.97 |
| 80% |
27.75 |
39.25 |
11.49 |
| 90% |
26.13 |
40.87 |
14.75 |
| 95% |
24.71 |
42.29 |
17.58 |
Structure & Probabilities
| Support |
Resistance |
Gamma Flip |
Max Pain |
P>Res |
P<Sup |
| 33.00 |
35.00 |
26.95 |
25.00 |
32.9% |
40.7% |
Flow & Skew
| Call Vol |
Put Vol |
Vol P/C |
Call OI |
Put OI |
OI P/C |
Skew |
Skew Bias |
| 3,886 |
1,589 |
0.41 |
5,255 |
8,218 |
1.56 |
1.76 vol pts |
PUT_SKEW |
Tail Risk
| Q10 |
Q50 |
Q90 |
Down Tail |
Up Tail |
Down/Up |
| 20.04 |
31.76 |
37.62 |
13.46 |
4.12 |
3.27 |
Daily Technicals
| EMA20 |
EMA50 |
VWAP20 |
BB Lower |
BB Mid |
BB Upper |
BB Width |
Vol Ratio |
Path |
| 26.46 |
21.04 |
26.23 |
19.41 |
26.31 |
33.22 |
52.48% |
0.96 |
UP trend (expanding) |
Day Plan
- 33.00-35.00 range: fade extremes
- > 35.00: chase only if hold + vol
- < 33.00: risk expand; reduce size
- Regime: TRANSITION
- Tech: UP trend (expanding)
Swing Plan
- Accumulate: 33.00-33.00
- Trim: 35.00-35.00
- Add: close > 35.00
- Cut: close < 33.00
- Best for: transition regime
Raw Text Summary
📌 FSLY @ 33.50 (2026-04-05 06:49 PM MYT)

• Current price is **33.50**. Key support is around **33.00**, and resistance is around **35.00**.
• For the next week, the model’s **68% expected range** is roughly **29.02 to 37.98**.
• A wider **90% range** is about **26.13 to 40.87**.
• Dealer positioning looks **LONG gamma**, so the market behavior is classified as **TRANSITION**.
• The estimated **gamma flip** is near **26.95**. Crossing and holding beyond this area can change the trading behavior.
• Approximate breakout odds: **above resistance 32.9%**, **below support 40.7%** by the target horizon.
• Options skew is fairly balanced, so there is **no strong directional bias** from skew alone.
• Near-term implied volatility is higher than the next expiry (**IV1 97.13% vs IV2 92.41%**), which suggests **near-term event stress / backwardation**.
• On the daily chart, the stock currently looks like **UP trend (expanding)**.
• The implied distribution shows **heavier downside tail risk** than upside tail potential.
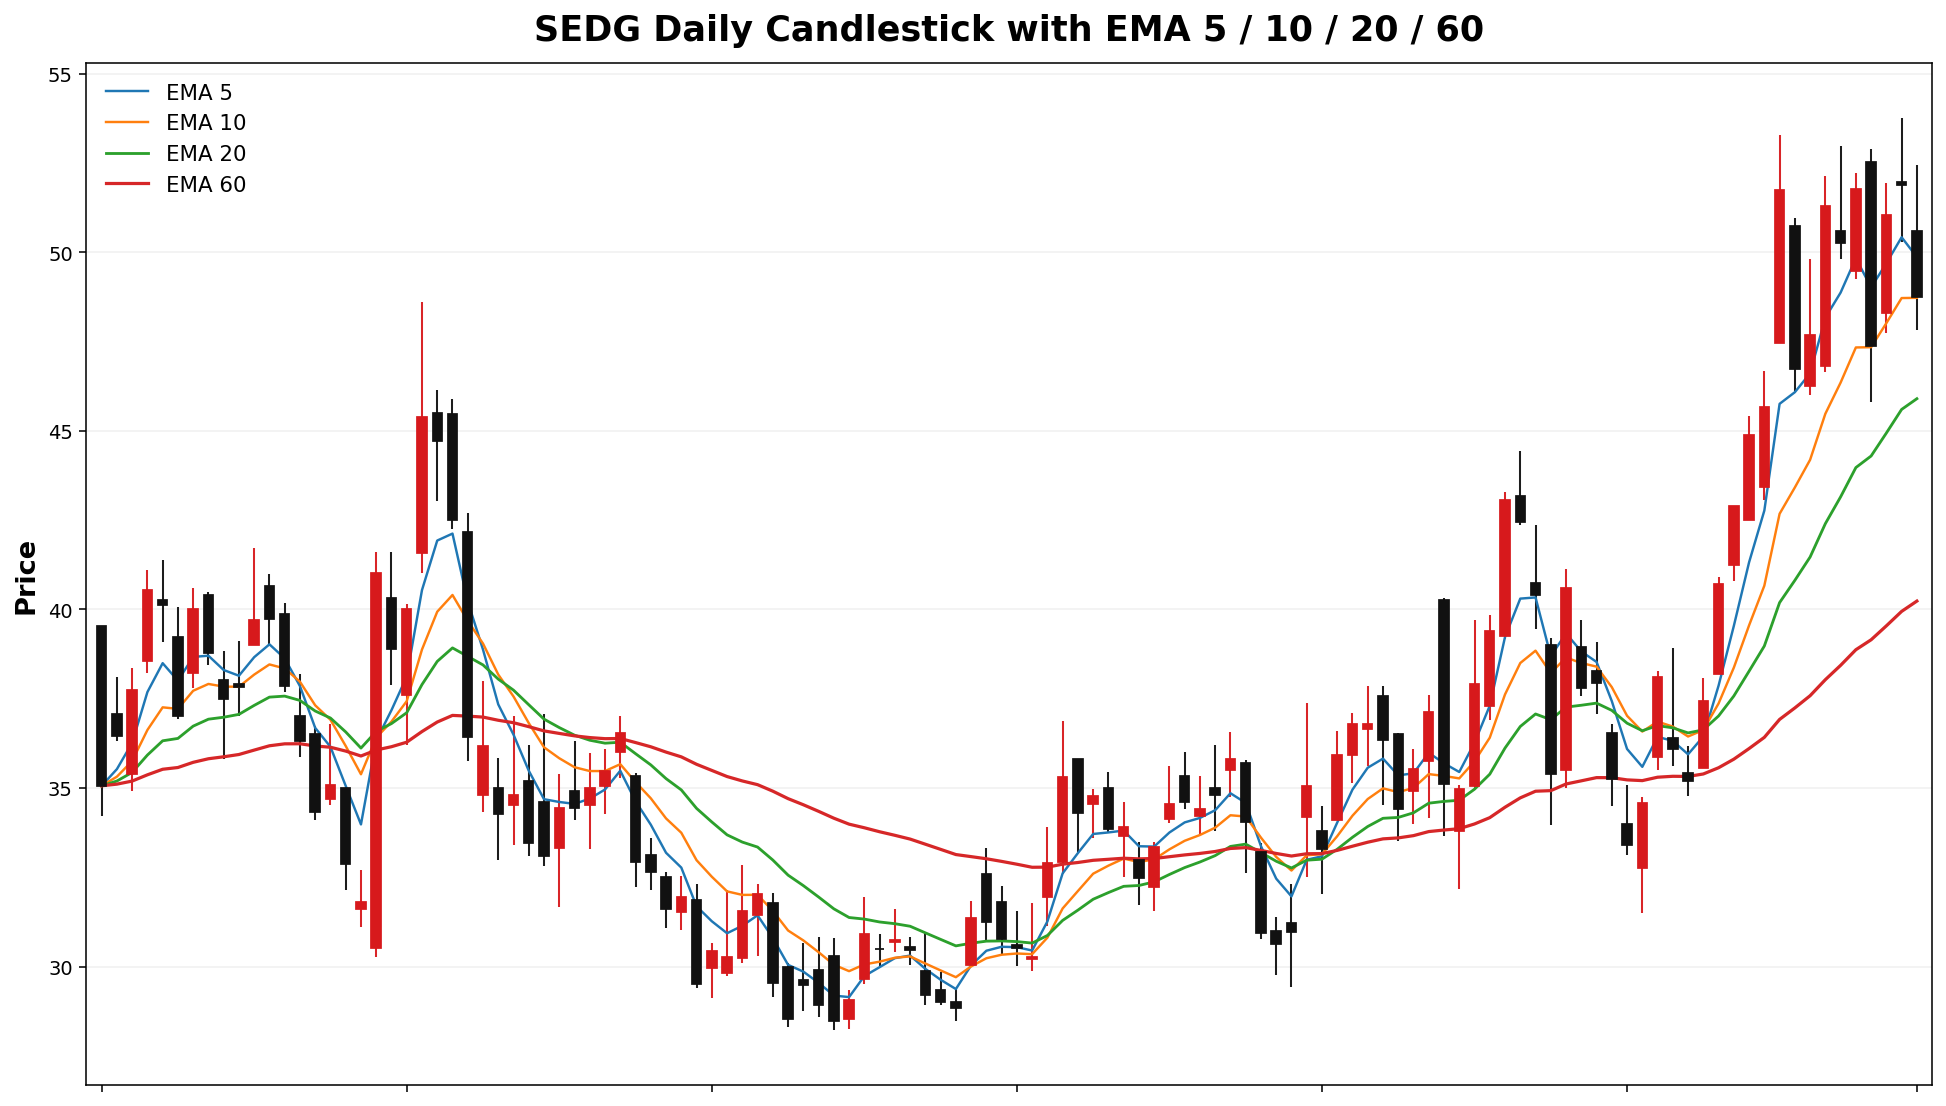
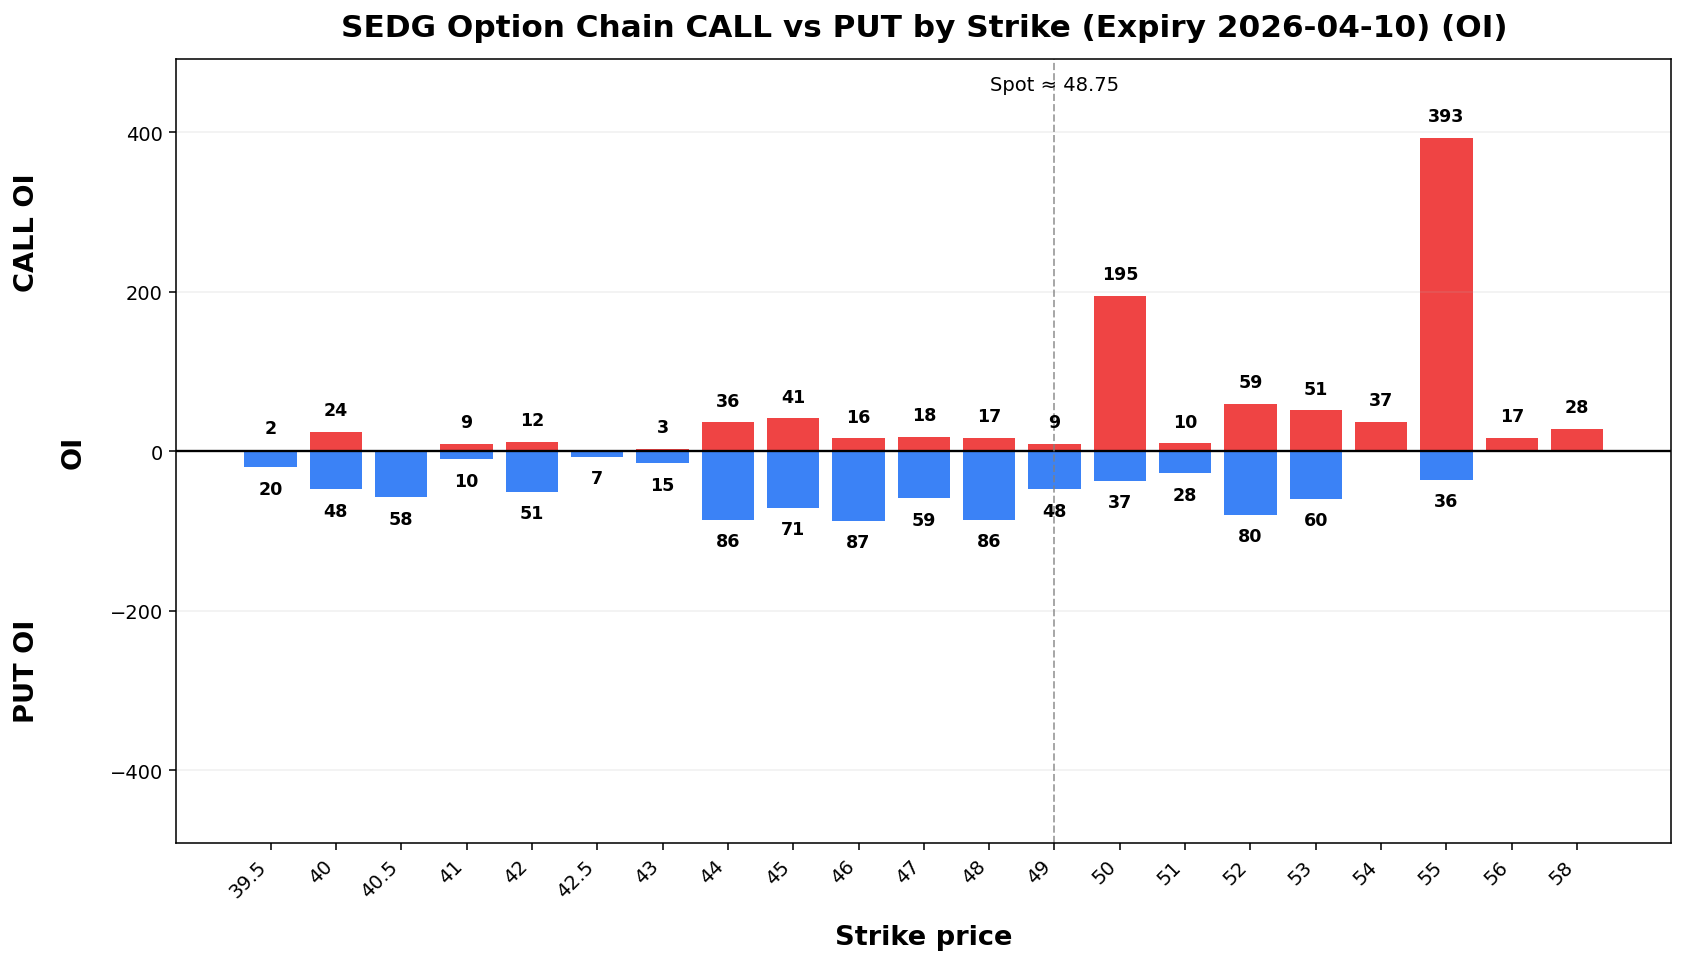
SEDG
Spot: 48.75
Report Time: 2026-04-05 06:49 PM MYT
Regime: TREND
Dealer Gamma: SHORT
Term Structure
| Expiry |
DTE |
Forward |
ATM IV |
ATM Straddle |
| 2026-04-10 |
6 |
48.96 |
87.37% |
5.17 |
| 2026-04-17 |
13 |
48.90 |
76.04% |
6.83 |
Weekly Range
| Confidence |
Low |
High |
Width |
| 68% |
43.09 |
54.41 |
11.32 |
| 80% |
41.50 |
56.00 |
14.50 |
| 90% |
39.44 |
58.06 |
18.61 |
| 95% |
37.66 |
59.84 |
22.18 |
Structure & Probabilities
| Support |
Resistance |
Gamma Flip |
Max Pain |
P>Res |
P<Sup |
| 48.00 |
50.00 |
47.91 |
48.00 |
46.3% |
50.2% |
Flow & Skew
| Call Vol |
Put Vol |
Vol P/C |
Call OI |
Put OI |
OI P/C |
Skew |
Skew Bias |
| 991 |
1,597 |
1.61 |
1,355 |
1,383 |
1.02 |
-0.88 vol pts |
FLAT |
Tail Risk
| Q10 |
Q50 |
Q90 |
Down Tail |
Up Tail |
Down/Up |
| 40.87 |
49.45 |
55.97 |
7.88 |
7.22 |
1.09 |
Daily Technicals
| EMA20 |
EMA50 |
VWAP20 |
BB Lower |
BB Mid |
BB Upper |
BB Width |
Vol Ratio |
Path |
| 45.90 |
41.08 |
44.92 |
31.31 |
44.37 |
57.43 |
58.87% |
0.68 |
UP trend (expanding) |
Day Plan
- 48.00-50.00 range: fade extremes
- > 50.00: chase only if hold + vol
- < 48.00: risk expand; reduce size
- Regime: TREND
- Tech: UP trend (expanding)
Swing Plan
- Accumulate: 48.00-48.00
- Trim: 50.00-50.00
- Add: close > 50.00
- Cut: close < 48.00
- Best for: trend regime
Raw Text Summary
📌 SEDG @ 48.75 (2026-04-05 06:49 PM MYT)

• Current price is **48.75**. Key support is around **48.00**, and resistance is around **50.00**.
• For the next week, the model’s **68% expected range** is roughly **43.09 to 54.41**.
• A wider **90% range** is about **39.44 to 58.06**.
• Dealer positioning looks **SHORT gamma**, so the market behavior is classified as **TREND**.
• The estimated **gamma flip** is near **47.91**. Crossing and holding beyond this area can change the trading behavior.
• Approximate breakout odds: **above resistance 46.3%**, **below support 50.2%** by the target horizon.
• Options skew is fairly balanced, so there is **no strong directional bias** from skew alone.
• Near-term implied volatility is higher than the next expiry (**IV1 87.37% vs IV2 76.04%**), which suggests **near-term event stress / backwardation**.
• Recent volume is only **0.68x** the 20-day average, so breakouts may be less reliable unless volume improves.
• On the daily chart, the stock currently looks like **UP trend (expanding)**.
• The implied distribution is **fairly balanced** between upside and downside tails.
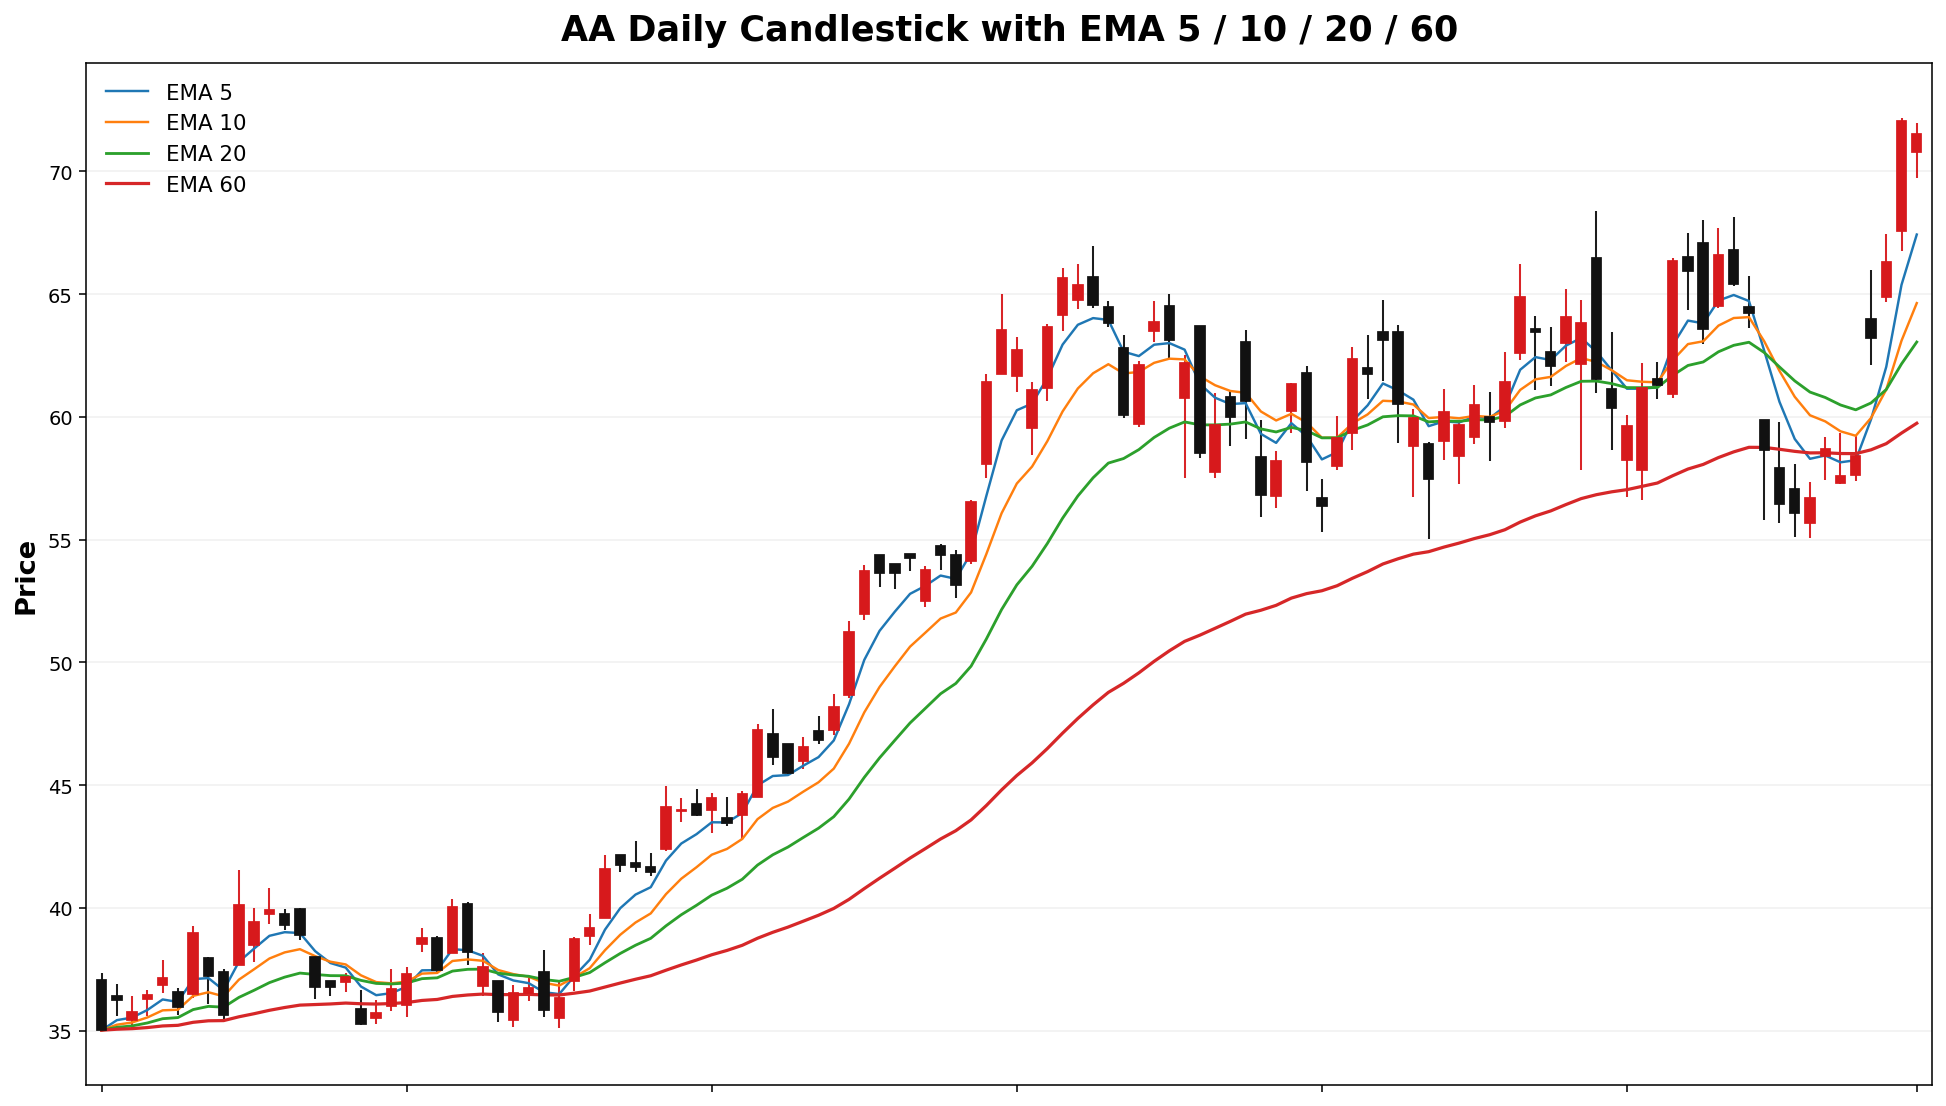
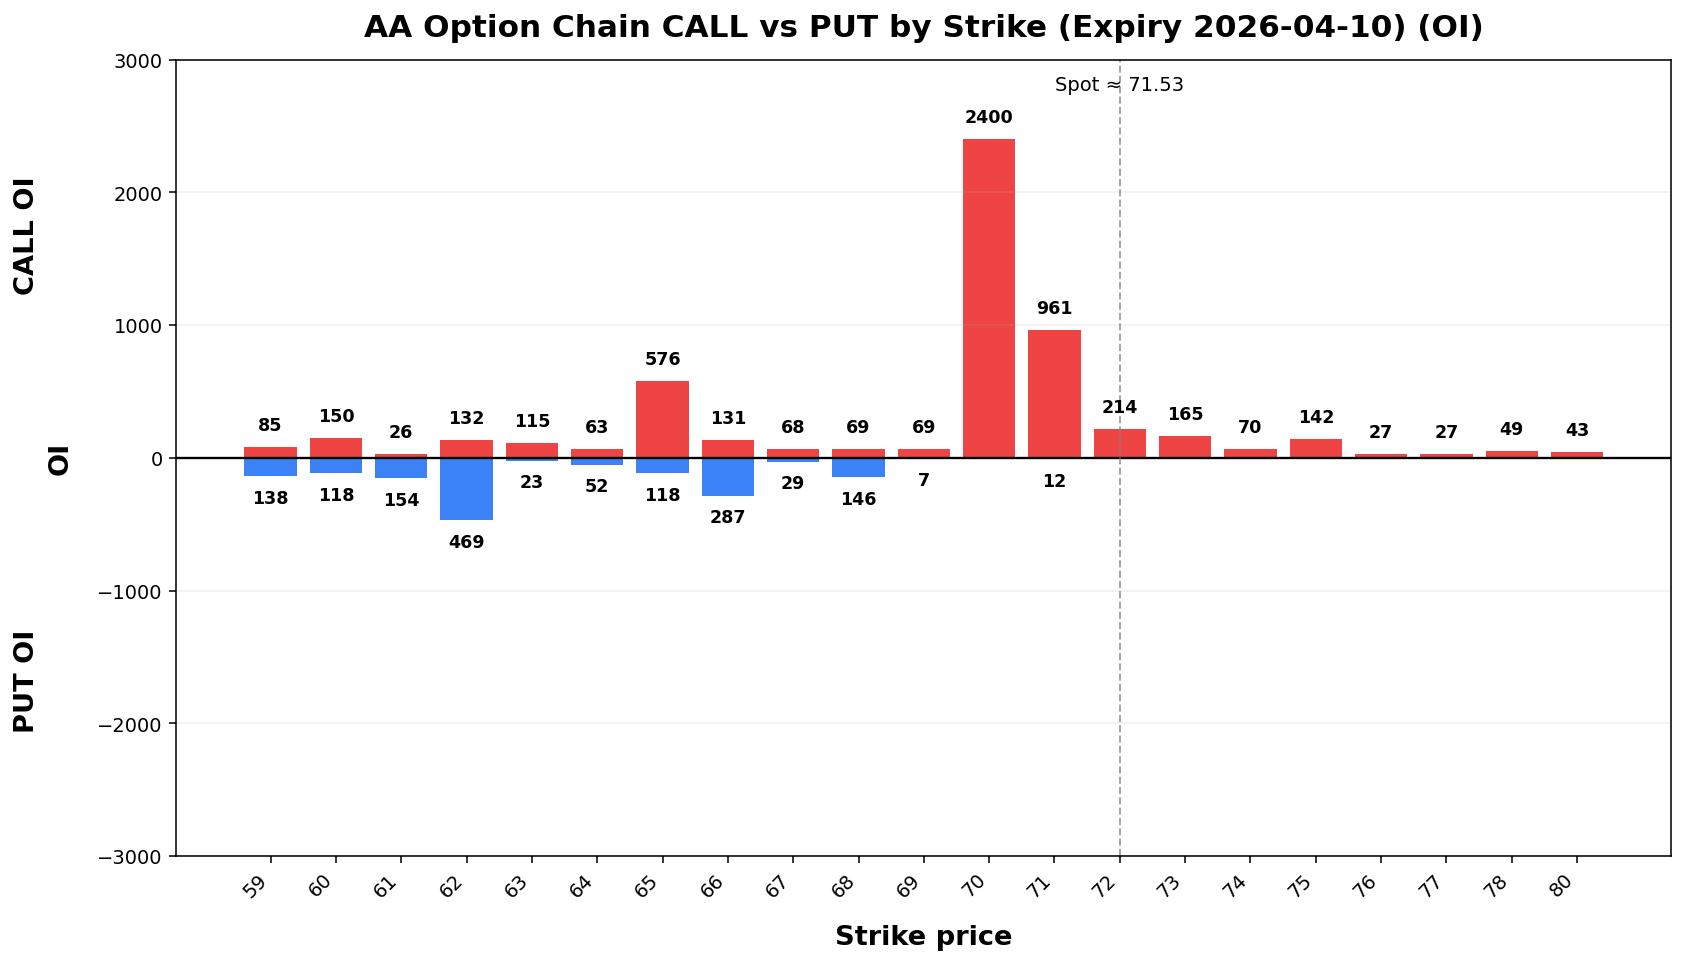
AA
Spot: 71.53
Report Time: 2026-04-05 06:50 PM MYT
Regime: TRANSITION
Dealer Gamma: LONG
Term Structure
| Expiry |
DTE |
Forward |
ATM IV |
ATM Straddle |
| 2026-04-10 |
6 |
71.49 |
61.16% |
5.31 |
| 2026-04-17 |
13 |
71.49 |
64.16% |
8.45 |
Weekly Range
| Confidence |
Low |
High |
Width |
| 68% |
65.23 |
77.83 |
12.60 |
| 80% |
63.45 |
79.61 |
16.15 |
| 90% |
61.17 |
81.89 |
20.73 |
| 95% |
59.18 |
83.88 |
24.70 |
Structure & Probabilities
| Support |
Resistance |
Gamma Flip |
Max Pain |
P>Res |
P<Sup |
| 71.00 |
72.00 |
59.71 |
62.00 |
35.3% |
41.9% |
Flow & Skew
| Call Vol |
Put Vol |
Vol P/C |
Call OI |
Put OI |
OI P/C |
Skew |
Skew Bias |
| 2,099 |
1,884 |
0.90 |
5,967 |
3,812 |
0.64 |
4.69 vol pts |
PUT_SKEW |
Tail Risk
| Q10 |
Q50 |
Q90 |
Down Tail |
Up Tail |
Down/Up |
| 57.61 |
69.97 |
77.00 |
13.92 |
5.47 |
2.54 |
Daily Technicals
| EMA20 |
EMA50 |
VWAP20 |
BB Lower |
BB Mid |
BB Upper |
BB Width |
Vol Ratio |
Path |
| 63.05 |
60.68 |
62.82 |
52.90 |
62.50 |
72.09 |
30.71% |
0.88 |
UP trend (expanding) |
Day Plan
- 71.00-72.00 range: fade extremes
- > 72.00: chase only if hold + vol
- < 71.00: risk expand; reduce size
- Regime: TRANSITION
- Tech: UP trend (expanding)
Swing Plan
- Accumulate: 71.00-71.00
- Trim: 72.00-72.00
- Add: close > 72.00
- Cut: close < 71.00
- Best for: transition regime
Raw Text Summary
📌 AA @ 71.53 (2026-04-05 06:50 PM MYT)

• Current price is **71.53**. Key support is around **71.00**, and resistance is around **72.00**.
• For the next week, the model’s **68% expected range** is roughly **65.23 to 77.83**.
• A wider **90% range** is about **61.17 to 81.89**.
• Dealer positioning looks **LONG gamma**, so the market behavior is classified as **TRANSITION**.
• The estimated **gamma flip** is near **59.71**. Crossing and holding beyond this area can change the trading behavior.
• Approximate breakout odds: **above resistance 35.3%**, **below support 41.9%** by the target horizon.
• Options skew is tilted toward **puts**, which suggests traders are paying more for downside protection.
• Near-term implied volatility is lower than the next expiry (**IV1 61.16% vs IV2 64.16%**), which suggests a **contango / calmer front expiry** setup.
• On the daily chart, the stock currently looks like **UP trend (expanding)**.
• The implied distribution shows **heavier downside tail risk** than upside tail potential.
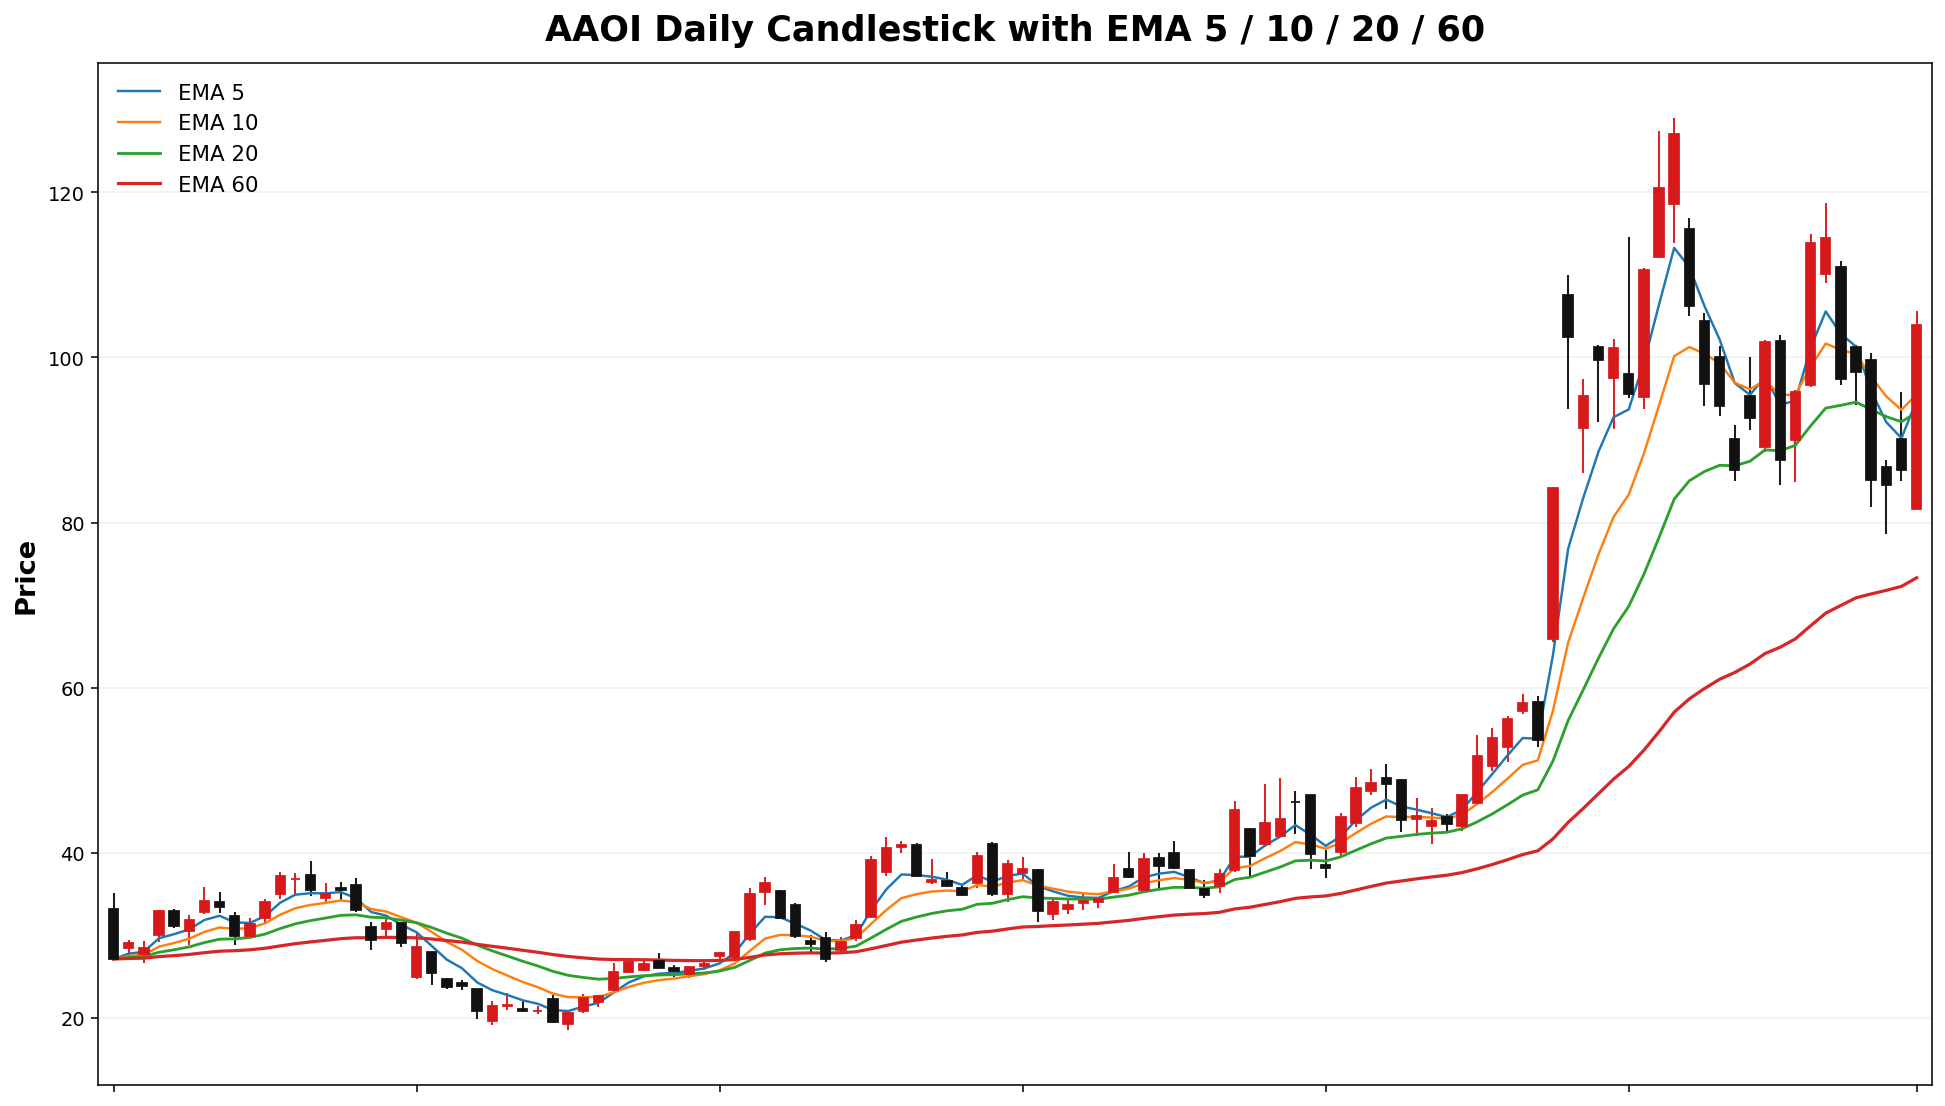
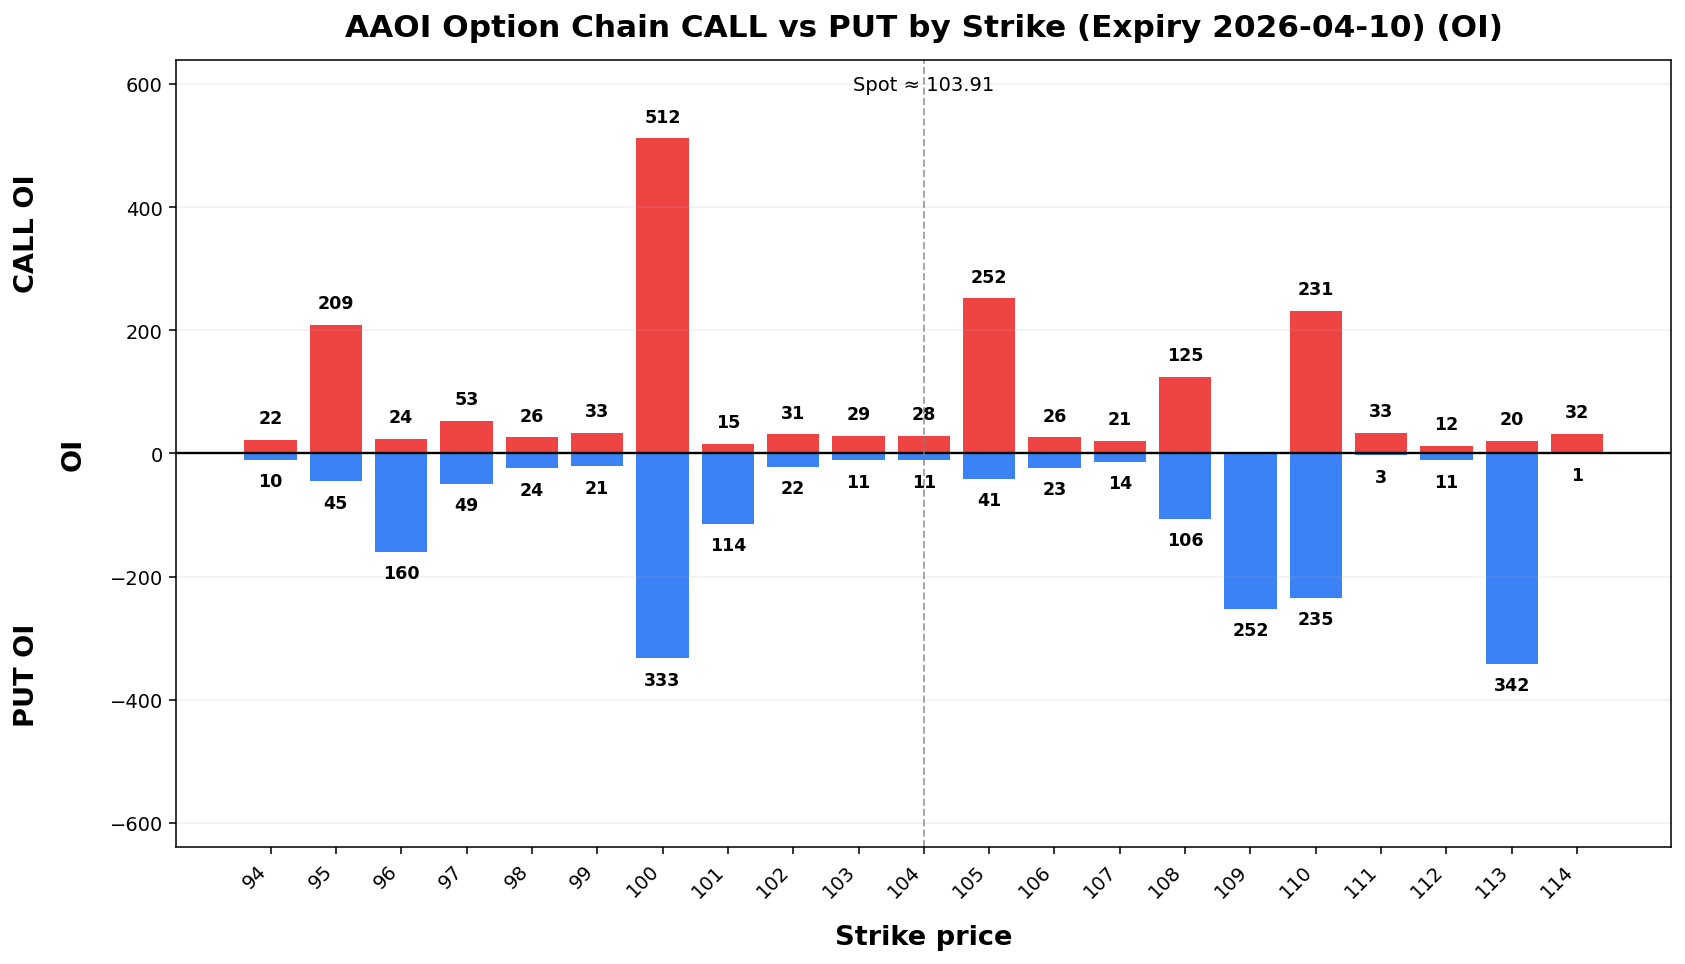
AAOI
Spot: 103.91
Report Time: 2026-04-05 06:50 PM MYT
Regime: PIN
Dealer Gamma: LONG
Term Structure
| Expiry |
DTE |
Forward |
ATM IV |
ATM Straddle |
| 2026-04-10 |
6 |
103.70 |
121.80%126.85% |
16.00 |
E2 |
2026-04-17 |
13 |
103.87 |
112.66%114.73% |
21.95 |
DistributionWeekly Range
| Confidence |
Low |
High |
Width |
| 68% |
86.13 |
121.69 |
35.56 |
| 80% |
81.12 |
126.70 |
45.57 |
| 90% |
74.66 |
133.16 |
58.49 |
| 95% |
69.06 |
138.76 |
69.70 |
Structure & Probabilities
| Support |
Resistance |
Gamma Flip |
Max Pain |
P>Res |
P<Sup |
| 100.00 |
105.00 |
105.89 |
97.00 |
43.7% |
45.4% |
Flow & Skew
| Call Vol |
Put Vol |
Vol P/C |
Call OI |
Put OI |
OI P/C |
Skew |
Skew Bias |
| 9,063 |
8,565 |
0.95 |
5,349 |
8,319 |
1.56 |
20.31 vol pts |
PUT_SKEW |
Tail Risk
| Q10 |
MedianQ50 |
Q90 |
Down Tail Asymmetry |
SkewUp (25ΔP-25ΔC)Tail |
Down/Up |
| 55.36 |
97.36 |
127.7776 |
48.55 |
23.85 |
2.03 |
23.05 volpts04 |
ExecutiveDaily SummaryTechnicals
| EMA20 |
EMA50 |
VWAP20 |
BB Lower |
BB Mid |
BB Upper |
BB Width |
Vol Ratio |
Path |
| 93.32 |
77.60 |
99.76 |
75.44 |
99.95 |
124.45 |
49.04% |
1.51 |
UP trend (expanding) |
Day Plan
这周大概率在 86.5–121.3 区间来回走。
极端情况下可能到 75.4 或 132.5 附近。
80 是关键支撑(收盘跌破,下行风险会变大)。
100 是关键压力(收盘站上去才算转强)。
目前在分界线(约 101.91)上方;跌破它会更危险。
市场更倾向突破压力,而不是跌破支撑。
Trade Plans
Day Trade Plan
100-105100.00-105.00 range: fade extremes- >
100:105.00: chase only if hold + vol
- <
80:100.00: risk expand; reduce size
- Regime: PIN
- Tech: UP trend (expanding)
Vol: elevated (breakout odds↑)
Swing Trade Plan
- Accumulate:
80-100100.00-100.00
- Trim:
100.0-100105.00-105.00
- Add: close >
100105.00
- Cut: close <
80100.00
- Best for: pin regime
2.Raw ASTS
Text Summary
Quick📌 Take:
AAOI 这周大概率在@ 81.0–104.2103.91 区间来回走。
Snapshot
Item |
Value |
|---|
Spot |
92.62 |
Report Time |
(2026-04-05 08:0006:50 AMPM MYT | MYT)
• Current Executionprice Regime | is LONG_GAMMA_PIN | **103.91**.
Key support is around **100.00**, and resistance is around **105.00**.
• For the next week, the model’s **68% expected range** is roughly **86.13 to 121.69**.
• A wider **90% range** is about **74.66 to 133.16**.
• Dealer Gamma | positioning looks **LONG |
gamma**, so Trendthe Path | market Sidewaysbehavior is classified as **PIN**.
• The estimated **gamma flip** is near **105.89**. Crossing and holding beyond this area can change the trading behavior.
• Approximate breakout odds: **above resistance 43.7%**, **below support 45.4%** by the target horizon.
• Options skew is tilted toward **puts**, which suggests traders are paying more for downside protection.
• Near-term implied volatility is higher than the next expiry (**IV1 126.85% vs IV2 114.73%**), which suggests **near-term event stress / Range | backwardation**.
• Recent
volume Tradingis Map
**1.51x** the 20-day average, Zone | which Levelsupports /stronger Range | continuation Note | or
breakout follow-through.
• On Weeklythe 68% | daily 81.04chart, –the 104.20 | stock 1σcurrently movelooks 11.58 | like
**UP trend Weekly(expanding)**.
90% | • 73.57The –implied 111.67 | distribution widershows risk**heavier band |
Support |
85.00 |
downside defense | tail
risk** than Resistance |
95.00 |
upside supply | tail
potential.
Gamma
Flip | CRWV
85.90 | Spot:
regime82.24
pivot | Report
Time: 2026-04-05 Max06:50 Pain | PM NA | MYT
pinRegime: magnet | TRANSITION
Dealer Gamma:
LONG
Options
& Probability Dashboard
Metric |
Value |
Interpretation |
|---|
Breakout Up |
30.2% |
close above upper band |
Breakout Down |
24.4% |
close below lower band |
Put/Call Volume |
0.55 |
directional flow |
Put/Call OI |
0.58 |
positioning bias |
Total Option Volume |
32,561 |
nearest expiry |
Total Open Interest |
39,653 |
nearest expiry |
Term Structure
Leg |
Expiry |
DTE |
Forward |
ATM IV |
ATM Straddle |
|---|
E12026-04-10 |
6 |
82.21 |
77.13% |
7.70 |
| 2026-04-17 |
13 |
82.23 |
72.65% |
11.00 |
Weekly Range
| Confidence |
Low |
High |
Width |
| 68% |
73.54 |
90.94 |
17.41 |
| 80% |
71.09 |
93.39 |
22.31 |
| 90% |
67.93 |
96.55 |
28.63 |
| 95% |
65.18 |
99.30 |
34.11 |
Structure & Probabilities
| Support |
Resistance |
Gamma Flip |
Max Pain |
P>Res |
P<Sup |
| 80.00 |
85.00 |
79.69 |
80.00 |
30.8% |
39.1% |
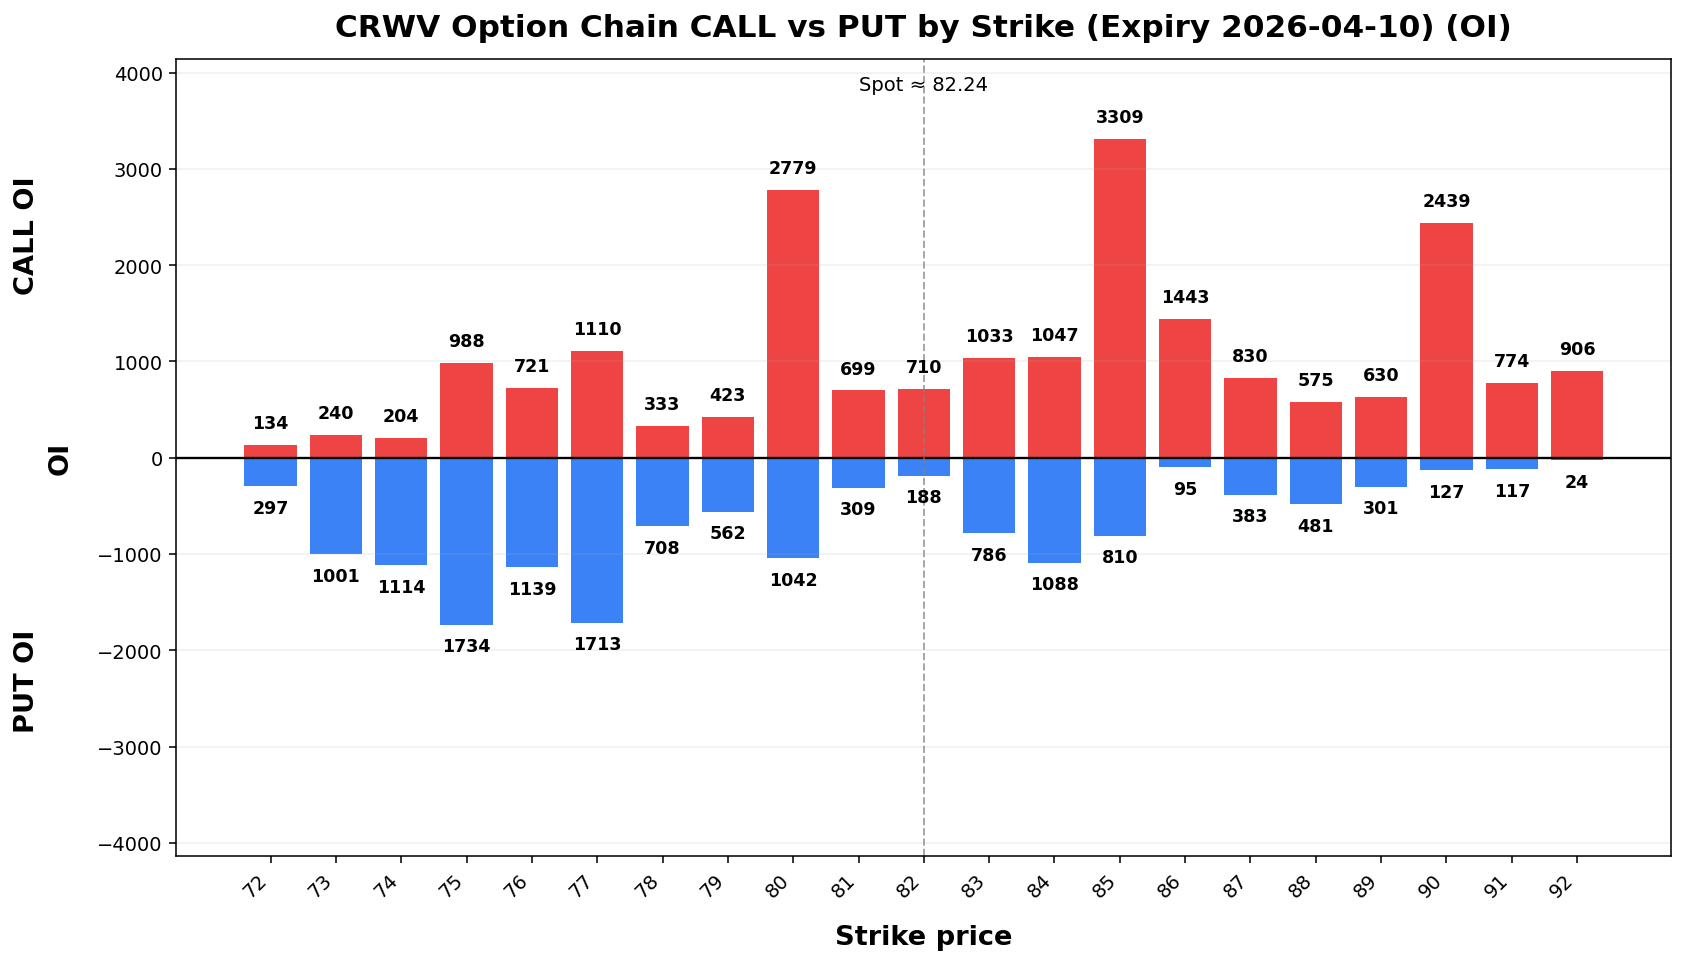
Flow & Skew
| Call Vol |
Put Vol |
Vol P/C |
Call OI |
Put OI |
OI P/C |
Skew |
Skew Bias |
| 23,965 |
40,515 |
1.69 |
31,413 |
46,333 |
1.47 |
11.33 vol pts |
PUT_SKEW |
Tail Risk
| Q10 |
Q50 |
Q90 |
Down Tail |
Up Tail |
Down/Up |
| 64.13 |
82.09 |
93.53 |
18.11 |
11.29 |
1.61 |
Daily Technicals
| EMA20 |
EMA50 |
VWAP20 |
BB Lower |
BB Mid |
BB Upper |
BB Width |
Vol Ratio |
Path |
| 80.57 |
84.00 |
79.39 |
70.63 |
79.67 |
88.70 |
22.68% |
0.94 |
DOWN trend (expanding) |
Day Plan
- 80.00-85.00 range: fade extremes
- > 85.00: chase only if hold + vol
- < 80.00: risk expand; reduce size
- Regime: TRANSITION
- Tech: DOWN trend (expanding)
Swing Plan
- Accumulate: 80.00-80.00
- Trim: 85.00-85.00
- Add: close > 85.00
- Cut: close < 80.00
- Best for: transition regime
Raw Text Summary
📌 CRWV @ 82.24 (2026-04-05 06:50 PM MYT)

• Current price is **82.24**. Key support is around **80.00**, and resistance is around **85.00**.
• For the next week, the model’s **68% expected range** is roughly **73.54 to 90.94**.
• A wider **90% range** is about **67.93 to 96.55**.
• Dealer positioning looks **LONG gamma**, so the market behavior is classified as **TRANSITION**.
• The estimated **gamma flip** is near **79.69**. Crossing and holding beyond this area can change the trading behavior.
• Approximate breakout odds: **above resistance 30.8%**, **below support 39.1%** by the target horizon.
• Options skew is tilted toward **puts**, which suggests traders are paying more for downside protection.
• Near-term implied volatility is higher than the next expiry (**IV1 77.13% vs IV2 72.65%**), which suggests **near-term event stress / backwardation**.
• On the daily chart, the stock currently looks like **DOWN trend (expanding)**.
• The implied distribution shows **heavier downside tail risk** than upside tail potential.
DOCN
Spot: 90.01
Report Time: 2026-04-05 06:50 PM MYT
Regime: TRANSITION
Dealer Gamma: LONG
Term Structure
| Expiry |
DTE |
Forward |
ATM IV |
ATM Straddle |
| 2026-04-10 |
6 |
89.63 |
78.71% |
8.60 |
| 2026-04-17 |
13 |
89.63 |
71.81% |
11.90 |
Weekly Range
| Confidence |
Low |
High |
Width |
| 68% |
80.42 |
99.60 |
19.18 |
| 80% |
77.72 |
102.30 |
24.58 |
| 90% |
74.23 |
105.79 |
31.55 |
| 95% |
71.21 |
108.81 |
37.60 |
Structure & Probabilities
| Support |
Resistance |
Gamma Flip |
Max Pain |
P>Res |
P<Sup |
| 90.00 |
99.60 |
66.90 |
75.00 |
12.1% |
45.6% |
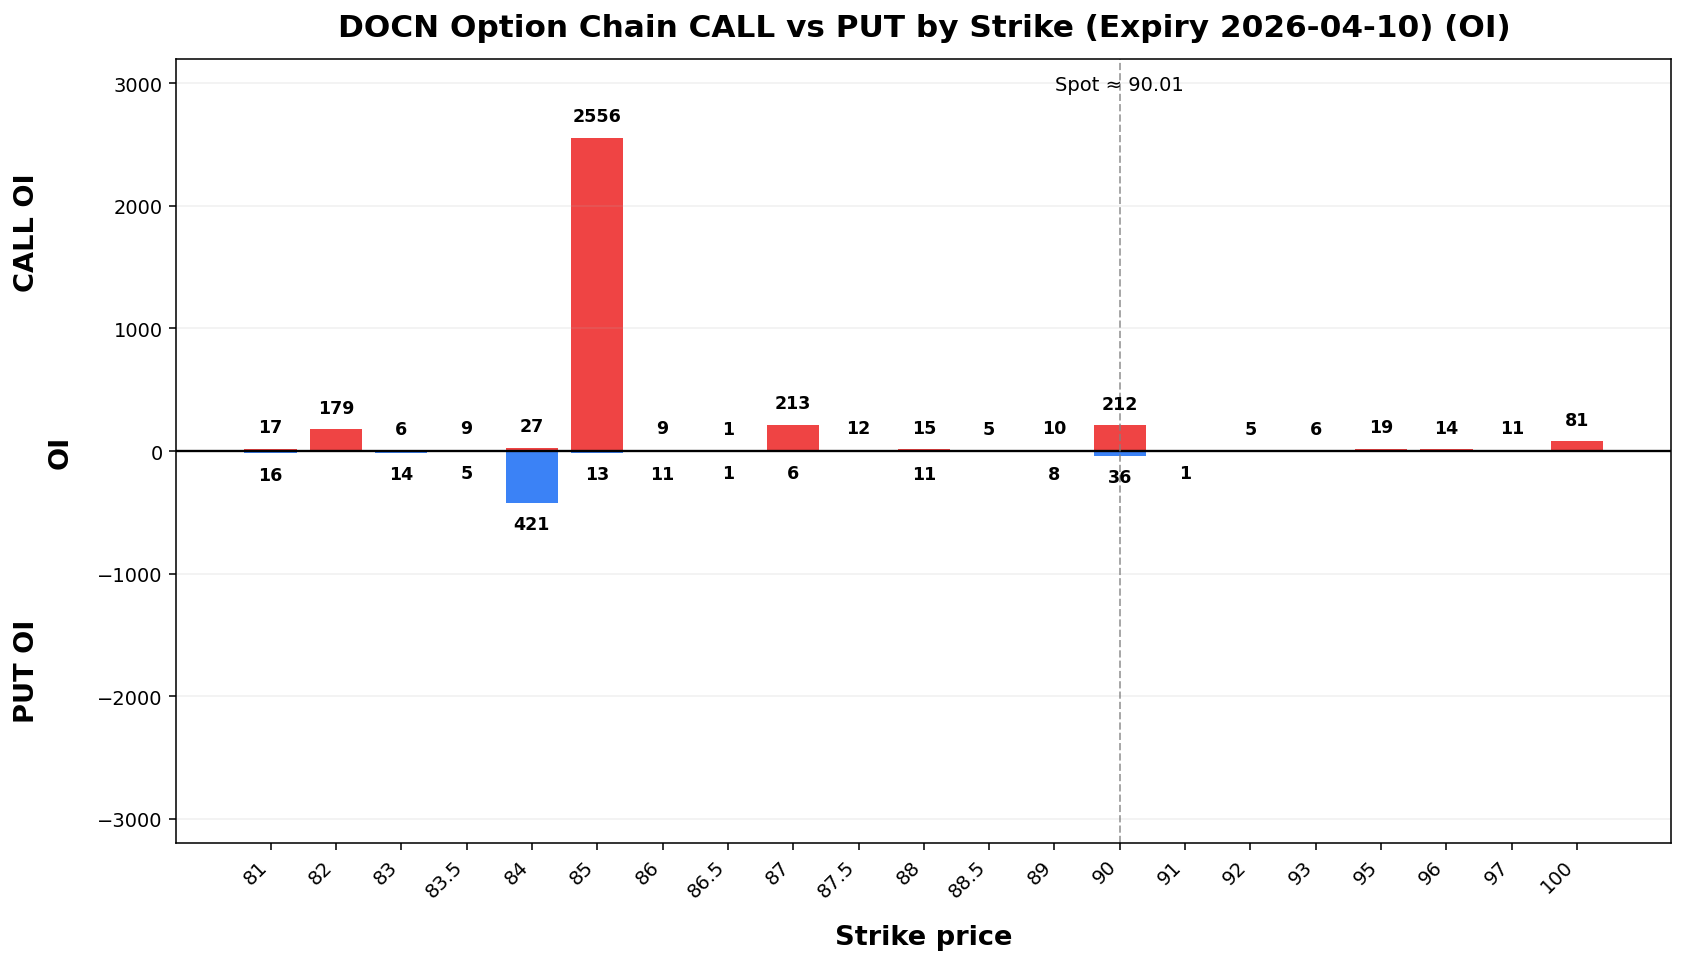
Flow & Skew
| Call Vol |
Put Vol |
Vol P/C |
Call OI |
Put OI |
OI P/C |
Skew |
Skew Bias |
| 3,371 |
1,048 |
0.31 |
6,200 |
3,168 |
0.51 |
14.75 vol pts |
PUT_SKEW |
Tail Risk
| Q10 |
Q50 |
Q90 |
Down Tail |
Up Tail |
Down/Up |
| 72.49 |
88.17 |
101.41 |
17.52 |
11.40 |
1.54 |
Daily Technicals
| EMA20 |
EMA50 |
VWAP20 |
BB Lower |
BB Mid |
BB Upper |
BB Width |
Vol Ratio |
Path |
| 78.61 |
68.91 |
78.84 |
55.58 |
77.22 |
98.86 |
56.04% |
0.76 |
UP trend (expanding) |
Day Plan
- 90.00-99.60 range: fade extremes
- > 99.60: chase only if hold + vol
- < 90.00: risk expand; reduce size
- Regime: TRANSITION
- Tech: UP trend (expanding)
Swing Plan
- Accumulate: 90.00-90.00
- Trim: 99.60-99.60
- Add: close > 99.60
- Cut: close < 90.00
- Best for: transition regime
Raw Text Summary
📌 DOCN @ 90.01 (2026-04-05 06:50 PM MYT)

• Current price is **90.01**. Key support is around **90.00**, and resistance is around **99.60**.
• For the next week, the model’s **68% expected range** is roughly **80.42 to 99.60**.
• A wider **90% range** is about **74.23 to 105.79**.
• Dealer positioning looks **LONG gamma**, so the market behavior is classified as **TRANSITION**.
• The estimated **gamma flip** is near **66.90**. Crossing and holding beyond this area can change the trading behavior.
• Approximate breakout odds: **above resistance 12.1%**, **below support 45.6%** by the target horizon.
• Options skew is tilted toward **puts**, which suggests traders are paying more for downside protection.
• Near-term implied volatility is higher than the next expiry (**IV1 78.71% vs IV2 71.81%**), which suggests **near-term event stress / backwardation**.
• Recent volume is only **0.76x** the 20-day average, so breakouts may be less reliable unless volume improves.
• On the daily chart, the stock currently looks like **UP trend (expanding)**.
• The implied distribution shows **heavier downside tail risk** than upside tail potential.
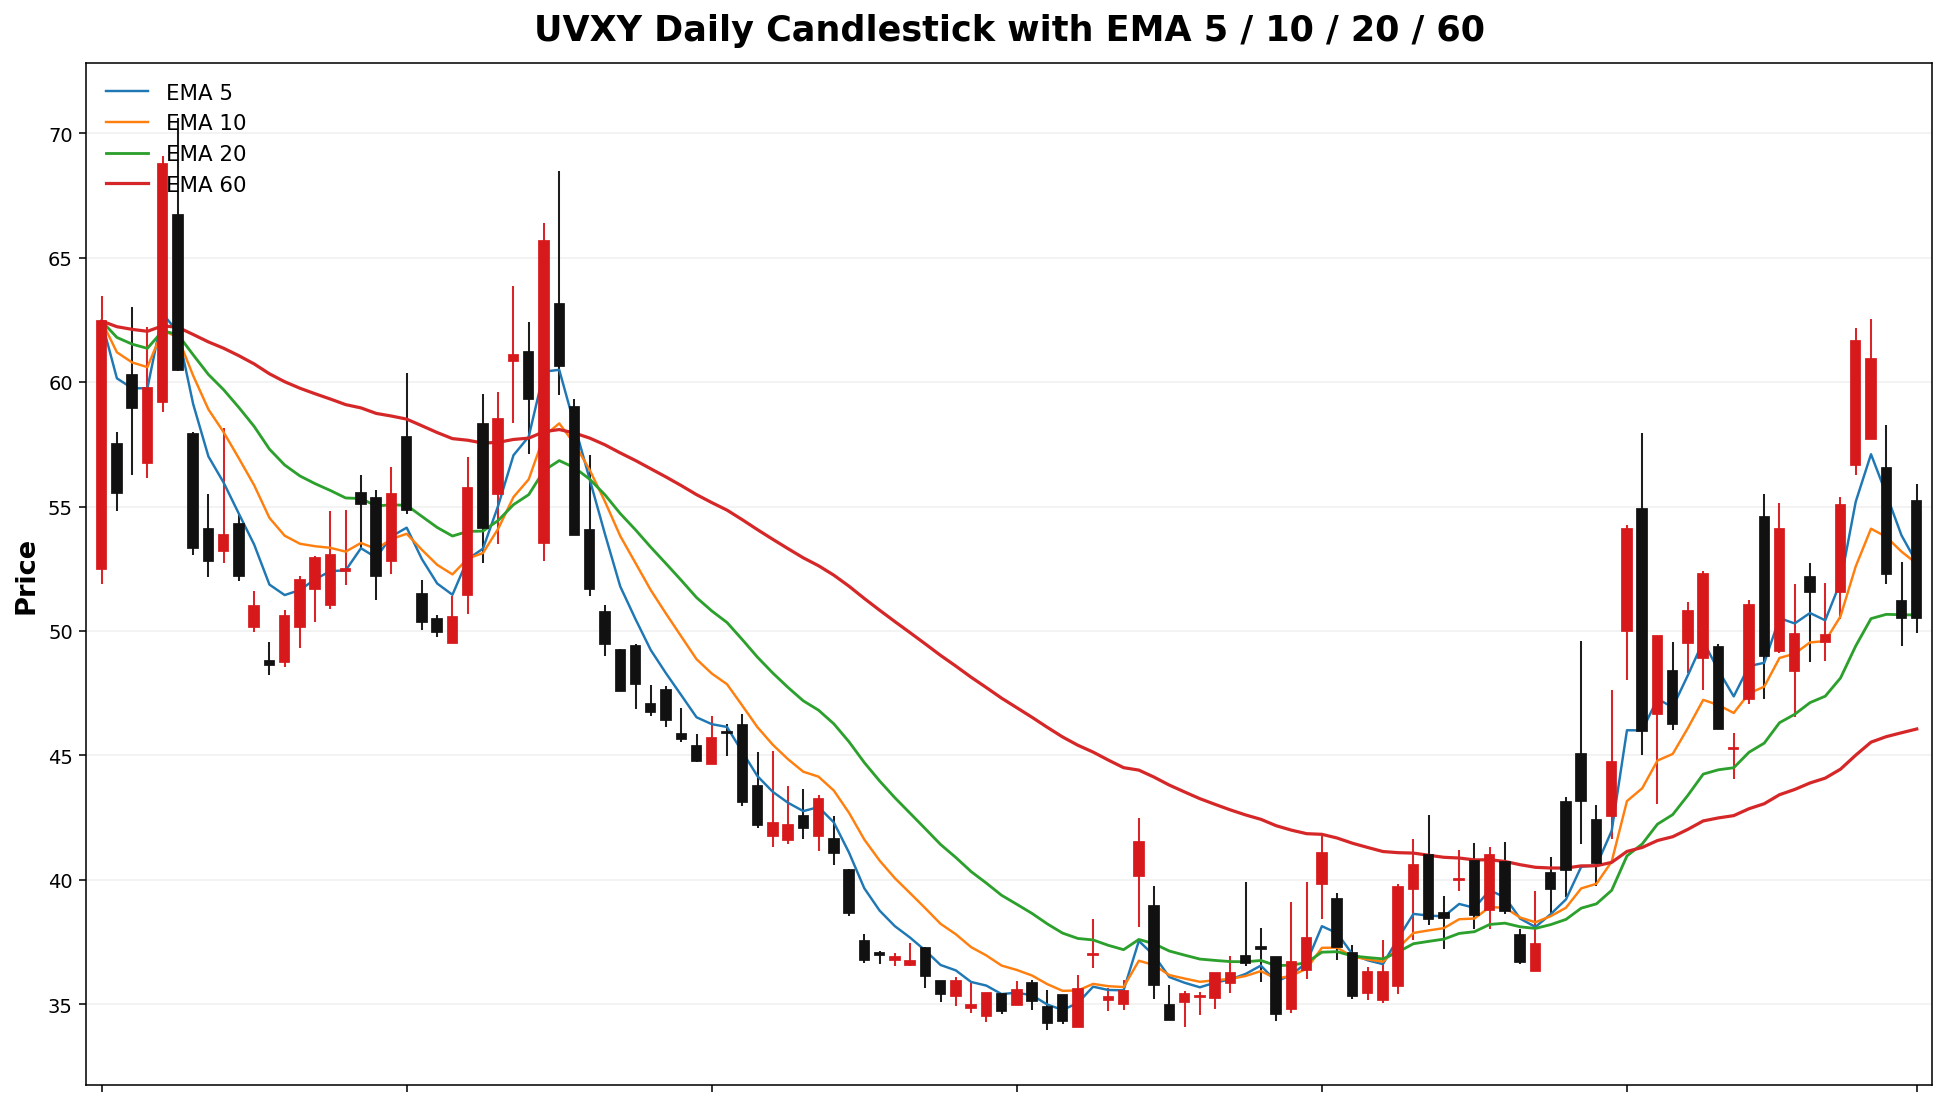
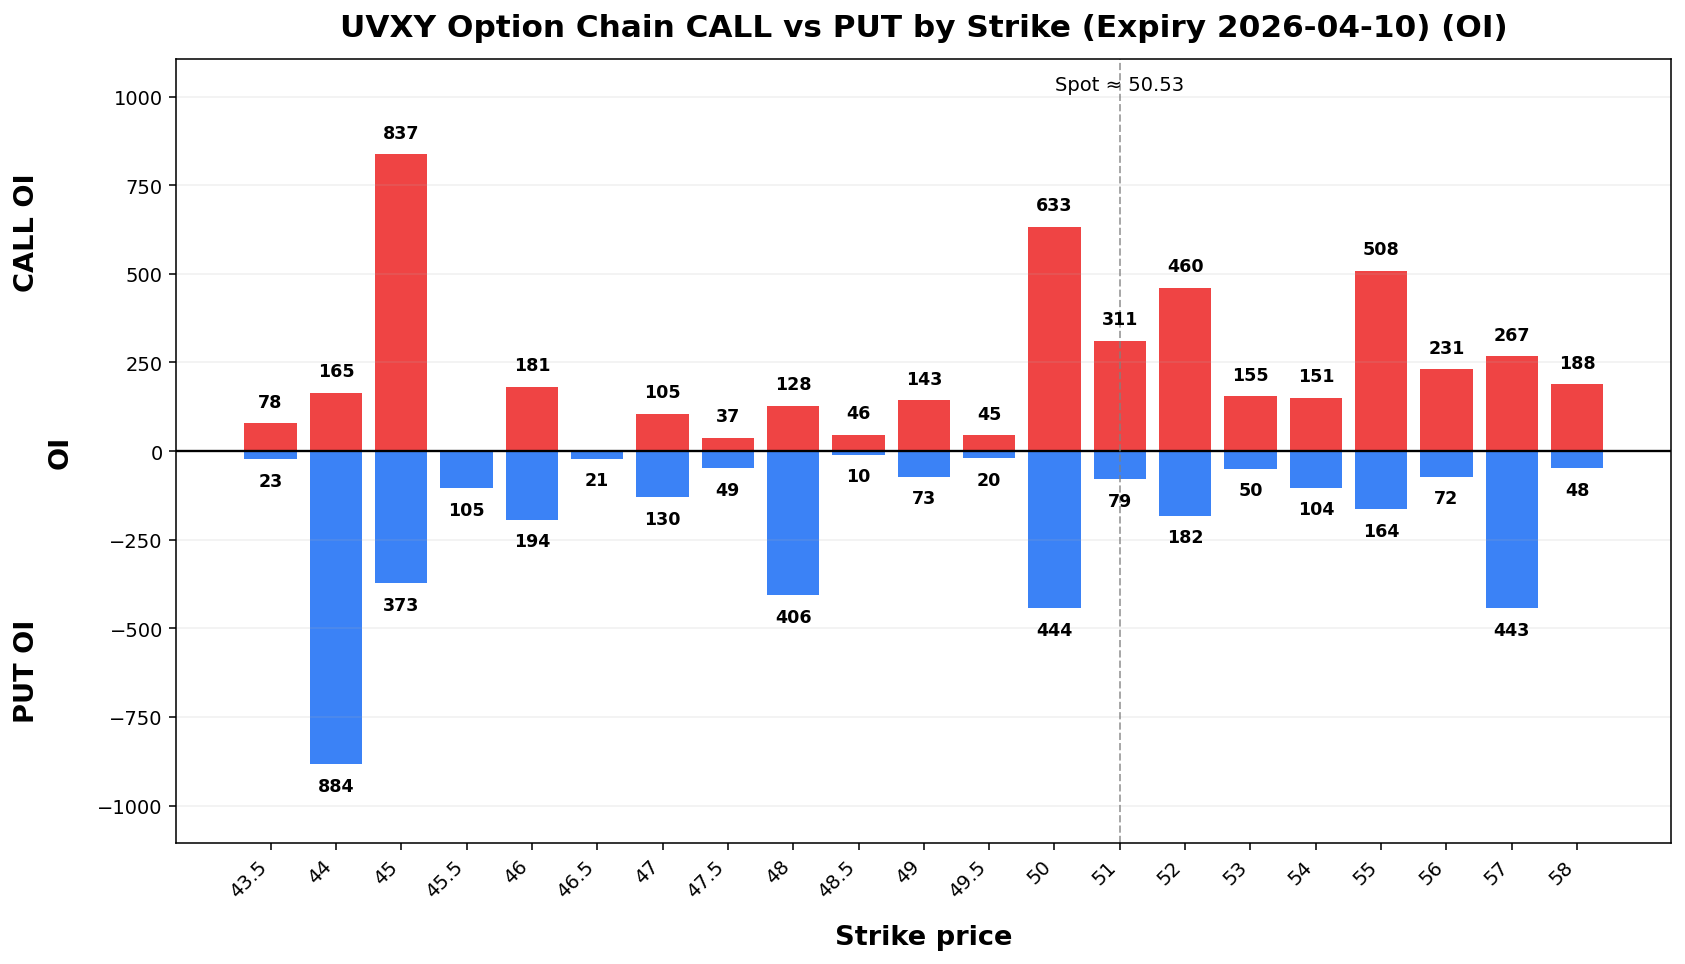
UVXY
Spot: 50.53
Report Time: 2026-04-05 06:50 PM MYT
Regime: TRANSITION
Dealer Gamma: LONG
Term Structure
| Expiry |
DTE |
Forward |
ATM IV |
ATM Straddle |
| 2026-04-10 |
6 |
50.72 |
121.46% |
7.45 |
| 2026-04-17 |
13 |
50.98 |
120.39% |
11.20 |
Weekly Range
| Confidence |
Low |
High |
Width |
| 68% |
41.92 |
59.14 |
17.22 |
| 80% |
39.50 |
61.56 |
22.07 |
| 90% |
36.37 |
64.69 |
28.33 |
| 95% |
33.65 |
67.41 |
33.75 |
Structure & Probabilities
| Support |
Resistance |
Gamma Flip |
Max Pain |
P>Res |
P<Sup |
| 50.00 |
55.00 |
44.89 |
49.00 |
27.6% |
36.3% |
Flow & Skew
| Call Vol |
Put Vol |
Vol P/C |
Call OI |
Put OI |
OI P/C |
Skew |
Skew Bias |
| 9,110 |
3,573 |
0.39 |
13,654 |
8,668 |
0.63 |
-45.61 vol pts |
CALL_SKEW |
Tail Risk
| Q10 |
Q50 |
Q90 |
Down Tail |
Up Tail |
Down/Up |
| 33.12 |
46.97 |
61.60 |
17.41 |
11.07 |
1.57 |
Daily Technicals
| EMA20 |
EMA50 |
VWAP20 |
BB Lower |
BB Mid |
BB Upper |
BB Width |
Vol Ratio |
Path |
| 50.64 |
46.48 |
51.14 |
42.63 |
51.35 |
60.07 |
33.98% |
0.74 |
Sideways / Range |
Day Plan
- 50.00-55.00 range: fade extremes
- > 55.00: chase only if hold + vol
- < 50.00: risk expand; reduce size
- Regime: TRANSITION
- Tech: Sideways / Range
Swing Plan
- Accumulate: 50.00-50.00
- Trim: 55.00-55.00
- Add: close > 55.00
- Cut: close < 50.00
- Best for: transition regime
Raw Text Summary
📌 UVXY @ 50.53 (2026-04-05 06:50 PM MYT)

• Current price is **50.53**. Key support is around **50.00**, and resistance is around **55.00**.
• For the next week, the model’s **68% expected range** is roughly **41.92 to 59.14**.
• A wider **90% range** is about **36.37 to 64.69**.
• Dealer positioning looks **LONG gamma**, so the market behavior is classified as **TRANSITION**.
• The estimated **gamma flip** is near **44.89**. Crossing and holding beyond this area can change the trading behavior.
• Approximate breakout odds: **above resistance 27.6%**, **below support 36.3%** by the target horizon.
• Options skew is tilted toward **calls**, which suggests upside speculation is relatively stronger.
• Near-term implied volatility is higher than the next expiry (**IV1 121.46% vs IV2 120.39%**), which suggests **near-term event stress / backwardation**.
• Recent volume is only **0.74x** the 20-day average, so breakouts may be less reliable unless volume improves.
• On the daily chart, the stock currently looks like **Sideways / Range**.
• The implied distribution shows **heavier downside tail risk** than upside tail potential.
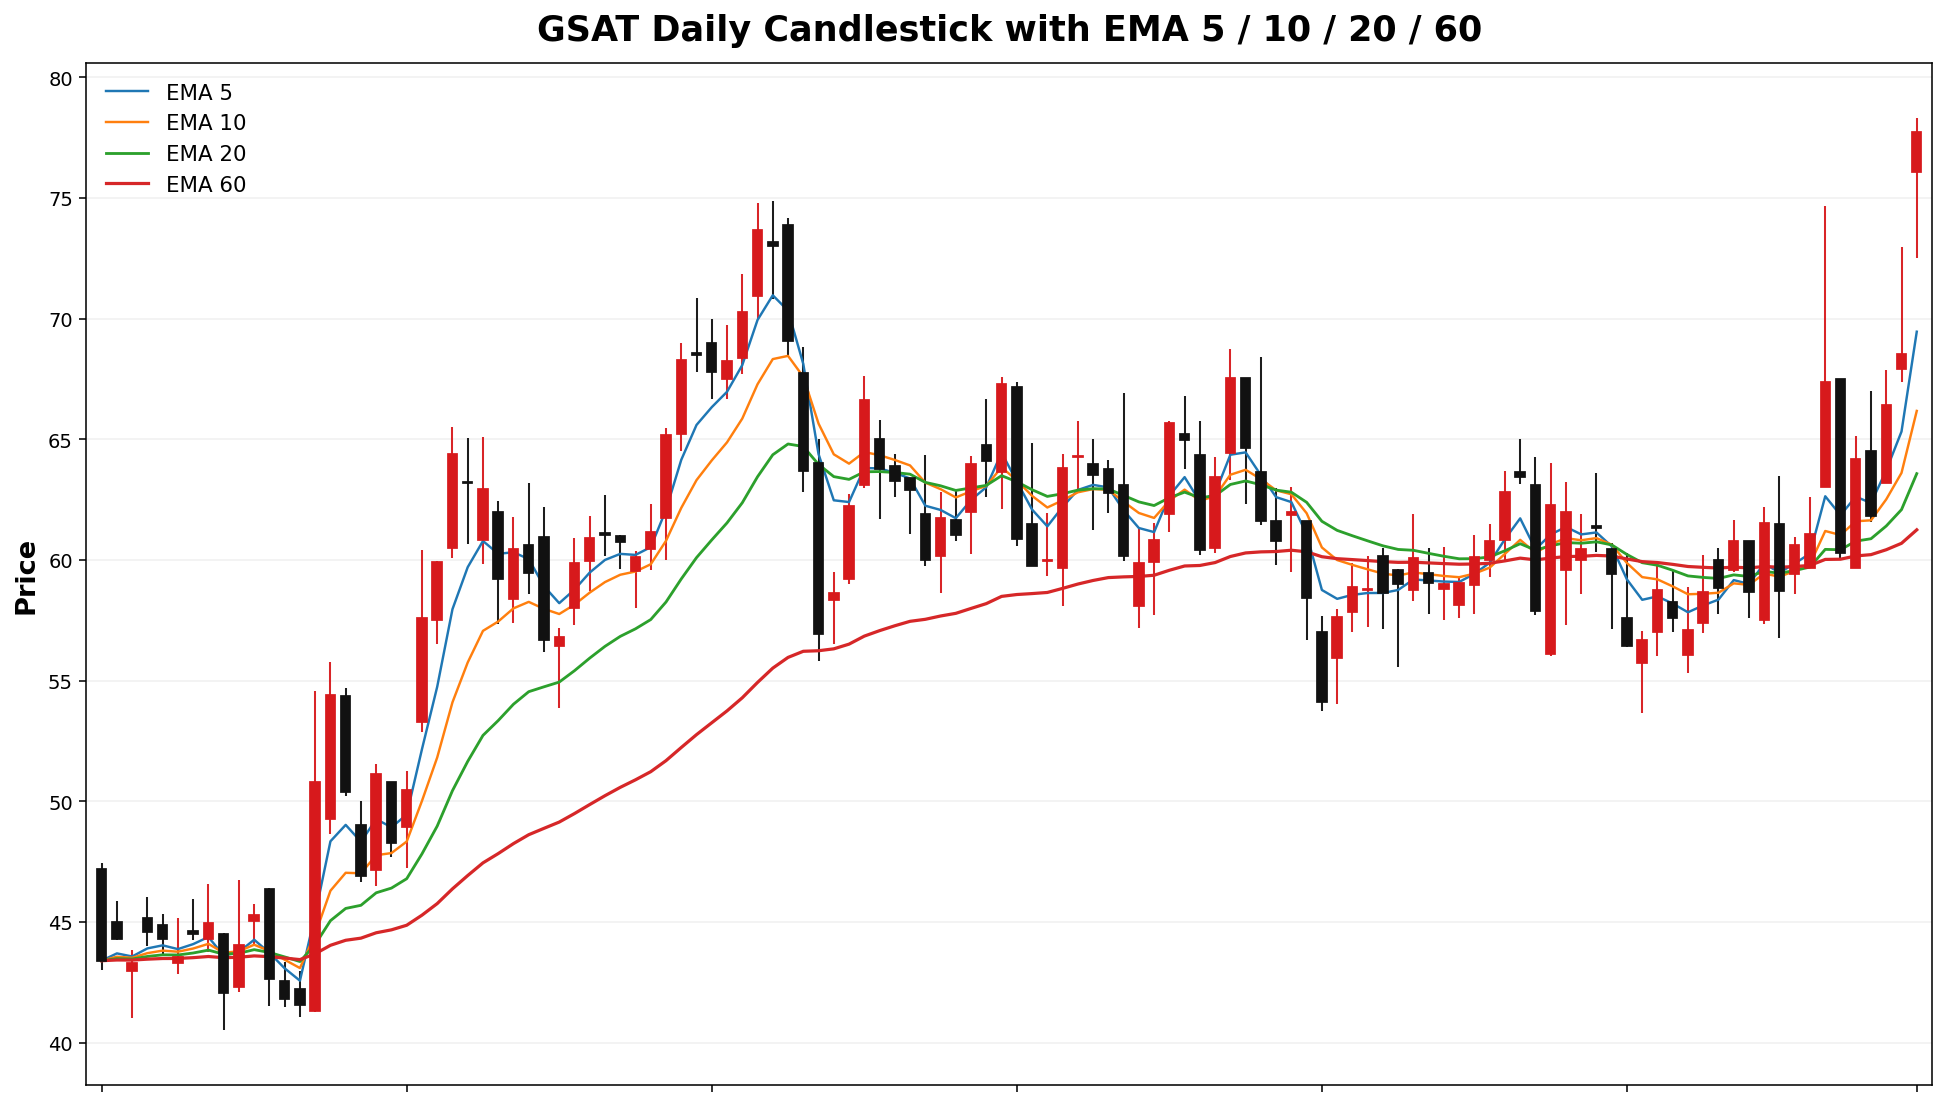
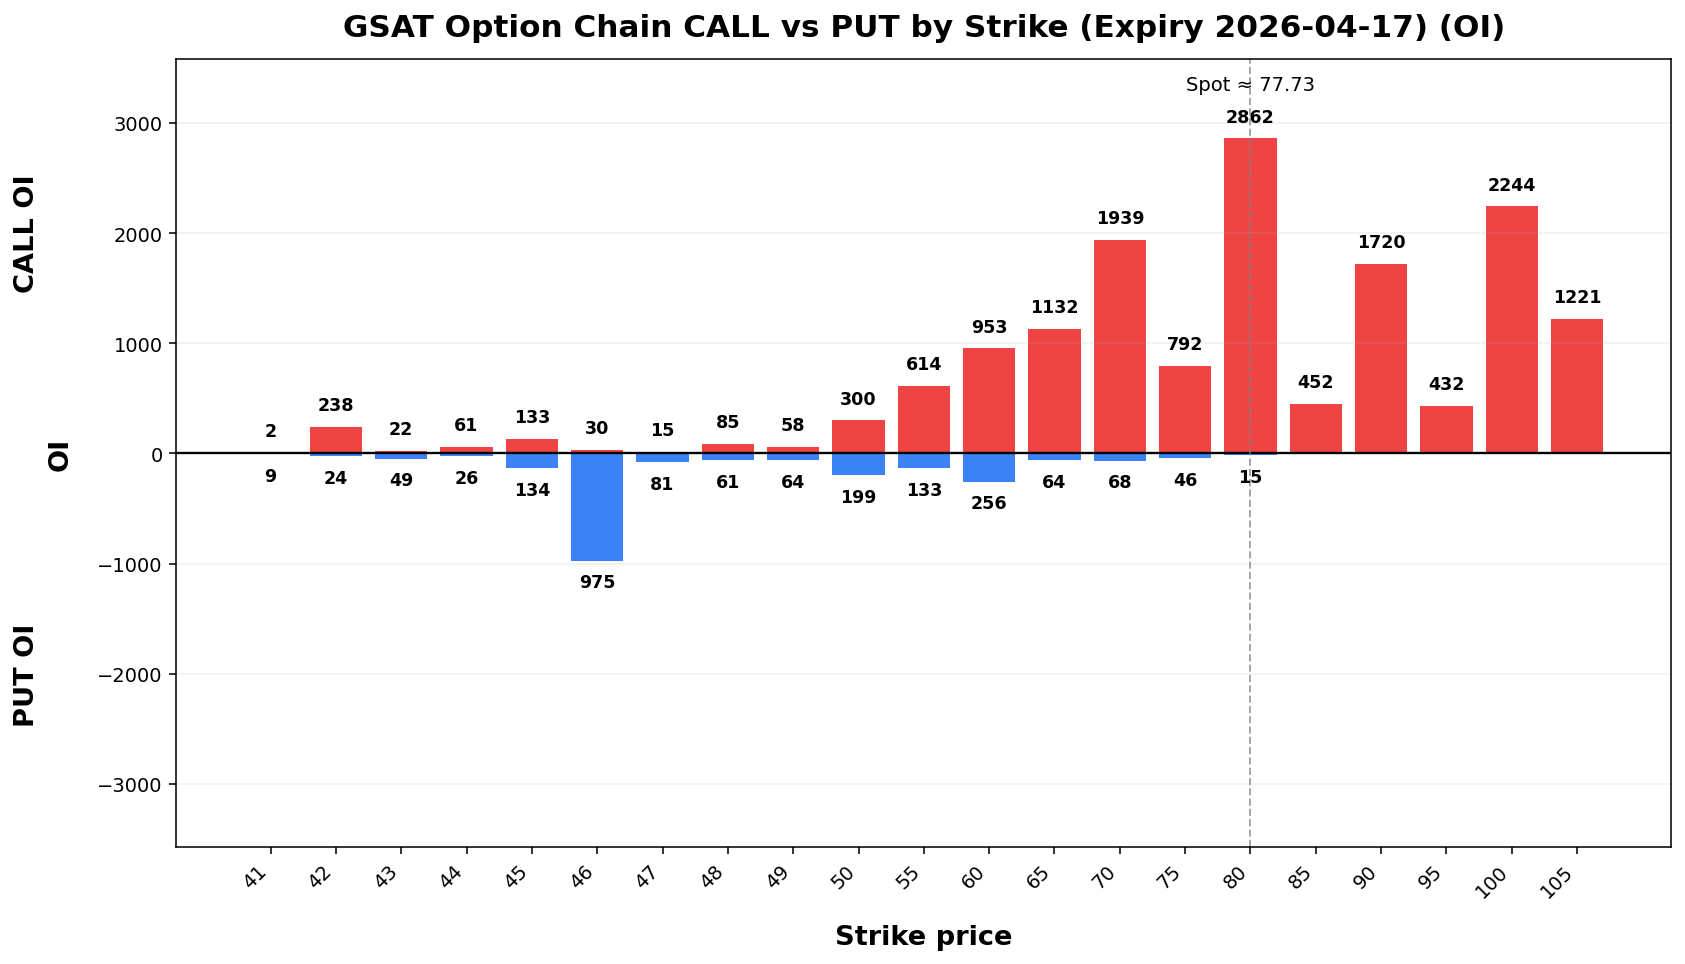
GSAT
Spot: 77.73
Report Time: 2026-04-05 06:50 PM MYT
Regime: TRANSITION
Dealer Gamma: LONG
Term Structure
| Expiry |
DTE |
Forward |
ATM IV |
ATM Straddle |
| 2026-04-17 |
13 |
77.00 |
76.16% |
10.90 |
| 2026-05-15 |
41 |
74.33 |
53.78% |
13.90 |
Weekly Range
| Confidence |
Low |
High |
Width |
| 68% |
67.47 |
87.99 |
20.51 |
| 80% |
64.59 |
90.87 |
26.28 |
| 90% |
60.86 |
94.60 |
33.74 |
| 95% |
57.63 |
97.83 |
40.20 |
Structure & Probabilities
| Support |
Resistance |
Gamma Flip |
Max Pain |
P>Res |
P<Sup |
| 70.00 |
80.00 |
52.51 |
46.00 |
41.2% |
22.5% |
Flow & Skew
| Call Vol |
Put Vol |
Vol P/C |
Call OI |
Put OI |
OI P/C |
Skew |
Skew Bias |
| 6,953 |
1,809 |
0.26 |
16,424 |
13,852 |
0.84 |
-1.71 vol pts |
CALL_SKEW |
Tail Risk
| Q10 |
Q50 |
Q90 |
Down Tail |
Up Tail |
Down/Up |
| 19.22 |
20.10 |
20.98 |
58.51 |
0.00 |
NA |
Daily Technicals
| EMA20 |
EMA50 |
VWAP20 |
BB Lower |
BB Mid |
BB Upper |
BB Width |
Vol Ratio |
Path |
| 63.57 |
61.56 |
65.60 |
51.30 |
61.59 |
71.88 |
33.43% |
4.39 |
UP trend (expanding) |
Day Plan
- 70.00-80.00 range: fade extremes
- > 80.00: chase only if hold + vol
- < 70.00: risk expand; reduce size
- Regime: TRANSITION
- Tech: UP trend (expanding)
Swing Plan
- Accumulate: 70.00-70.00
- Trim: 80.00-80.00
- Add: close > 80.00
- Cut: close < 70.00
- Best for: transition regime
Raw Text Summary
📌 GSAT @ 77.73 (2026-04-05 06:50 PM MYT)

• Current price is **77.73**. Key support is around **70.00**, and resistance is around **80.00**.
• For the next week, the model’s **68% expected range** is roughly **67.47 to 87.99**.
• A wider **90% range** is about **60.86 to 94.60**.
• Dealer positioning looks **LONG gamma**, so the market behavior is classified as **TRANSITION**.
• The estimated **gamma flip** is near **52.51**. Crossing and holding beyond this area can change the trading behavior.
• Approximate breakout odds: **above resistance 41.2%**, **below support 22.5%** by the target horizon.
• Options skew is fairly balanced, so there is **no strong directional bias** from skew alone.
• Near-term implied volatility is higher than the next expiry (**IV1 76.16% vs IV2 53.78%**), which suggests **near-term event stress / backwardation**.
• Recent volume is **4.39x** the 20-day average, which supports stronger continuation or breakout follow-through.
• On the daily chart, the stock currently looks like **UP trend (expanding)**.
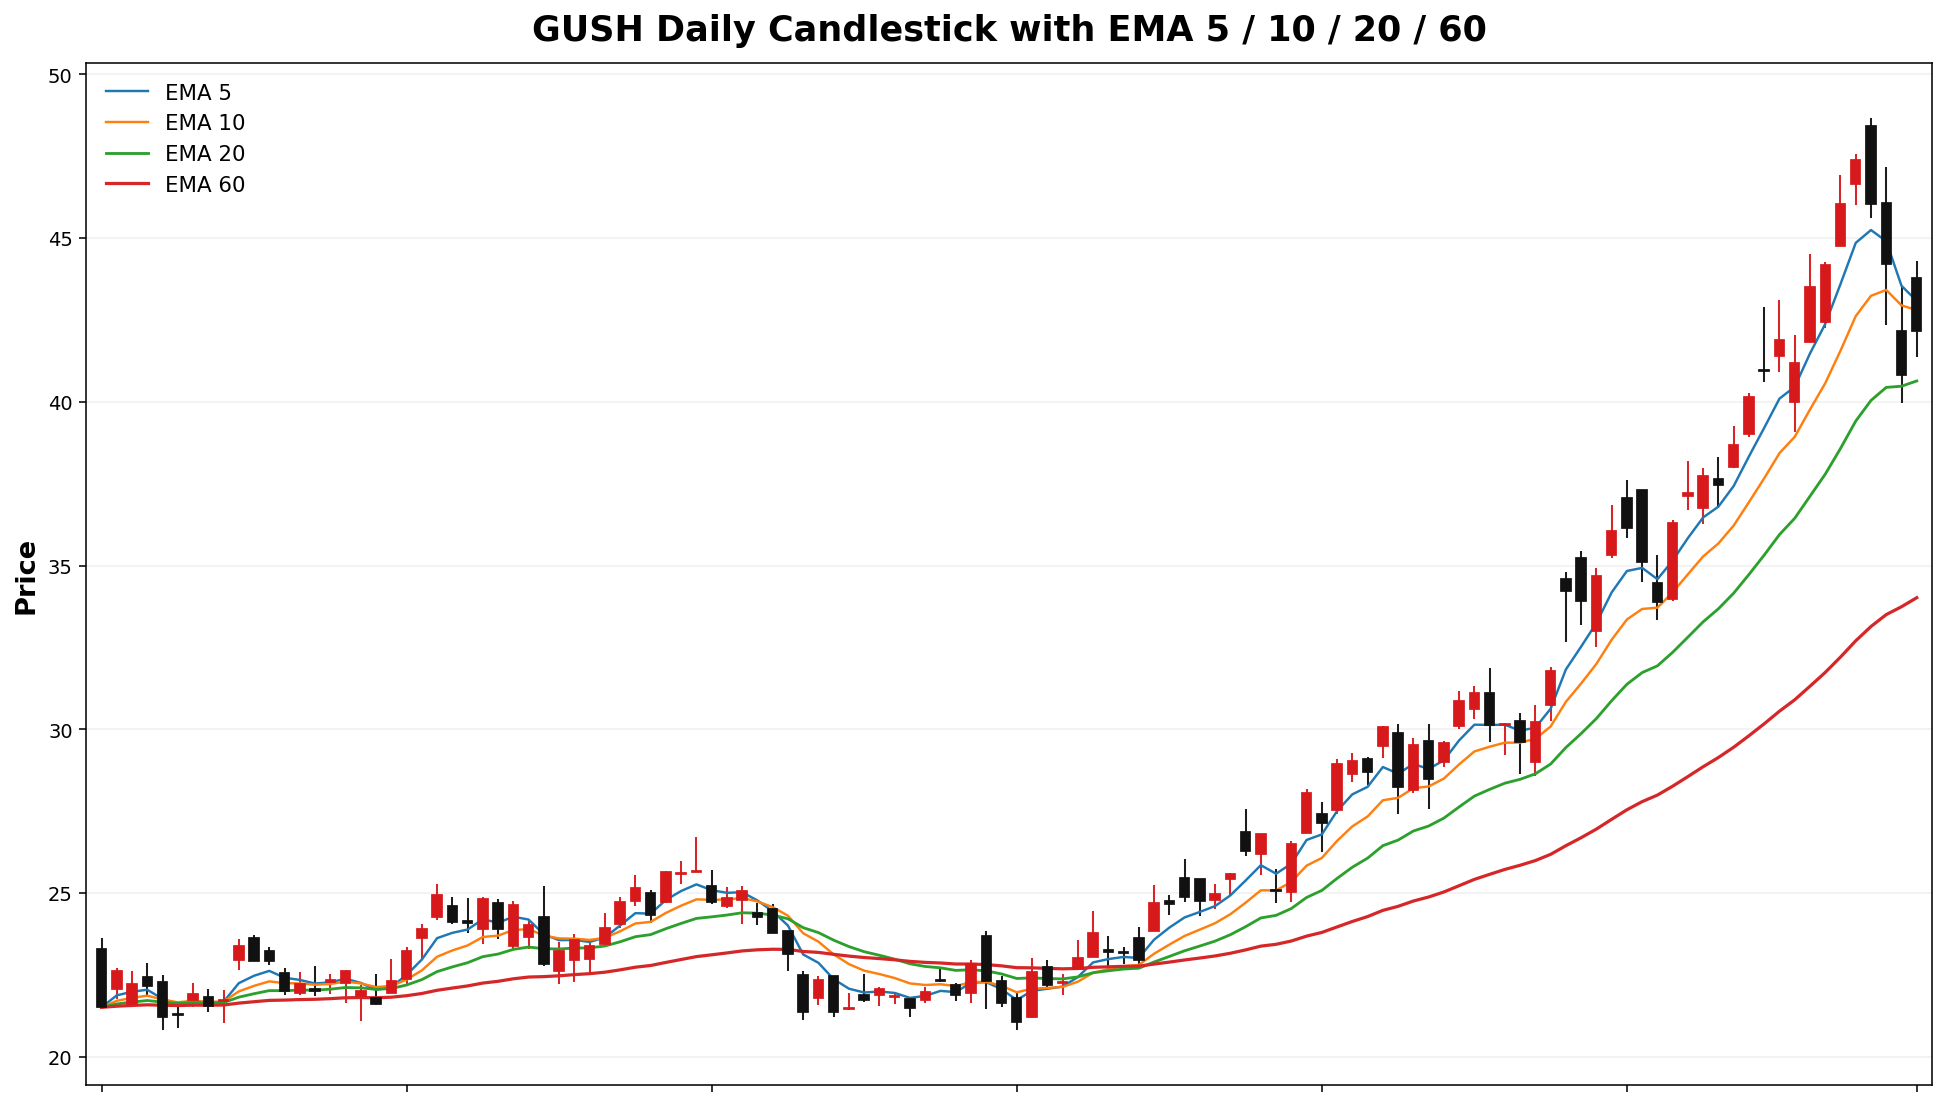
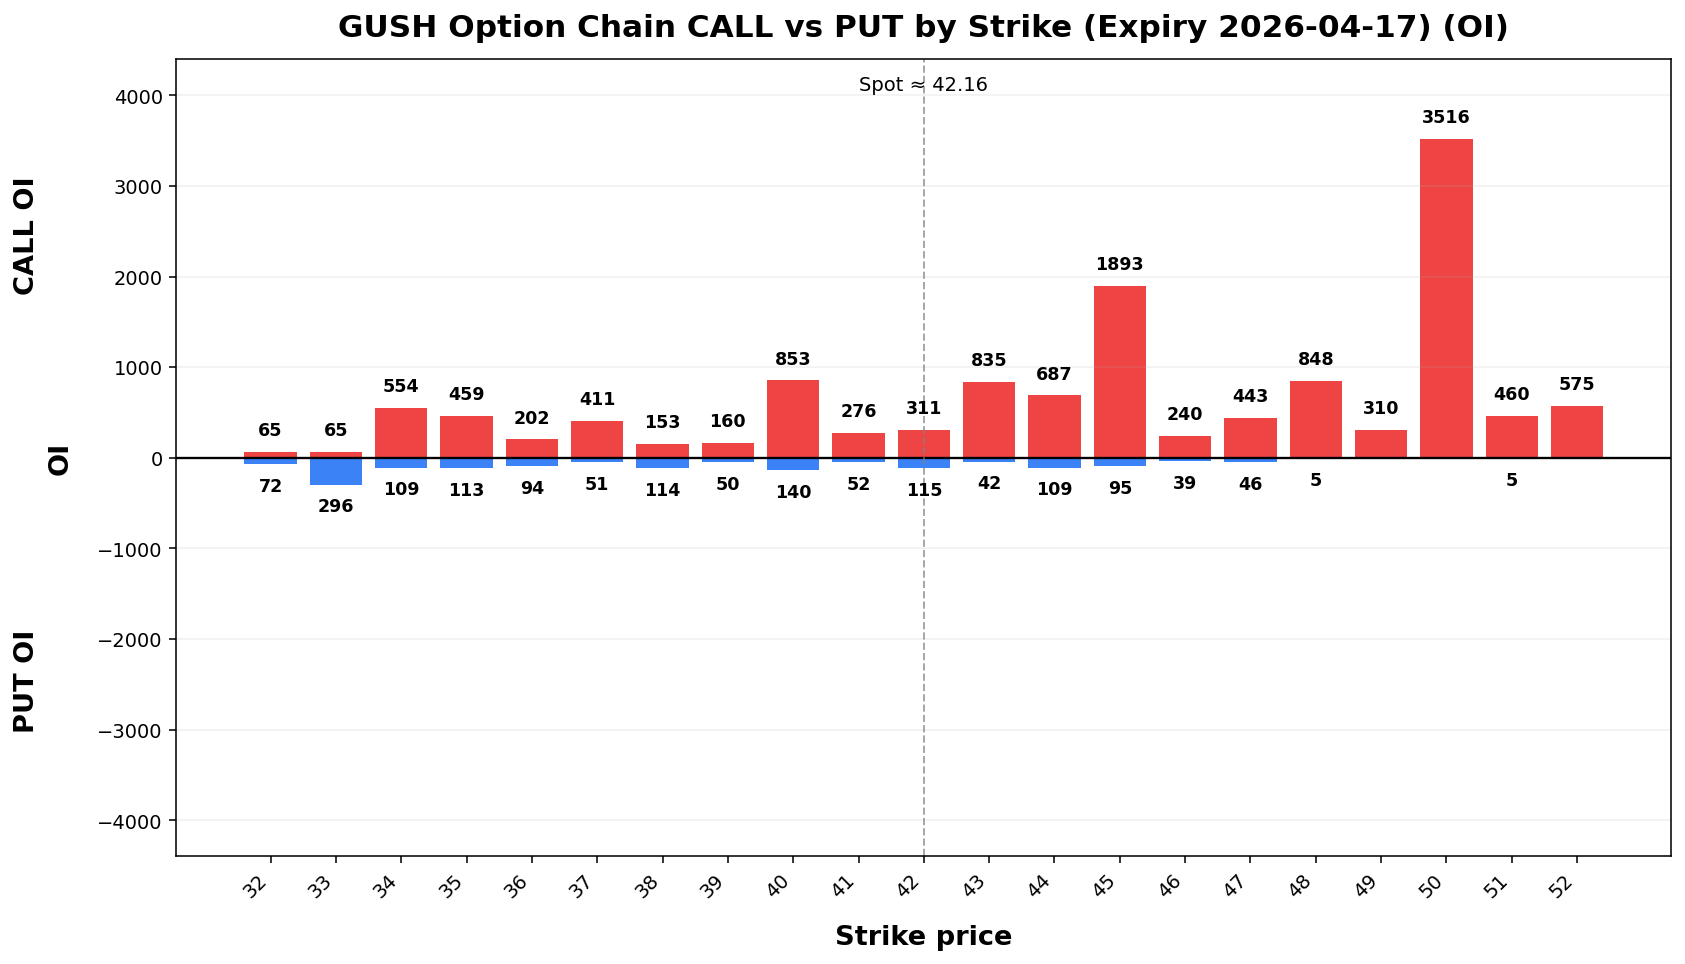
GUSH
Spot: 42.16
Report Time: 2026-04-05 06:50 PM MYT
Regime: TRANSITION
Dealer Gamma: LONG
Term Structure
| Expiry |
DTE |
Forward |
ATM IV |
ATM Straddle |
| 2026-04-17 |
13 |
41.99 |
68.28% |
5.30 |
| 2026-05-15 |
41 |
42.16 |
59.56% |
8.35 |
Weekly Range
| Confidence |
Low |
High |
Width |
| 68% |
37.64 |
46.68 |
9.05 |
| 80% |
36.36 |
47.96 |
11.59 |
| 90% |
34.72 |
49.60 |
14.88 |
| 95% |
33.30 |
51.02 |
17.73 |
Structure & Probabilities
| Support |
Resistance |
Gamma Flip |
Max Pain |
P>Res |
P<Sup |
| 40.00 |
43.00 |
NA |
34.00 |
35.0% |
31.1% |
Flow & Skew
| Call Vol |
Put Vol |
Vol P/C |
Call OI |
Put OI |
OI P/C |
Skew |
Skew Bias |
| 2,958 |
391 |
0.13 |
16,563 |
2,104 |
0.13 |
10.11 vol pts |
PUT_SKEW |
Tail Risk
| Q10 |
Q50 |
Q90 |
Down Tail |
Up Tail |
Down/Up |
| 30.22 |
41.40 |
47.82 |
11.94 |
5.66 |
2.11 |
Daily Technicals
| EMA20 |
EMA50 |
VWAP20 |
BB Lower |
BB Mid |
BB Upper |
BB Width |
Vol Ratio |
Path |
| 40.64 |
35.26 |
40.17 |
32.73 |
40.55 |
48.37 |
38.58% |
0.90 |
UP trend (expanding) |
Day Plan
- 40.00-43.00 range: fade extremes
- > 43.00: chase only if hold + vol
- < 40.00: risk expand; reduce size
- Regime: TRANSITION
- Tech: UP trend (expanding)
Swing Plan
- Accumulate: 40.00-40.00
- Trim: 43.00-43.00
- Add: close > 43.00
- Cut: close < 40.00
- Best for: transition regime
Raw Text Summary
📌 GUSH @ 42.16 (2026-04-05 06:50 PM MYT)

• Current price is **42.16**. Key support is around **40.00**, and resistance is around **43.00**.
• For the next week, the model’s **68% expected range** is roughly **37.64 to 46.68**.
• A wider **90% range** is about **34.72 to 49.60**.
• Dealer positioning looks **LONG gamma**, so the market behavior is classified as **TRANSITION**.
• Approximate breakout odds: **above resistance 35.0%**, **below support 31.1%** by the target horizon.
• Options skew is tilted toward **puts**, which suggests traders are paying more for downside protection.
• Near-term implied volatility is higher than the next expiry (**IV1 68.28% vs IV2 59.56%**), which suggests **near-term event stress / backwardation**.
• On the daily chart, the stock currently looks like **UP trend (expanding)**.
• The implied distribution shows **heavier downside tail risk** than upside tail potential.
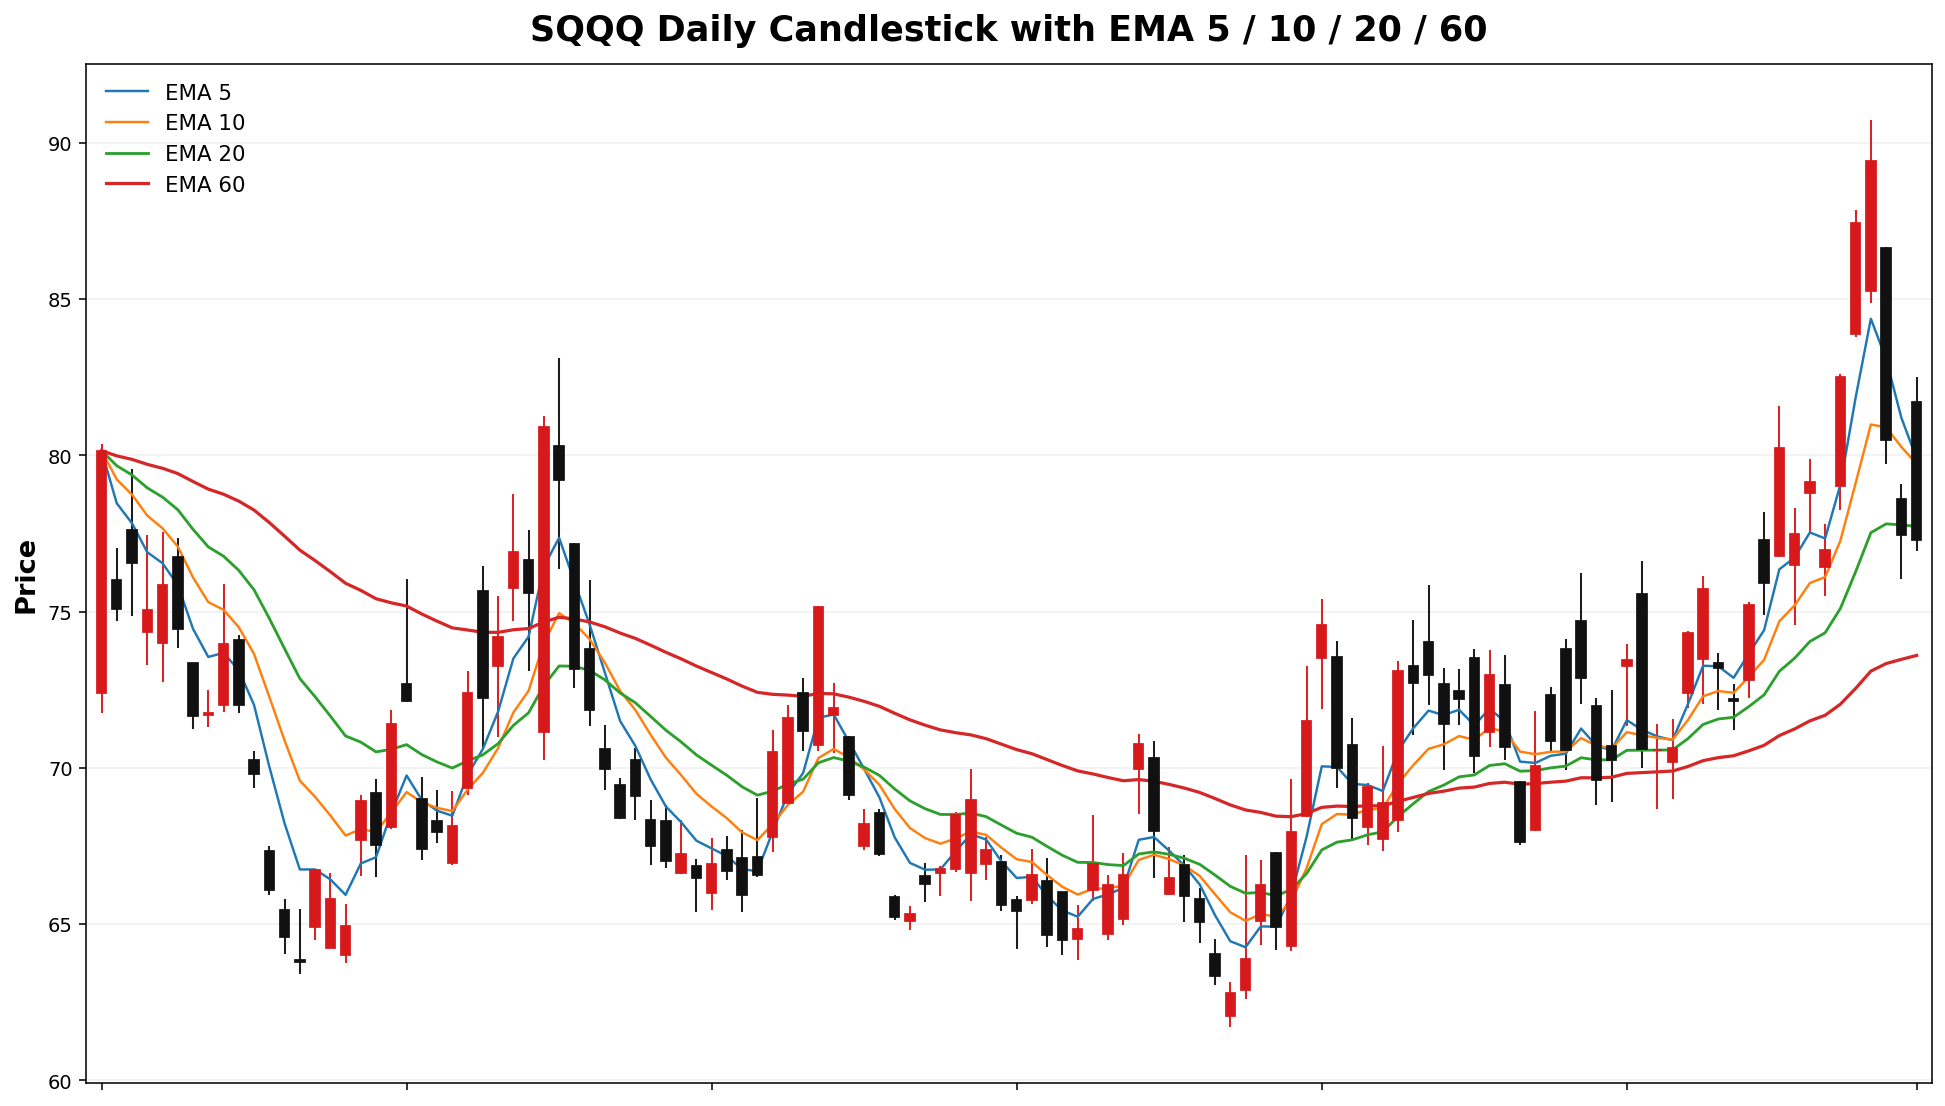
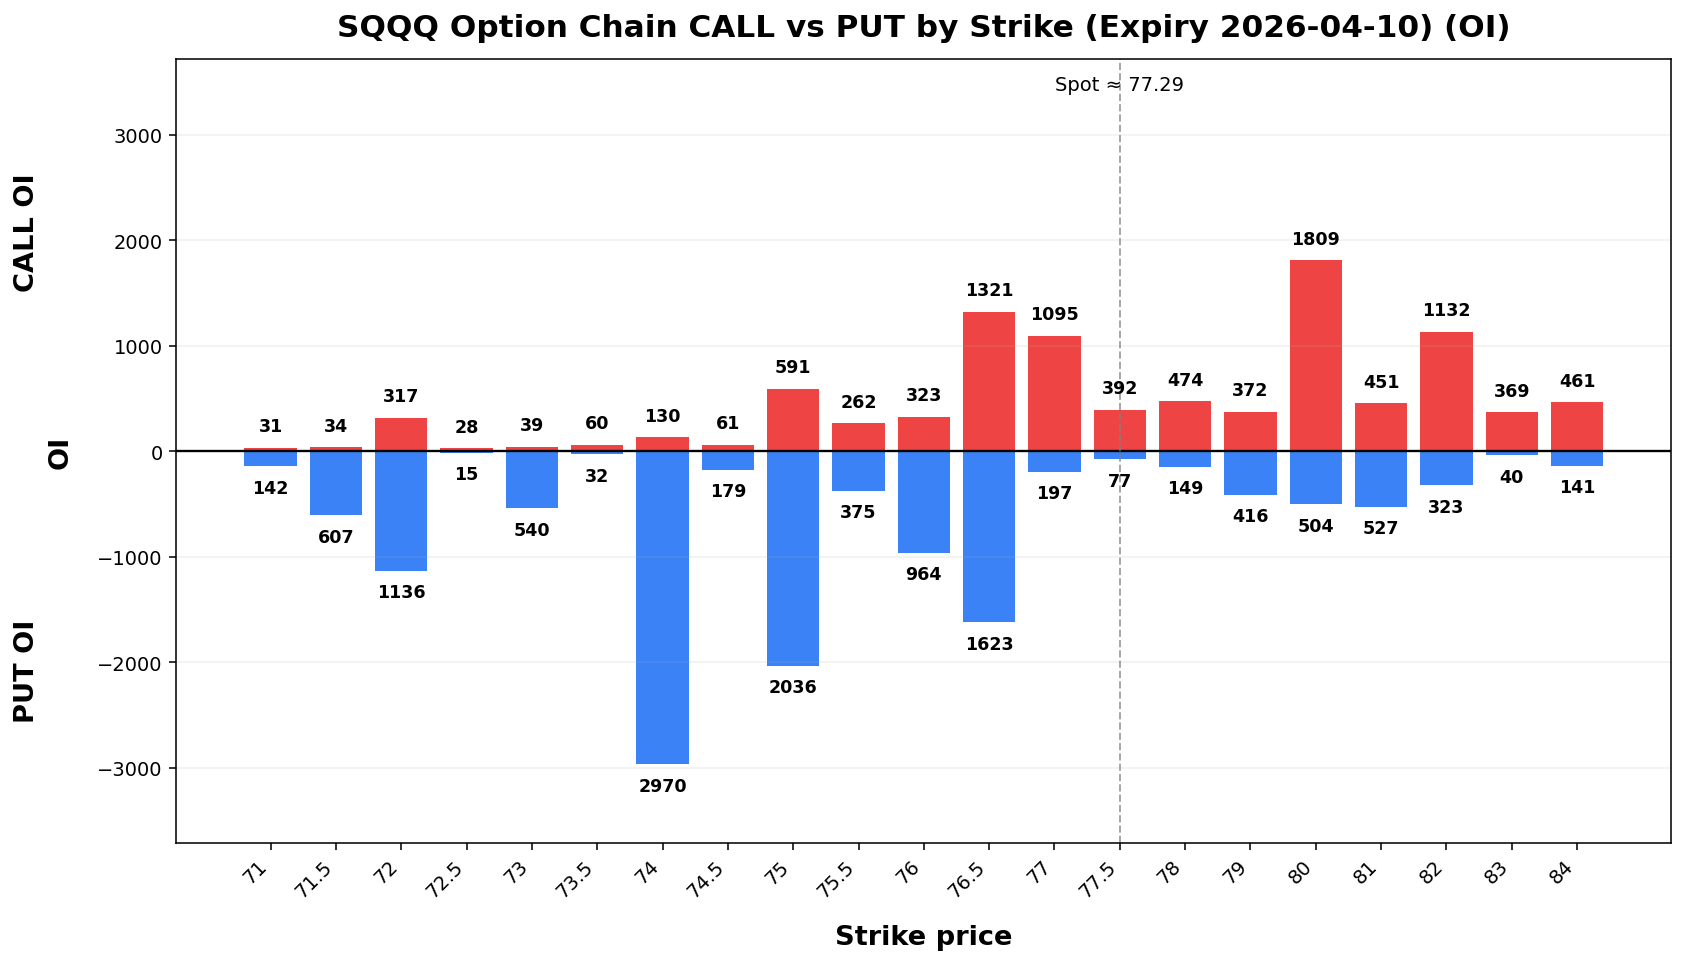
SQQQ
Spot: 77.29
Report Time: 2026-04-05 06:50 PM MYT
Regime: PIN
Dealer Gamma: LONG
Term Structure
| Expiry |
DTE |
Forward |
ATM IV |
ATM Straddle |
| 2026-04-10 |
6 |
77.52 |
66.35% |
6.22 |
| 2026-04-17 |
13 |
77.67 |
62.19% |
8.85 |
Weekly Range
| Confidence |
Low |
High |
Width |
| 68% |
70.27 |
84.31 |
14.04 |
| 80% |
68.29 |
86.29 |
18.00 |
| 90% |
65.74 |
88.84 |
23.10 |
| 95% |
63.53 |
91.05 |
27.52 |
Structure & Probabilities
| Support |
Resistance |
Gamma Flip |
Max Pain |
P>Res |
P<Sup |
| 77.00 |
80.00 |
78.00 |
76.50 |
34.3% |
39.7% |
Flow & Skew
| Call Vol |
Put Vol |
Vol P/C |
Call OI |
Put OI |
OI P/C |
Skew |
Skew Bias |
| 24,335 |
5,717 |
0.23 |
20,798 |
16,816 |
0.81 |
-24.07 vol pts |
CALL_SKEW |
Tail Risk
| Q10 |
Q50 |
Q90 |
Down Tail |
Up Tail |
Down/Up |
| 69.54 |
75.04 |
85.65 |
7.75 |
8.36 |
0.93 |
Daily Technicals
| EMA20 |
EMA50 |
VWAP20 |
BB Lower |
BB Mid |
BB Upper |
BB Width |
Vol Ratio |
Path |
| 77.73 |
74.18 |
77.04 |
66.68 |
77.01 |
87.34 |
26.83% |
1.18 |
Sideways / Range |
Day Plan
- 77.00-80.00 range: fade extremes
- > 80.00: chase only if hold + vol
- < 77.00: risk expand; reduce size
- Regime: PIN
- Tech: Sideways / Range
Swing Plan
- Accumulate: 77.00-77.00
- Trim: 80.00-80.00
- Add: close > 80.00
- Cut: close < 77.00
- Best for: pin regime
Raw Text Summary
📌 SQQQ @ 77.29 (2026-04-05 06:50 PM MYT)

• Current price is **77.29**. Key support is around **77.00**, and resistance is around **80.00**.
• For the next week, the model’s **68% expected range** is roughly **70.27 to 84.31**.
• A wider **90% range** is about **65.74 to 88.84**.
• Dealer positioning looks **LONG gamma**, so the market behavior is classified as **PIN**.
• The estimated **gamma flip** is near **78.00**. Crossing and holding beyond this area can change the trading behavior.
• Approximate breakout odds: **above resistance 34.3%**, **below support 39.7%** by the target horizon.
• Options skew is tilted toward **calls**, which suggests upside speculation is relatively stronger.
• Near-term implied volatility is higher than the next expiry (**IV1 66.35% vs IV2 62.19%**), which suggests **near-term event stress / backwardation**.
• On the daily chart, the stock currently looks like **Sideways / Range**.
• The implied distribution is **fairly balanced** between upside and downside tails.
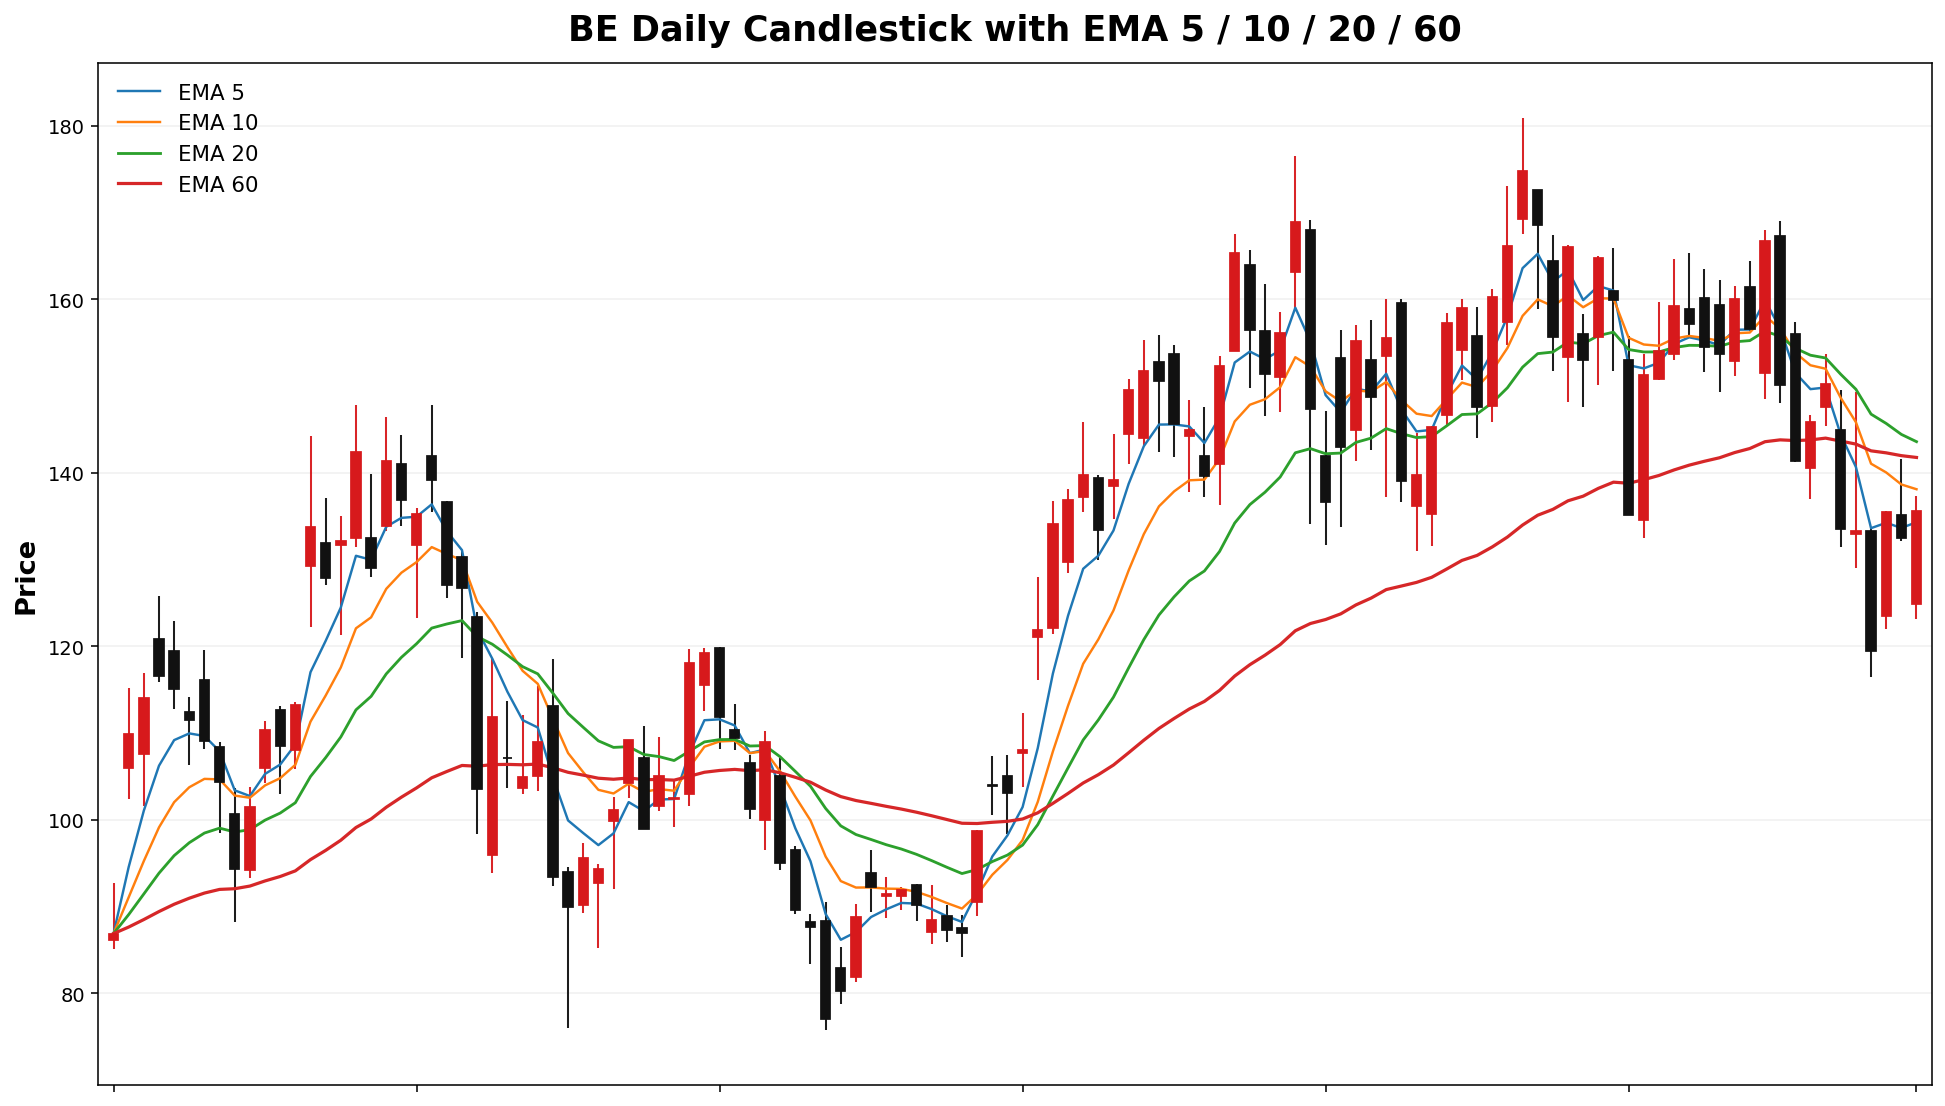
BE
Spot: 135.63
Report Time: 2026-04-05 06:50 PM MYT
Regime: TREND
Dealer Gamma: SHORT
Term Structure
| Expiry |
DTE |
Forward |
ATM IV |
ATM Straddle |
| 2026-04-10 |
6 |
135.27 |
89.60% |
14.75 |
| 2026-04-17 |
13 |
135.45 |
88.40% |
22.07 |
Weekly Range
| Confidence |
Low |
High |
Width |
| 68% |
118.62 |
152.64 |
34.03 |
| 80% |
113.83 |
157.43 |
43.61 |
| 90% |
107.65 |
163.61 |
55.97 |
| 95% |
102.28 |
168.98 |
66.69 |
Structure & Probabilities
| Support |
Resistance |
Gamma Flip |
Max Pain |
P>Res |
P<Sup |
| 135.00 |
150.00 |
141.98 |
140.00 |
20.6% |
59.9% |
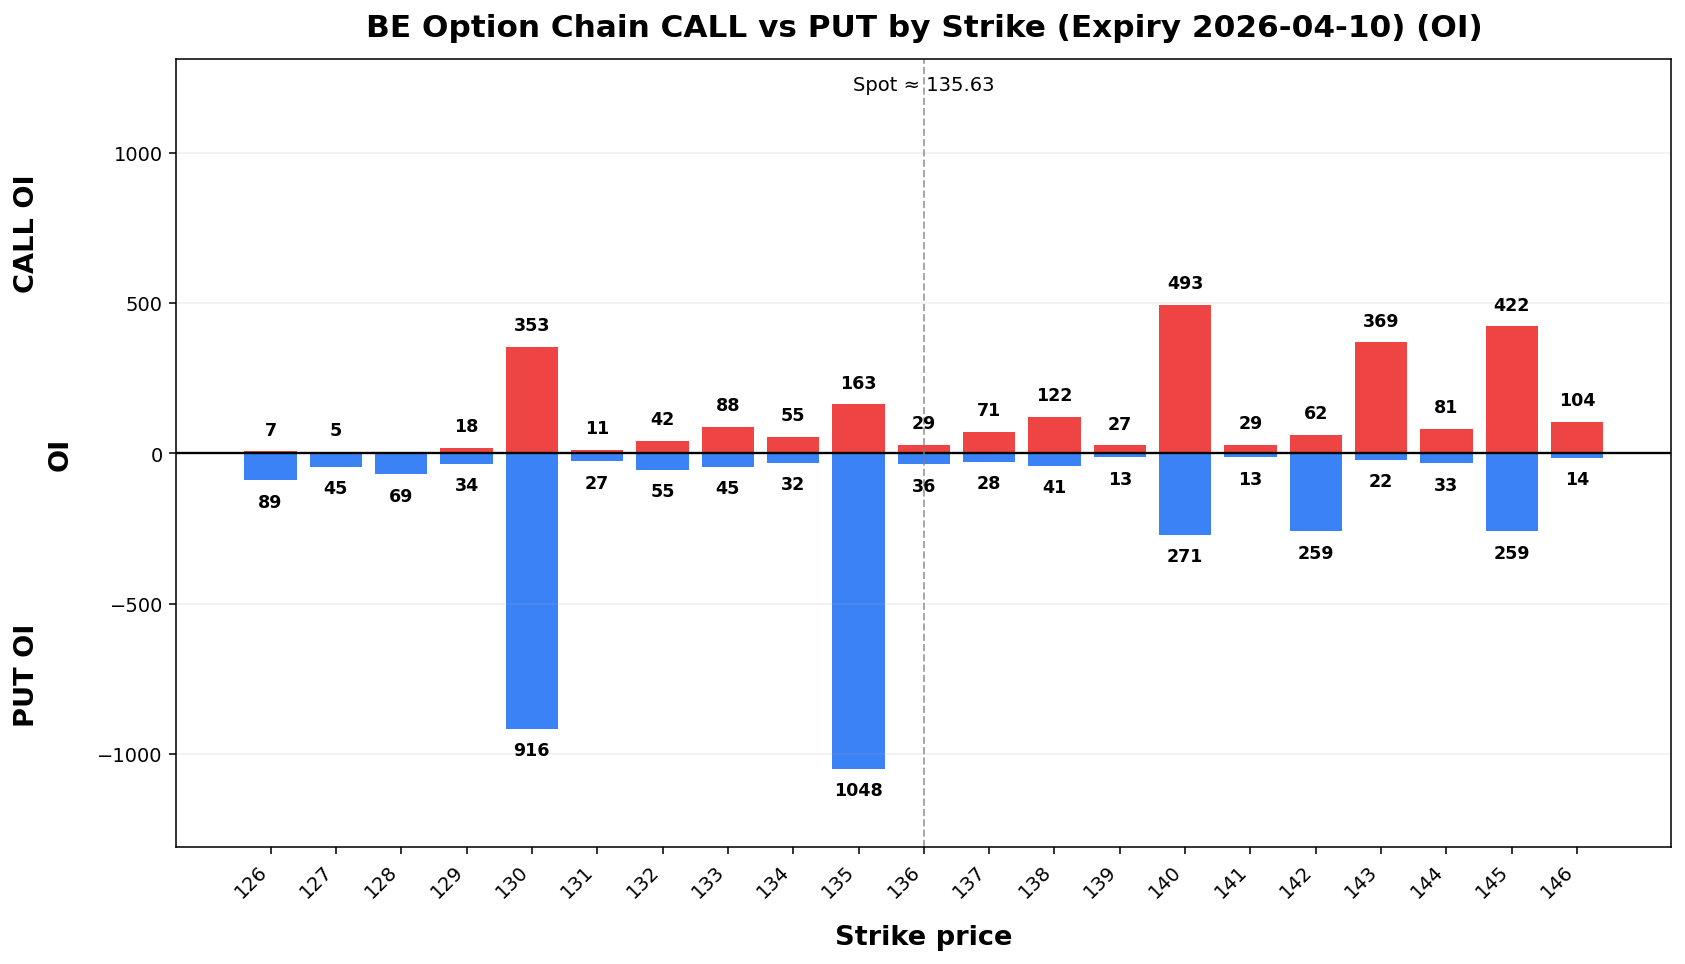
Flow & Skew
| Call Vol |
Put Vol |
Vol P/C |
Call OI |
Put OI |
OI P/C |
Skew |
Skew Bias |
| 6,463 |
4,879 |
0.75 |
9,444 |
13,383 |
1.42 |
12.45 vol pts |
PUT_SKEW |
Tail Risk
| Q10 |
Q50 |
Q90 |
Down Tail |
Up Tail |
Down/Up |
| 112.29 |
136.26 |
160.35 |
23.34 |
24.72 |
0.94 |
Daily Technicals
| EMA20 |
EMA50 |
VWAP20 |
BB Lower |
BB Mid |
BB Upper |
BB Width |
Vol Ratio |
Path |
| 143.60 |
143.45 |
146.49 |
121.78 |
146.29 |
170.80 |
33.51% |
0.54 |
Sideways / Range |
Day Plan
- 135.00-150.00 range: fade extremes
- > 150.00: chase only if hold + vol
- < 135.00: risk expand; reduce size
- Regime: TREND
- Tech: Sideways / Range
Swing Plan
- Accumulate: 135.00-135.00
- Trim: 150.00-150.00
- Add: close > 150.00
- Cut: close < 135.00
- Best for: trend regime
Raw Text Summary
📌 BE @ 135.63 (2026-04-05 06:50 PM MYT)

• Current price is **135.63**. Key support is around **135.00**, and resistance is around **150.00**.
• For the next week, the model’s **68% expected range** is roughly **118.62 to 152.64**.
• A wider **90% range** is about **107.65 to 163.61**.
• Dealer positioning looks **SHORT gamma**, so the market behavior is classified as **TREND**.
• The estimated **gamma flip** is near **141.98**. Crossing and holding beyond this area can change the trading behavior.
• Approximate breakout odds: **above resistance 20.6%**, **below support 59.9%** by the target horizon.
• Options skew is tilted toward **puts**, which suggests traders are paying more for downside protection.
• Near-term implied volatility is higher than the next expiry (**IV1 89.60% vs IV2 88.40%**), which suggests **near-term event stress / backwardation**.
• Recent volume is only **0.54x** the 20-day average, so breakouts may be less reliable unless volume improves.
• On the daily chart, the stock currently looks like **Sideways / Range**.
• The implied distribution is **fairly balanced** between upside and downside tails.
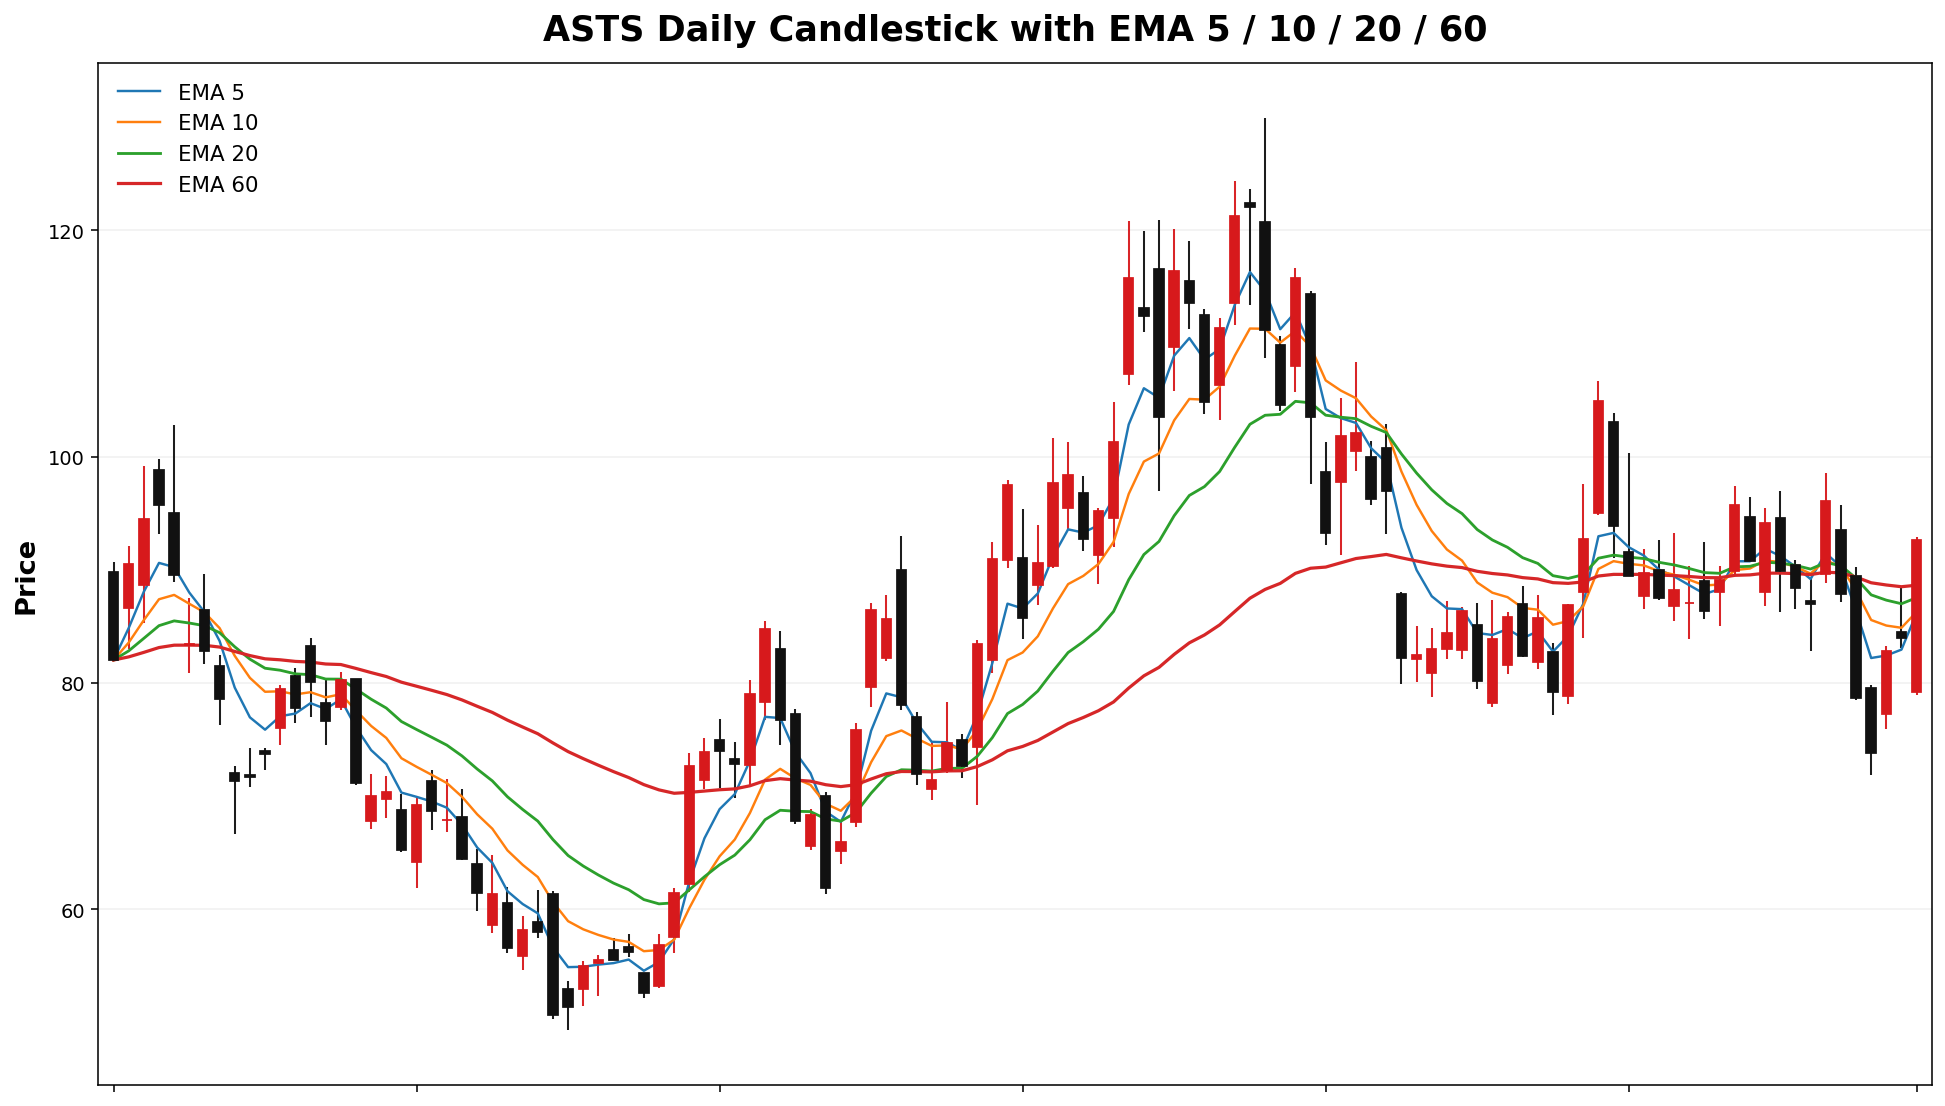
ASTS
Spot: 92.62
Report Time: 2026-04-05 06:50 PM MYT
Regime: TRANSITION
Dealer Gamma: LONG
Term Structure
| Expiry |
DTE |
Forward |
ATM IV |
ATM Straddle |
| 2026-04-10 |
6 |
92.61 |
90.32%94.07% |
10.57 |
E2 |
2026-04-17 |
13 |
92.72 |
85.94%87.52% |
14.92 |
DistributionWeekly Range
| Confidence |
Low |
High |
Width |
| 68% |
80.73 |
104.51 |
23.78 |
| 80% |
77.38 |
107.86 |
30.48 |
| 90% |
73.06 |
112.18 |
39.12 |
| 95% |
69.31 |
115.93 |
46.61 |
Structure & Probabilities
| Support |
Resistance |
Gamma Flip |
Max Pain |
P>Res |
P<Sup |
| 90.00 |
93.00 |
78.42 |
88.00 |
40.0% |
40.5% |
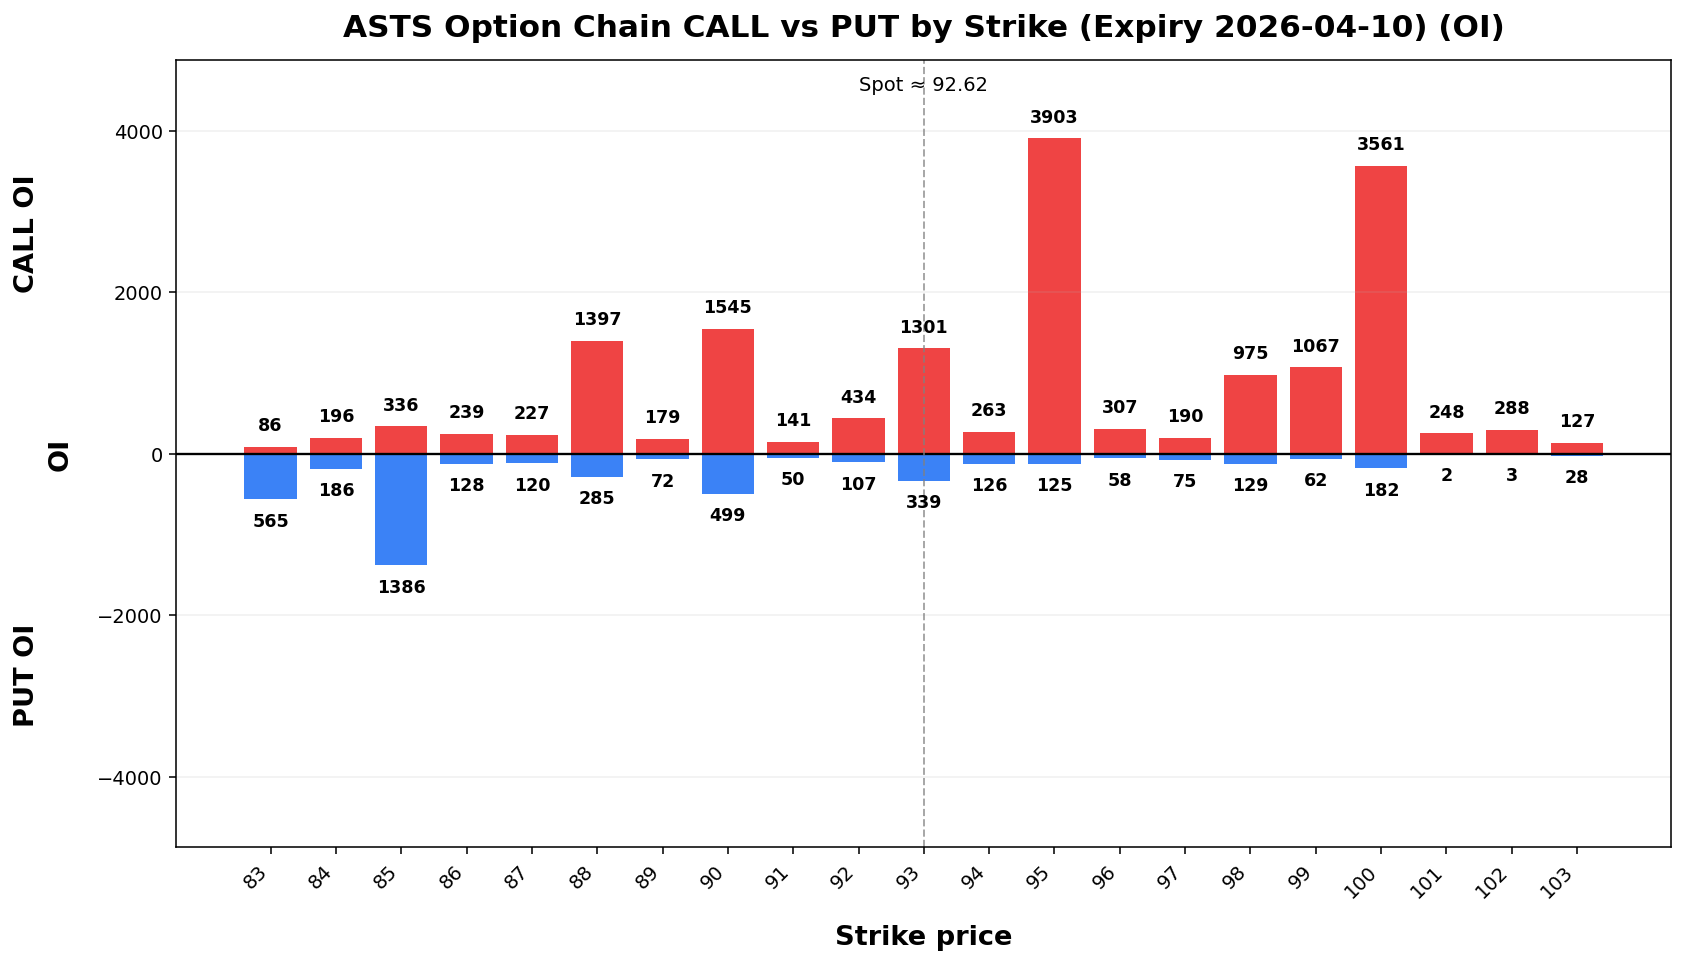
Flow & Skew
| Call Vol |
Put Vol |
Vol P/C |
Call OI |
Put OI |
OI P/C |
Skew |
Skew Bias |
| 21,065 |
11,496 |
0.55 |
25,103 |
14,550 |
0.58 |
4.20 vol pts |
PUT_SKEW |
Tail Risk
| Q10 |
MedianQ50 |
Q90 |
Down Tail Asymmetry |
SkewUp (25ΔP-25ΔC)Tail |
Down/Up |
| 78.27 |
92.12 |
110.86 |
0.7914.35 |
5.1818.24 |
volpts0.79 |
ExecutiveDaily SummaryTechnicals
| EMA20 |
EMA50 |
VWAP20 |
BB Lower |
BB Mid |
BB Upper |
BB Width |
Vol Ratio |
Path |
| 87.54 |
88.64 |
88.26 |
77.34 |
87.96 |
98.59 |
24.15% |
1.36 |
Sideways / Range |
Day Plan
这周大概率在 81.0–104.2 区间来回走。
极端情况下可能到 73.6 或 111.7 附近。
85 是关键支撑(收盘跌破,下行风险会变大)。
95 是关键压力(收盘站上去才算转强)。
目前在分界线(约 85.90)上方;跌破它会更危险。
市场更倾向突破压力,而不是跌破支撑。
Trade Plans
Day Trade Plan
90-9590.00-93.00 range: fade extremes- >
95:93.00: chase only if hold + vol
- <
85:90.00: risk expand; reduce size
- Regime: TRANSITION
- Tech: Sideways / Range
Swing Trade Plan
- Accumulate:
85-9090.00-90.00
- Trim:
94.5-9593.00-93.00
- Add: close >
9593.00
- Cut: close <
8590.00
- Best for: transition regime
3.Raw RKLB
Text Summary
Quick📌 Take:
ASTS 这周大概率在@ 60.2–75.392.62 区间来回走。
Snapshot
Item |
Value |
|---|
Spot |
67.73 |
Report Time |
(2026-04-05 08:0006:50 AMPM MYT | MYT)
• Current Executionprice Regime | is LONG_GAMMA_PIN | **92.62**.
Key support is around **90.00**, and resistance is around **93.00**.
• For the next week, the model’s **68% expected range** is roughly **80.73 to 104.51**.
• A wider **90% range** is about **73.06 to 112.18**.
• Dealer Gamma | positioning looks **LONG |
gamma**, so Trendthe Path | market DOWNbehavior trendis classified as **TRANSITION**.
• The estimated **gamma flip** is near **78.42**. Crossing and holding beyond this area can change the trading behavior.
• Approximate breakout odds: **above resistance 40.0%**, **below support 40.5%** by the target horizon.
• Options skew is tilted toward **puts**, which suggests traders are paying more for downside protection.
• Near-term implied volatility is higher than the next expiry (expanding) | **IV1
94.07% vs
IV2 Trading87.52%**), Map
which suggests **near-term event Zone |
Levelstress / Range | backwardation**.
Note | •
On the daily chart, Weeklythe 68% | stock 60.17currently –looks 75.29 | like 1σ**Sideways move/ 7.56 | Range**.
• The Weeklyimplied 90% | distribution 55.29shows –**more 80.17 | upside widertail riskpotential** band | than
Support |
60.00 |
downside defense | tail
risk.
Resistance |
70.00 | SATS
upsideSpot: supply | 128.68
Report Time: Gamma2026-04-05 Flip | 06:51 64.21 | PM regimeMYT
pivot | Regime:
TRANSITION
Dealer MaxGamma: Pain | LONG
NA | 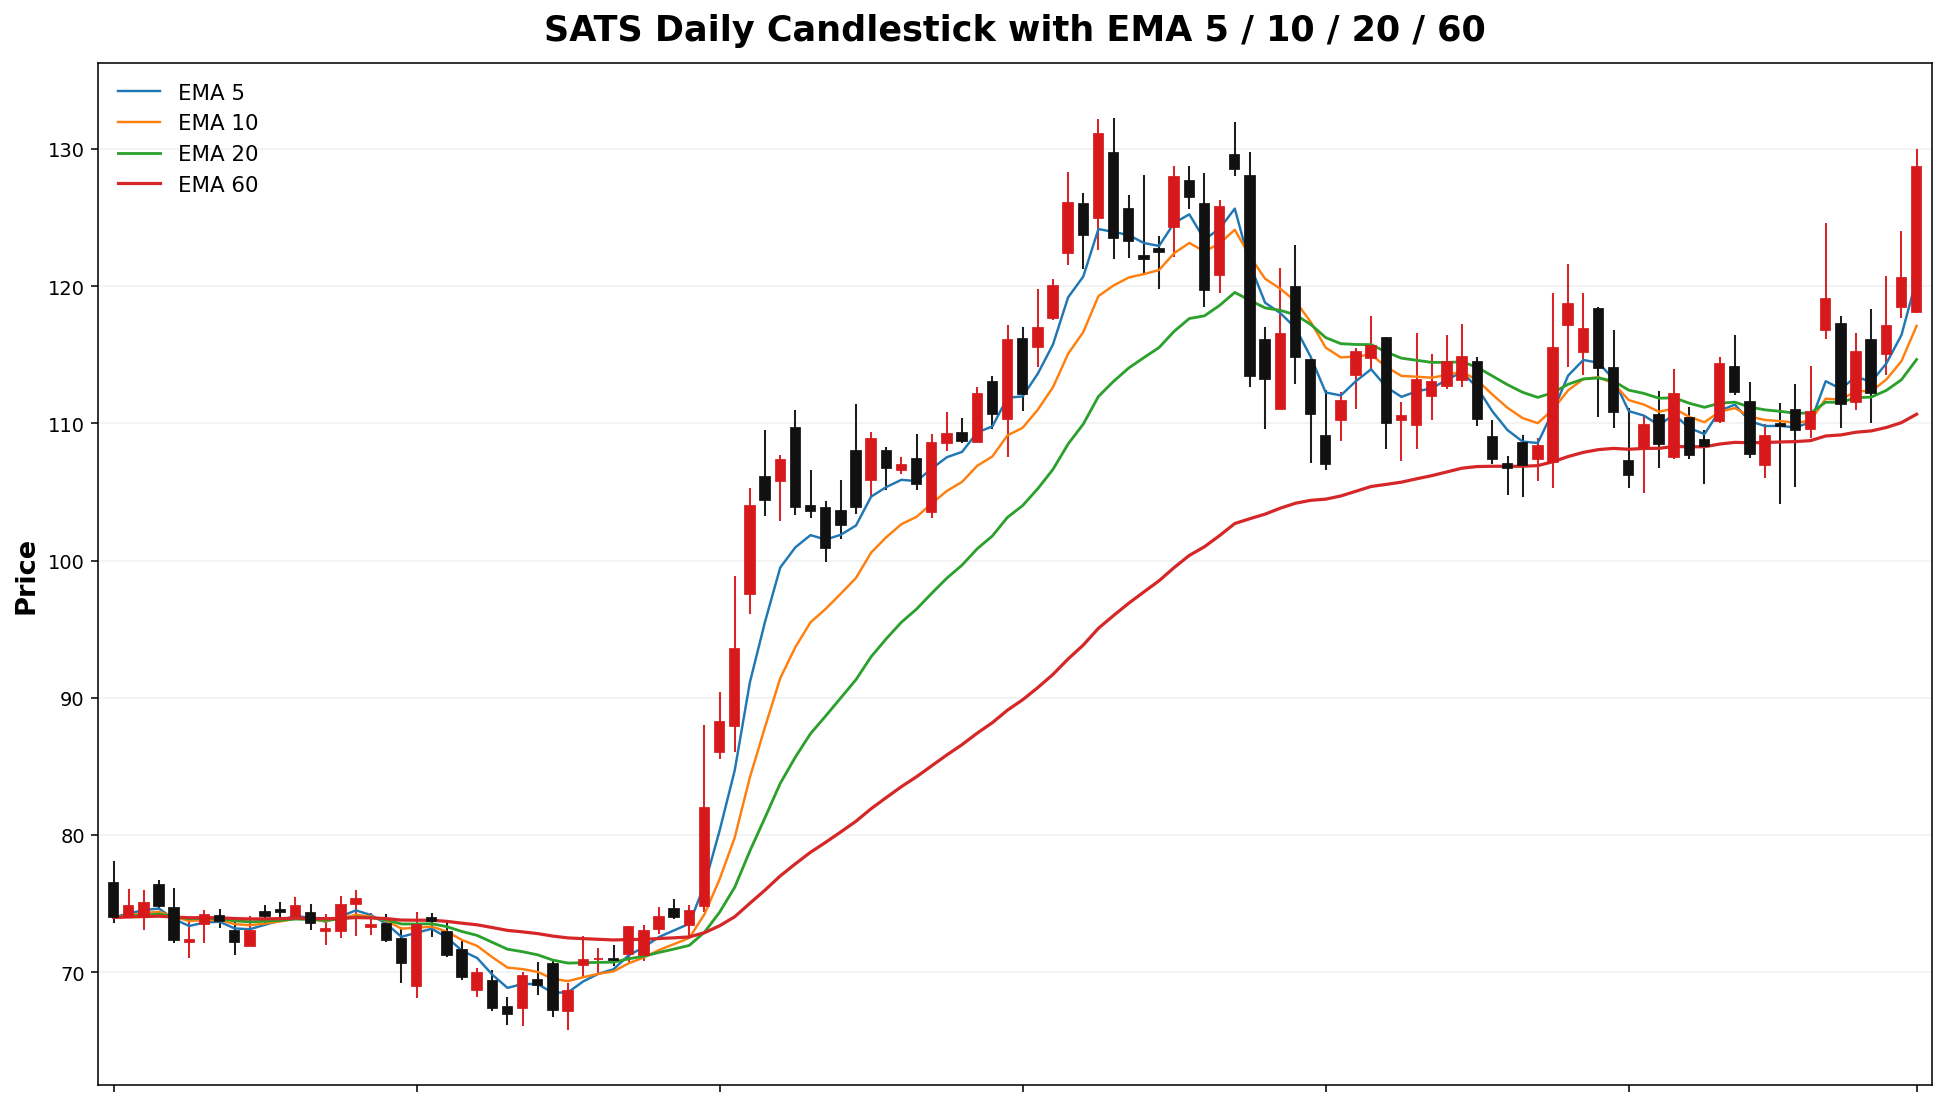
pin magnet |
Options & Probability Dashboard
Metric |
Value |
Interpretation |
|---|
Breakout Up |
29.3% |
close above upper band |
Breakout Down |
13.8% |
close below lower band |
Put/Call Volume |
0.52 |
directional flow |
Put/Call OI |
0.55 |
positioning bias |
Total Option Volume |
31,749 |
nearest expiry |
Total Open Interest |
40,436 |
nearest expiry |
Term Structure
Leg |
Expiry |
DTE |
Forward |
ATM IV |
ATM Straddle |
|---|
E12026-04-10 |
6 |
129.06 |
66.91% |
10.45 |
| 2026-04-17 |
13 |
127.98 |
59.51% |
14.10 |
Weekly Range
| Confidence |
Low |
High |
Width |
| 68% |
117.14 |
140.22 |
23.07 |
| 80% |
113.90 |
143.46 |
29.57 |
| 90% |
109.70 |
147.66 |
37.95 |
| 95% |
106.07 |
151.29 |
45.22 |
Structure & Probabilities
| Support |
Resistance |
Gamma Flip |
Max Pain |
P>Res |
P<Sup |
| 125.00 |
130.00 |
107.33 |
111.00 |
40.6% |
33.5% |
Flow & Skew
| Call Vol |
Put Vol |
Vol P/C |
Call OI |
Put OI |
OI P/C |
Skew |
Skew Bias |
| 5,317 |
839 |
0.16 |
1,963 |
2,116 |
1.08 |
-0.46 vol pts |
FLAT |
Tail Risk
| Q10 |
Q50 |
Q90 |
Down Tail |
Up Tail |
Down/Up |
| 113.43 |
124.81 |
150.38 |
15.25 |
21.70 |
0.70 |
Daily Technicals
| EMA20 |
EMA50 |
VWAP20 |
BB Lower |
BB Mid |
BB Upper |
BB Width |
Vol Ratio |
Path |
| 114.66 |
111.80 |
112.62 |
101.69 |
112.54 |
123.38 |
19.27% |
1.22 |
UP trend (expanding) |
Day Plan
- 125.00-130.00 range: fade extremes
- > 130.00: chase only if hold + vol
- < 125.00: risk expand; reduce size
- Regime: TRANSITION
- Tech: UP trend (expanding)
Swing Plan
- Accumulate: 125.00-125.00
- Trim: 130.00-130.00
- Add: close > 130.00
- Cut: close < 125.00
- Best for: transition regime
Raw Text Summary
📌 SATS @ 128.68 (2026-04-05 06:51 PM MYT)

• Current price is **128.68**. Key support is around **125.00**, and resistance is around **130.00**.
• For the next week, the model’s **68% expected range** is roughly **117.14 to 140.22**.
• A wider **90% range** is about **109.70 to 147.66**.
• Dealer positioning looks **LONG gamma**, so the market behavior is classified as **TRANSITION**.
• The estimated **gamma flip** is near **107.33**. Crossing and holding beyond this area can change the trading behavior.
• Approximate breakout odds: **above resistance 40.6%**, **below support 33.5%** by the target horizon.
• Options skew is fairly balanced, so there is **no strong directional bias** from skew alone.
• Near-term implied volatility is higher than the next expiry (**IV1 66.91% vs IV2 59.51%**), which suggests **near-term event stress / backwardation**.
• On the daily chart, the stock currently looks like **UP trend (expanding)**.
• The implied distribution shows **more upside tail potential** than downside tail risk.
BKSY
Spot: 30.81
Report Time: 2026-04-05 06:51 PM MYT
Regime: TRANSITION
Dealer Gamma: LONG
Term Structure
| Expiry |
DTE |
Forward |
ATM IV |
ATM Straddle |
| 2026-04-17 |
13 |
30.52 |
104.01% |
5.90 |
| 2026-05-15 |
41 |
30.02 |
101.03% |
10.35 |
Weekly Range
| Confidence |
Low |
High |
Width |
| 68% |
26.17 |
35.45 |
9.28 |
| 80% |
24.86 |
36.76 |
11.90 |
| 90% |
23.17 |
38.45 |
15.27 |
| 95% |
21.71 |
39.91 |
18.20 |
Structure & Probabilities
| Support |
Resistance |
Gamma Flip |
Max Pain |
P>Res |
P<Sup |
| 30.00 |
35.00 |
16.56 |
25.00 |
16.9% |
47.4% |
Flow & Skew
| Call Vol |
Put Vol |
Vol P/C |
Call OI |
Put OI |
OI P/C |
Skew |
Skew Bias |
| 1,020 |
502 |
0.49 |
7,378 |
1,882 |
0.26 |
5.27 vol pts |
PUT_SKEW |
Tail Risk
| Q10 |
Q50 |
Q90 |
Down Tail |
Up Tail |
Down/Up |
| 15.84 |
23.80 |
32.36 |
14.97 |
1.55 |
9.68 |
Daily Technicals
| EMA20 |
EMA50 |
VWAP20 |
BB Lower |
BB Mid |
BB Upper |
BB Width |
Vol Ratio |
Path |
| 25.45 |
24.01 |
26.01 |
21.23 |
25.42 |
29.61 |
32.96% |
2.44 |
UP trend (expanding) |
Day Plan
- 30.00-35.00 range: fade extremes
- > 35.00: chase only if hold + vol
- < 30.00: risk expand; reduce size
- Regime: TRANSITION
- Tech: UP trend (expanding)
Swing Plan
- Accumulate: 30.00-30.00
- Trim: 35.00-35.00
- Add: close > 35.00
- Cut: close < 30.00
- Best for: transition regime
Raw Text Summary
📌 BKSY @ 30.81 (2026-04-05 06:51 PM MYT)

• Current price is **30.81**. Key support is around **30.00**, and resistance is around **35.00**.
• For the next week, the model’s **68% expected range** is roughly **26.17 to 35.45**.
• A wider **90% range** is about **23.17 to 38.45**.
• Dealer positioning looks **LONG gamma**, so the market behavior is classified as **TRANSITION**.
• The estimated **gamma flip** is near **16.56**. Crossing and holding beyond this area can change the trading behavior.
• Approximate breakout odds: **above resistance 16.9%**, **below support 47.4%** by the target horizon.
• Options skew is tilted toward **puts**, which suggests traders are paying more for downside protection.
• Near-term implied volatility is higher than the next expiry (**IV1 104.01% vs IV2 101.03%**), which suggests **near-term event stress / backwardation**.
• Recent volume is **2.44x** the 20-day average, which supports stronger continuation or breakout follow-through.
• On the daily chart, the stock currently looks like **UP trend (expanding)**.
• The implied distribution shows **heavier downside tail risk** than upside tail potential.
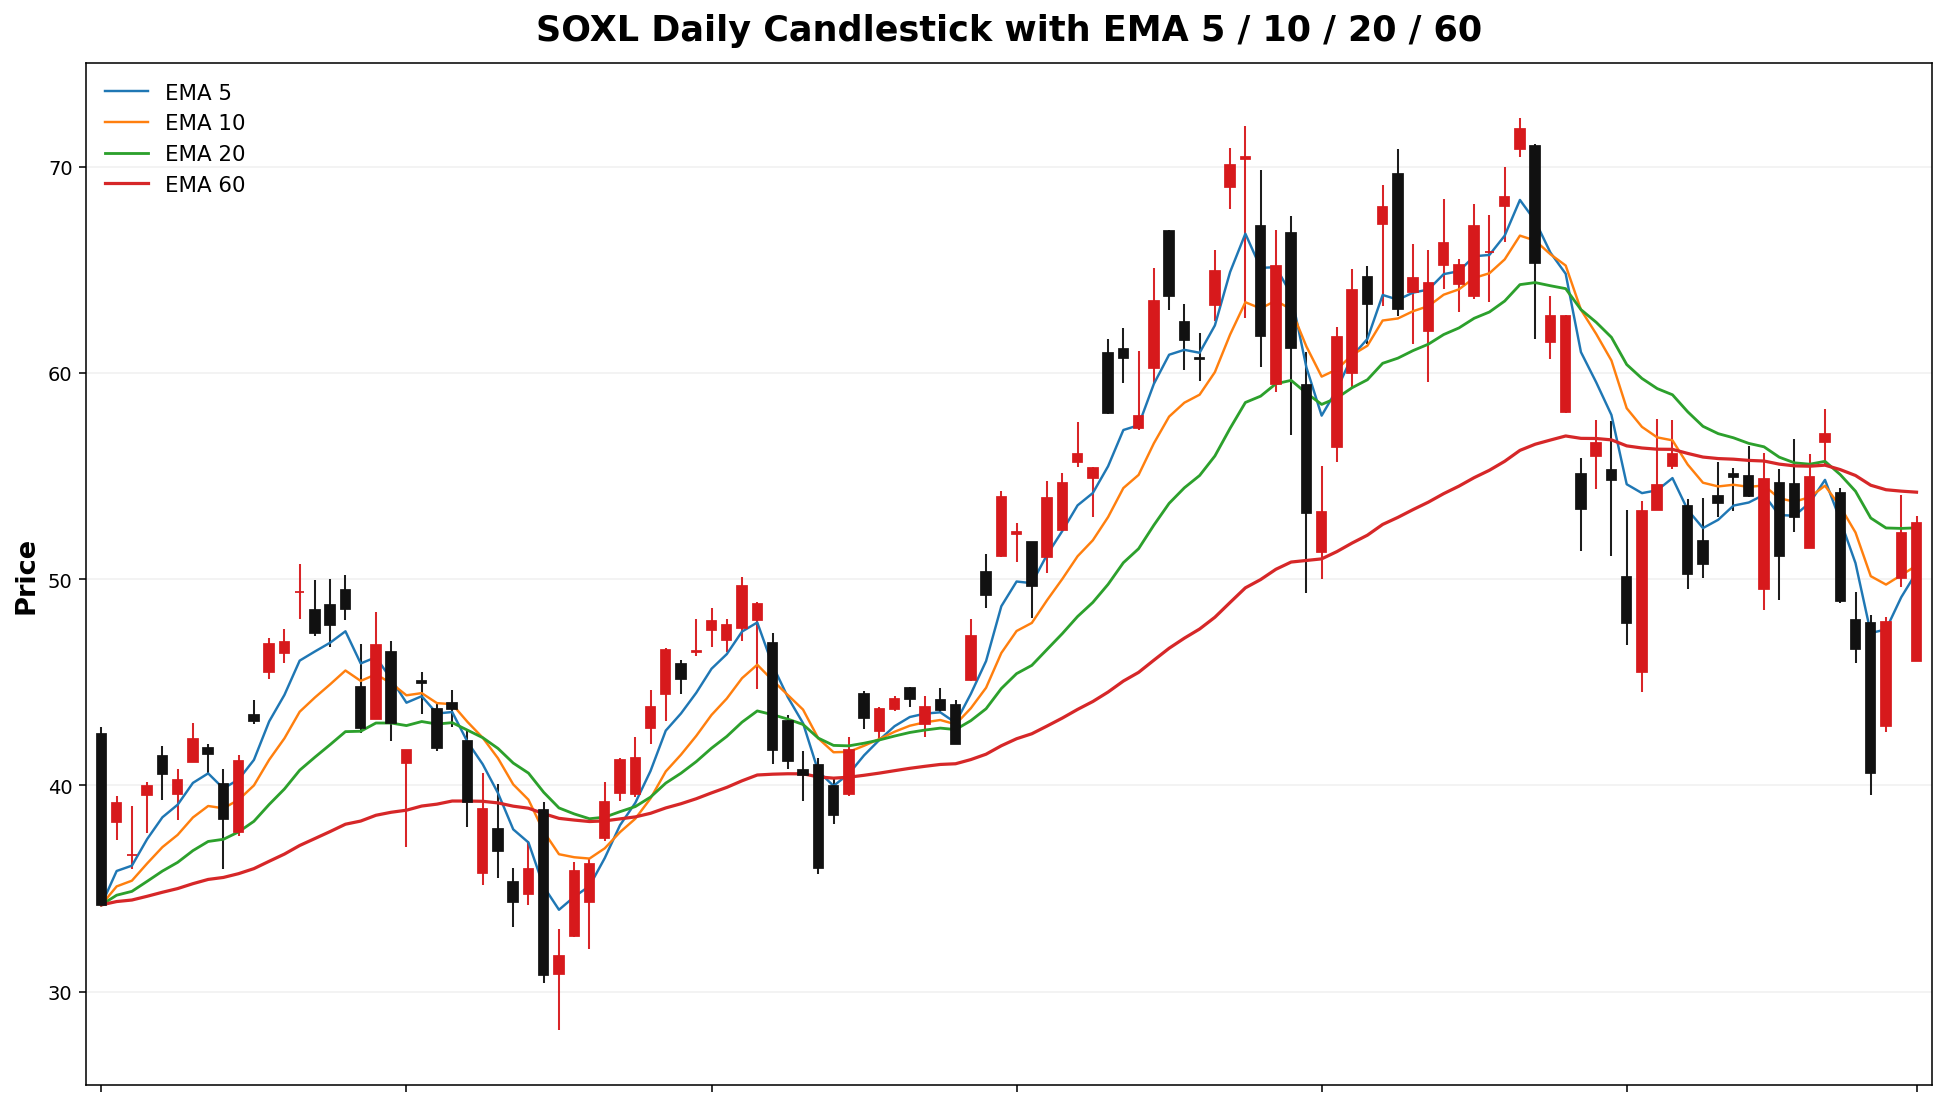
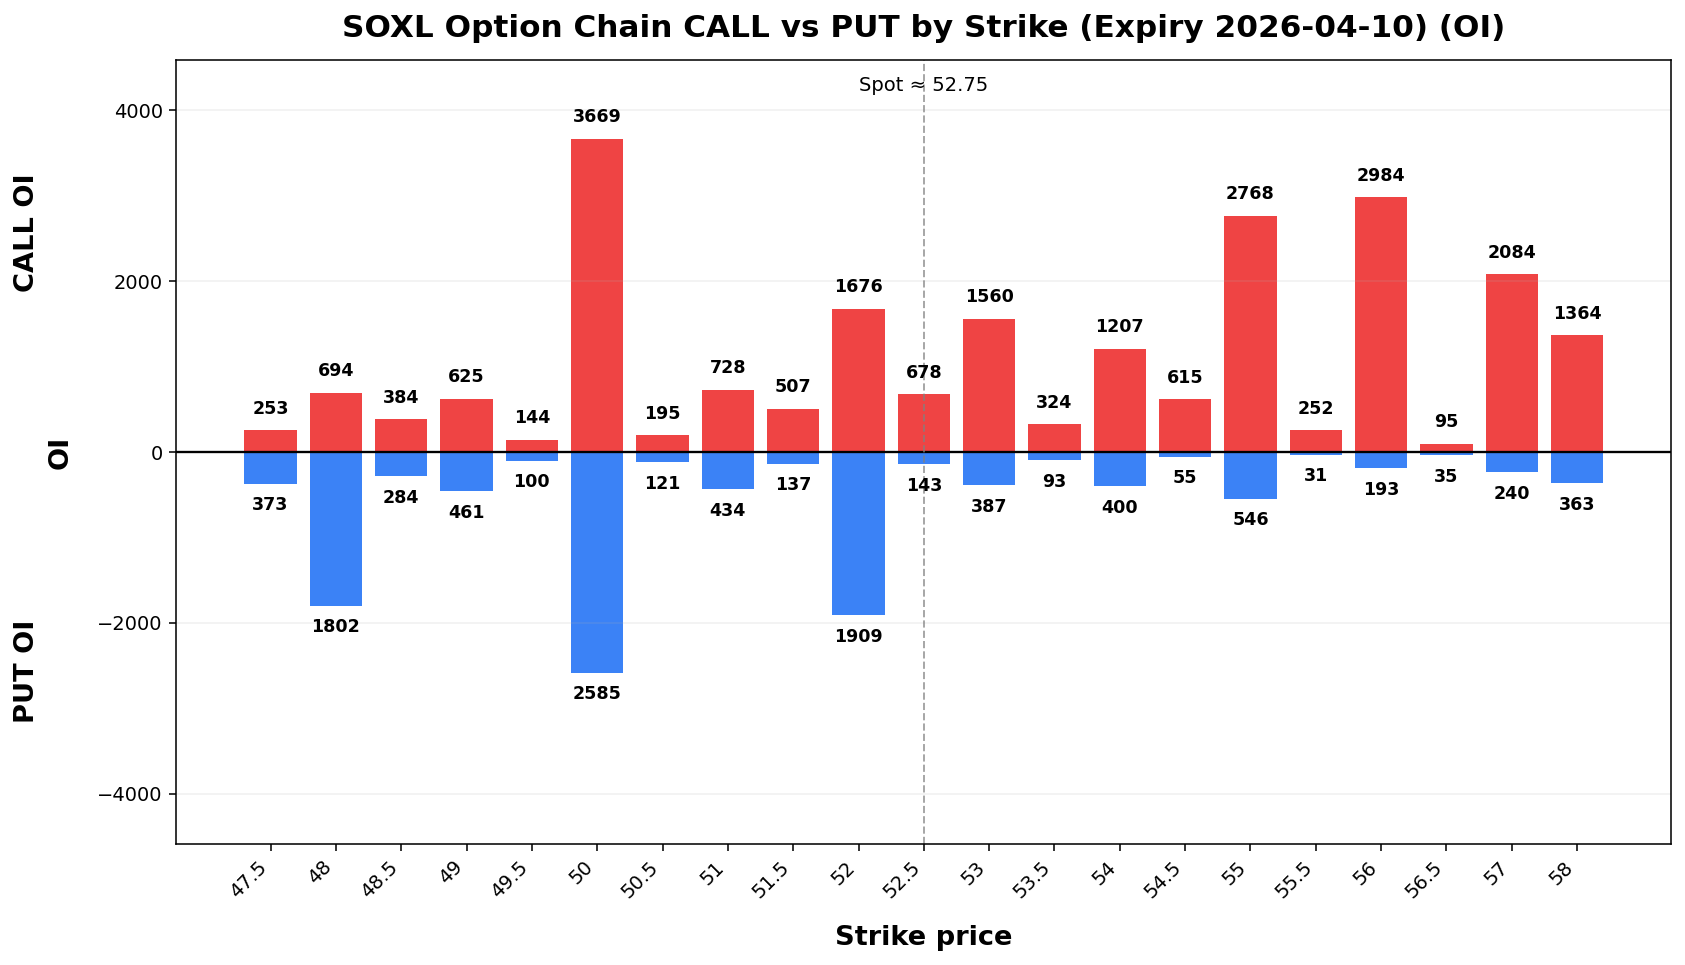
SOXL
Spot: 52.75
Report Time: 2026-04-05 06:51 PM MYT
Regime: TRANSITION
Dealer Gamma: LONG
Term Structure
| Expiry |
DTE |
Forward |
ATM IV |
ATM Straddle |
| 2026-04-10 |
6 |
52.65 |
108.47% |
6.95 |
| 2026-04-17 |
13 |
52.61 |
103.48% |
10.05 |
Weekly Range
| Confidence |
Low |
High |
Width |
| 68% |
44.86 |
60.64 |
15.79 |
| 80% |
42.63 |
62.87 |
20.23 |
| 90% |
39.77 |
65.73 |
25.97 |
| 95% |
37.28 |
68.22 |
30.94 |
Structure & Probabilities
| Support |
Resistance |
Gamma Flip |
Max Pain |
P>Res |
P<Sup |
| 50.00 |
56.00 |
48.12 |
50.00 |
27.9% |
35.7% |
Flow & Skew
| Call Vol |
Put Vol |
Vol P/C |
Call OI |
Put OI |
OI P/C |
Skew |
Skew Bias |
| 37,013 |
42,119 |
1.14 |
47,945 |
61,806 |
1.29 |
34.18 vol pts |
PUT_SKEW |
Tail Risk
| Q10 |
Q50 |
Q90 |
Down Tail |
Up Tail |
Down/Up |
| 30.47 |
51.89 |
63.00 |
22.28 |
10.25 |
2.17 |
Daily Technicals
| EMA20 |
EMA50 |
VWAP20 |
BB Lower |
BB Mid |
BB Upper |
BB Width |
Vol Ratio |
Path |
| 52.49 |
54.47 |
51.38 |
43.96 |
51.78 |
59.61 |
30.21% |
1.02 |
Sideways / Range |
Day Plan
- 50.00-56.00 range: fade extremes
- > 56.00: chase only if hold + vol
- < 50.00: risk expand; reduce size
- Regime: TRANSITION
- Tech: Sideways / Range
Swing Plan
- Accumulate: 50.00-50.00
- Trim: 56.00-56.00
- Add: close > 56.00
- Cut: close < 50.00
- Best for: transition regime
Raw Text Summary
📌 SOXL @ 52.75 (2026-04-05 06:51 PM MYT)

• Current price is **52.75**. Key support is around **50.00**, and resistance is around **56.00**.
• For the next week, the model’s **68% expected range** is roughly **44.86 to 60.64**.
• A wider **90% range** is about **39.77 to 65.73**.
• Dealer positioning looks **LONG gamma**, so the market behavior is classified as **TRANSITION**.
• The estimated **gamma flip** is near **48.12**. Crossing and holding beyond this area can change the trading behavior.
• Approximate breakout odds: **above resistance 27.9%**, **below support 35.7%** by the target horizon.
• Options skew is tilted toward **puts**, which suggests traders are paying more for downside protection.
• Near-term implied volatility is higher than the next expiry (**IV1 108.47% vs IV2 103.48%**), which suggests **near-term event stress / backwardation**.
• On the daily chart, the stock currently looks like **Sideways / Range**.
• The implied distribution shows **heavier downside tail risk** than upside tail potential.
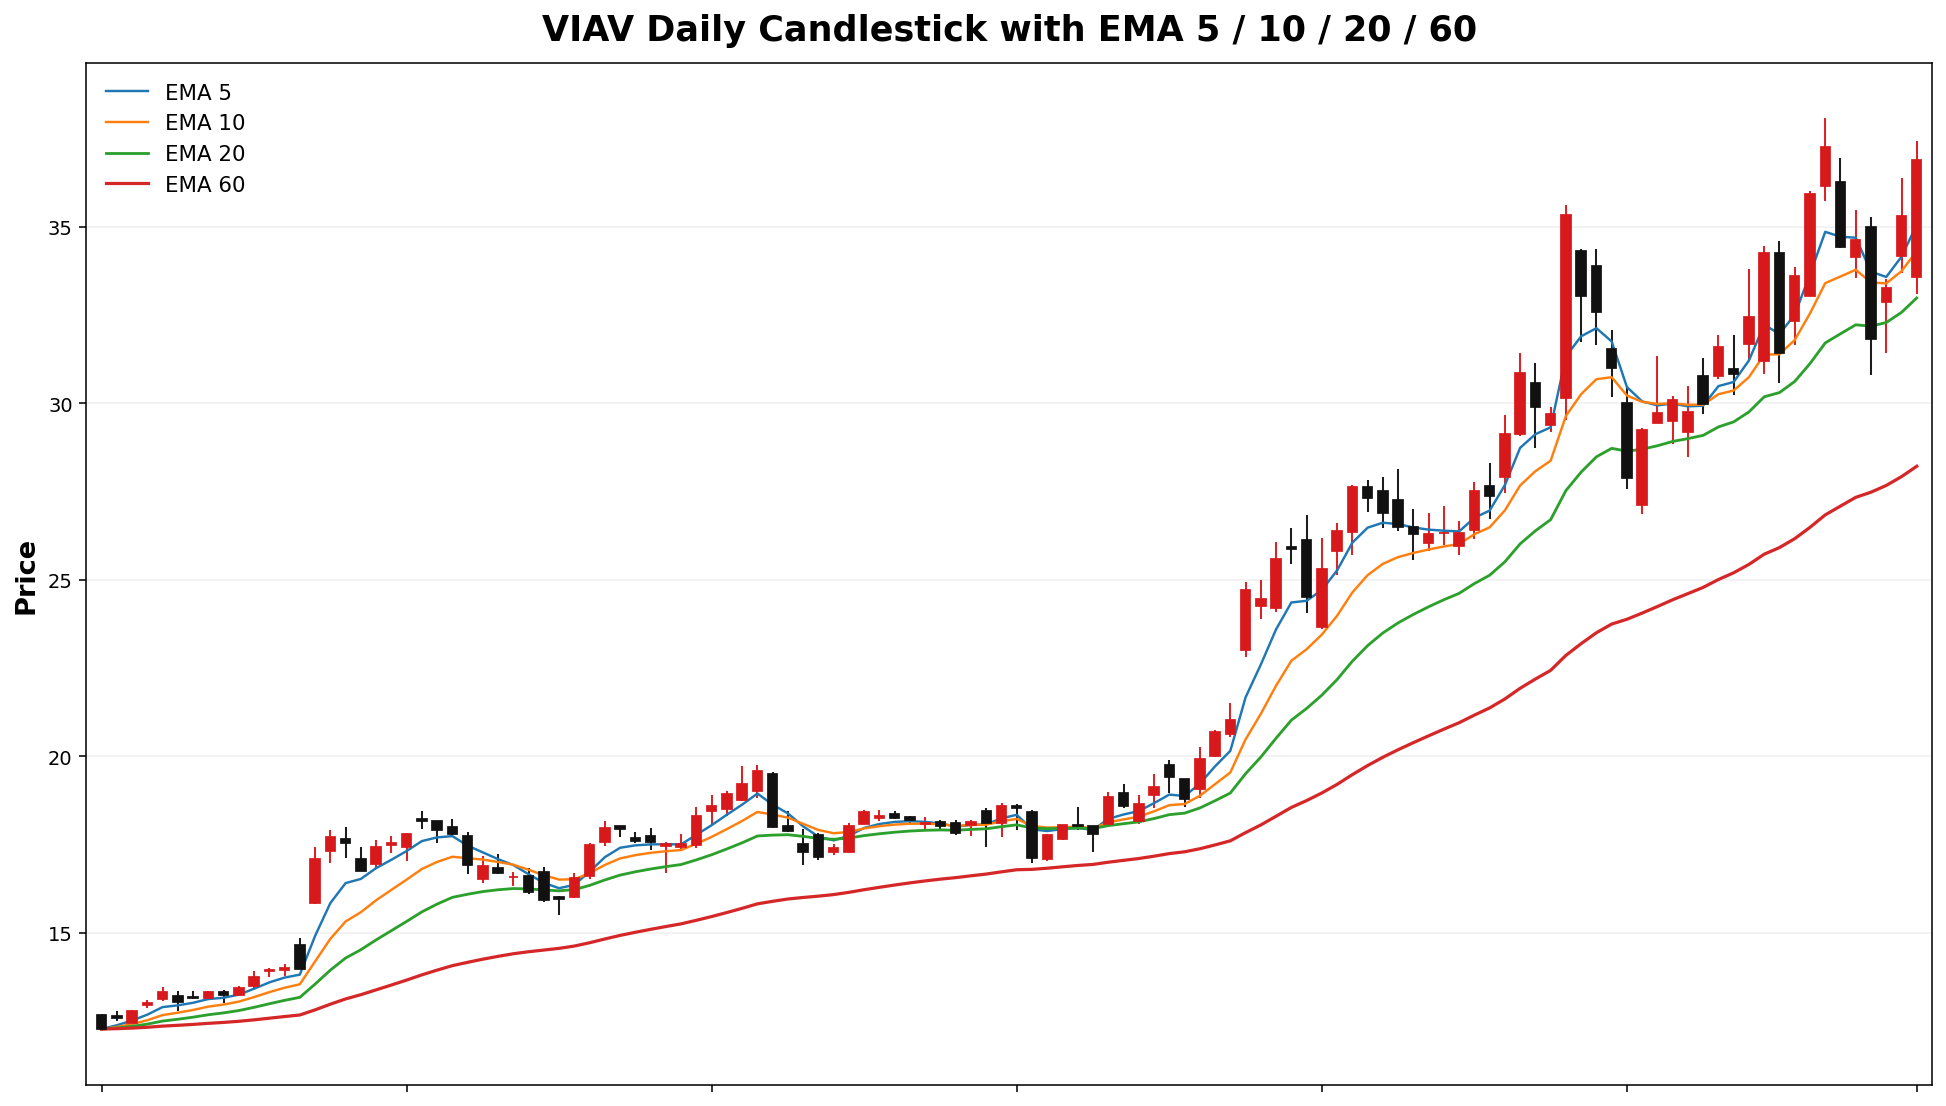
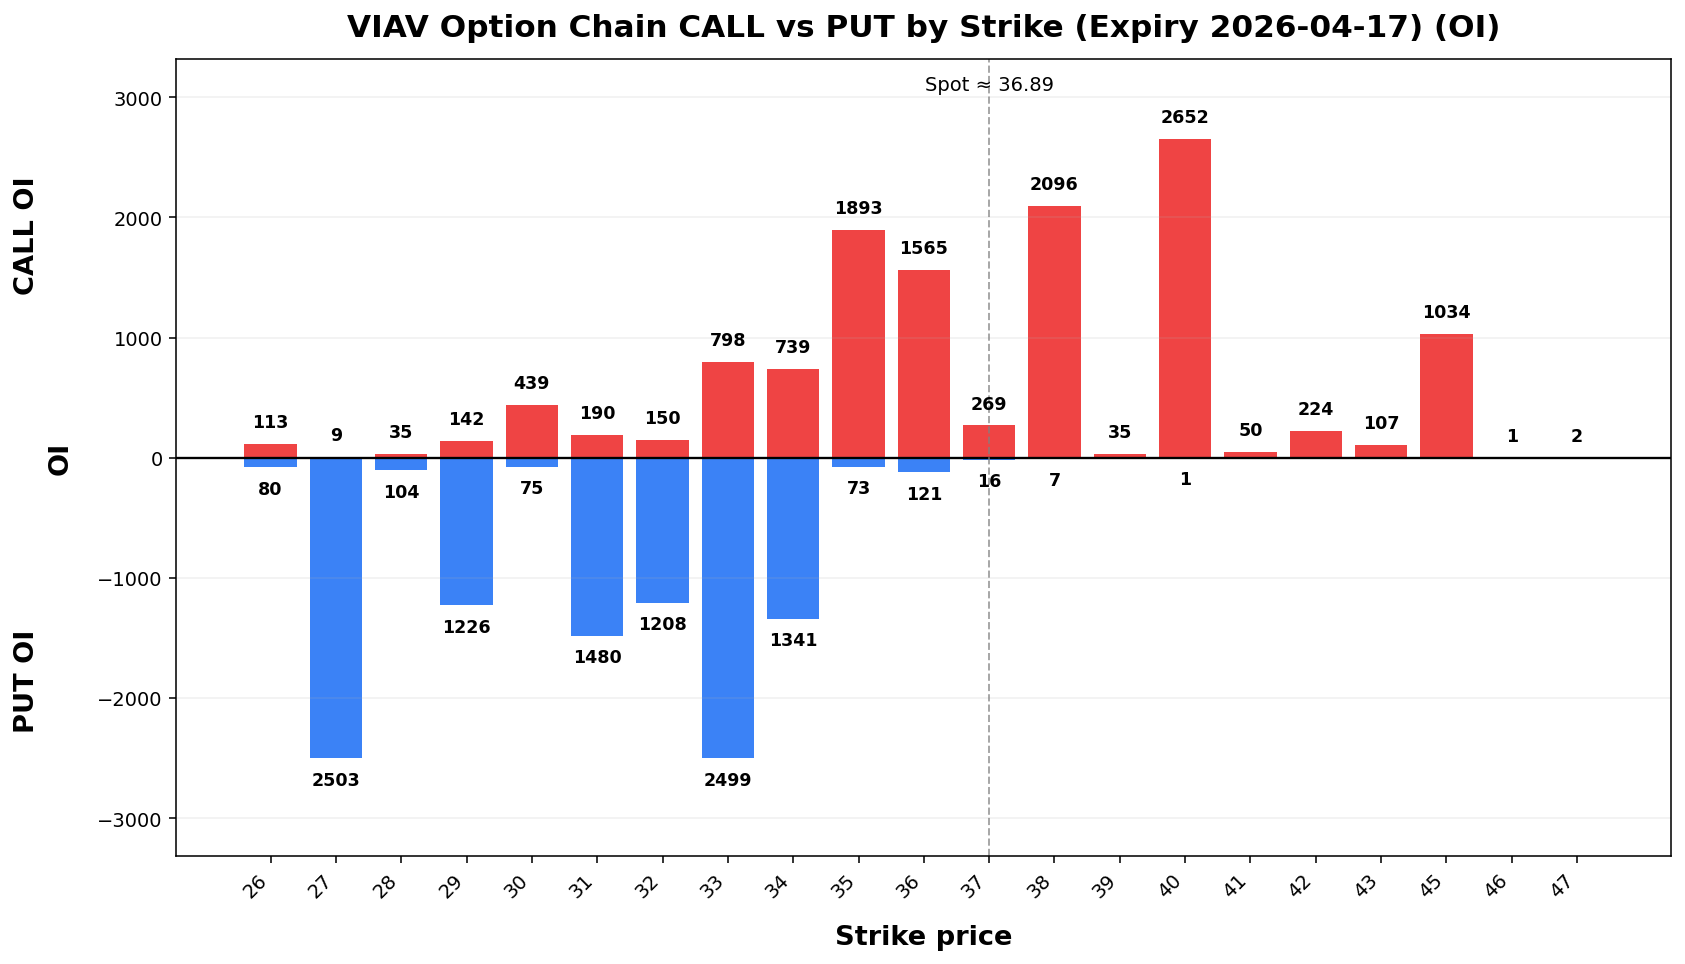
VIAV
Spot: 36.89
Report Time: 2026-04-05 06:51 PM MYT
Regime: TRANSITION
Dealer Gamma: LONG
Term Structure
| Expiry |
DTE |
Forward |
ATM IV |
ATM Straddle |
| 2026-04-17 |
13 |
36.72 |
77.67% |
5.28 |
| 2026-05-15 |
41 |
36.83 |
73.37% |
9.00 |
Weekly Range
| Confidence |
Low |
High |
Width |
| 68% |
32.64 |
41.14 |
8.50 |
| 80% |
31.44 |
42.34 |
10.90 |
| 90% |
29.90 |
43.88 |
13.99 |
| 95% |
28.56 |
45.22 |
16.67 |
Structure & Probabilities
| Support |
Resistance |
Gamma Flip |
Max Pain |
P>Res |
P<Sup |
| 36.00 |
38.00 |
32.76 |
33.00 |
33.0% |
34.6% |
Flow & Skew
| Call Vol |
Put Vol |
Vol P/C |
Call OI |
Put OI |
OI P/C |
Skew |
Skew Bias |
| 811 |
272 |
0.34 |
13,020 |
12,712 |
0.98 |
-0.98 vol pts |
FLAT |
Tail Risk
| Q10 |
Q50 |
Q90 |
Down Tail |
Up Tail |
Down/Up |
| 30.63 |
37.16 |
43.11 |
6.26 |
6.22 |
1.01 |
Daily Technicals
| EMA20 |
EMA50 |
VWAP20 |
BB Lower |
BB Mid |
BB Upper |
BB Width |
Vol Ratio |
Path |
| 32.99 |
29.26 |
32.74 |
27.10 |
32.52 |
37.94 |
33.33% |
0.78 |
UP trend (expanding) |
Day Plan
- 36.00-38.00 range: fade extremes
- > 38.00: chase only if hold + vol
- < 36.00: risk expand; reduce size
- Regime: TRANSITION
- Tech: UP trend (expanding)
Swing Plan
- Accumulate: 36.00-36.00
- Trim: 38.00-38.00
- Add: close > 38.00
- Cut: close < 36.00
- Best for: transition regime
Raw Text Summary
📌 VIAV @ 36.89 (2026-04-05 06:51 PM MYT)

• Current price is **36.89**. Key support is around **36.00**, and resistance is around **38.00**.
• For the next week, the model’s **68% expected range** is roughly **32.64 to 41.14**.
• A wider **90% range** is about **29.90 to 43.88**.
• Dealer positioning looks **LONG gamma**, so the market behavior is classified as **TRANSITION**.
• The estimated **gamma flip** is near **32.76**. Crossing and holding beyond this area can change the trading behavior.
• Approximate breakout odds: **above resistance 33.0%**, **below support 34.6%** by the target horizon.
• Options skew is fairly balanced, so there is **no strong directional bias** from skew alone.
• Near-term implied volatility is higher than the next expiry (**IV1 77.67% vs IV2 73.37%**), which suggests **near-term event stress / backwardation**.
• Recent volume is only **0.78x** the 20-day average, so breakouts may be less reliable unless volume improves.
• On the daily chart, the stock currently looks like **UP trend (expanding)**.
• The implied distribution is **fairly balanced** between upside and downside tails.
RKLB
Spot: 67.73
Report Time: 2026-04-05 06:51 PM MYT
Regime: TRANSITION
Dealer Gamma: LONG
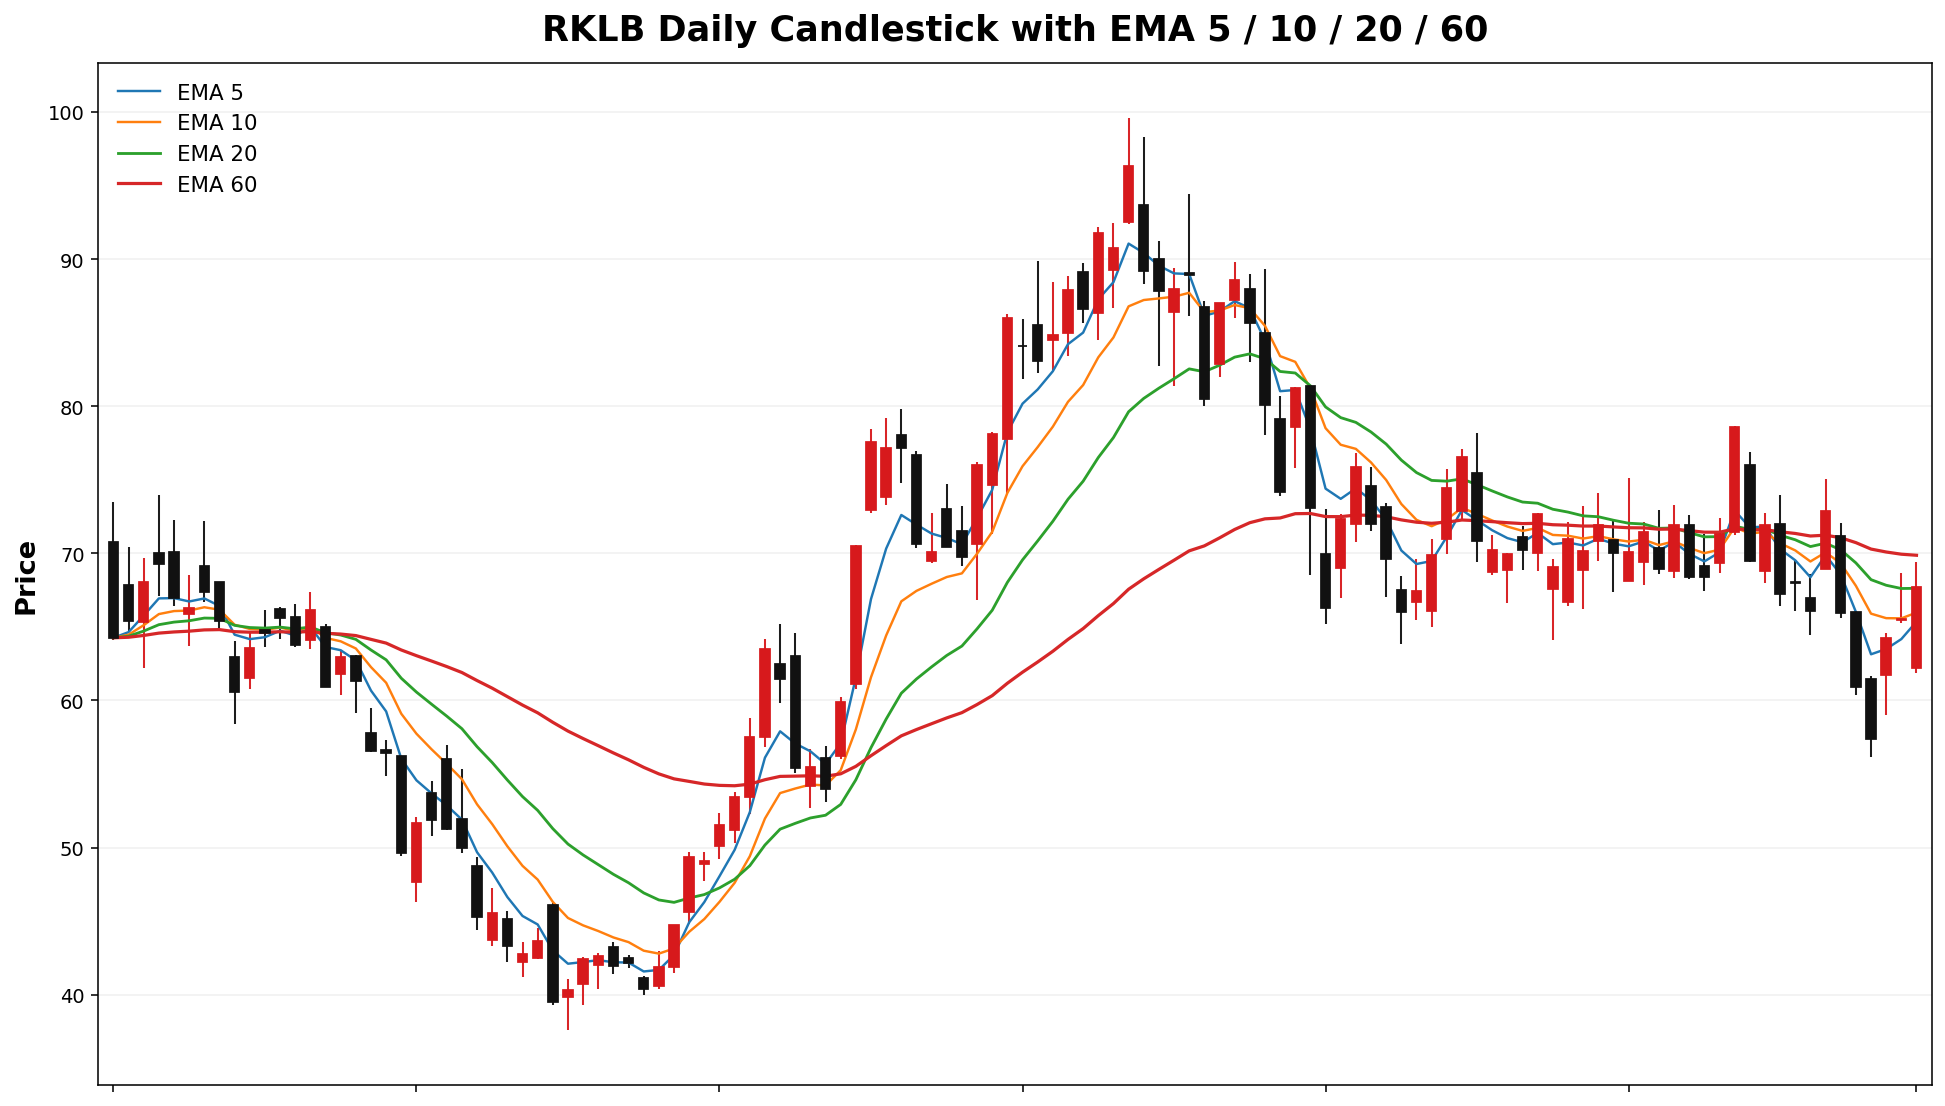
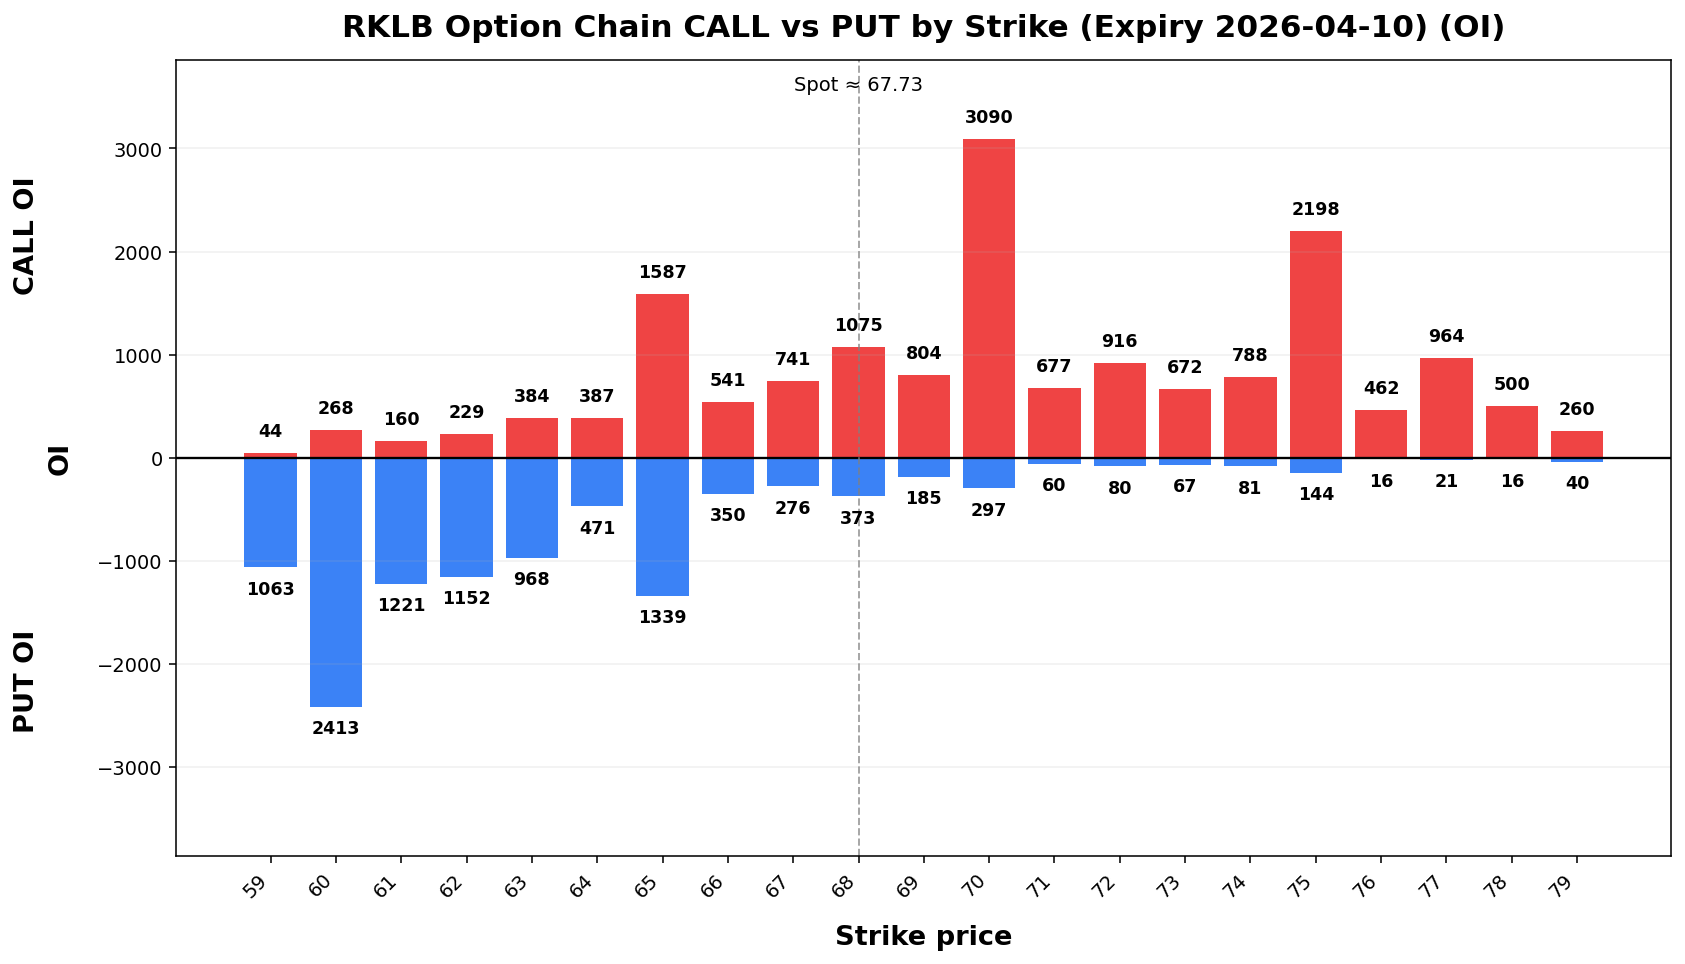
Term Structure
| Expiry |
DTE |
Forward |
ATM IV |
ATM Straddle |
| 2026-04-10 |
6 |
67.71 |
80.29%83.63% |
6.88 |
E2 |
2026-04-17 |
13 |
67.61 |
77.36%78.79% |
9.82 |
DistributionWeekly Range
| Confidence |
Low |
High |
Width |
| 68% |
59.96 |
75.50 |
15.54 |
| 80% |
57.77 |
77.69 |
19.92 |
| 90% |
54.95 |
80.51 |
25.57 |
| 95% |
52.50 |
82.96 |
30.46 |
Structure & Probabilities
| Support |
Resistance |
Gamma Flip |
Max Pain |
P>Res |
P<Sup |
| 65.00 |
70.00 |
62.19 |
65.00 |
31.6% |
35.6% |
Flow & Skew
| Call Vol |
Put Vol |
Vol P/C |
Call OI |
Put OI |
OI P/C |
Skew |
Skew Bias |
| 20,932 |
10,817 |
0.52 |
26,055 |
14,381 |
0.55 |
2.93 vol pts |
PUT_SKEW |
Tail Risk
| Q10 |
MedianQ50 |
Q90 |
Down Tail Asymmetry |
SkewUp (25ΔP-25ΔC)Tail |
Down/Up |
| 52.78 |
63.60 |
78.83 |
1.3514.95 |
2.9311.10 |
volpts1.35 |
ExecutiveDaily SummaryTechnicals
| EMA20 |
EMA50 |
VWAP20 |
BB Lower |
BB Mid |
BB Upper |
BB Width |
Vol Ratio |
Path |
| 67.62 |
69.72 |
68.72 |
59.29 |
68.32 |
77.36 |
26.45% |
1.34 |
DOWN trend (expanding) |
Day Plan
这周大概率在 60.2–75.3 区间来回走。
极端情况下可能到 55.3 或 80.2 附近。
60 是关键支撑(收盘跌破,下行风险会变大)。
70 是关键压力(收盘站上去才算转强)。
目前在分界线(约 64.21)上方;跌破它会更危险。
市场更倾向突破压力,而不是跌破支撑。
Trade Plans
Day Trade Plan
67-7065.00-70.00 range: fade extremes- >
70:70.00: chase only if hold + vol
- <
60:65.00: risk expand; reduce size
- Regime: TRANSITION
- Tech: DOWN trend (expanding)
Swing Trade Plan
- Accumulate:
60-6765.00-65.00
- Trim:
69.5-7070.00-70.00
- Add: close >
7070.00
- Cut: close <
6065.00
- Best for: transition regime
4.Raw SATS
Text Summary
Quick📌 Take:
RKLB 这周大概率在@ 117.4–140.067.73 区间来回走。
Snapshot
Item |
Value |
|---|
Spot |
128.68 |
Report Time |
(2026-04-05 08:0006:51 AMPM MYT | MYT)
• Current Executionprice Regime | is LONG_GAMMA_PIN | **67.73**.
Key support is around **65.00**, and resistance is around **70.00**.
• For the next week, the model’s **68% expected range** is roughly **59.96 to 75.50**.
• A wider **90% range** is about **54.95 to 80.51**.
• Dealer Gamma | positioning looks **LONG |
gamma**, so Trendthe Path | market UPbehavior is classified as **TRANSITION**.
• The estimated **gamma flip** is near **62.19**. Crossing and holding beyond this area can change the trading behavior.
• Approximate breakout odds: **above resistance 31.6%**, **below support 35.6%** by the target horizon.
• Options skew is tilted toward **puts**, which suggests traders are paying more for downside protection.
• Near-term implied volatility is higher than the next expiry (**IV1 83.63% vs IV2 78.79%**), which suggests **near-term event stress / backwardation**.
• On the daily chart, the stock currently looks like **DOWN trend (expanding) | **.
• The
implied Tradingdistribution Map
shows **heavier
Zone |
Level / Range |
Note |
|---|
Weekly 68% |
117.40 – 139.96 |
1σ move 11.28 |
Weekly 90% |
110.13 – 147.23 |
wider risk band |
Support |
94.00 |
downside defense | tail
risk** than Resistance |
123.00 |
upside supply | tail
potential.
Gamma
Flip | ALB
127.11 | Spot:
regime178.09
pivot | Report
Time: 2026-04-05 Max06:51 Pain | PM NA | MYT
pinRegime: magnet | TRANSITION
Dealer Gamma:
LONG
Options
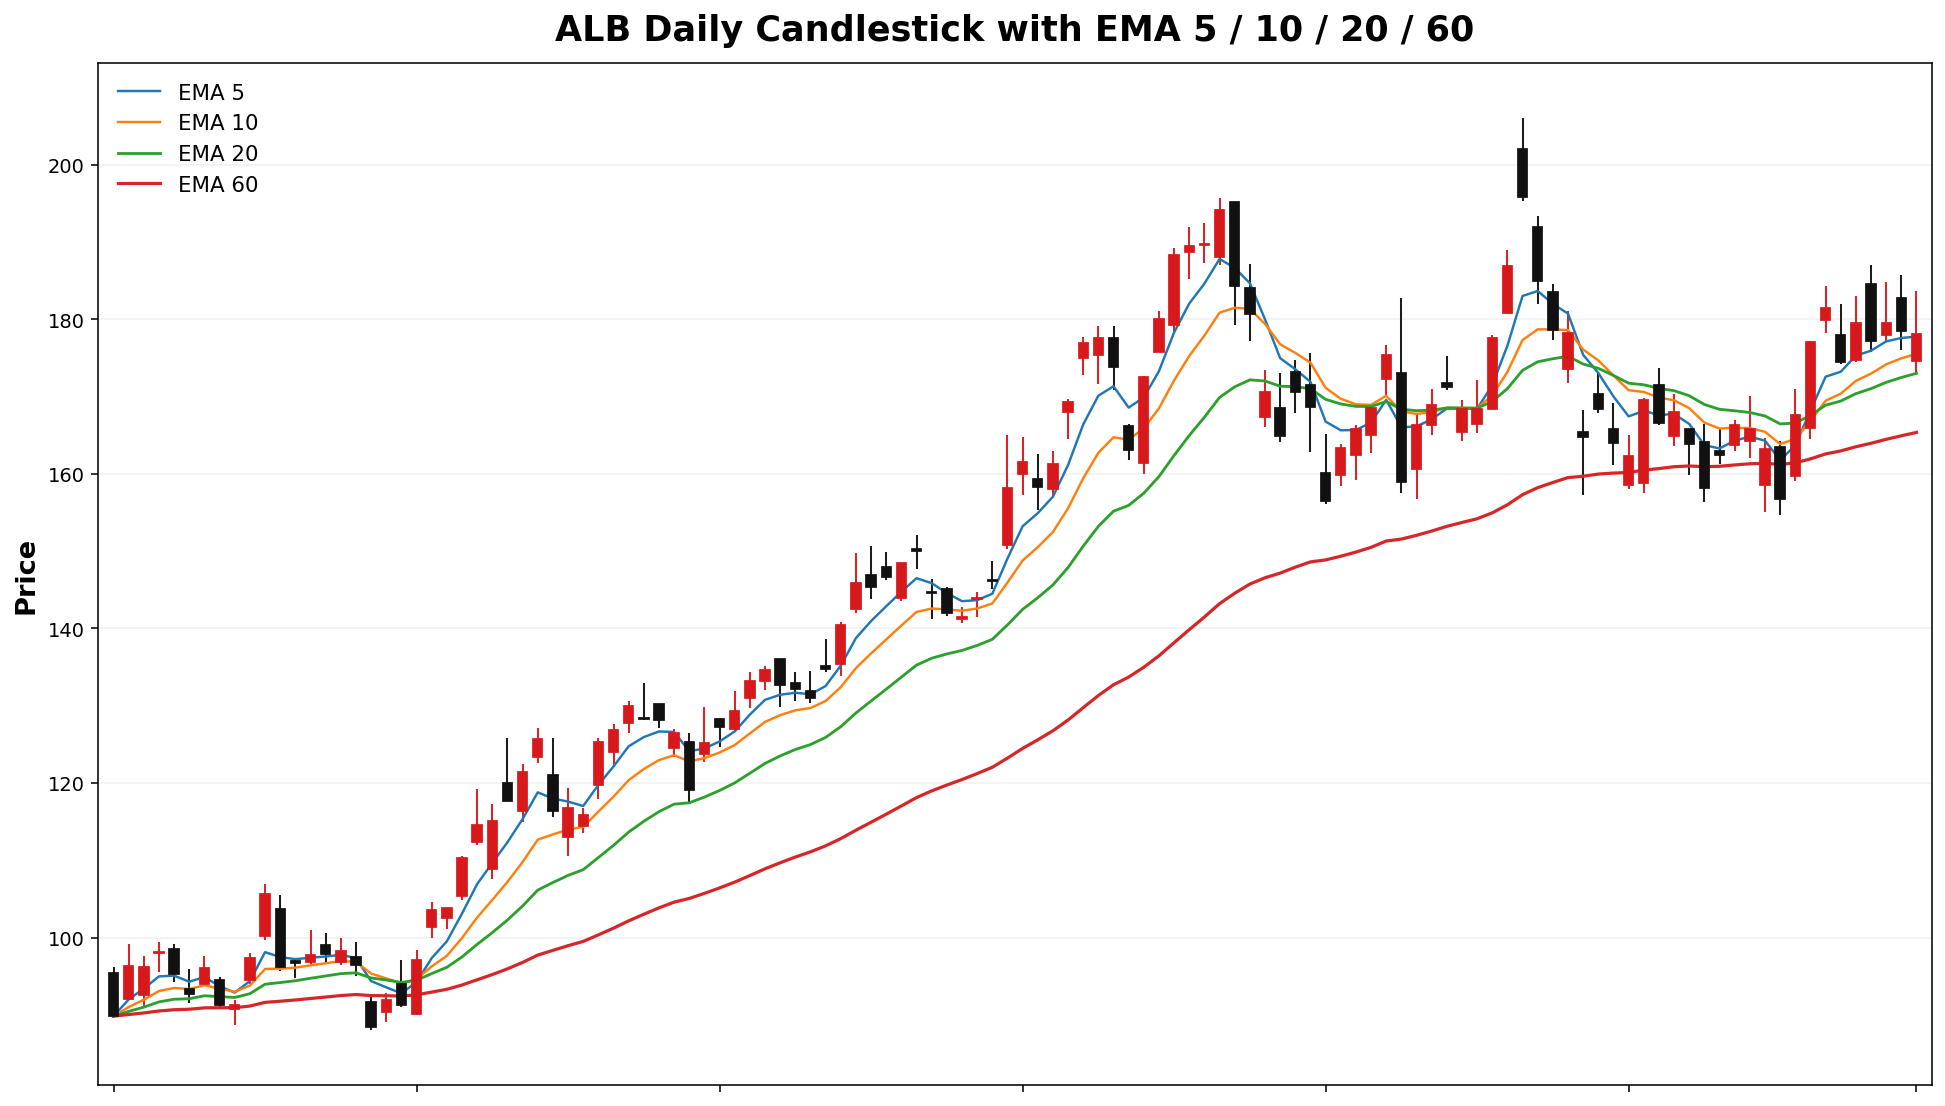
& Probability Dashboard
Metric |
Value |
Interpretation |
|---|
Breakout Up |
63.7% |
close above upper band |
Breakout Down |
0.1% |
close below lower band |
Put/Call Volume |
0.16 |
directional flow |
Put/Call OI |
1.08 |
positioning bias |
Total Option Volume |
6,156 |
nearest expiry |
Total Open Interest |
4,079 |
nearest expiry |
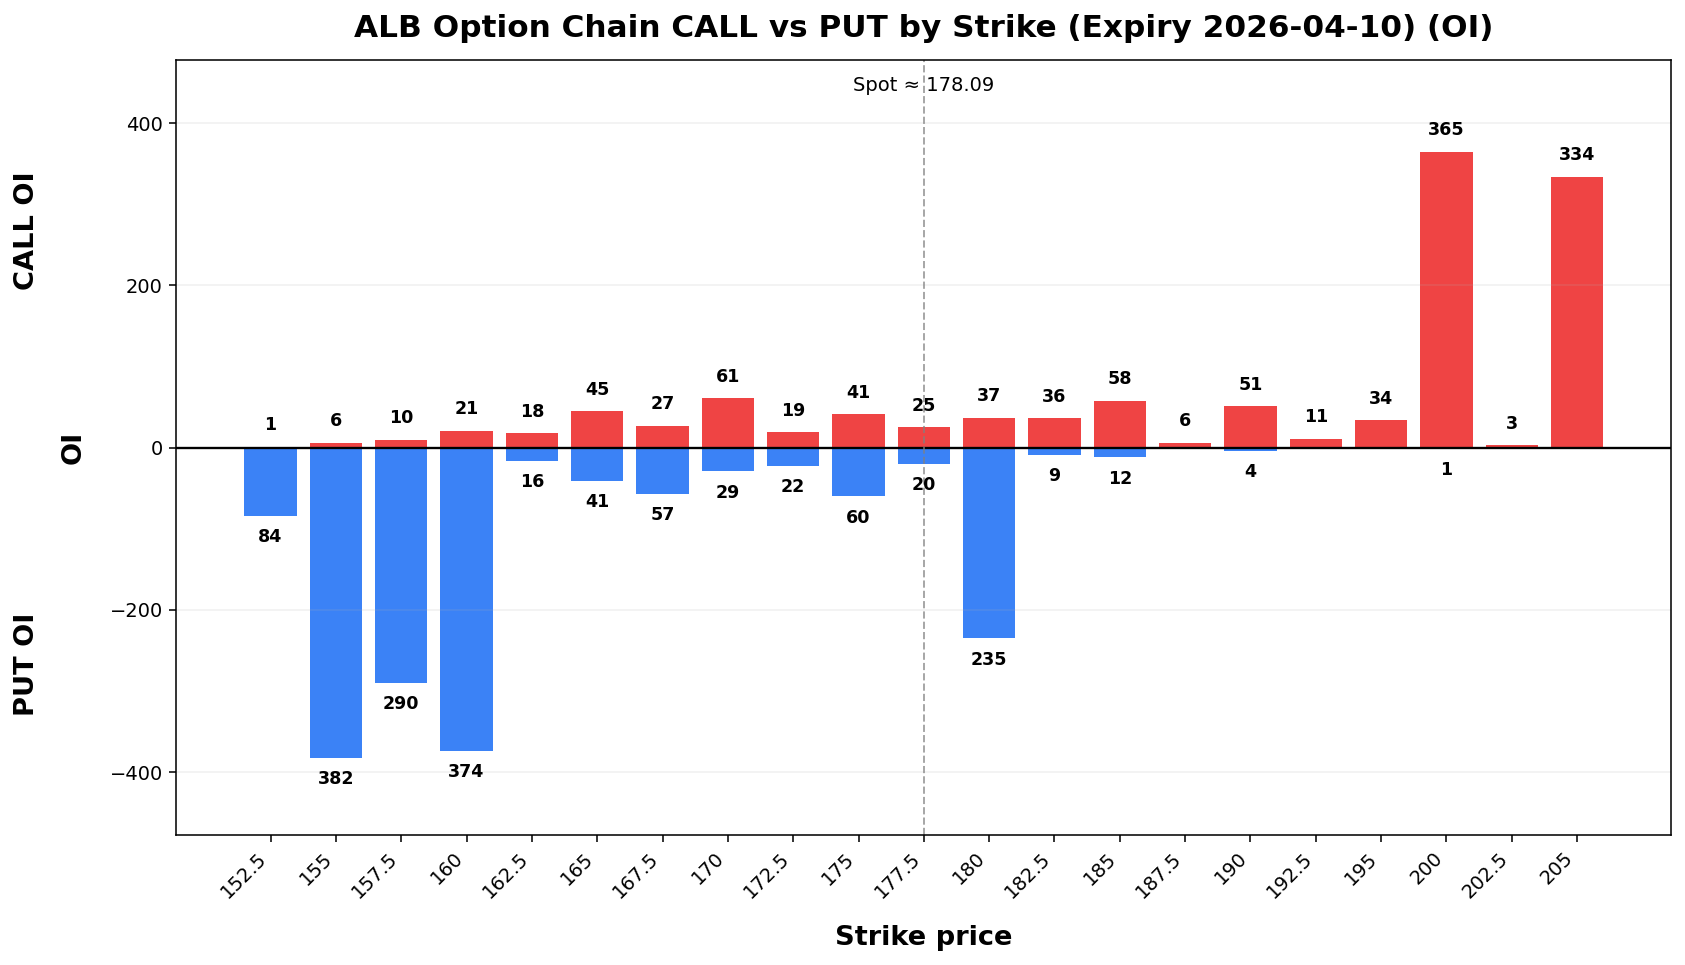
Term Structure
Leg |
Expiry |
DTE |
Forward |
ATM IV |
ATM Straddle |
|---|
E1 |
2026-04-10 |
6 |
129.06178.55 |
64.24%60.14% |
13.00 |
E2 |
2026-04-17 |
13 |
127.98178.57 |
58.44%56.12% |
18.40 |
DistributionWeekly Range
| Confidence |
Low |
High |
Width |
| 68% |
163.45 |
192.73 |
29.27 |
| 80% |
159.33 |
196.85 |
37.51 |
| 90% |
154.02 |
202.16 |
48.15 |
| 95% |
149.40 |
206.78 |
57.37 |
Structure & Probabilities
| Support |
Resistance |
Gamma Flip |
Max Pain |
P>Res |
P<Sup |
| 160.00 |
180.00 |
182.68 |
175.00 |
34.2% |
9.9% |
Flow & Skew
| Call Vol |
Put Vol |
Vol P/C |
Call OI |
Put OI |
OI P/C |
Skew |
Skew Bias |
| 399 |
451 |
1.13 |
1,281 |
2,412 |
1.88 |
5.00 vol pts |
PUT_SKEW |
Tail Risk
| Q10 |
MedianQ50 |
Q90 |
Down Tail Asymmetry |
SkewUp (25ΔP-25ΔC)Tail |
Down/Up |
113.43159.02 |
124.81178.63 |
150.35196.58 |
0.7019.07 |
-0.4618.49 |
volpts1.03 |
ExecutiveDaily Summary
这周大概率在 117.4–140.0 区间来回走。
极端情况下可能到 110.1 或 147.2 附近。
94 是关键支撑(收盘跌破,下行风险会变大)。
123 是关键压力(收盘站上去才算转强)。
目前在分界线(约 127.11)上方;跌破它会更危险。
市场更倾向突破压力,而不是跌破支撑。
Trade Plans
Day Trade Plan
123-131 range: fade extremes
123: chase only if hold + vol
< 94: risk expand; reduce size
Tech: UP trend (expanding)
Swing Trade Plan
Accumulate: 94-123
Trim: 123.0-123
Add: close > 123
Cut: close < 94
5. VSAT
Quick Take: 这周大概率在 48.2–59.2 区间来回走。
SnapshotTechnicals
ItemEMA20 |
ValueEMA50 |
VWAP20 |
BB Lower |
BB Mid |
BB Upper |
BB Width |
Vol Ratio |
Path |
Spot173.00 |
53.69 |
Report Time167.80 |
2026-04-05 08:00 AM MYT |
Execution Regime169.44 |
LONG_GAMMA_PIN |
Dealer Gamma154.35 |
LONG169.82 |
| 185.29 |
Trend18.22% |
Path0.59 |
UP trend (expanding) |
TradingDay MapPlan
- 160.00-180.00
range: Zone | fade Levelextremes
- > 180.00: chase only if hold + vol
- < 160.00: risk expand; reduce size
- Regime: TRANSITION
- Tech: UP trend (expanding)
Swing Plan
- Accumulate: 160.00-160.00
- Trim: 180.00-180.00
- Add: close > 180.00
- Cut: close < 160.00
- Best for: transition regime
Raw Text Summary
📌 ALB @ 178.09 (2026-04-05 06:51 PM MYT)

• Current price is **178.09**. Key support is around **160.00**, and resistance is around **180.00**.
• For the next week, the model’s **68% expected range** is roughly **163.45 to 192.73**.
• A wider **90% range** is about **154.02 to 202.16**.
• Dealer positioning looks **LONG gamma**, so the market behavior is classified as **TRANSITION**.
• The estimated **gamma flip** is near **182.68**. Crossing and holding beyond this area can change the trading behavior.
• Approximate breakout odds: **above resistance 34.2%**, **below support 9.9%** by the target horizon.
• Options skew is tilted toward **puts**, which suggests traders are paying more for downside protection.
• Near-term implied volatility is higher than the next expiry (**IV1 60.14% vs IV2 56.12%**), which suggests **near-term event stress / Range
| backwardation**.
Note | •
Recent volume is only Weekly**0.59x** 68% | the 48.1720-day –average, 59.21 | so 1σbreakouts movemay 5.52 | be
less reliable Weeklyunless 90% | volume 44.61improves.
–• 62.77 | On widerthe riskdaily band | chart,
the stock Support | currently 45.00 | looks like **UP trend (expanding)**.
• The implied distribution is **fairly balanced** between upside and downside defense | tails.
Resistance | AU
40.00 | Spot:
upside101.22
supply | Report
Time: 2026-04-05 Gamma06:51 Flip | PM 49.00 | MYT
regimeRegime: pivot | TRANSITION
Dealer Gamma: MaxLONG
Pain | 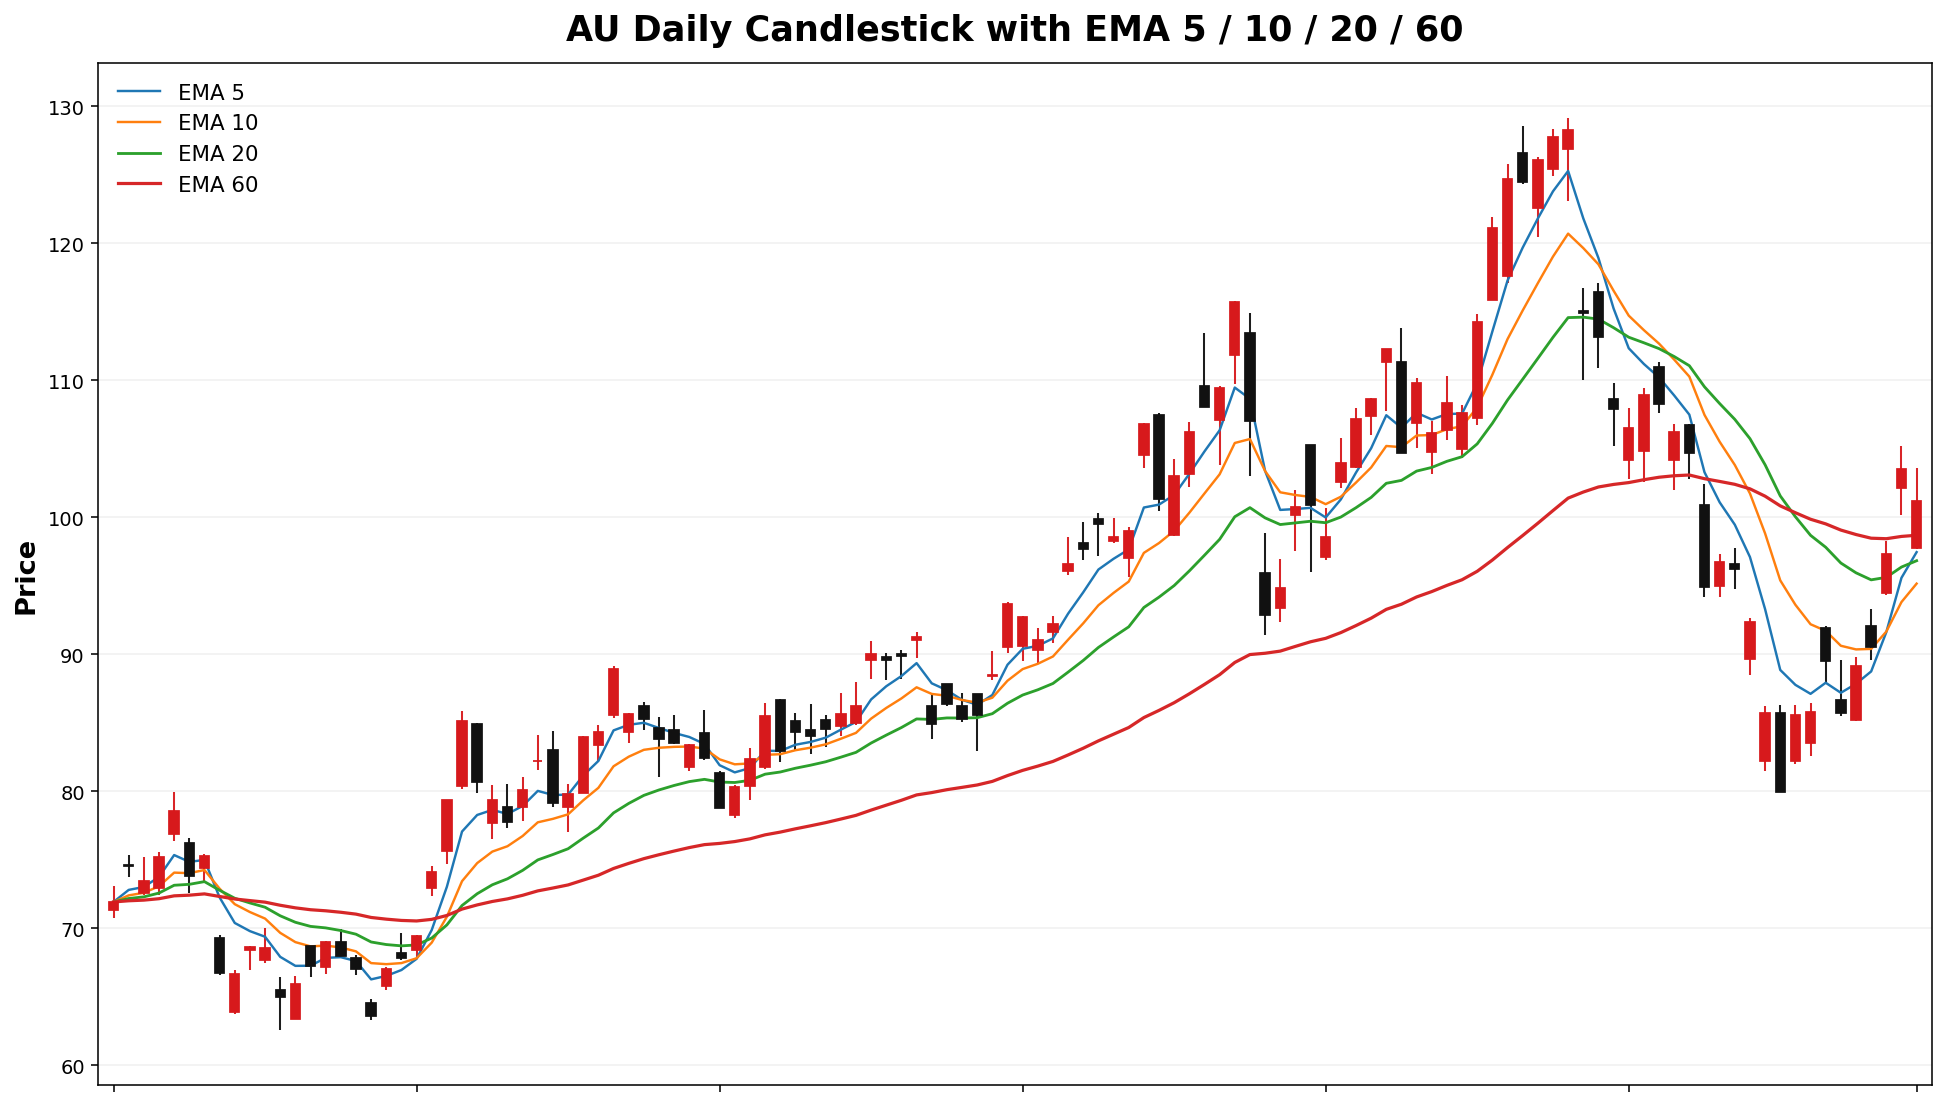
NA |
pin magnet |
Options & Probability Dashboard
Metric |
Value |
Interpretation |
|---|
Breakout Up |
100.0% |
close above upper band |
Breakout Down |
6.2% |
close below lower band |
Put/Call Volume |
0.15 |
directional flow |
Put/Call OI |
0.20 |
positioning bias |
Total Option Volume |
5,966 |
nearest expiry |
Total Open Interest |
32,002 |
nearest expiry |
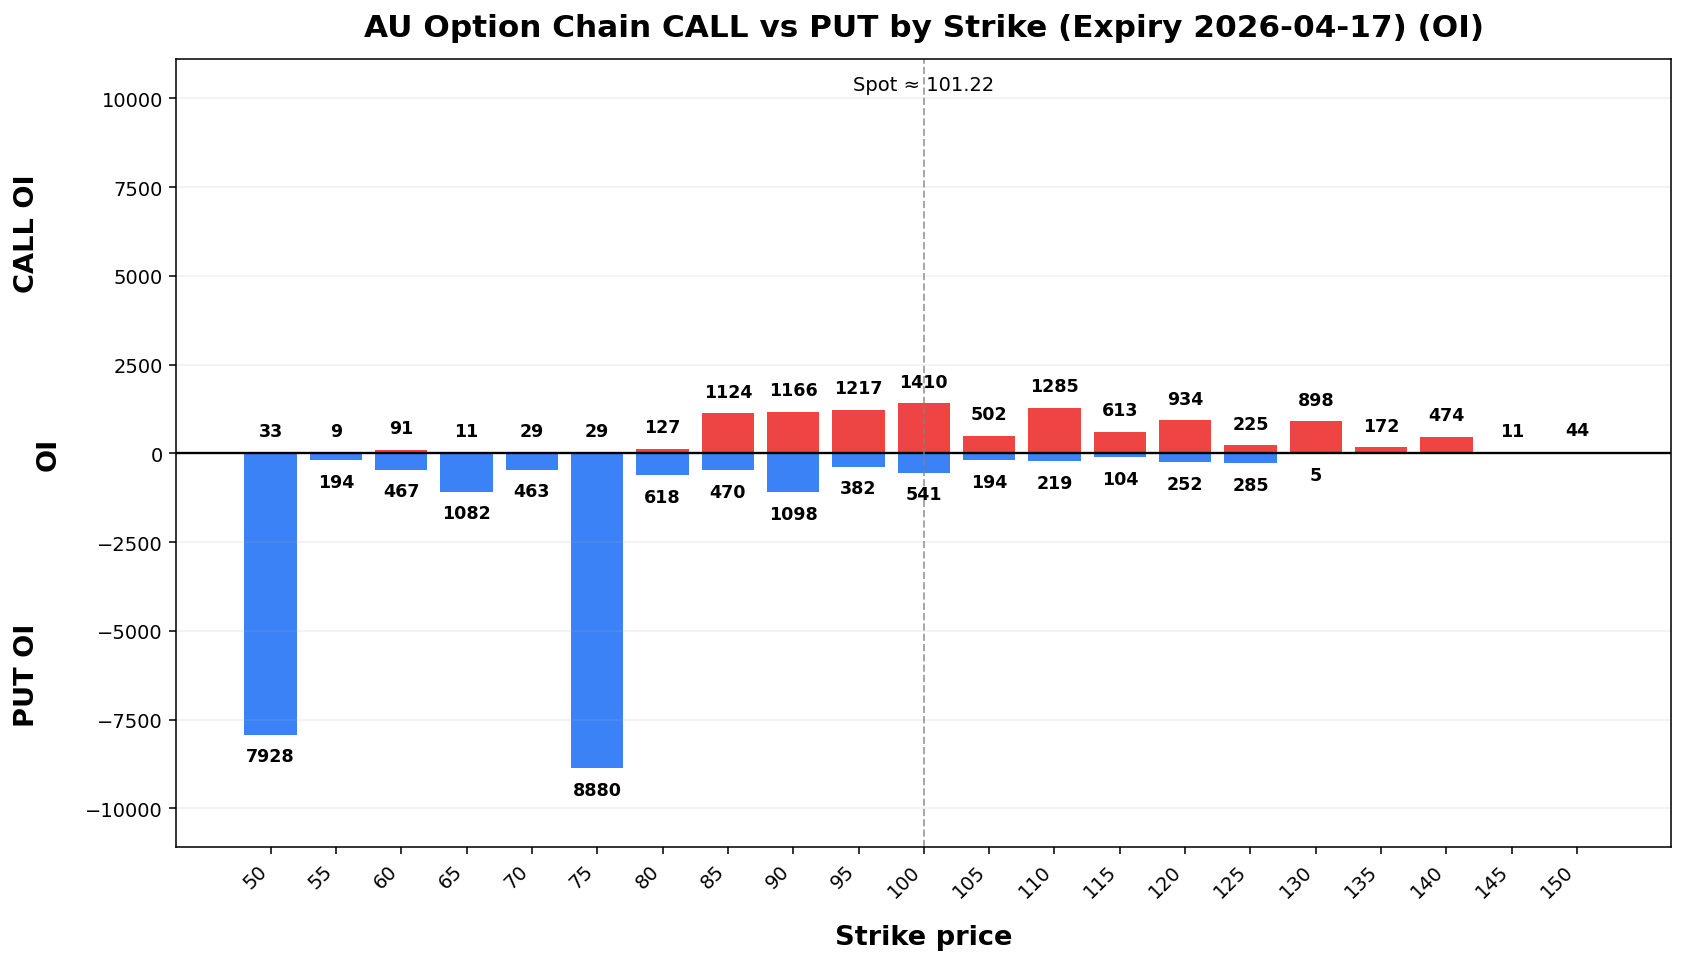
Term Structure
Leg |
Expiry |
DTE |
Forward |
ATM IV |
ATM Straddle |
|---|
E1 |
2026-04-17 |
13 |
53.13101.49 |
72.51%57.42% |
10.70 |
E2 |
2026-05-15 |
41 |
53.37101.91 |
72.11%53.93% |
18.15 |
DistributionWeekly Range
| Confidence |
Low |
High |
Width |
| 68% |
92.55 |
109.89 |
17.33 |
| 80% |
90.12 |
112.32 |
22.21 |
| 90% |
86.97 |
115.47 |
28.51 |
| 95% |
84.24 |
118.20 |
33.97 |
Structure & Probabilities
| Support |
Resistance |
Gamma Flip |
Max Pain |
P>Res |
P<Sup |
| 100.00 |
110.00 |
95.76 |
90.00 |
11.9% |
40.5% |
Flow & Skew
| Call Vol |
Put Vol |
Vol P/C |
Call OI |
Put OI |
OI P/C |
Skew |
Skew Bias |
| 472 |
341 |
0.72 |
10,499 |
24,786 |
2.36 |
9.35 vol pts |
PUT_SKEW |
Tail Risk
| Q10 |
MedianQ50 |
Q90 |
Down Tail Asymmetry |
SkewUp (25ΔP-25ΔC)Tail |
Down/Up |
40.3936.98 |
51.3944.89 |
61.68113.09 |
1.6664.24 |
0.3411.87 |
volpts5.41 |
ExecutiveDaily SummaryTechnicals
| EMA20 |
EMA50 |
VWAP20 |
BB Lower |
BB Mid |
BB Upper |
BB Width |
Vol Ratio |
Path |
| 96.84 |
99.17 |
93.26 |
77.67 |
95.45 |
113.23 |
37.25% |
0.62 |
Sideways / Range |
Day Plan
这周大概率在 48.2–59.2 区间来回走。
极端情况下可能到 44.6 或 62.8 附近。
45 是关键支撑(收盘跌破,下行风险会变大)。
40 是关键压力(收盘站上去才算转强)。
目前在分界线(约 49.00)上方;跌破它会更危险。
市场更倾向突破压力,而不是跌破支撑。
Trade Plans
Day Trade Plan
48-55100.00-110.00 range: fade extremes- >
40:110.00: chase only if hold + vol
- <
45:100.00: risk expand; reduce size
Tech:Regime: UP trend (expanding)TRANSITIONVol:Tech: elevatedSideways (breakout/ odds↑)Range
Swing Trade Plan
- Accumulate:
45-48100.00-100.00
- Trim:
40.0-40110.00-110.00
- Add: close >
40110.00
- Cut: close <
45100.00
- Best for: transition regime
6.Raw INTC
Text Summary
Quick📌 Take:
AU 这周大概率在@ 46.5–54.3101.22 区间来回走。
Snapshot
Item |
Value |
|---|
Spot |
50.38 |
Report Time |
(2026-04-05 08:0006:51 AMPM MYT | MYT)
• Current Executionprice Regime | is LONG_GAMMA_PIN | **101.22**.
Key support is around **100.00**, and resistance is around **110.00**.
• For the next week, the model’s **68% expected range** is roughly **92.55 to 109.89**.
• A wider **90% range** is about **86.97 to 115.47**.
• Dealer Gamma | positioning looks **LONG |
gamma**, so Trendthe Path | market UPbehavior bias | is
classified as
**TRANSITION**.
Trading• Map
The estimated **gamma flip** Zone | is Levelnear **95.76**. Crossing and holding beyond this area can change the trading behavior.
• Approximate breakout odds: **above resistance 11.9%**, **below support 40.5%** by the target horizon.
• Options skew is tilted toward **puts**, which suggests traders are paying more for downside protection.
• Near-term implied volatility is higher than the next expiry (**IV1 57.42% vs IV2 53.93%**), which suggests **near-term event stress / Range | backwardation**.
Note | •
Recent volume is only Weekly**0.62x** 68% | the 46.5020-day –average, 54.26 | so 1σbreakouts movemay 3.88 | be
less reliable Weeklyunless 90% | volume 44.00improves.
–• 56.76 | On widerthe riskdaily band | chart,
the stock Support | currently 48.00 | looks like **Sideways / Range**.
• The implied distribution shows **heavier downside defense | tail
risk** than Resistance |
50.00 |
upside supply | tail
potential.
Gamma
Flip | NUGT
44.86 | Spot:
regime199.37
pivot | Report
Time: 2026-04-05 Max06:51 Pain | PM NA | MYT
pinRegime: magnet | TRANSITION
Dealer Gamma:
LONG
Options
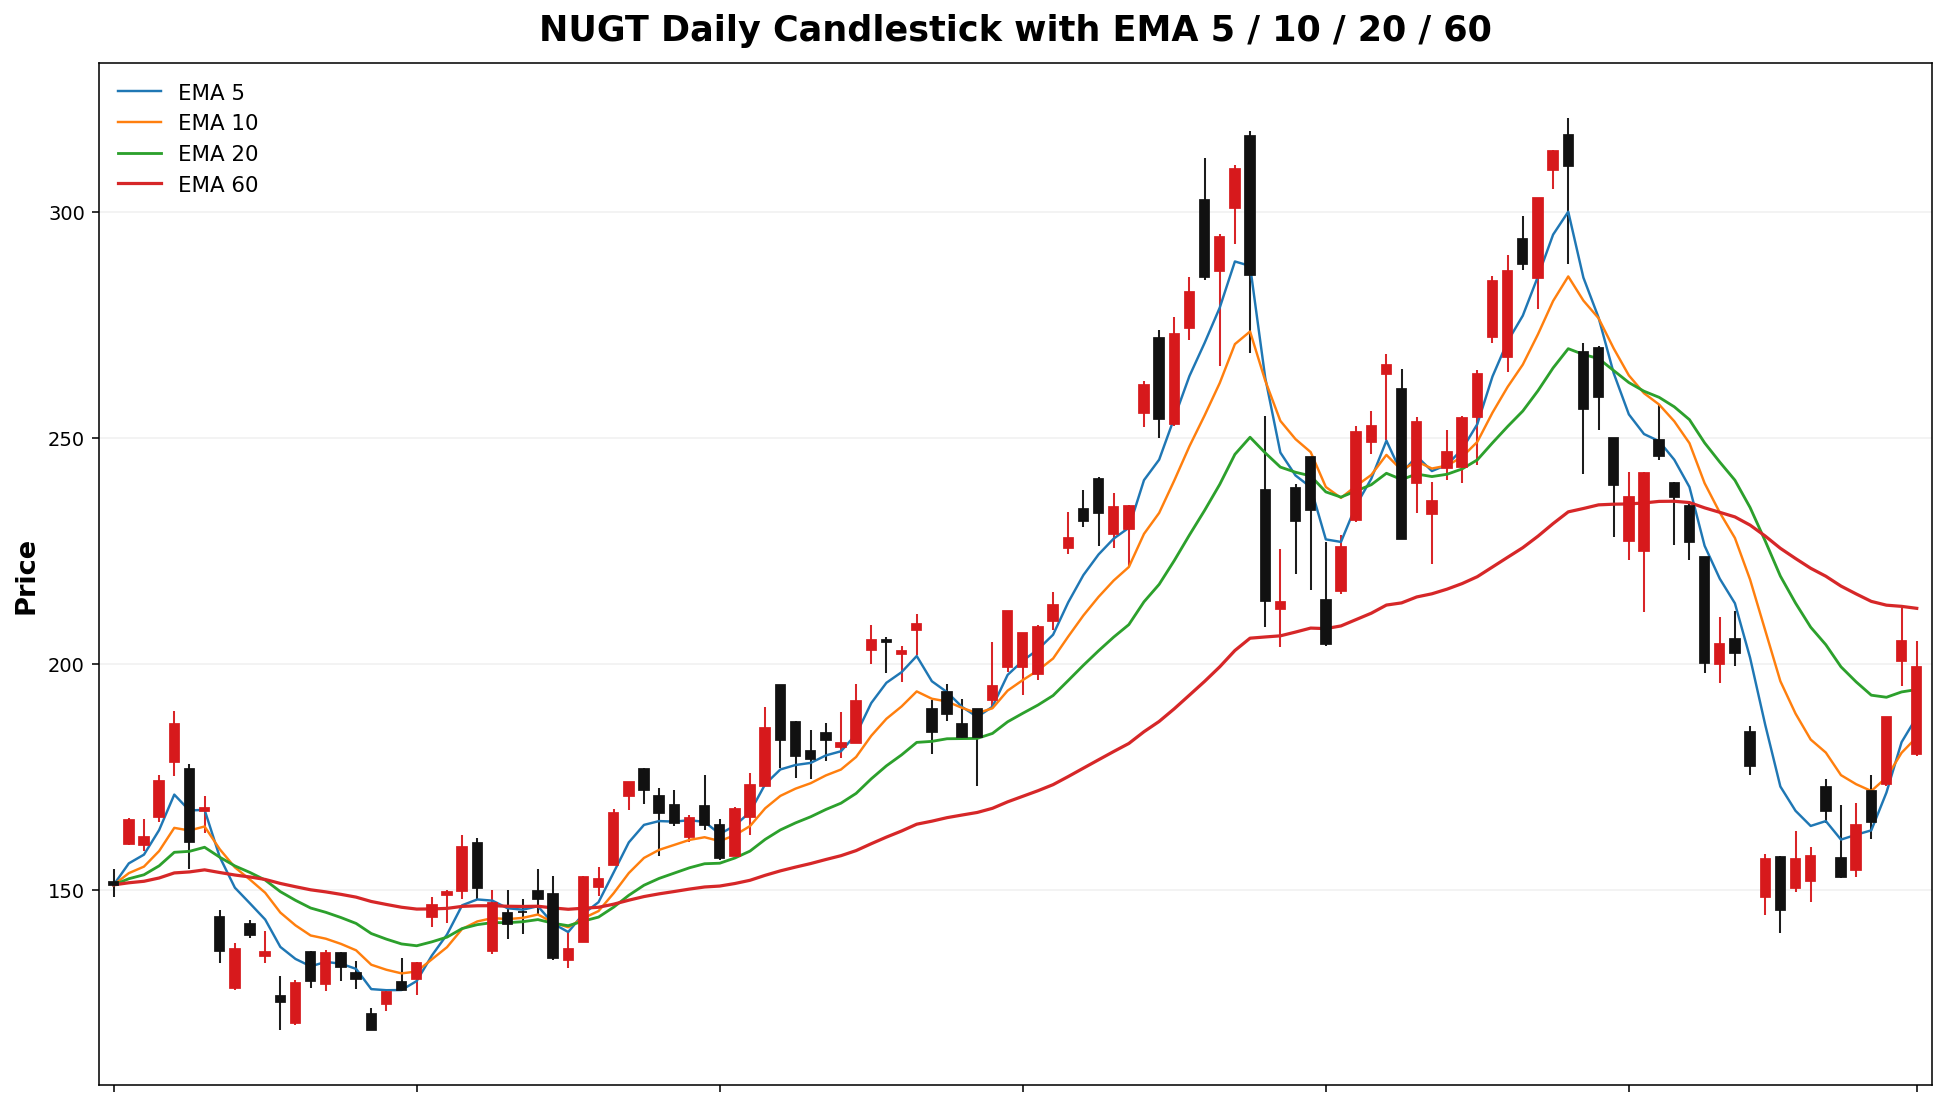
& Probability Dashboard
Metric |
Value |
Interpretation |
|---|
Breakout Up |
32.2% |
close above upper band |
Breakout Down |
16.1% |
close below lower band |
Put/Call Volume |
1.01 |
directional flow |
Put/Call OI |
0.63 |
positioning bias |
Total Option Volume |
155,198 |
nearest expiry |
Total Open Interest |
134,385 |
nearest expiry |
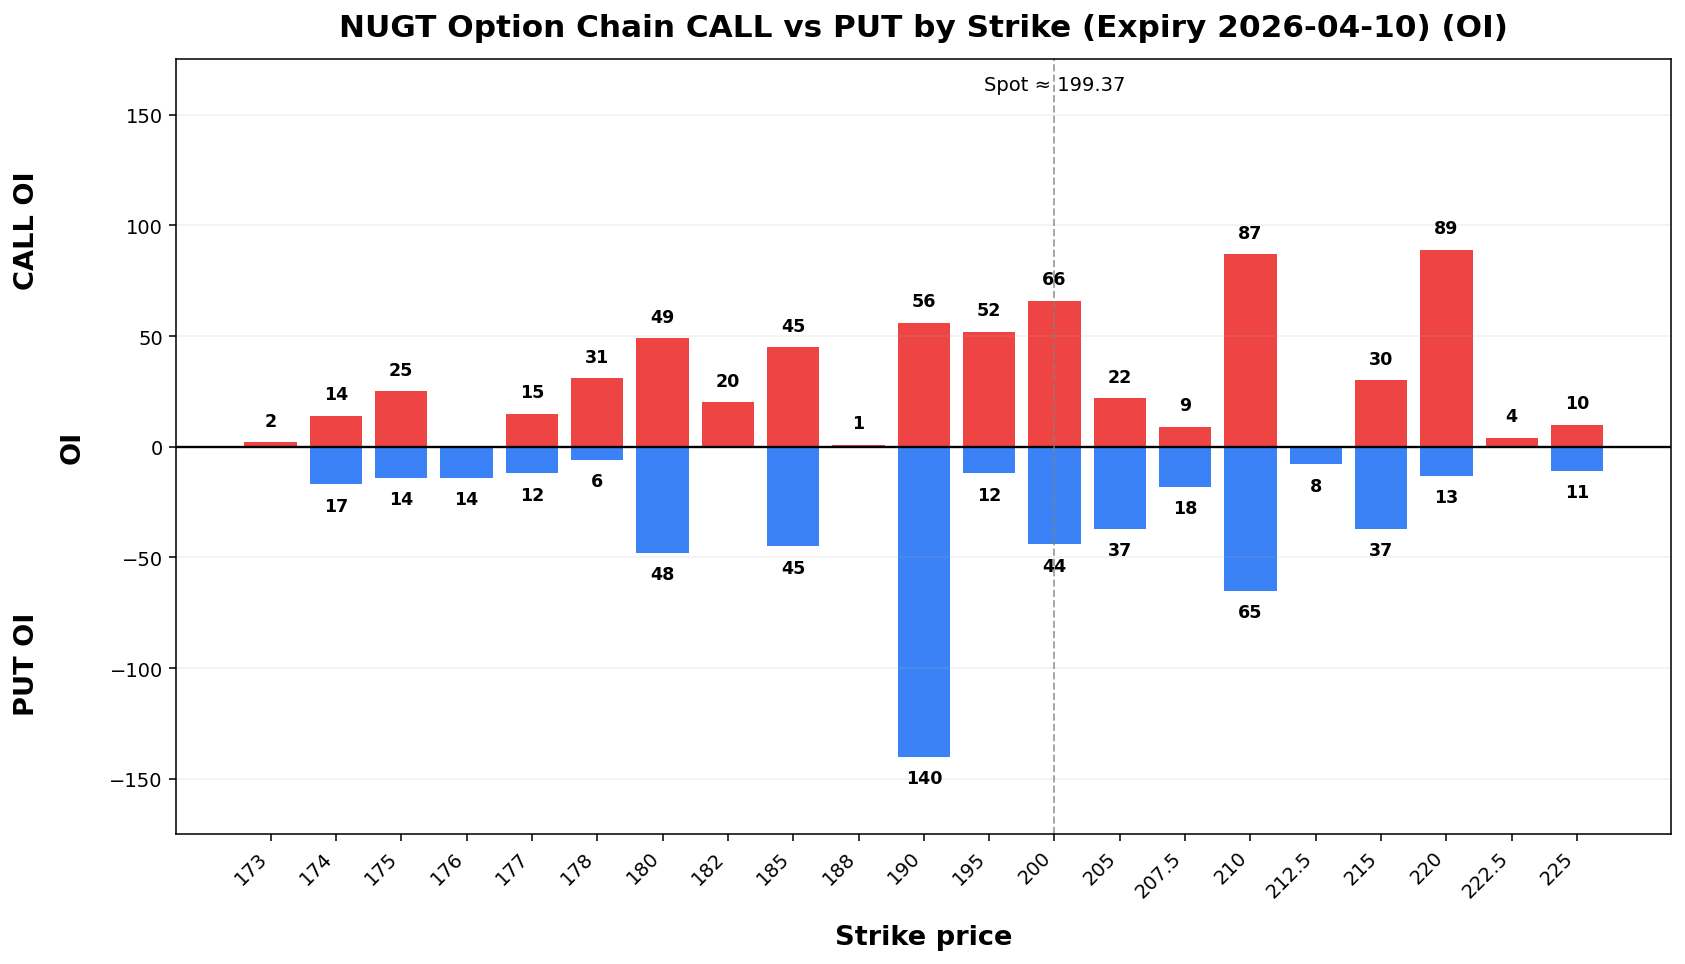
Term Structure
Leg |
Expiry |
DTE |
Forward |
ATM IV |
ATM Straddle |
|---|
E1 |
2026-04-10 |
6 |
50.40199.97 |
55.51%101.87% |
24.65 |
E2 |
2026-04-17 |
13 |
50.43200.03 |
53.09%98.21% |
36.05 |
DistributionWeekly Range
| Confidence |
Low |
High |
Width |
| 68% |
171.23 |
227.51 |
56.29 |
| 80% |
163.30 |
235.44 |
72.14 |
| 90% |
153.08 |
245.66 |
92.59 |
| 95% |
144.21 |
254.53 |
110.32 |
Structure & Probabilities
| Support |
Resistance |
Gamma Flip |
Max Pain |
P>Res |
P<Sup |
| 190.00 |
200.00 |
191.69 |
185.00 |
40.3% |
36.3% |
Flow & Skew
| Call Vol |
Put Vol |
Vol P/C |
Call OI |
Put OI |
OI P/C |
Skew |
Skew Bias |
| 516 |
601 |
1.16 |
1,319 |
1,506 |
1.14 |
19.41 vol pts |
PUT_SKEW |
Tail Risk
| Q10 |
MedianQ50 |
Q90 |
Down Tail |
AsymmetryUp Tail |
Down/Up |
| 158.73 |
199.68 |
236.31 |
40.64 |
36.94 |
1.10 |
Daily Technicals
| EMA20 |
EMA50 |
VWAP20 |
BB Lower |
BB Mid |
BB Upper |
BB Width |
Vol Ratio |
Path |
| 194.33 |
211.76 |
184.94 |
125.19 |
191.63 |
258.06 |
69.33% |
0.93 |
Sideways / Range |
Day Plan
- 190.00-200.00 range: fade extremes
- > 200.00: chase only if hold + vol
- < 190.00: risk expand; reduce size
- Regime: TRANSITION
- Tech: Sideways / Range
Swing Plan
- Accumulate: 190.00-190.00
- Trim: 200.00-200.00
- Add: close > 200.00
- Cut: close < 190.00
- Best for: transition regime
Raw Text Summary
📌 NUGT @ 199.37 (2026-04-05 06:51 PM MYT)

• Current price is **199.37**. Key support is around **190.00**, and resistance is around **200.00**.
• For the next week, the model’s **68% expected range** is roughly **171.23 to 227.51**.
• A wider **90% range** is about **153.08 to 245.66**.
• Dealer positioning looks **LONG gamma**, so the market behavior is classified as **TRANSITION**.
• The estimated **gamma flip** is near **191.69**. Crossing and holding beyond this area can change the trading behavior.
• Approximate breakout odds: **above resistance 40.3%**, **below support 36.3%** by the target horizon.
• Options skew is tilted toward **puts**, which suggests traders are paying more for downside protection.
• Near-term implied volatility is higher than the next expiry (**IV1 101.87% vs IV2 98.21%**), which suggests **near-term event stress / backwardation**.
• On the daily chart, the stock currently looks like **Sideways / Range**.
• The implied distribution shows **heavier downside tail risk** than upside tail potential.
LABU
Spot: 171.64
Report Time: 2026-04-05 06:51 PM MYT
Regime: TRANSITION
Dealer Gamma: LONG
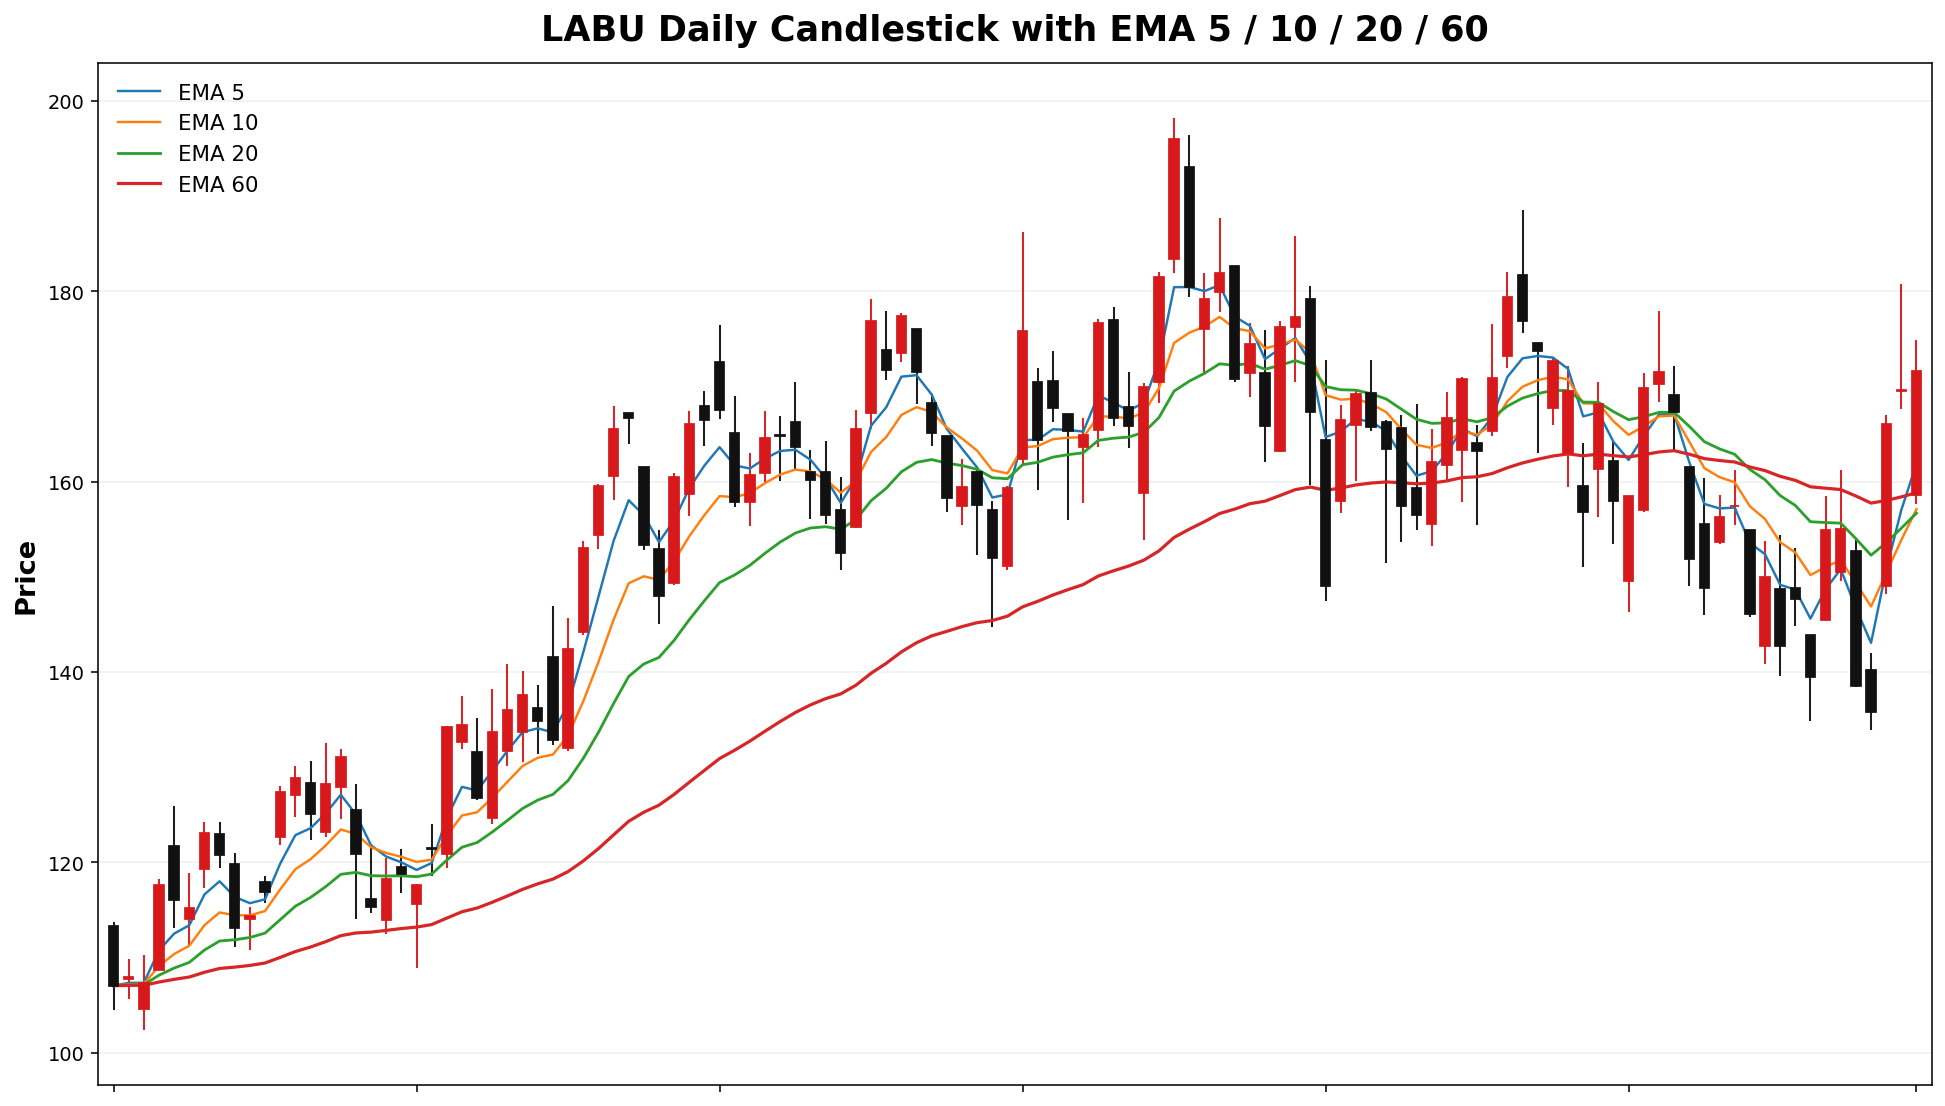
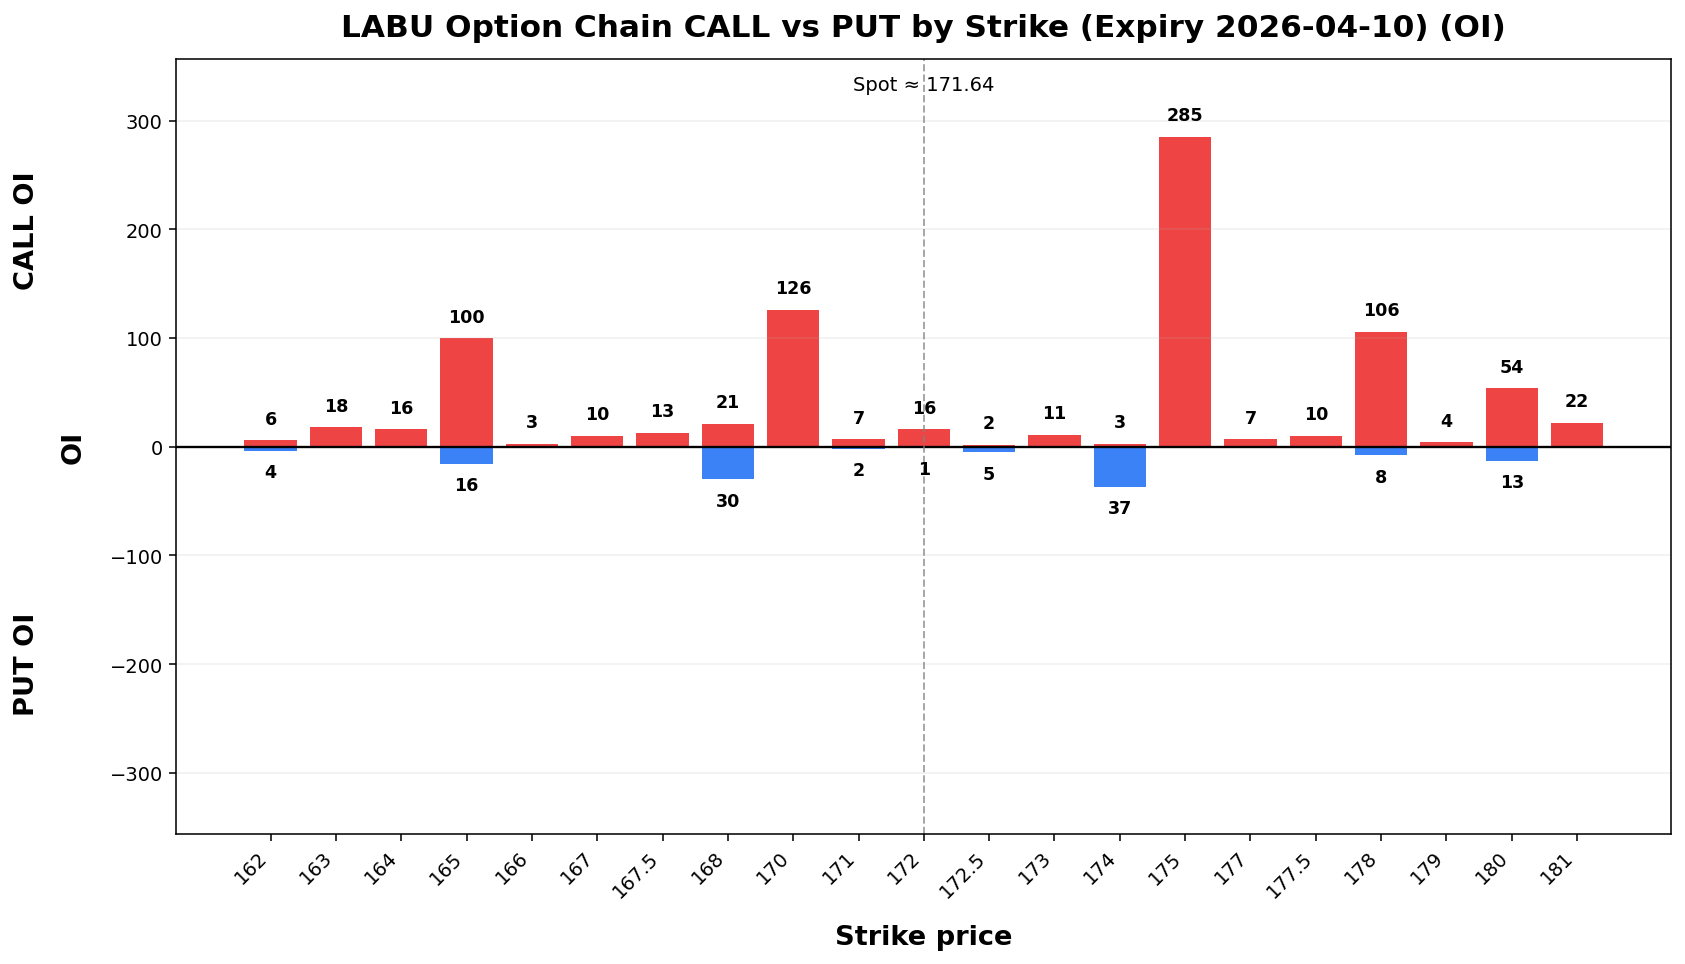
Term Structure
| Expiry |
DTE |
Forward |
ATM IV |
ATM Straddle |
| 2026-04-10 |
6 |
170.81 |
93.84% |
19.55 |
| 2026-04-17 |
13 |
170.50 |
92.25% |
29.15 |
Weekly Range
| Confidence |
Low |
High |
Width |
| 68% |
149.13 |
194.15 |
45.03 |
| 80% |
142.79 |
200.49 |
57.70 |
| 90% |
134.61 |
208.67 |
74.06 |
| 95% |
127.51 |
215.77 |
88.25 |
Structure & Probabilities
| Support |
Resistance |
Gamma Flip |
Max Pain |
P>Res |
P<Sup |
| 170.00 |
175.00 |
137.78 |
151.00 |
36.2% |
46.2% |
Flow & Skew
| Call Vol |
Put Vol |
Vol P/C |
Call OI |
Put OI |
OI P/C |
Skew |
Skew Bias |
| 590 |
1,029 |
1.74 |
2,345 |
1,835 |
0.78 |
23.17 vol pts |
PUT_SKEW |
Tail Risk
| Q10 |
Q50 |
Q90 |
Down Tail |
Up Tail |
Down/Up |
| 140.87 |
170.79 |
196.94 |
30.77 |
25.30 |
1.22 |
Daily Technicals
| EMA20 |
EMA50 |
VWAP20 |
BB Lower |
BB Mid |
BB Upper |
BB Width |
Vol Ratio |
Path |
| 156.69 |
159.00 |
155.17 |
131.95 |
154.97 |
177.98 |
29.70% |
0.98 |
Sideways / Range |
Day Plan
- 170.00-175.00 range: fade extremes
- > 175.00: chase only if hold + vol
- < 170.00: risk expand; reduce size
- Regime: TRANSITION
- Tech: Sideways / Range
Swing Plan
- Accumulate: 170.00-170.00
- Trim: 175.00-175.00
- Add: close > 175.00
- Cut: close < 170.00
- Best for: transition regime
Raw Text Summary
📌 LABU @ 171.64 (25ΔP-25ΔC)2026-04-05 06:51 PM MYT)

• Current price is **171.64**. Key support is around **170.00**, and resistance is around **175.00**.
• For the next week, the model’s **68% expected range** is roughly **149.13 to 194.15**.
• A wider **90% range** is about **134.61 to 208.67**.
• Dealer positioning looks **LONG gamma**, so the market behavior is classified as **TRANSITION**.
• The estimated **gamma flip** is near **137.78**. Crossing and holding beyond this area can change the trading behavior.
• Approximate breakout odds: **above resistance 36.2%**, **below support 46.2%** by the target horizon.
• Options skew is tilted toward **puts**, which suggests traders are paying more for downside protection.
• Near-term implied volatility is higher than the next expiry (**IV1 93.84% vs IV2 92.25%**), which suggests **near-term event stress / backwardation**.
• On the daily chart, the stock currently looks like **Sideways / Range**.
• The implied distribution shows **heavier downside tail risk** than upside tail potential.
EWY
Spot: 122.87
Report Time: 2026-04-05 06:51 PM MYT
Regime: TREND
Dealer Gamma: SHORT
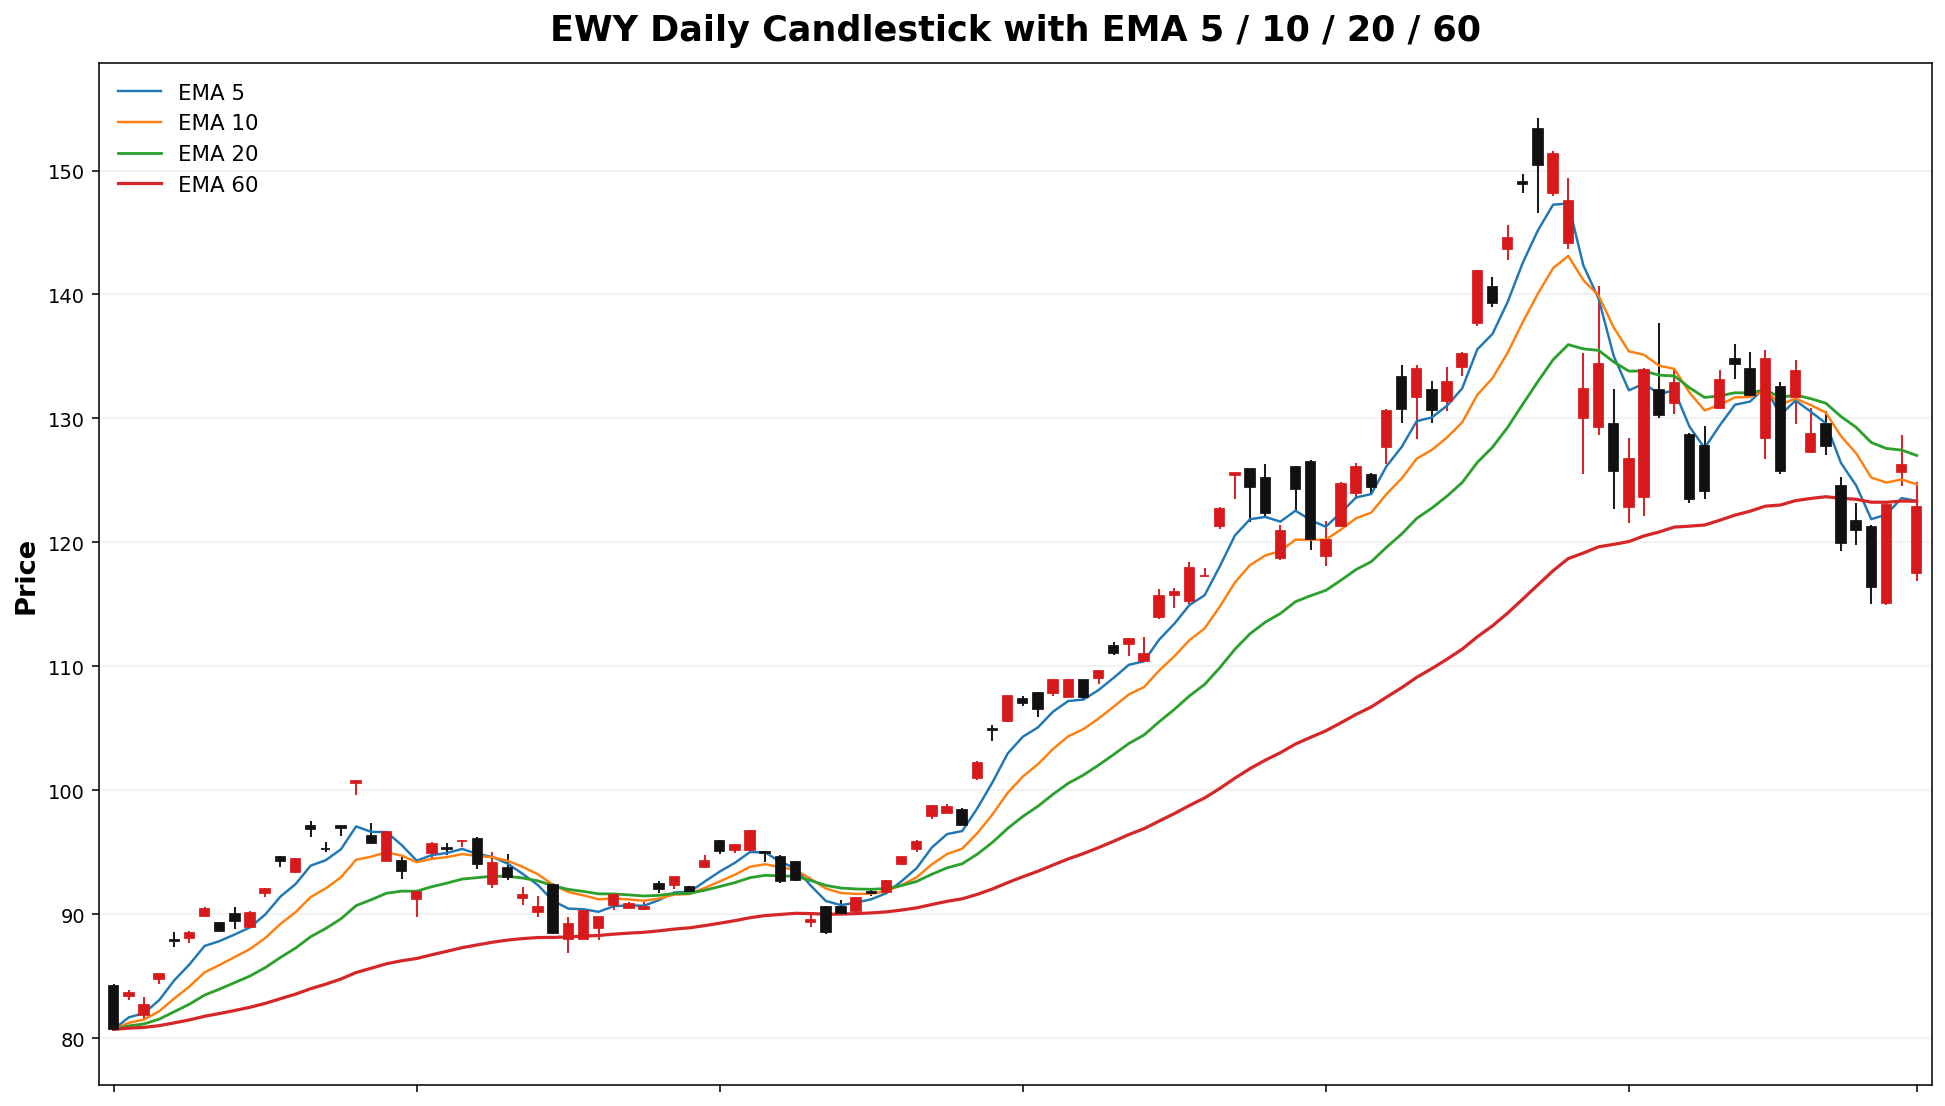
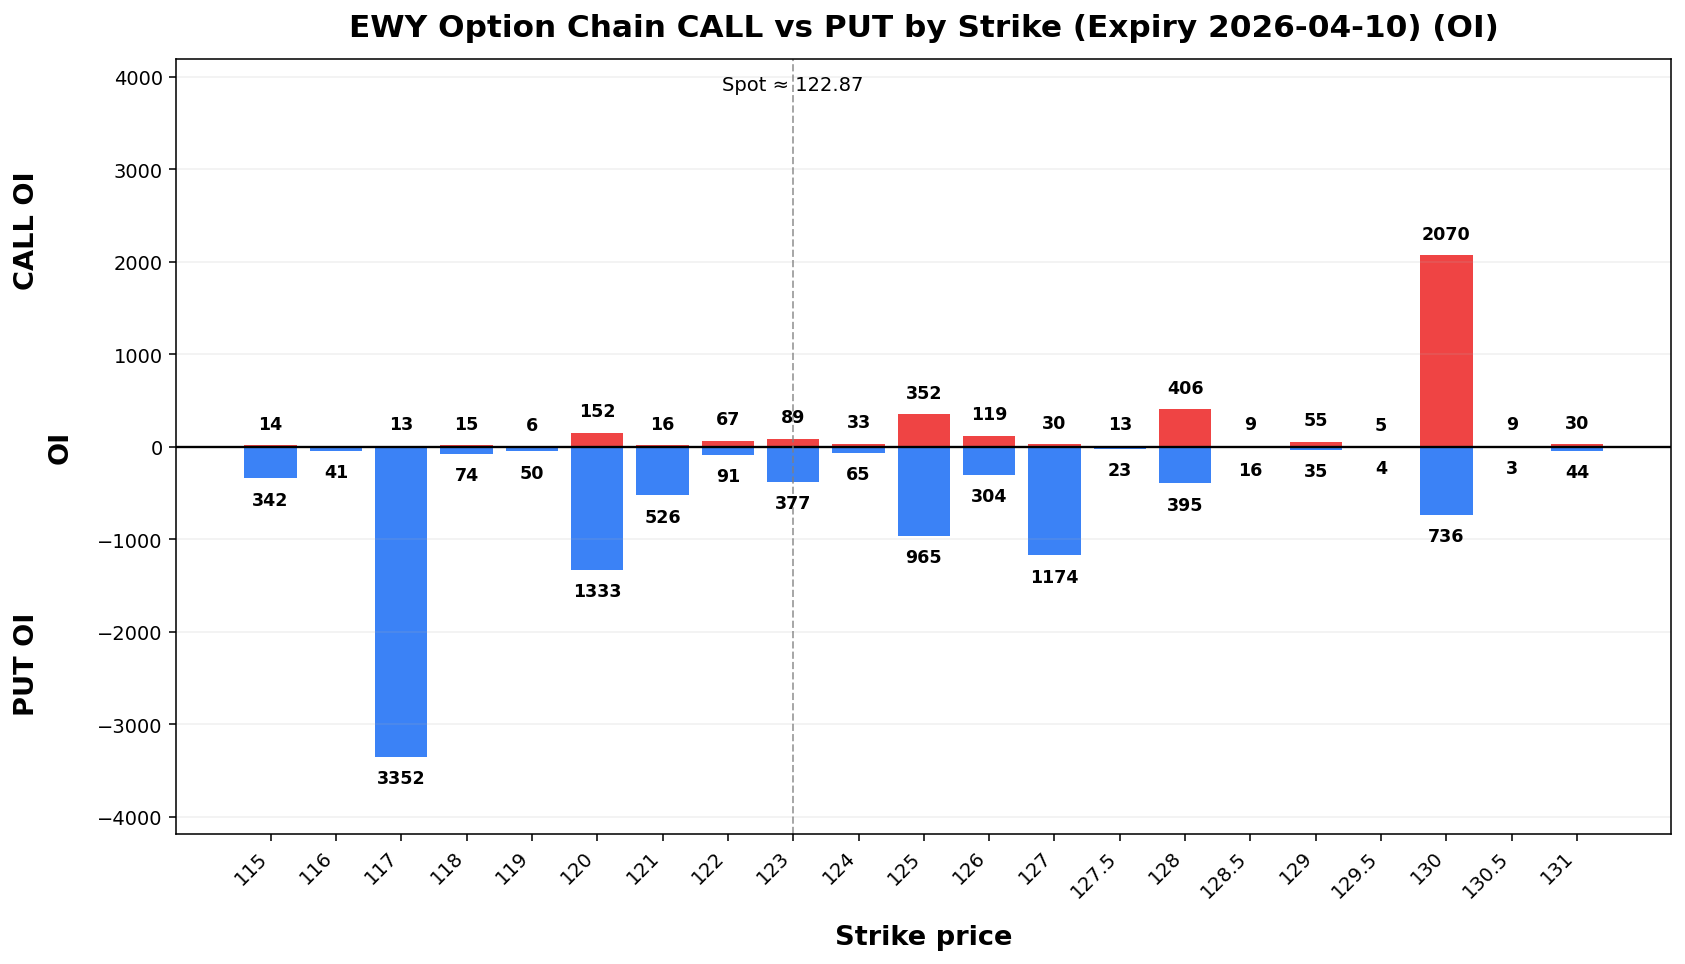
Term Structure
| Expiry |
DTE |
Forward |
ATM IV |
ATM Straddle |
| 2026-04-10 |
6 |
122.92 |
60.69% |
9.05 |
| 2026-04-17 |
13 |
122.89 |
53.93% |
12.20 |
Weekly Range
| Confidence |
Low |
High |
Width |
| 68% |
112.88 |
132.86 |
19.98 |
| 80% |
110.07 |
135.67 |
25.60 |
| 90% |
106.44 |
139.30 |
32.86 |
| 95% |
103.29 |
142.45 |
39.15 |
Structure & Probabilities
| Support |
Resistance |
Gamma Flip |
Max Pain |
P>Res |
P<Sup |
| 120.00 |
125.00 |
135.02 |
130.00 |
42.9% |
47.8% |
Flow & Skew
| Call Vol |
Put Vol |
Vol P/C |
Call OI |
Put OI |
OI P/C |
Skew |
Skew Bias |
| 3,235 |
3,208 |
0.99 |
7,541 |
22,558 |
2.99 |
8.20 vol pts |
PUT_SKEW |
Tail Risk
| Q10 |
Q50 |
Q90 |
Down Tail |
Up Tail |
Down/Up |
| 109.05 |
124.41 |
135.69 |
13.82 |
12.82 |
1.08 |
Daily Technicals
| EMA20 |
EMA50 |
VWAP20 |
BB Lower |
BB Mid |
BB Upper |
BB Width |
Vol Ratio |
Path |
| 127.01 |
125.06 |
127.49 |
116.64 |
127.56 |
138.48 |
17.12% |
0.64 |
Sideways / Range |
Day Plan
- 120.00-125.00 range: fade extremes
- > 125.00: chase only if hold + vol
- < 120.00: risk expand; reduce size
- Regime: TREND
- Tech: Sideways / Range
Swing Plan
- Accumulate: 120.00-120.00
- Trim: 125.00-125.00
- Add: close > 125.00
- Cut: close < 120.00
- Best for: trend regime
Raw Text Summary
📌 EWY @ 122.87 (2026-04-05 06:51 PM MYT)

• Current price is **122.87**. Key support is around **120.00**, and resistance is around **125.00**.
• For the next week, the model’s **68% expected range** is roughly **112.88 to 132.86**.
• A wider **90% range** is about **106.44 to 139.30**.
• Dealer positioning looks **SHORT gamma**, so the market behavior is classified as **TREND**.
• The estimated **gamma flip** is near **135.02**. Crossing and holding beyond this area can change the trading behavior.
• Approximate breakout odds: **above resistance 42.9%**, **below support 47.8%** by the target horizon.
• Options skew is tilted toward **puts**, which suggests traders are paying more for downside protection.
• Near-term implied volatility is higher than the next expiry (**IV1 60.69% vs IV2 53.93%**), which suggests **near-term event stress / backwardation**.
• Recent volume is only **0.64x** the 20-day average, so breakouts may be less reliable unless volume improves.
• On the daily chart, the stock currently looks like **Sideways / Range**.
• The implied distribution is **fairly balanced** between upside and downside tails.
PBF
Spot: 45.39
Report Time: 2026-04-05 06:52 PM MYT
Regime: TRANSITION
Dealer Gamma: LONG
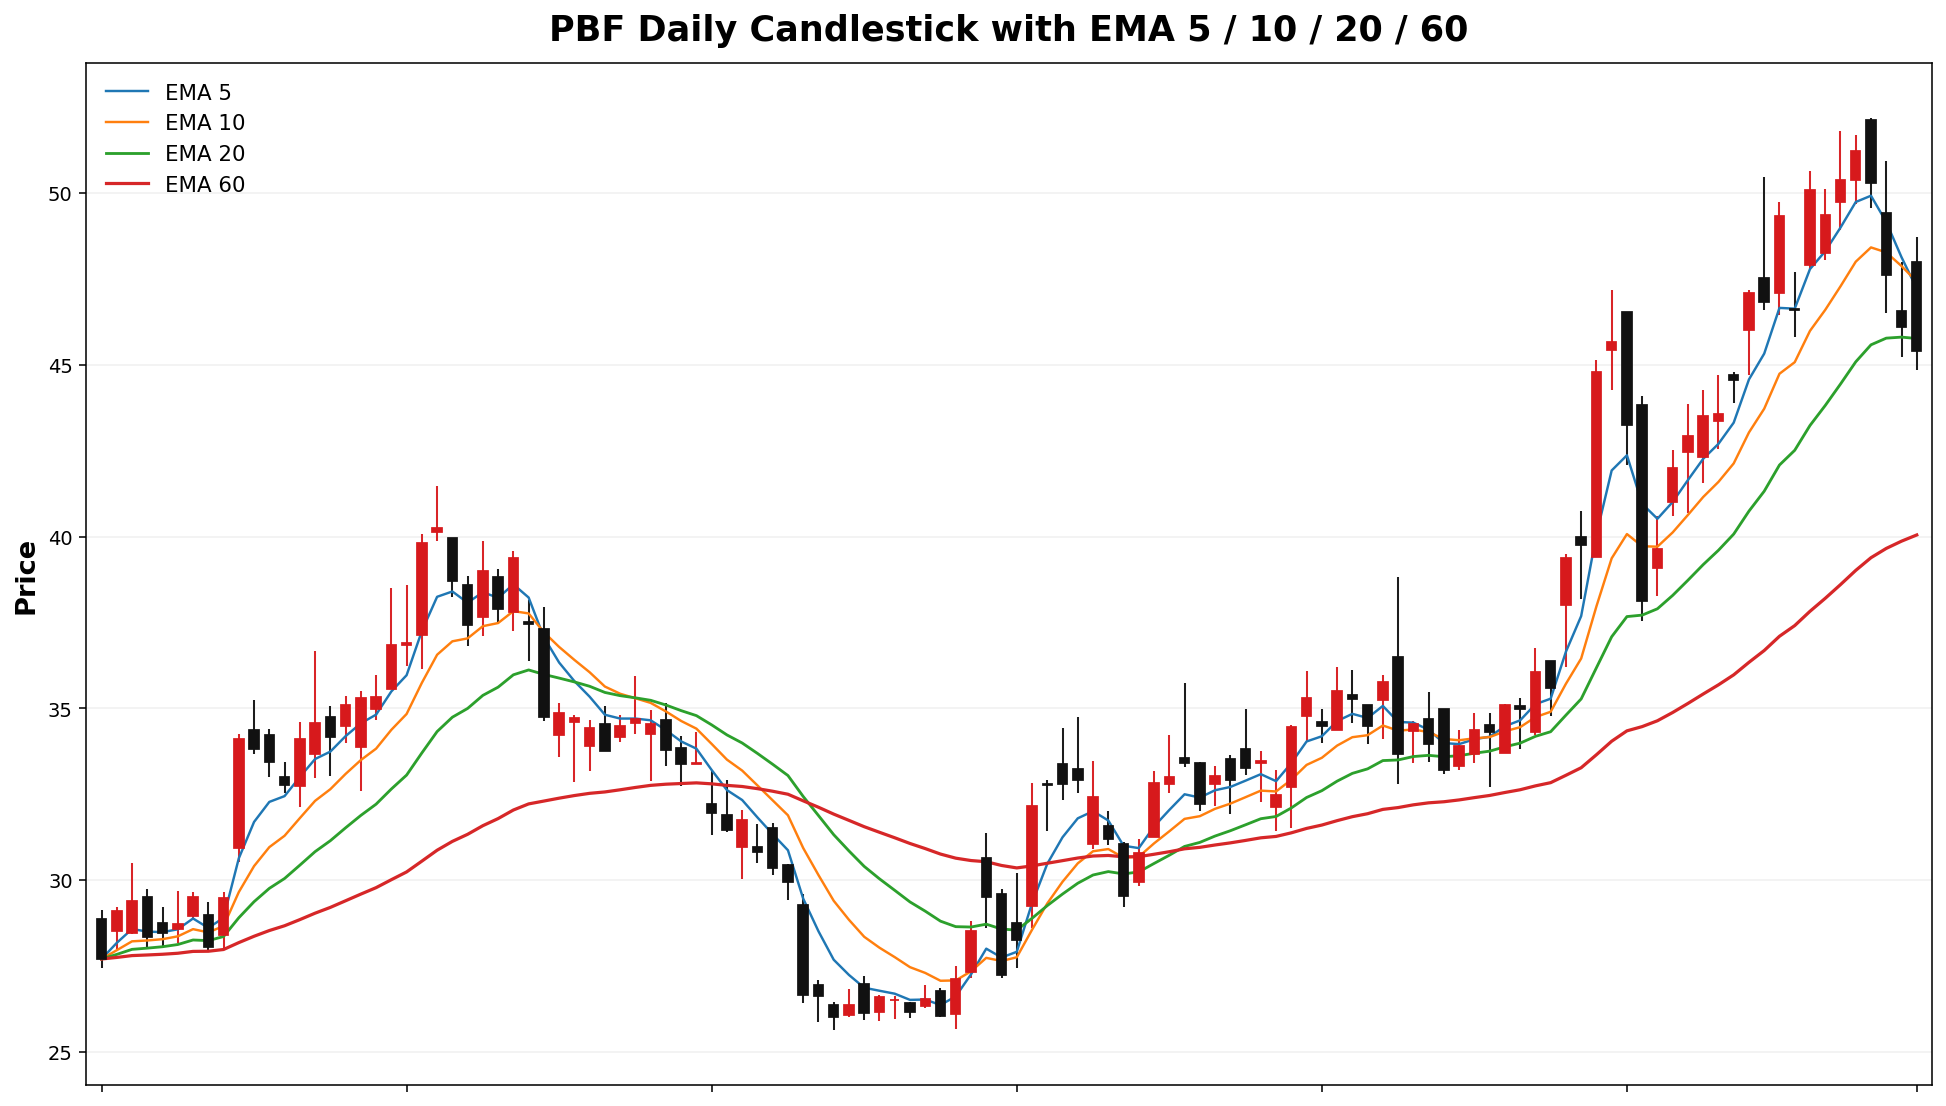
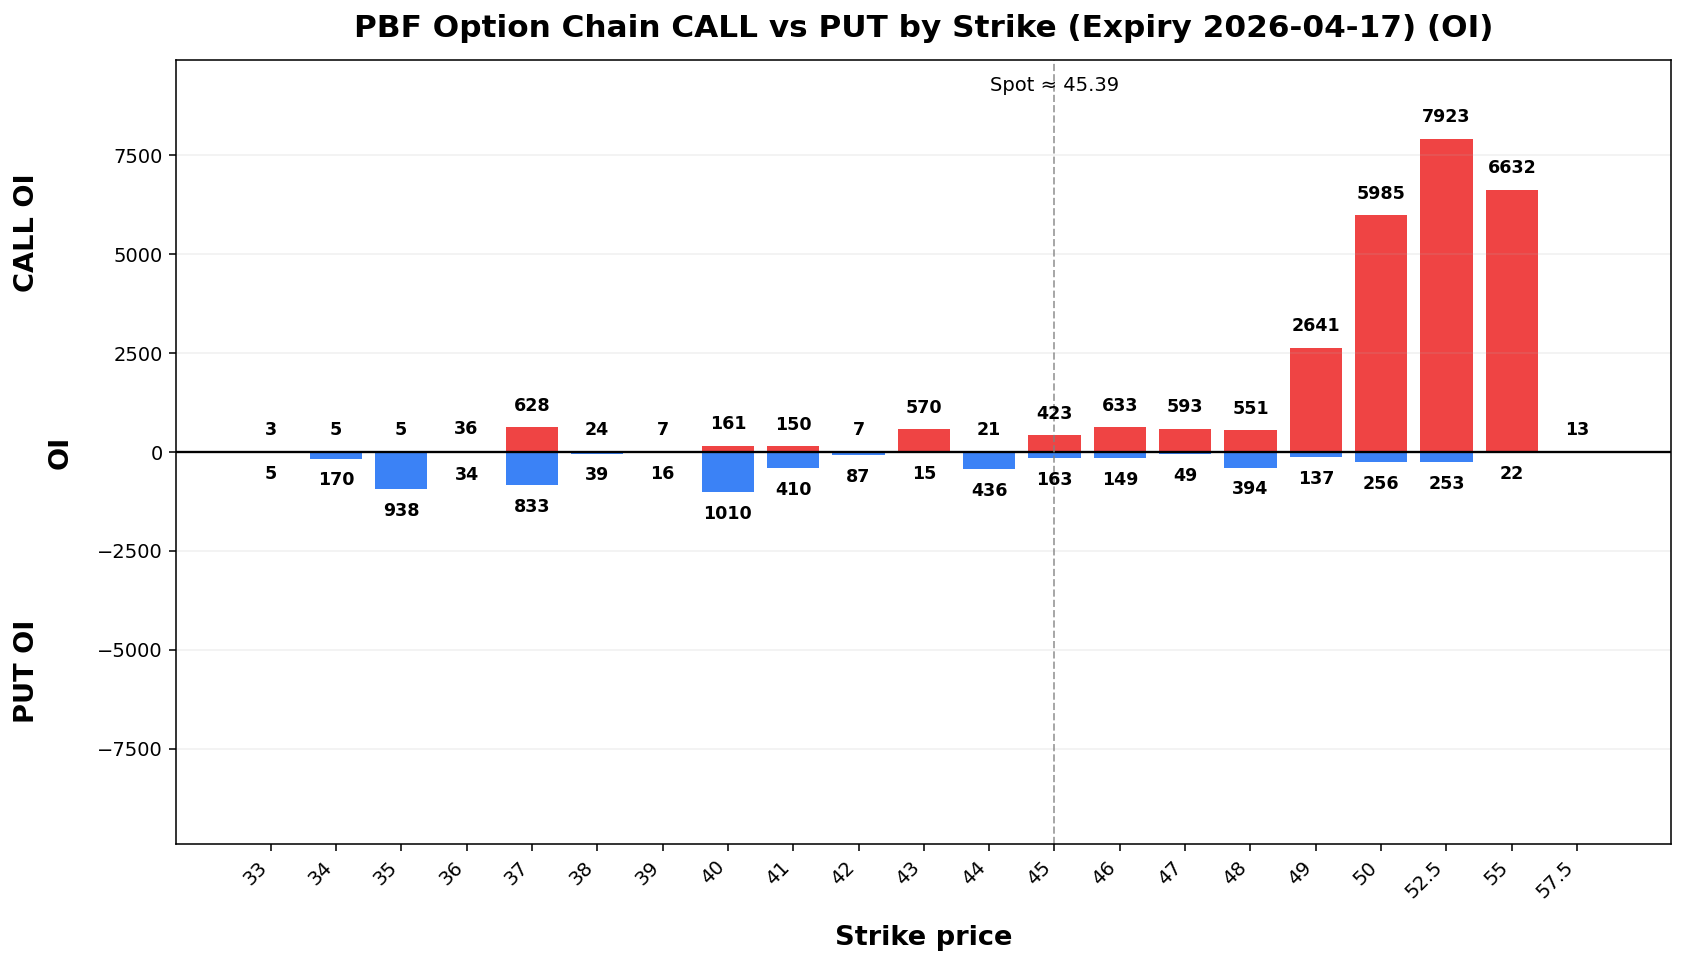
Term Structure
| Expiry |
DTE |
Forward |
ATM IV |
ATM Straddle |
| 2026-04-17 |
13 |
45.21 |
65.82% |
5.50 |
| 2026-05-15 |
41 |
45.41 |
63.61% |
9.60 |
Weekly Range
| Confidence |
Low |
High |
Width |
| 68% |
41.04 |
49.74 |
8.69 |
| 80% |
39.82 |
50.96 |
11.14 |
| 90% |
38.24 |
52.54 |
14.30 |
| 95% |
36.87 |
53.91 |
17.04 |
Structure & Probabilities
| Support |
Resistance |
Gamma Flip |
Max Pain |
P>Res |
P<Sup |
40.4500 |
50.0749.00 |
55.9538.31 |
1.7844.00 |
-1.4616.9% |
volpts8.9% |
ExecutiveFlow Summary& Skew
| Call Vol |
Put Vol |
Vol P/C |
Call OI |
Put OI |
OI P/C |
Skew |
Skew Bias |
| 660 |
486 |
0.74 |
29,374 |
16,114 |
0.55 |
-1.27 vol pts |
CALL_SKEW |
Tail Risk
| Q10 |
Q50 |
Q90 |
Down Tail |
Up Tail |
Down/Up |
| 35.44 |
44.82 |
53.98 |
9.95 |
8.59 |
1.16 |
Daily Technicals
| EMA20 |
EMA50 |
VWAP20 |
BB Lower |
BB Mid |
BB Upper |
BB Width |
Vol Ratio |
Path |
| 45.77 |
41.09 |
45.77 |
38.51 |
45.89 |
53.27 |
32.16% |
0.62 |
Sideways / Range |
Day Plan
这周大概率在 46.5–54.3 区间来回走。
极端情况下可能到 44.0 或 56.8 附近。
48 是关键支撑(收盘跌破,下行风险会变大)。
50 是关键压力(收盘站上去才算转强)。
目前在分界线(约 44.86)上方;跌破它会更危险。
市场更倾向突破压力,而不是跌破支撑。
Trade Plans
Day Trade Plan
50-5240.00-49.00 range: fade extremes- >
50:49.00: chase only if hold + vol
- <
48:40.00: risk expand; reduce size
- Regime: TRANSITION
- Tech:
UPSideways bias/ Range
Swing Trade Plan
- Accumulate:
48-5040.00-40.00
- Trim:
50.0-5049.00-49.00
- Add: close >
5049.00
- Cut: close <
4840.00
- Best for: transition regime
GeneratedRaw Text Summary
📌 PBF @ 45.39 (2026-04-05 06:52 PM MYT)

• Current price is **45.39**. Key support is around **40.00**, and resistance is around **49.00**.
• For the next week, the model’s **68% expected range** is roughly **41.04 to 49.74**.
• A wider **90% range** is about **38.24 to 52.54**.
• Dealer positioning looks **LONG gamma**, so the market behavior is classified as **TRANSITION**.
• The estimated **gamma flip** is near **38.31**. Crossing and holding beyond this area can change the trading behavior.
• Approximate breakout odds: **above resistance 16.9%**, **below support 8.9%** by stocks-automationthe target horizon.
• Options skew is fairly balanced, so there is **no strong directional bias** from skew alone.
• Near-term implied volatility is higher than the next expiry (Markdown**IV1 edition)
65.82% vs IV2 63.61%**), which suggests **near-term event stress / backwardation**.
• Recent volume is only **0.62x** the 20-day average, so breakouts may be less reliable unless volume improves.
• On the daily chart, the stock currently looks like **Sideways / Range**.
• The implied distribution shows **heavier downside tail risk** than upside tail potential.
CRDO
Spot: 101.45
Report Time: 2026-04-05 06:52 PM MYT
Regime: TRANSITION
Dealer Gamma: LONG
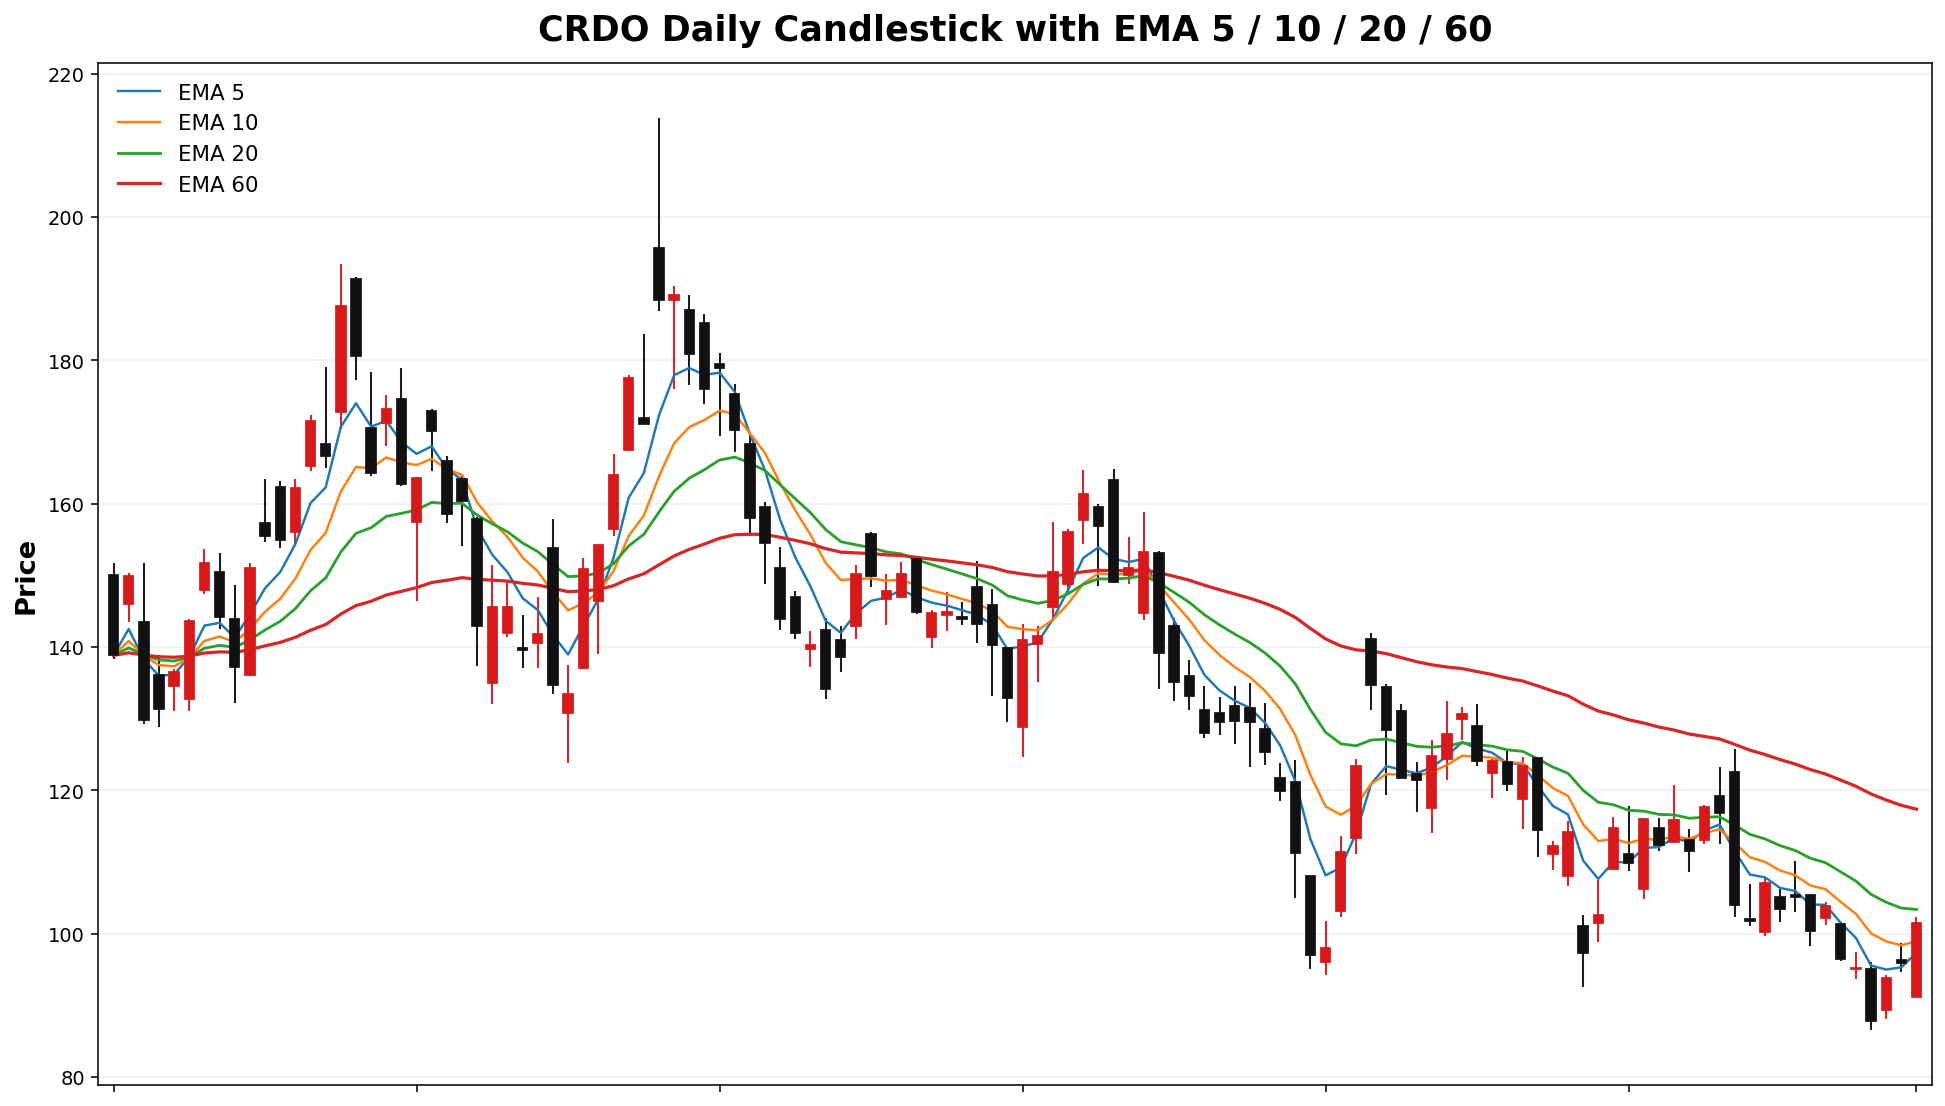
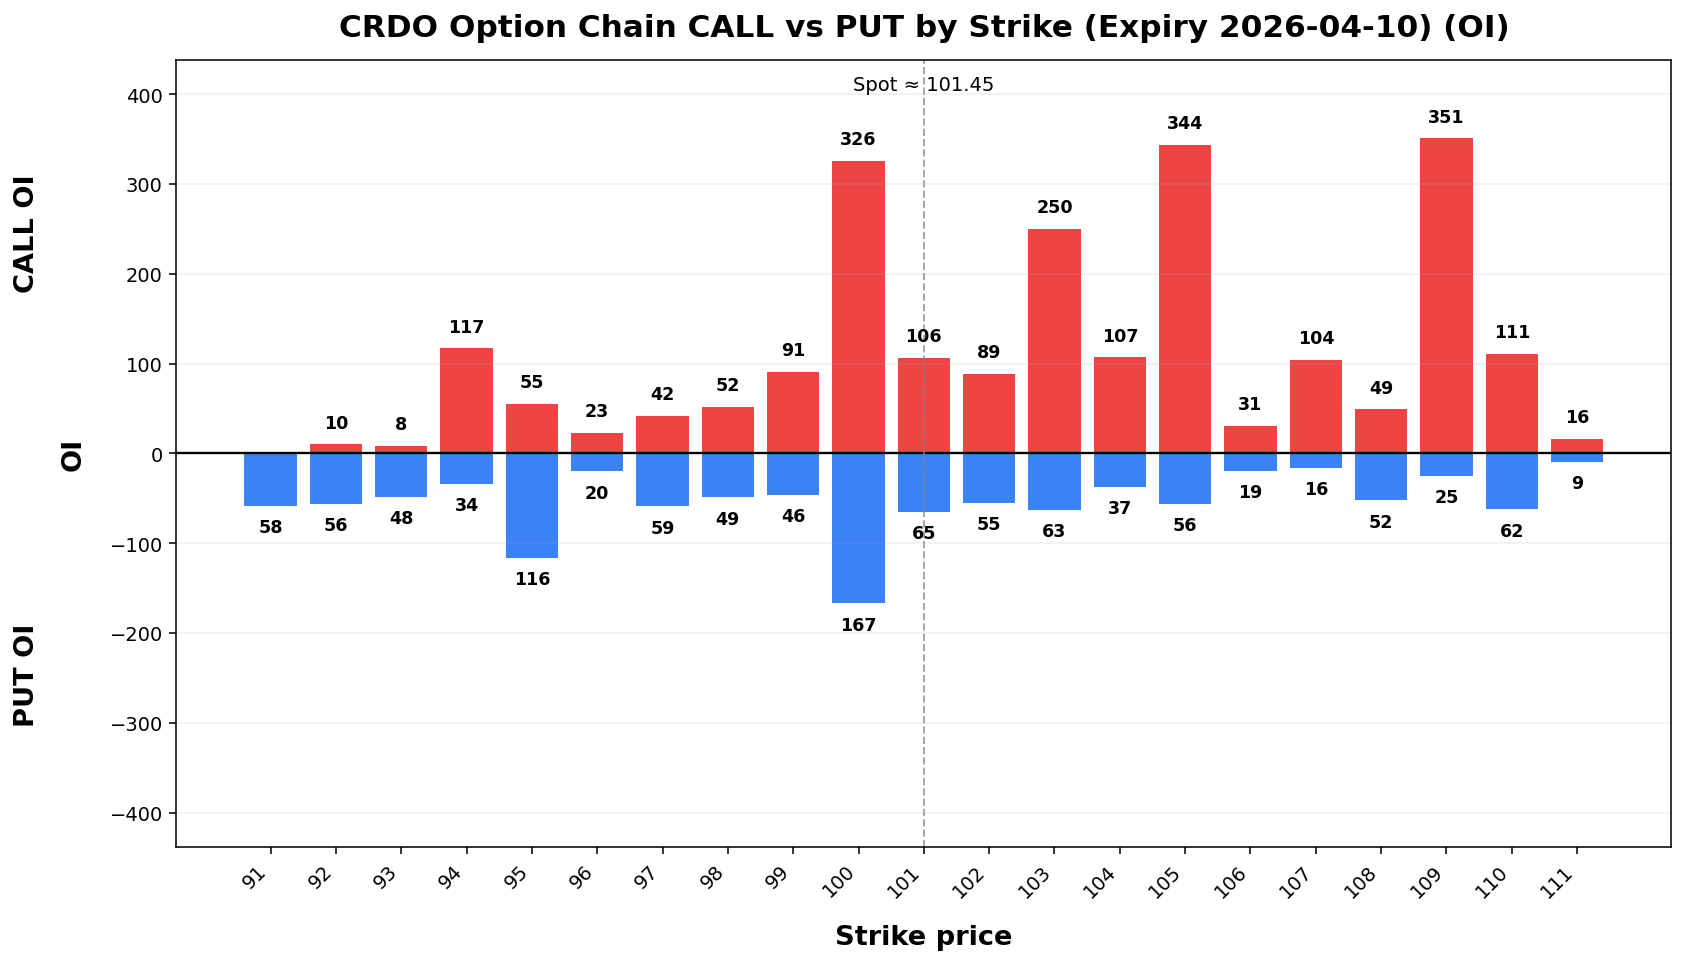
Term Structure
| Expiry |
DTE |
Forward |
ATM IV |
ATM Straddle |
| 2026-04-10 |
6 |
101.87 |
75.12% |
9.25 |
| 2026-04-17 |
13 |
101.77 |
71.74% |
13.40 |
Weekly Range
| Confidence |
Low |
High |
Width |
| 68% |
90.93 |
111.97 |
21.04 |
| 80% |
87.97 |
114.93 |
26.96 |
| 90% |
84.15 |
118.75 |
34.60 |
| 95% |
80.84 |
122.06 |
41.23 |
Structure & Probabilities
| Support |
Resistance |
Gamma Flip |
Max Pain |
P>Res |
P<Sup |
| 100.00 |
103.00 |
92.60 |
102.00 |
33.7% |
40.6% |
Flow & Skew
| Call Vol |
Put Vol |
Vol P/C |
Call OI |
Put OI |
OI P/C |
Skew |
Skew Bias |
| 2,517 |
1,185 |
0.47 |
4,679 |
2,899 |
0.62 |
6.69 vol pts |
PUT_SKEW |
Tail Risk
| Q10 |
Q50 |
Q90 |
Down Tail |
Up Tail |
Down/Up |
| 87.33 |
103.18 |
115.37 |
14.12 |
13.92 |
1.01 |
Daily Technicals
| EMA20 |
EMA50 |
VWAP20 |
BB Lower |
BB Mid |
BB Upper |
BB Width |
Vol Ratio |
Path |
| 103.37 |
114.45 |
105.86 |
87.74 |
104.83 |
121.91 |
32.59% |
0.76 |
DOWN trend (expanding) |
Day Plan
- 100.00-103.00 range: fade extremes
- > 103.00: chase only if hold + vol
- < 100.00: risk expand; reduce size
- Regime: TRANSITION
- Tech: DOWN trend (expanding)
Swing Plan
- Accumulate: 100.00-100.00
- Trim: 103.00-103.00
- Add: close > 103.00
- Cut: close < 100.00
- Best for: transition regime
Raw Text Summary
📌 CRDO @ 101.45 (2026-04-05 06:52 PM MYT)

• Current price is **101.45**. Key support is around **100.00**, and resistance is around **103.00**.
• For the next week, the model’s **68% expected range** is roughly **90.93 to 111.97**.
• A wider **90% range** is about **84.15 to 118.75**.
• Dealer positioning looks **LONG gamma**, so the market behavior is classified as **TRANSITION**.
• The estimated **gamma flip** is near **92.60**. Crossing and holding beyond this area can change the trading behavior.
• Approximate breakout odds: **above resistance 33.7%**, **below support 40.6%** by the target horizon.
• Options skew is tilted toward **puts**, which suggests traders are paying more for downside protection.
• Near-term implied volatility is higher than the next expiry (**IV1 75.12% vs IV2 71.74%**), which suggests **near-term event stress / backwardation**.
• Recent volume is only **0.76x** the 20-day average, so breakouts may be less reliable unless volume improves.
• On the daily chart, the stock currently looks like **DOWN trend (expanding)**.
• The implied distribution is **fairly balanced** between upside and downside tails.