Analysis Report
Updated: 2026-04-0512 18:52:2708:49:56 MYT
Source File: combined-summary-20260405-185212.20260412-084956.md
Screening Source: screen-report-20260405-161723.20260412-084653.md
Extracted Symbols: BNO,USO, TSEM,NBIS, USO,ASTS, BE, INTC, CRWV, AXTI, UCO, FLY, HUT, FORM, DOCN, ALAB, SEI, HYMC, PL, UCO,RDDT, NBIS, FSLY, SEDG, AA, AAOI, CRWV, DOCN, UVXY, GSAT, GUSH, SQQQ, BE, ASTS, SATS, BKSY, SOXL, VIAV,CRDO, RKLB, ALB,AGQ, AU,APLD, NUGT,BNO, LABU,OKLO, EWY,IREN, PBF,ETHU, CRDODPST, USD, LEU, NAIL, RH
Topline Summary
| Symbol |
Spot |
Support |
Resistance |
Flip |
Regime |
P>Res |
P<Sup |
68% Range |
90% Range |
BNOUSO |
54.12124.82 |
54.120.00 |
55.128.00 |
33.10123.00 |
TRANSITIONPIN |
45.1% |
40.36.6% |
45.39 - 62.85 |
39.76 - 68.48 |
TSEM |
197.80 |
180.00 |
200.00 |
173.50 |
TRANSITION |
34.4% |
18.0% |
176.60 - 219.00 |
162.93 - 232.67 |
USO |
137.92 |
135.00 |
140.00 |
117.44 |
TRANSITION |
44.6% |
35.26.8% |
119.66112.18 - 156.18137.46 |
107.88104.03 - 167.96 |
PL |
35.88 |
35.00 |
40.91 |
31.03 |
TREND |
17.6% |
57.2% |
30.85 - 40.91 |
27.145.61 - 44.15 |
UCO |
39.66 |
35.00 |
40.00 |
27.95 |
TRANSITION |
43.7% |
17.4% |
33.40 - 45.92 |
29.36 - 49.96 |
| NBIS |
108.82144.97 |
105.140.00 |
110.150.00 |
103.79 |
TRANSITION |
35.0% |
33.5% |
97.61 - 120.03 |
90.38 - 127.26 |
FSLY |
33.50 |
33.00 |
35.00 |
26.95 |
TRANSITION |
32.9% |
40.7% |
29.02 - 37.98 |
26.13 - 40.87 |
SEDG |
48.75 |
48.00 |
50.00 |
47.91 |
TREND |
46.3% |
50.2% |
43.09 - 54.41 |
39.44 - 58.06 |
AA |
71.53 |
71.00 |
72.00 |
59.108.71 |
TRANSITION |
35.3%30.5% |
41.9%36.6% |
65.23129.64 - 77.83160.30 |
61.17119.76 - 81.89170.18 |
AAOIASTS |
103.9194.90 |
90.00 |
95.00 |
93.25 |
PIN |
40.8% |
33.1% |
83.26 - 106.54 |
75.76 - 114.04 |
| BE |
166.70 |
160.00 |
175.00 |
133.61 |
TRANSITION |
27.6% |
36.0% |
147.04 - 186.36 |
134.36 - 199.04 |
| INTC |
62.38 |
60.00 |
65.00 |
47.54 |
TRANSITION |
25.8% |
27.1% |
56.92 - 67.84 |
53.39 - 71.37 |
| CRWV |
102.00 |
100.00 |
105.00 |
105.8985.25 |
TRANSITION |
36.2% |
47.1% |
90.91 - 113.09 |
83.77 - 120.23 |
| AXTI |
64.18 |
60.00 |
65.00 |
48.80 |
TRANSITION |
46.8% |
31.3% |
50.31 - 78.05 |
41.37 - 86.99 |
| UCO |
40.06 |
40.00 |
45.00 |
34.52 |
PIN |
13.9% |
37.8% |
35.25 - 44.87 |
32.15 - 47.97 |
| FLY |
37.54 |
37.00 |
40.00 |
NA |
TREND |
36.1% |
54.8% |
32.87 - 42.21 |
29.85 - 45.23 |
| HUT |
66.08 |
65.00 |
70.00 |
57.78 |
TRANSITION |
25.3% |
43.7% |
45.4%58.25 - 73.92 |
86.1353.20 - 121.69 |
74.66 - 133.1678.97 |
CRWVFORM |
82.24123.80 |
80.120.00 |
85.00135.17 |
79.6998.45 |
TRANSITION |
30.8%11.9% |
39.33.1% |
73.54112.43 - 90.94135.17 |
67.93105.11 - 96.55142.49 |
| DOCN |
90.0175.59 |
90.75.00 |
99.6078.00 |
71.92 |
TREND |
49.0% |
70.5% |
66.9066 - 84.52 |
60.91 - 90.27 |
| ALAB |
149.05 |
145.00 |
150.00 |
124.49 |
TRANSITION |
12.1%47.4% |
39.2% |
134.19 - 163.91 |
124.61 - 173.49 |
| SEI |
62.39 |
60.00 |
70.00 |
68.22 |
TREND |
14.4% |
42.2% |
54.97 - 69.81 |
50.19 - 74.59 |
| HYMC |
37.50 |
36.00 |
40.00 |
34.10 |
TRANSITION |
22.4% |
34.0% |
32.91 - 42.09 |
29.94 - 45.06 |
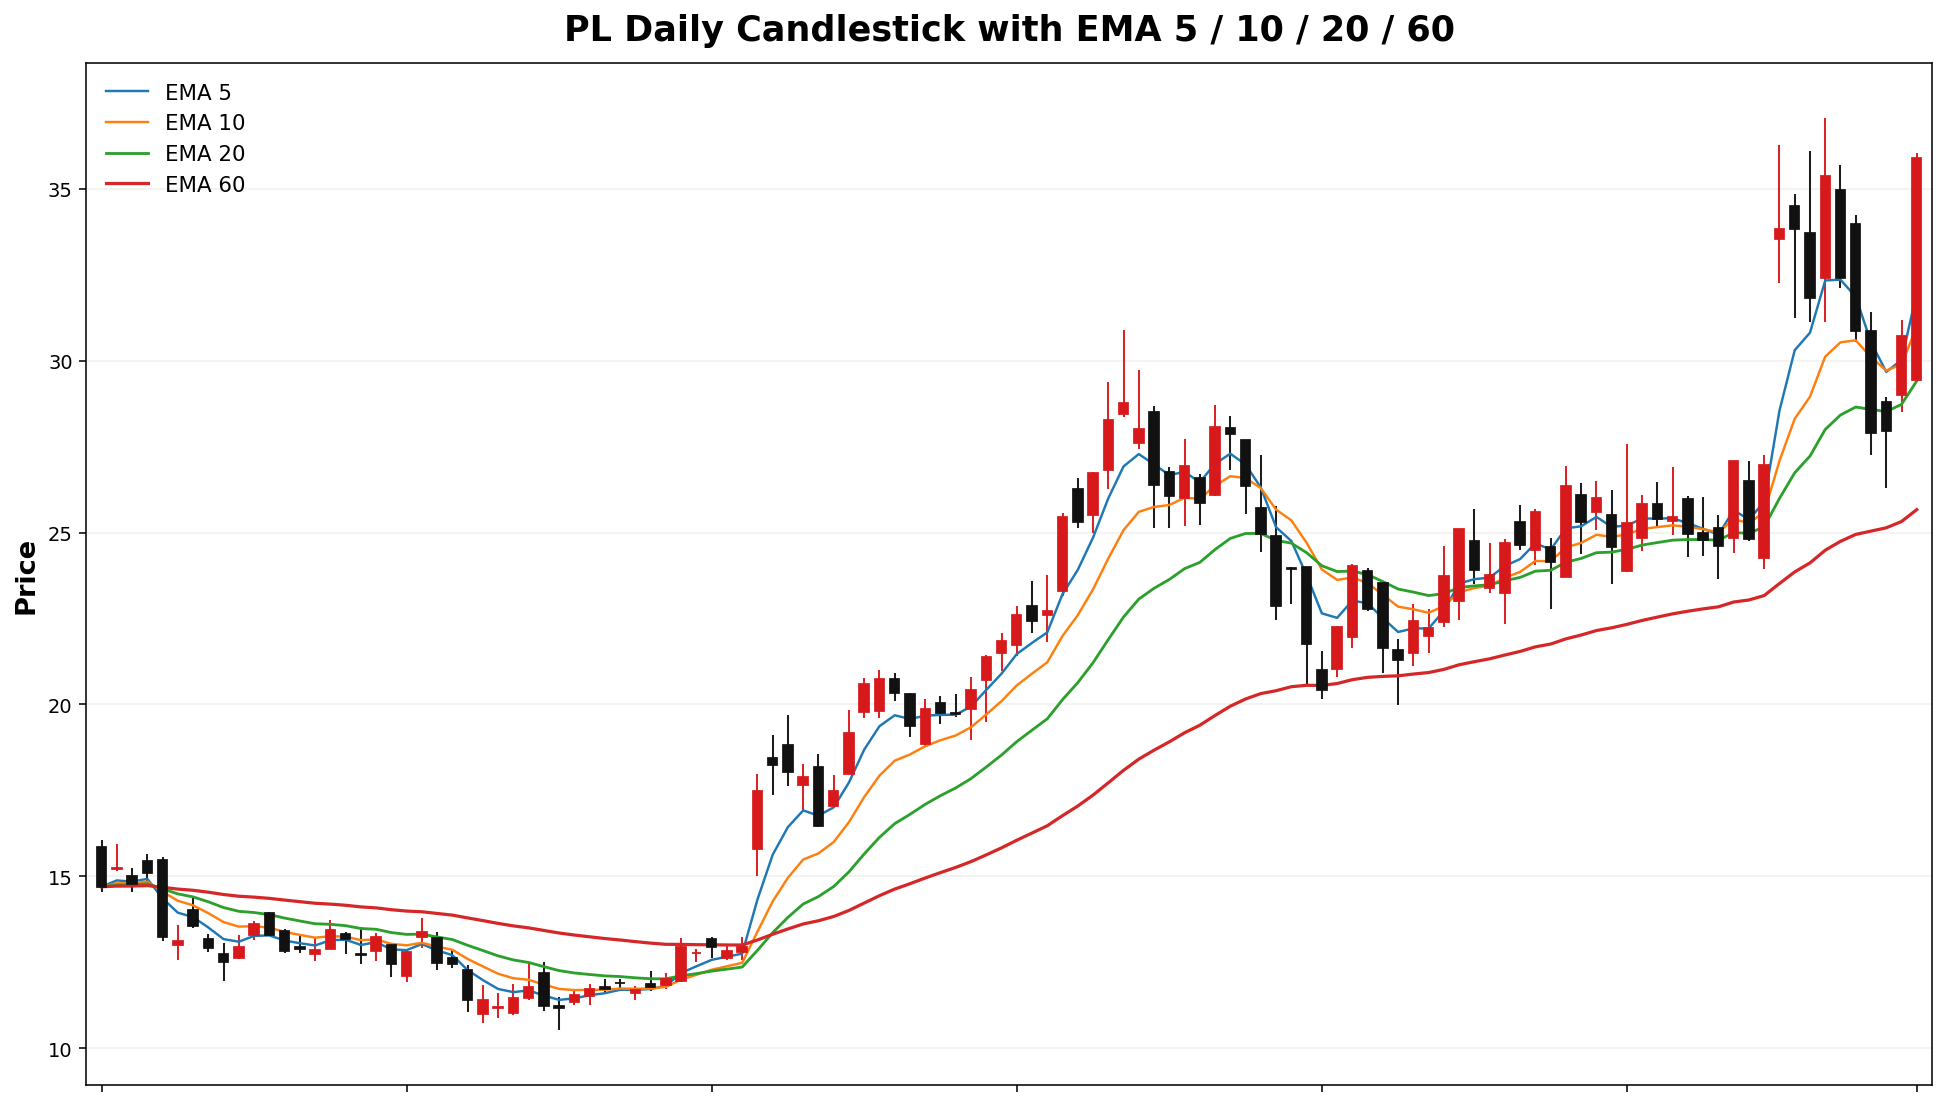
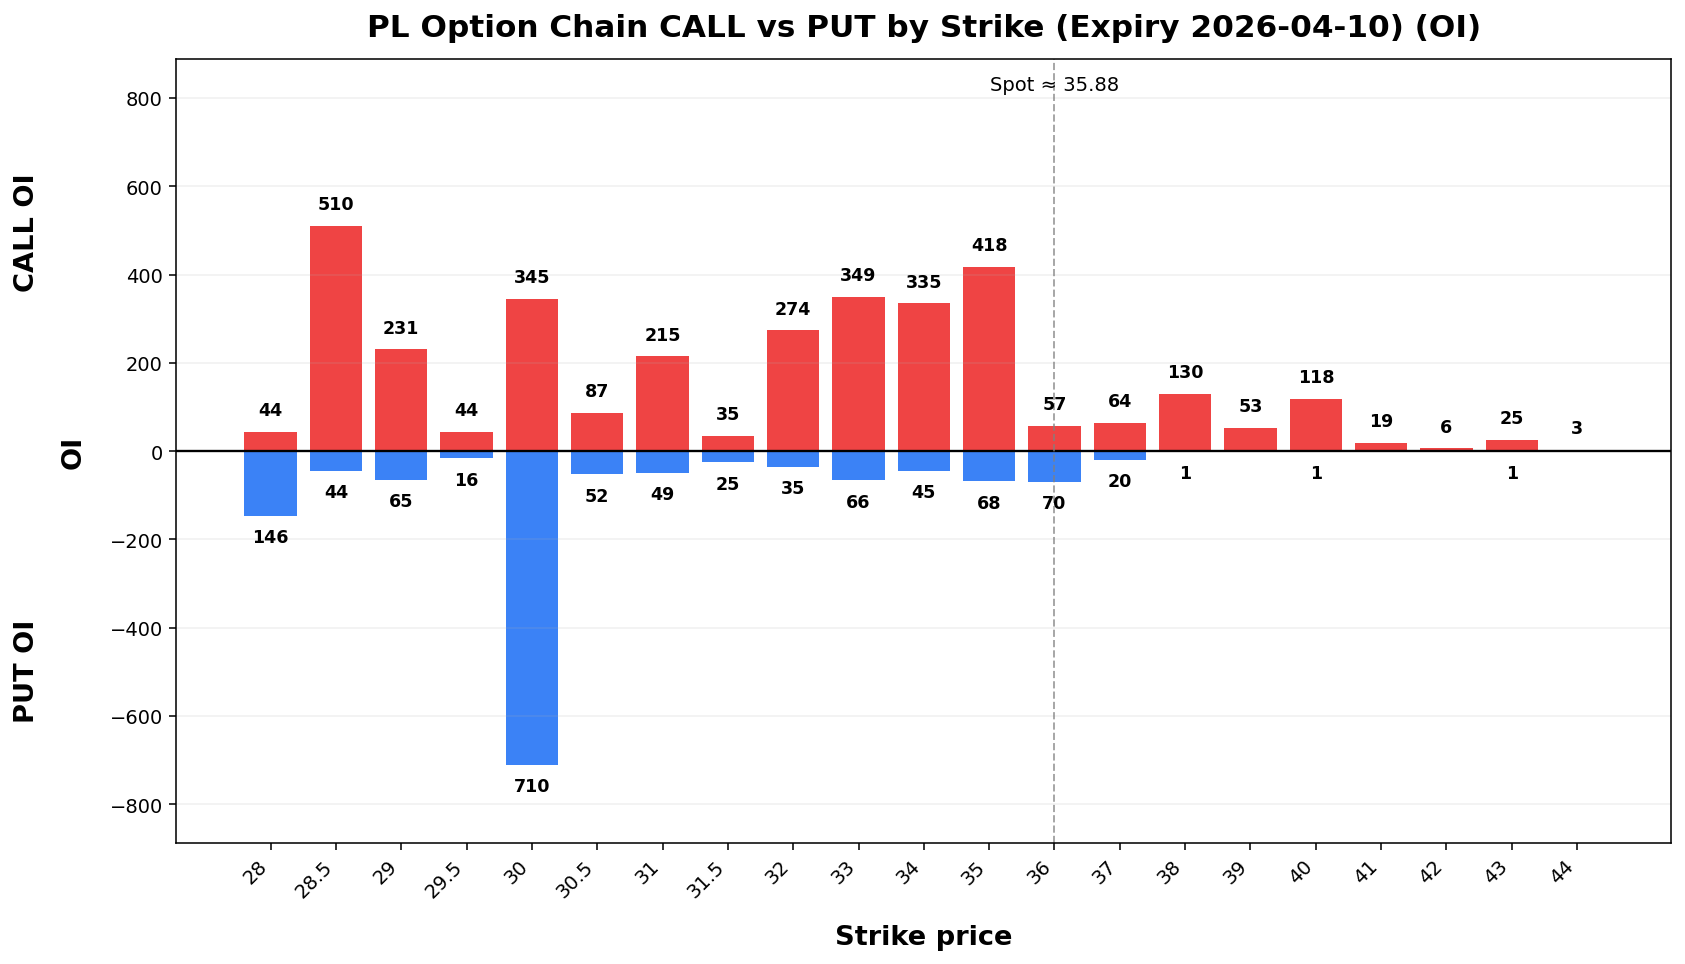
| PL |
34.67 |
31.00 |
35.00 |
23.53 |
TRANSITION |
42.8% |
14.4% |
30.52 - 38.82 |
27.84 - 41.50 |
| RDDT |
139.73 |
125.00 |
145.00 |
132.66 |
TRANSITION |
23.6% |
80.428.9% |
128.14 - 99.60151.32 |
74.23120.67 - 105.158.79 |
UVXYCRDO |
50.53119.59 |
110.00 |
120.00 |
111.58 |
TRANSITION |
40.0% |
21.9% |
106.99 - 132.19 |
98.86 - 140.32 |
| RKLB |
68.05 |
65.00 |
70.00 |
64.71 |
TRANSITION |
29.7% |
30.2% |
61.10 - 75.00 |
56.62 - 79.48 |
| AGQ |
122.21 |
100.00 |
125.00 |
106.64 |
TRANSITION |
32.8% |
7.4% |
106.35 - 138.07 |
96.13 - 148.29 |
| APLD |
26.26 |
25.00 |
28.00 |
24.34 |
TRANSITION |
23.8% |
33.8% |
23.12 - 29.40 |
21.10 - 31.42 |
| BNO |
47.25 |
40.00 |
50.00 |
55.39.00 |
44.89 |
TRANSITION |
27.6%26.2% |
36.3%5.2% |
41.92 - 59.14 |
36.42.37 - 64.6952.13 |
39.22 - 55.28 |
GSATOKLO |
77.7350.25 |
70.50.00 |
80.60.00 |
52.5135 |
TREND |
4.2% |
58.1% |
44.88 - 55.62 |
41.42 - 59.08 |
| IREN |
39.32 |
37.50 |
39.50 |
38.04 |
TRANSITION |
41.2%39.7% |
22.33.5% |
67.4734.87 - 87.9943.77 |
60.8632.01 - 94.6046.63 |
GUSHETHU |
25.66 |
25.00 |
27.00 |
21.42 |
TRANSITION |
29.9% |
36.2% |
22.14 - 29.18 |
19.87 - 31.45 |
| DPST |
114.01 |
100.00 |
115.00 |
99.23 |
TRANSITION |
34.6% |
7.5% |
103.88 - 124.14 |
97.35 - 130.67 |
| USD |
61.89 |
61.00 |
62.00 |
48.57 |
TRANSITION |
40.5% |
43.4% |
55.79 - 67.99 |
51.85 - 71.93 |
| LEU |
187.22 |
185.00 |
200.00 |
186.07 |
TREND |
23.2% |
51.1% |
168.66 - 205.78 |
156.70 - 217.74 |
| NAIL |
42.16 |
40.00 |
43.0042.50 |
NA36.23 |
TRANSITION |
35.36.0% |
31.1%29.4% |
37.6448 - 46.6884 |
34.7247 - 49.6085 |
SQQQRH |
77.29125.58 |
77.120.00 |
80.00 |
78.00 |
PIN |
34.3% |
39.7% |
70.27 - 84.31 |
65.74 - 88.84 |
BE |
135.63 |
135.00 |
150.00 |
141.98 |
TREND |
20.6% |
59.9% |
118.62 - 152.64 |
107.65 - 163.61 |
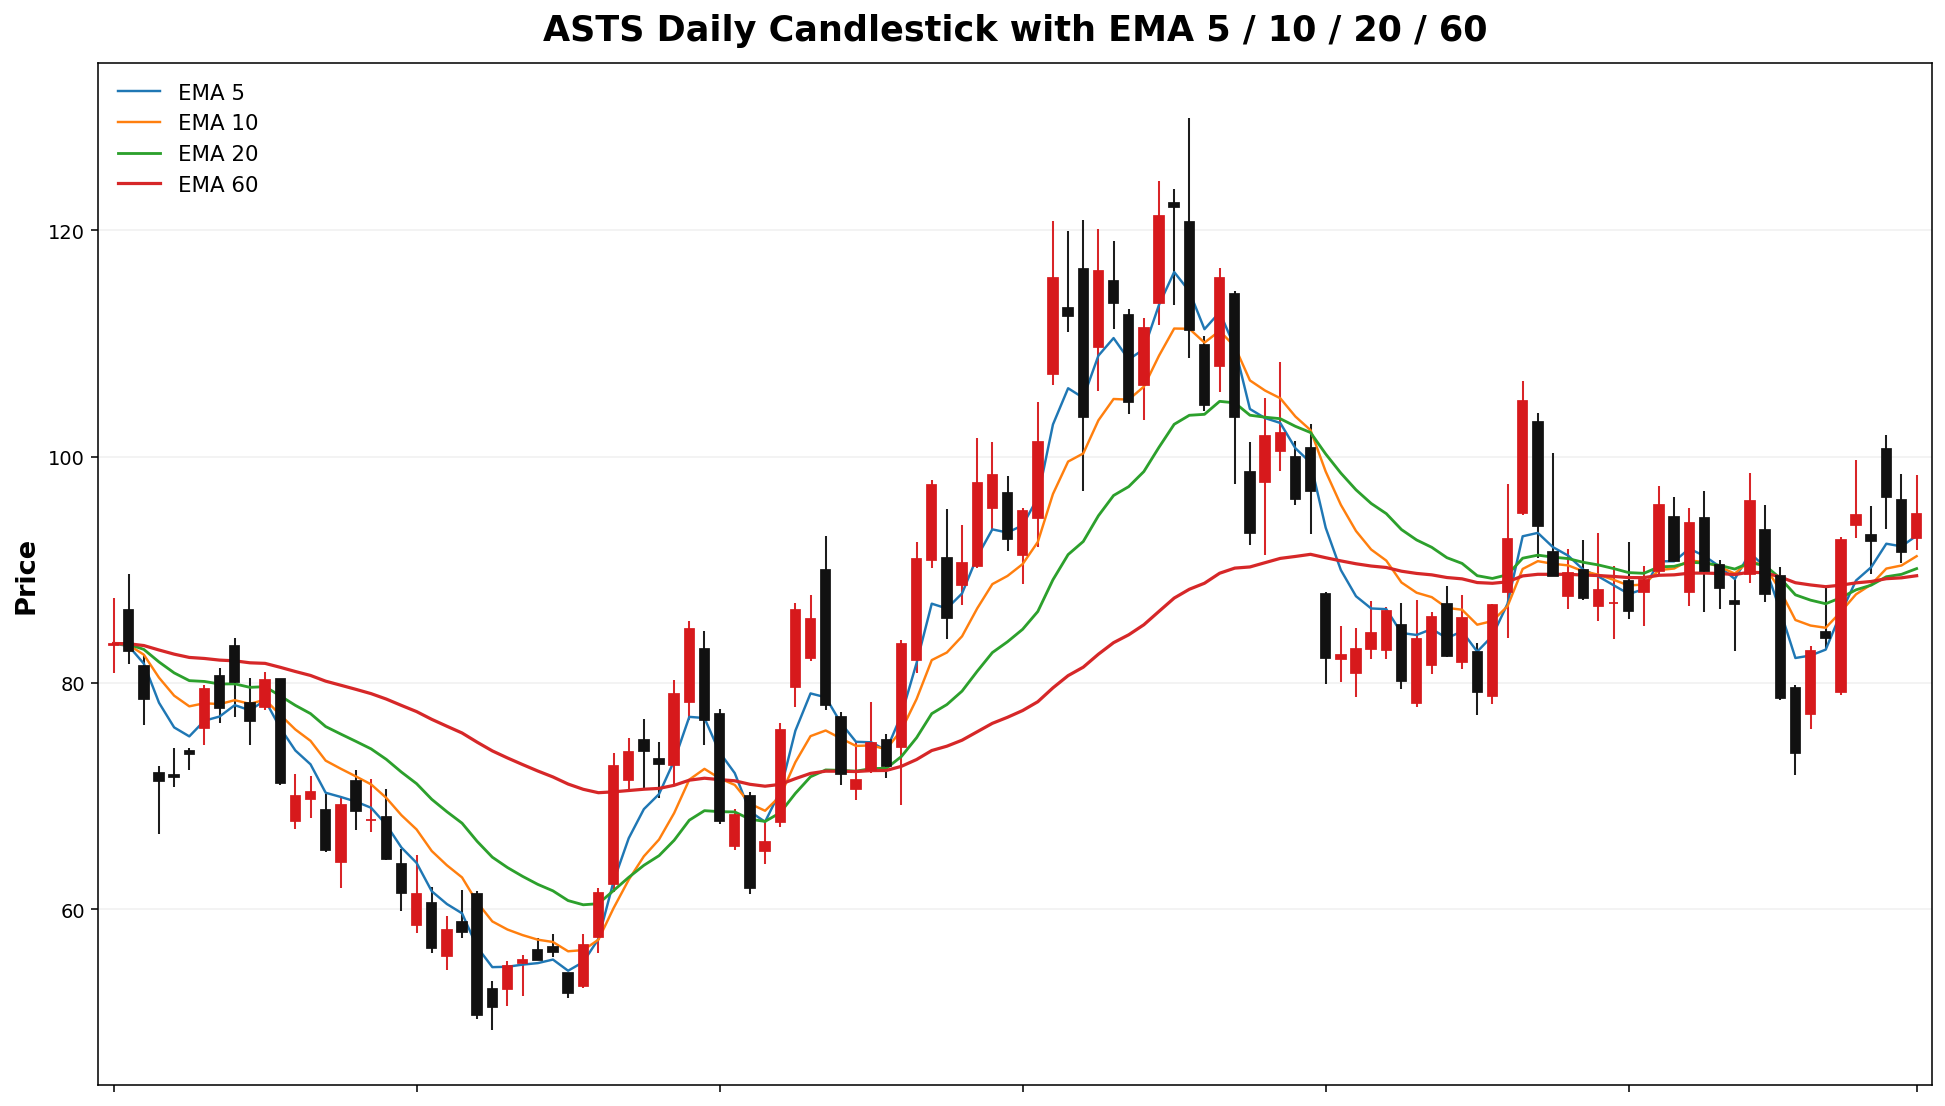
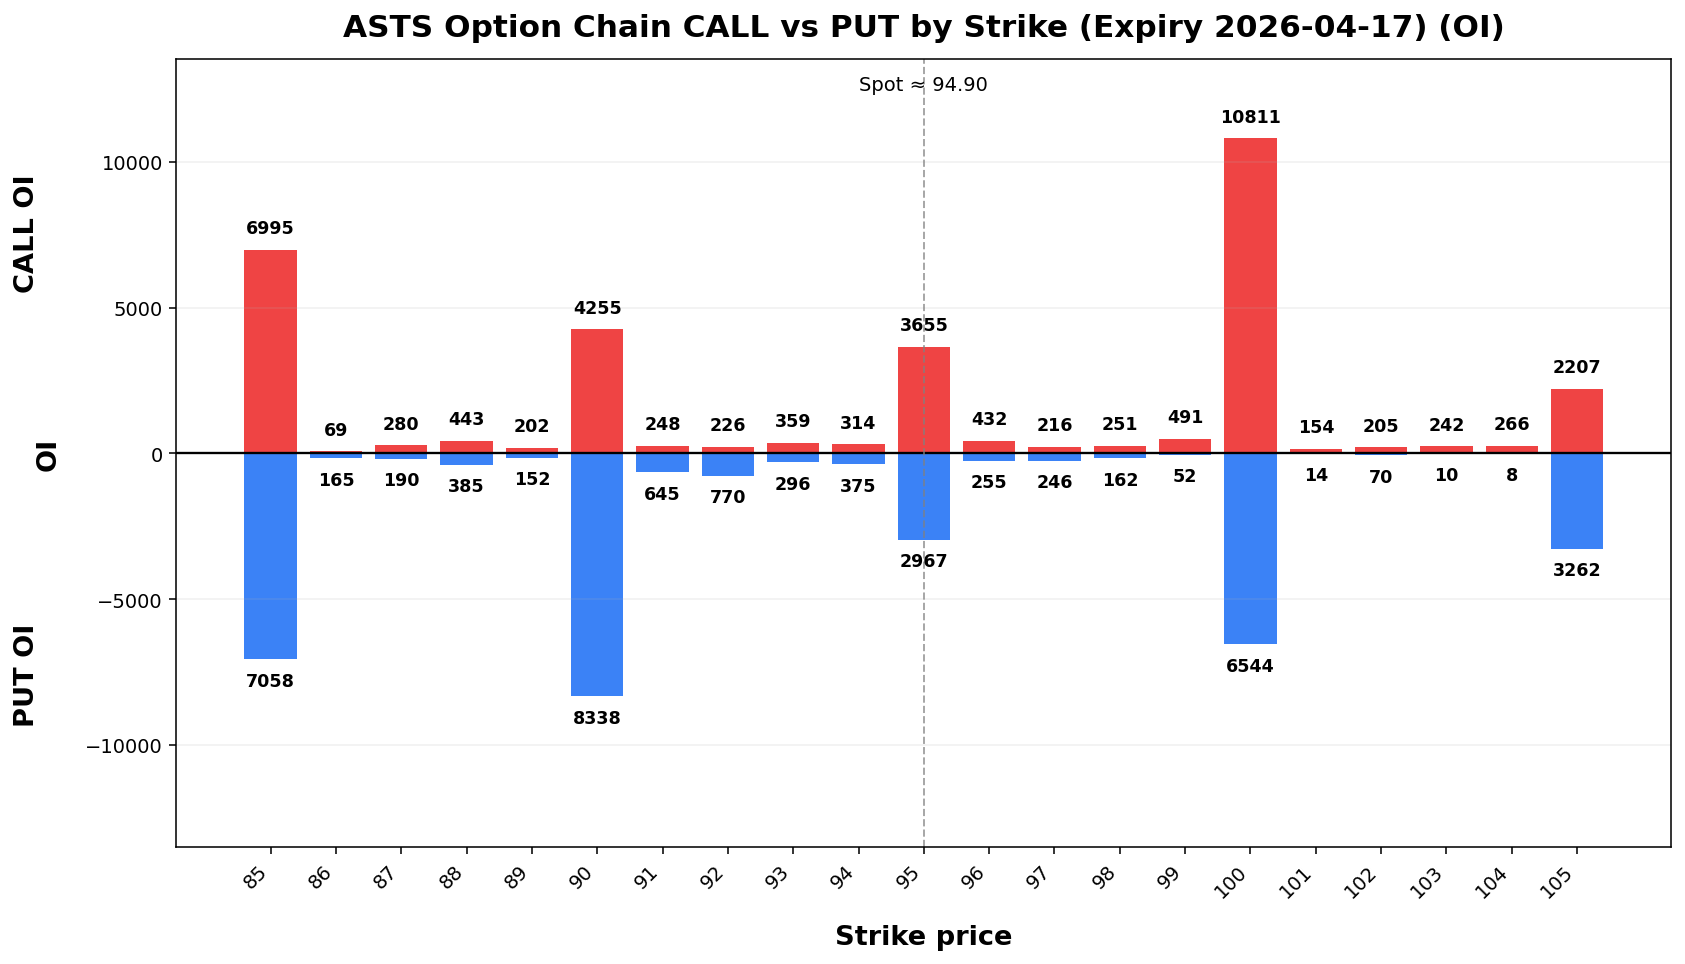
ASTS |
92.62 |
90.00 |
93.00 |
78.42120.97 |
TRANSITION |
40.0% |
40.5% |
80.73 - 104.51 |
73.06 - 112.18 |
SATS |
128.68 |
125.00 |
130.00 |
107.33 |
TRANSITION |
40.6% |
33.5% |
117.14 - 140.22 |
109.70 - 147.66 |
BKSY |
30.81 |
30.00 |
35.00 |
16.56 |
TRANSITION |
16.9% |
47.4% |
26.17 - 35.45 |
23.17 - 38.45 |
SOXL |
52.75 |
50.00 |
56.00 |
48.12 |
TRANSITION |
27.9% |
35.7% |
44.86 - 60.64 |
39.77 - 65.73 |
VIAV |
36.89 |
36.00 |
38.00 |
32.76 |
TRANSITION |
33.0% |
34.6% |
32.64 - 41.14 |
29.90 - 43.88 |
RKLB |
67.73 |
65.00 |
70.00 |
62.19 |
TRANSITION |
31.6% |
35.6% |
59.96 - 75.50 |
54.95 - 80.51 |
ALB |
178.09 |
160.00 |
180.00 |
182.68 |
TRANSITION |
34.2% |
9.9% |
163.45 - 192.73 |
154.02 - 202.16 |
AU |
101.22 |
100.00 |
110.00 |
95.76 |
TRANSITION |
11.9% |
40.5% |
92.55 - 109.89 |
86.97 - 115.47 |
NUGT |
199.37 |
190.00 |
200.00 |
191.69 |
TRANSITION |
40.3% |
36.3% |
171.23 - 227.51 |
153.08 - 245.66 |
LABU |
171.64 |
170.00 |
175.00 |
137.78 |
TRANSITION |
36.2% |
46.2% |
149.13 - 194.15 |
134.61 - 208.67 |
EWY |
122.87 |
120.00 |
125.00 |
135.02 |
TREND |
42.9% |
47.14.8% |
112.8828.8% |
115.30 - 132.135.86 |
106.44108.67 - 139.30 |
PBF |
45.39 |
40.00 |
49.00 |
38.31 |
TRANSITION |
16.9% |
8.9% |
41.04 - 49.74 |
38.24 - 52.54 |
CRDO |
101.45 |
100.00 |
103.00 |
92.60 |
TRANSITION |
33.7% |
40.6% |
90.93 - 111.97 |
84.15 - 118.75142.49 |
BNOUSO
Spot: 54.12124.82
Report Time: 2026-04-0512 06:4908:47 PMAM MYT
Regime: TRANSITIONPIN
Dealer Gamma: LONG
Term Structure
| Expiry |
DTE |
Forward |
ATM IV |
ATM Straddle |
2026-04-1715 |
134 |
54.22124.81 |
98.85%72.25% |
9.8520 |
2026-05-1504-17 |
416 |
54.24124.81 |
80.58%72.00% |
14.5011.32 |
Weekly Range
| Confidence |
Low |
High |
Width |
| 68% |
45.39112.18 |
62.85137.46 |
17.4625.28 |
| 80% |
42.93108.62 |
65.31141.02 |
22.3832.40 |
| 90% |
39.76104.03 |
68.48145.61 |
28.7341.59 |
| 95% |
37.00100.04 |
71.24149.60 |
34.2349.55 |
Structure & Probabilities
| Support |
Resistance |
Gamma Flip |
Max Pain |
P>Res |
P<Sup |
54.120.00 |
55.128.00 |
33.10 |
43.123.00 |
45.1%126.00 |
40.36.6% |
26.8% |
Flow & Skew
| Call Vol |
Put Vol |
Vol P/C |
Call OI |
Put OI |
OI P/C |
Skew |
Skew Bias |
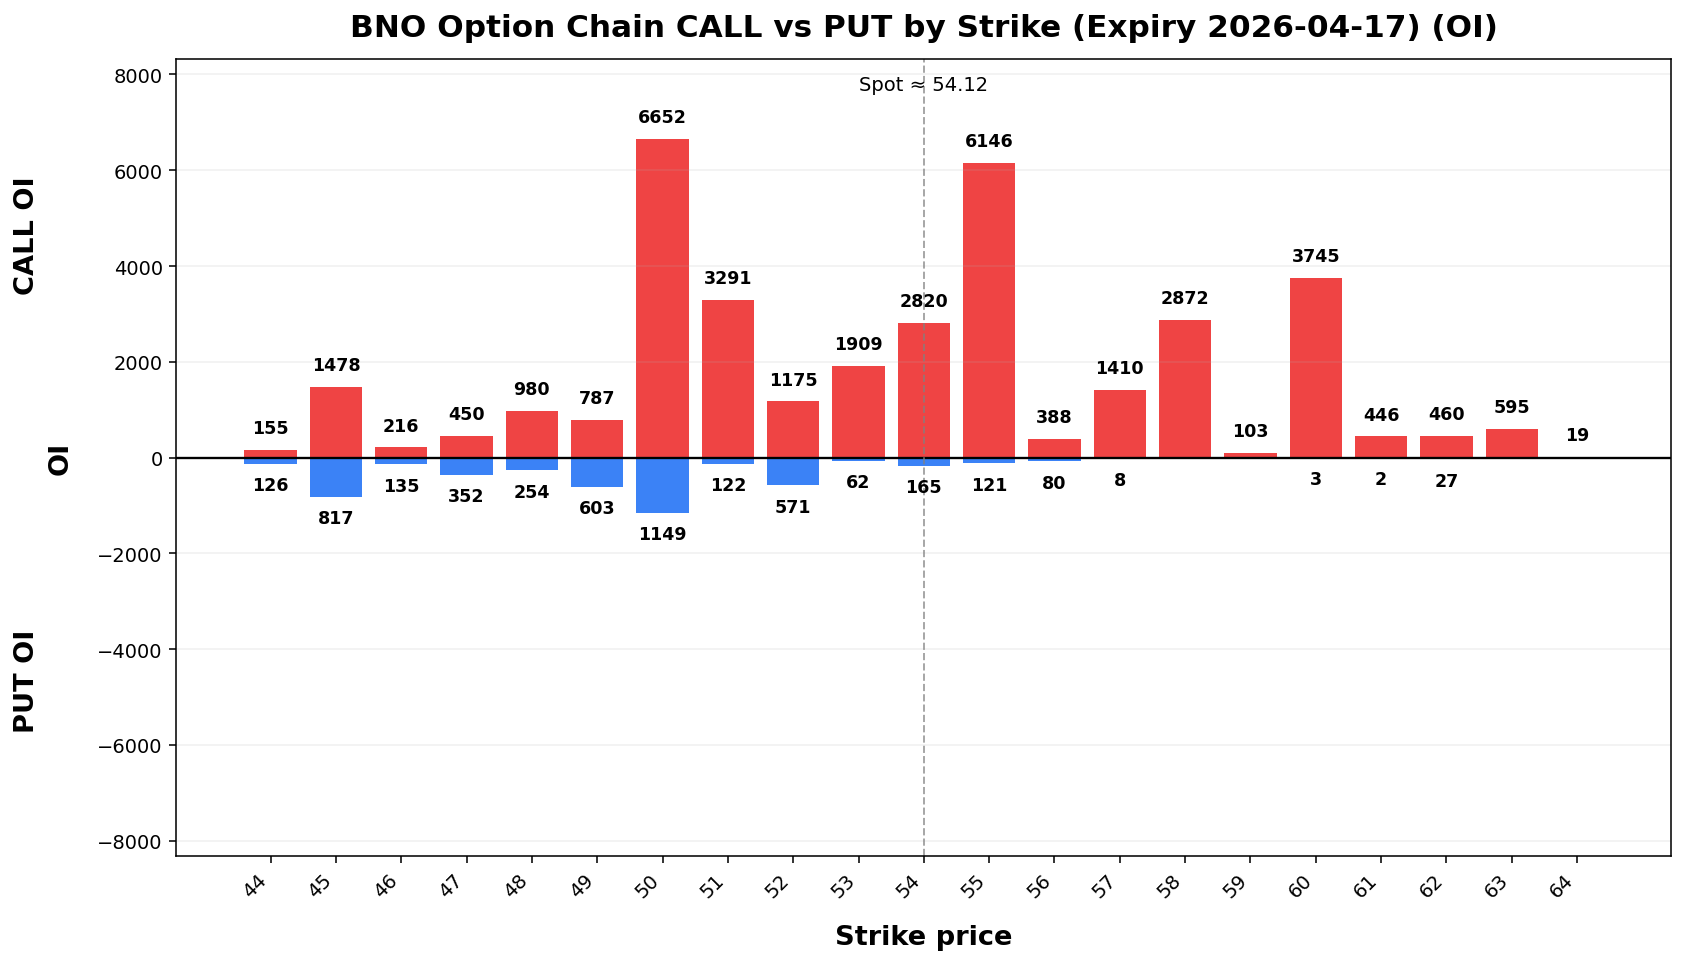
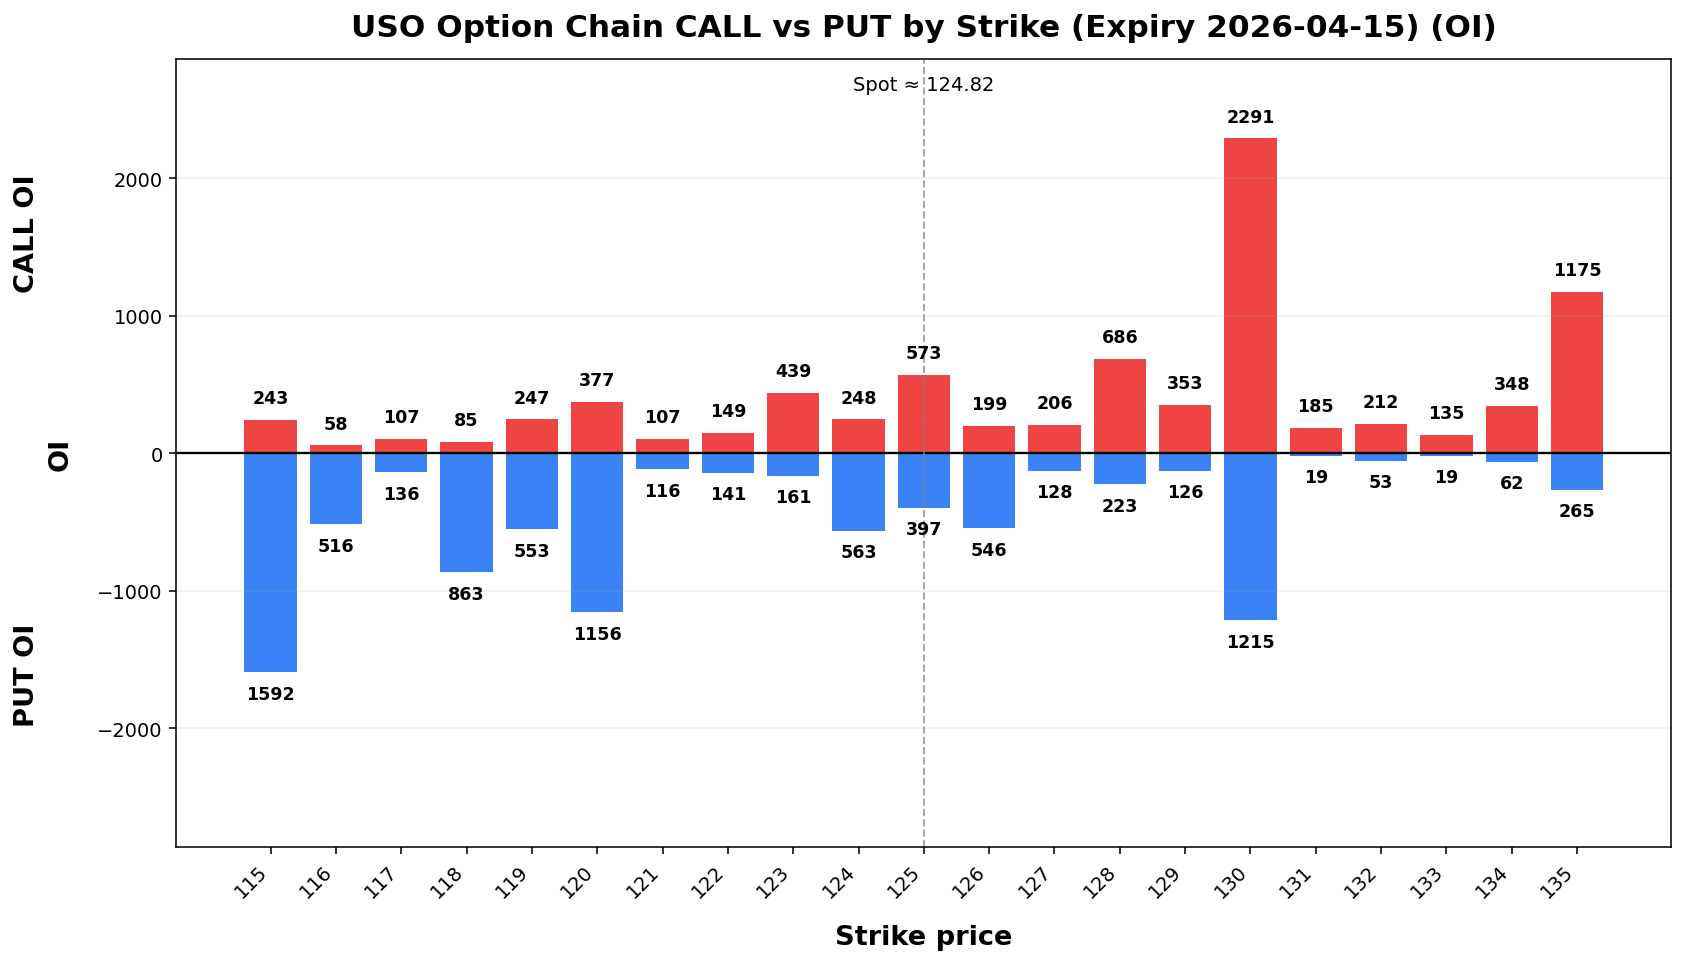
| 19,532 |
10,799 |
0.55 |
13,801 |
10,633 |
0.77 |
-10.11 vol pts |
CALL_SKEW |
Tail Risk
| Q10 |
Q50 |
Q90 |
Down Tail |
Up Tail |
Down/Up |
| 114.76 |
124.93 |
142.06 |
10.06 |
17.24 |
0.58 |
Daily Technicals
| EMA20 |
EMA50 |
VWAP20 |
BB Lower |
BB Mid |
BB Upper |
BB Width |
Vol Ratio |
Path |
| 121.68 |
106.15 |
122.00 |
106.99 |
123.33 |
139.68 |
26.50% |
0.31 |
UP trend (expanding) |
Day Plan
- 120.00-128.00 range: fade extremes
- > 128.00: chase only if hold + vol
- < 120.00: risk expand; reduce size
- Regime: PIN
- Tech: UP trend (expanding)
Swing Plan
- Accumulate: 120.00-120.00
- Trim: 128.00-128.00
- Add: close > 128.00
- Cut: close < 120.00
- Best for: pin regime
Raw Text Summary
📌 USO @ 124.82 (2026-04-12 08:47 AM MYT)

• Current price is **124.82**. Key support is around **120.00**, and resistance is around **128.00**.
• For the next week, the model’s **68% expected range** is roughly **112.18 to 137.46**.
• A wider **90% range** is about **104.03 to 145.61**.
• Dealer positioning looks **LONG gamma**, so the market behavior is classified as **PIN**.
• The estimated **gamma flip** is near **123.00**. Crossing and holding beyond this area can change the trading behavior.
• Approximate breakout odds: **above resistance 36.6%**, **below support 26.8%** by the target horizon.
• Options skew is tilted toward **calls**, which suggests upside speculation is relatively stronger.
• Near-term implied volatility is higher than the next expiry (**IV1 72.25% vs IV2 72.00%**), which suggests **near-term event stress / backwardation**.
• Recent volume is only **0.31x** the 20-day average, so breakouts may be less reliable unless volume improves.
• On the daily chart, the stock currently looks like **UP trend (expanding)**.
• The implied distribution shows **more upside tail potential** than downside tail risk.
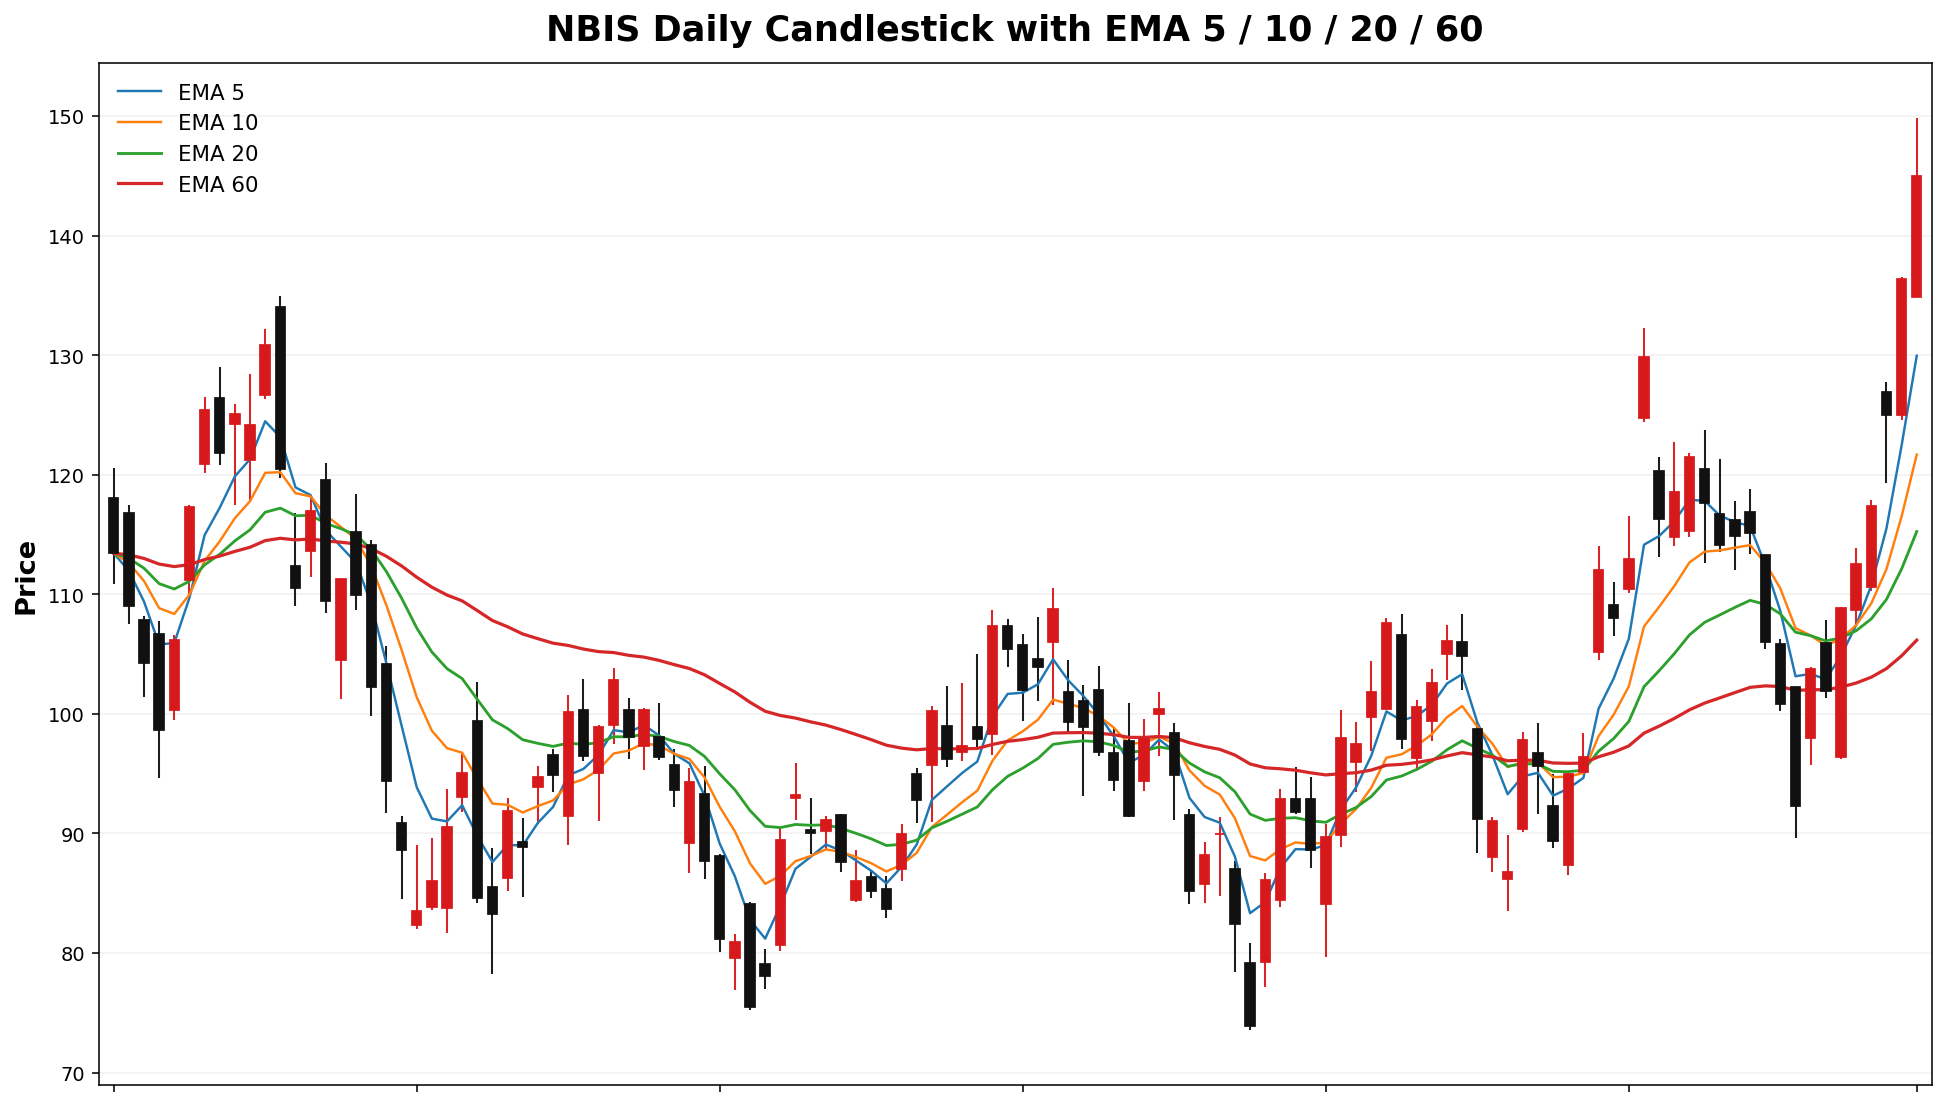
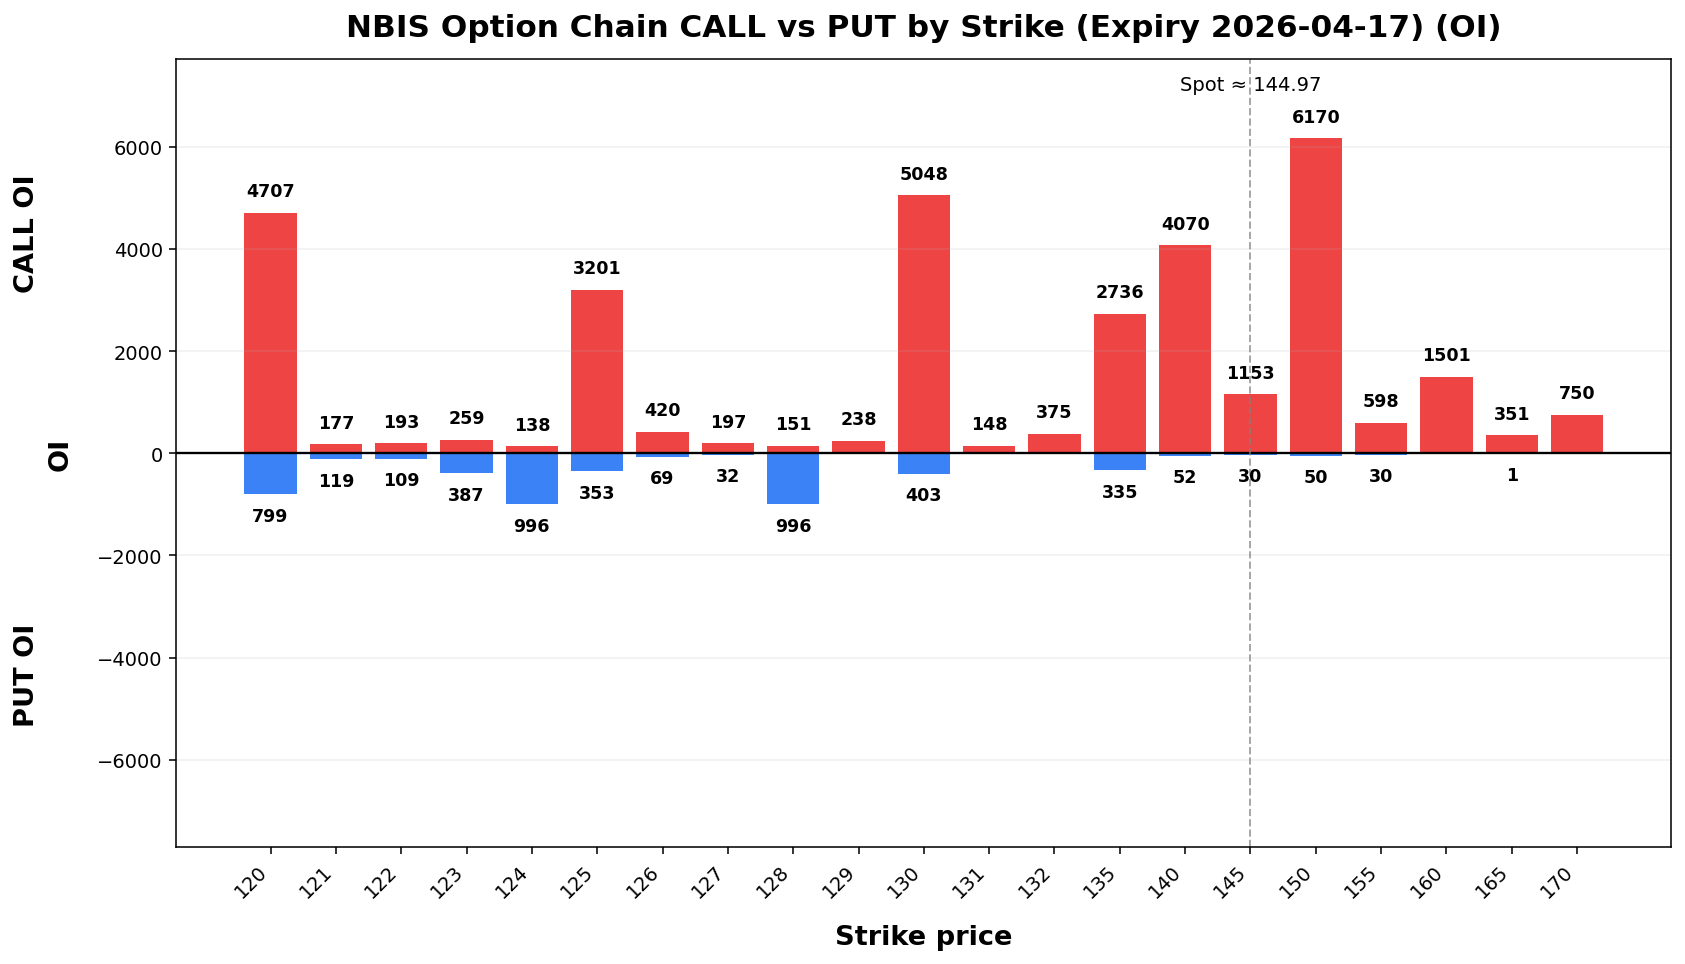
NBIS
Spot: 144.97
Report Time: 2026-04-12 08:47 AM MYT
Regime: TRANSITION
Dealer Gamma: LONG
Term Structure
| Expiry |
DTE |
Forward |
ATM IV |
ATM Straddle |
| 2026-04-17 |
6 |
145.01 |
76.36% |
13.95 |
| 2026-04-24 |
13 |
145.38 |
72.77% |
19.75 |
Weekly Range
| Confidence |
Low |
High |
Width |
| 68% |
129.64 |
160.30 |
30.66 |
| 80% |
125.32 |
164.62 |
39.29 |
| 90% |
119.76 |
170.18 |
50.43 |
| 95% |
114.92 |
175.02 |
60.09 |
Structure & Probabilities
| Support |
Resistance |
Gamma Flip |
Max Pain |
P>Res |
P<Sup |
| 140.00 |
150.00 |
108.71 |
110.00 |
30.5% |
36.6% |
Flow & Skew
| Call Vol |
Put Vol |
Vol P/C |
Call OI |
Put OI |
OI P/C |
Skew |
Skew Bias |
14,73558,767 |
4,46728,380 |
0.3048 |
46,65450,180 |
13,73345,118 |
0.2990 |
-11.872.64 vol pts |
CALL_SKEWPUT_SKEW |
Tail Risk
| Q10 |
Q50 |
Q90 |
Down Tail |
Up Tail |
Down/Up |
15.67121.07 |
18.33143.18 |
51.30165.34 |
38.4523.90 |
0.0020.37 |
NA1.17 |
Daily Technicals
| EMA20 |
EMA50 |
VWAP20 |
BB Lower |
BB Mid |
BB Upper |
BB Width |
Vol Ratio |
Path |
48.50115.25 |
107.26 |
117.19 |
90.90 |
115.54 |
140.18 |
42.08 |
48.78 |
42.24 |
49.24 |
56.23 |
28.41%65% |
1.0431 |
UP trend (expanding) |
Day Plan
54.140.00-55.150.00 range: fade extremes- >
55.150.00: chase only if hold + vol
- <
54.140.00: risk expand; reduce size
- Regime: TRANSITION
- Tech: UP trend (expanding)
Swing Plan
- Accumulate:
54.140.00-54.140.00
- Trim:
55.150.00-55.150.00
- Add: close >
55.150.00
- Cut: close <
54.140.00
- Best for: transition regime
Raw Text Summary
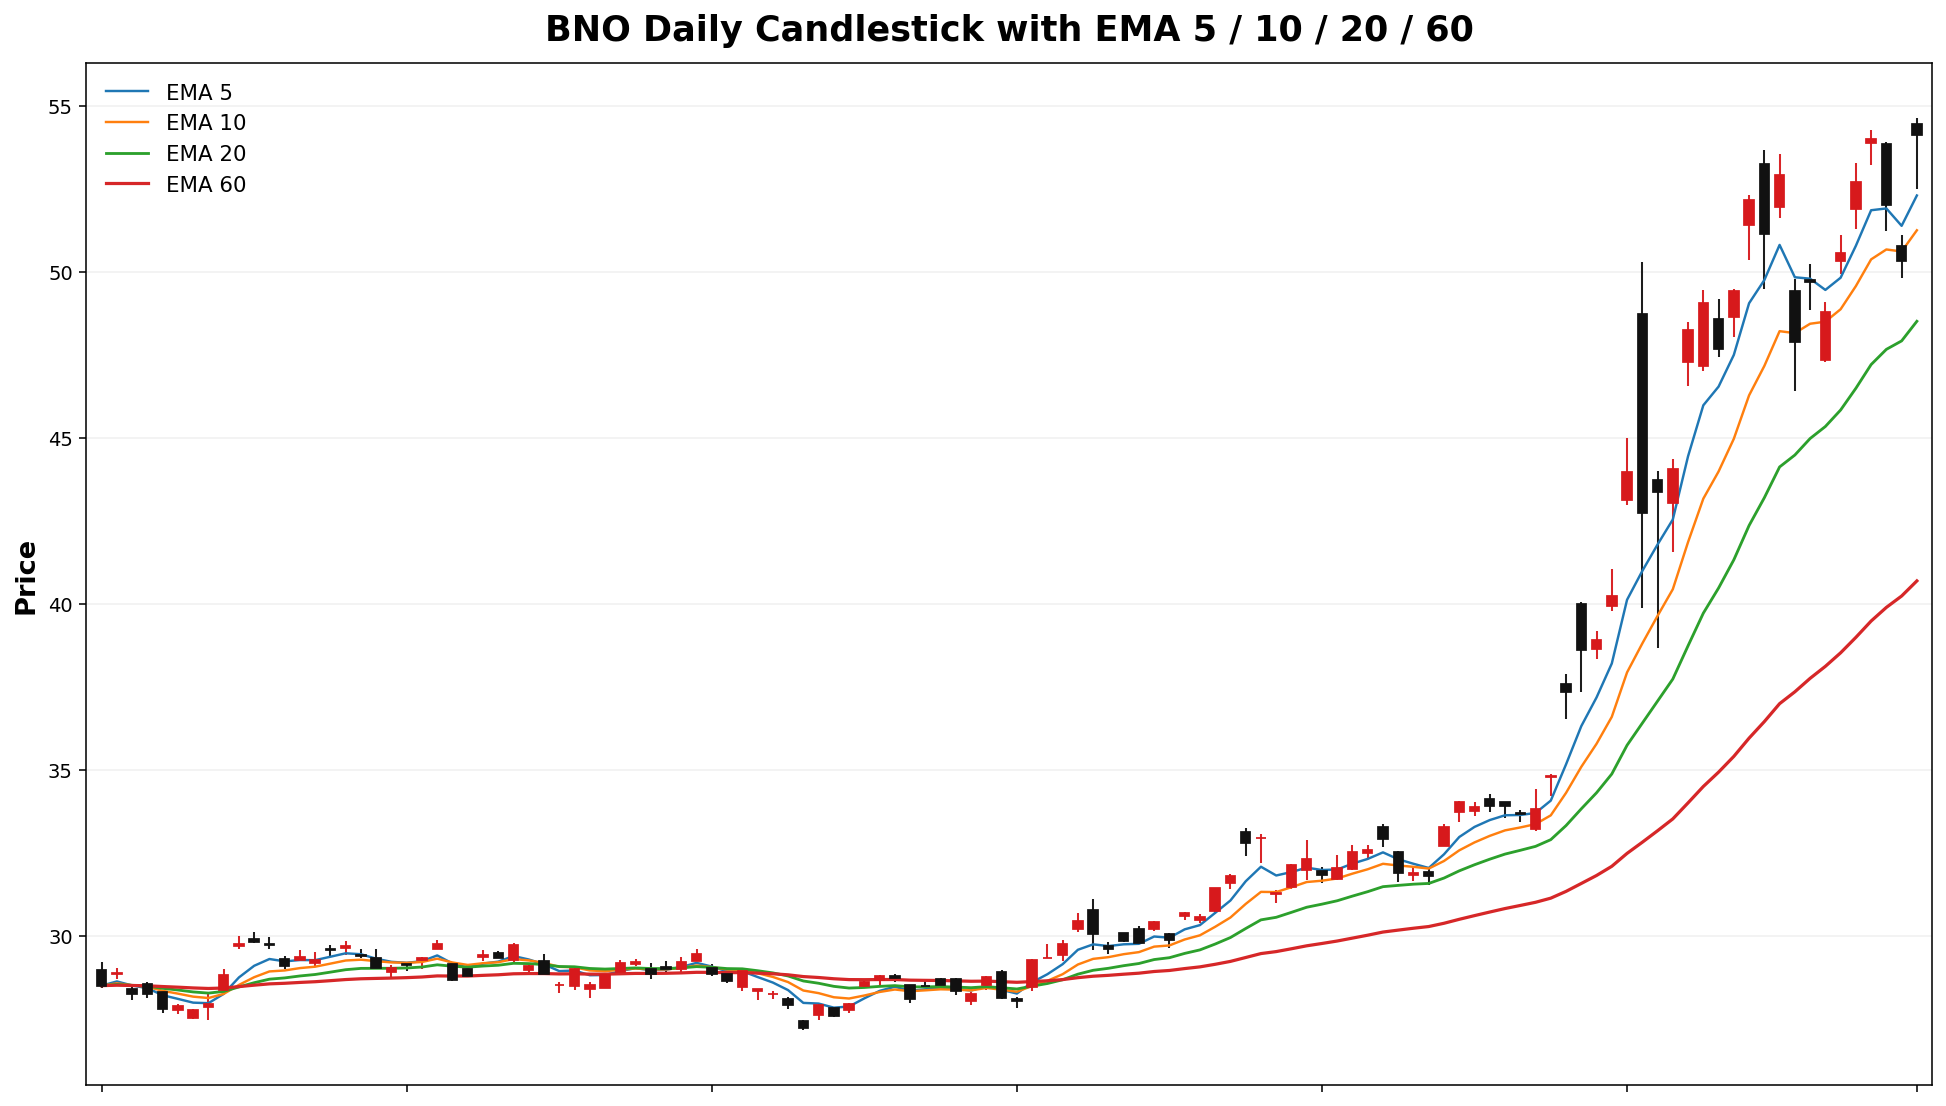
📌 BNONBIS @ 54.12144.97 (2026-04-0512 06:4908:47 PMAM MYT)

• Current price is **54.12*144.97**. Key support is around **54.140.00**, and resistance is around **55.150.00**.
• For the next week, the model’s **68% expected range** is roughly **45.39129.64 to 62.85*160.30**.
• A wider **90% range** is about **39.119.76 to 68.48*170.18**.
• Dealer positioning looks **LONG gamma**, so the market behavior is classified as **TRANSITION**.
• The estimated **gamma flip** is near **33.10*108.71**. Crossing and holding beyond this area can change the trading behavior.
• Approximate breakout odds: **above resistance 45.1%30.5%**, **below support 40.36.6%** by the target horizon.
• Options skew is tilted toward **calls**, which suggests upside speculation is relatively stronger.
• Near-term implied volatility is higher than the next expiry (**IV1 98.85% vs IV2 80.58%**), which suggests **near-term event stress / backwardation**.
• On the daily chart, the stock currently looks like **UP trend (expanding)**.
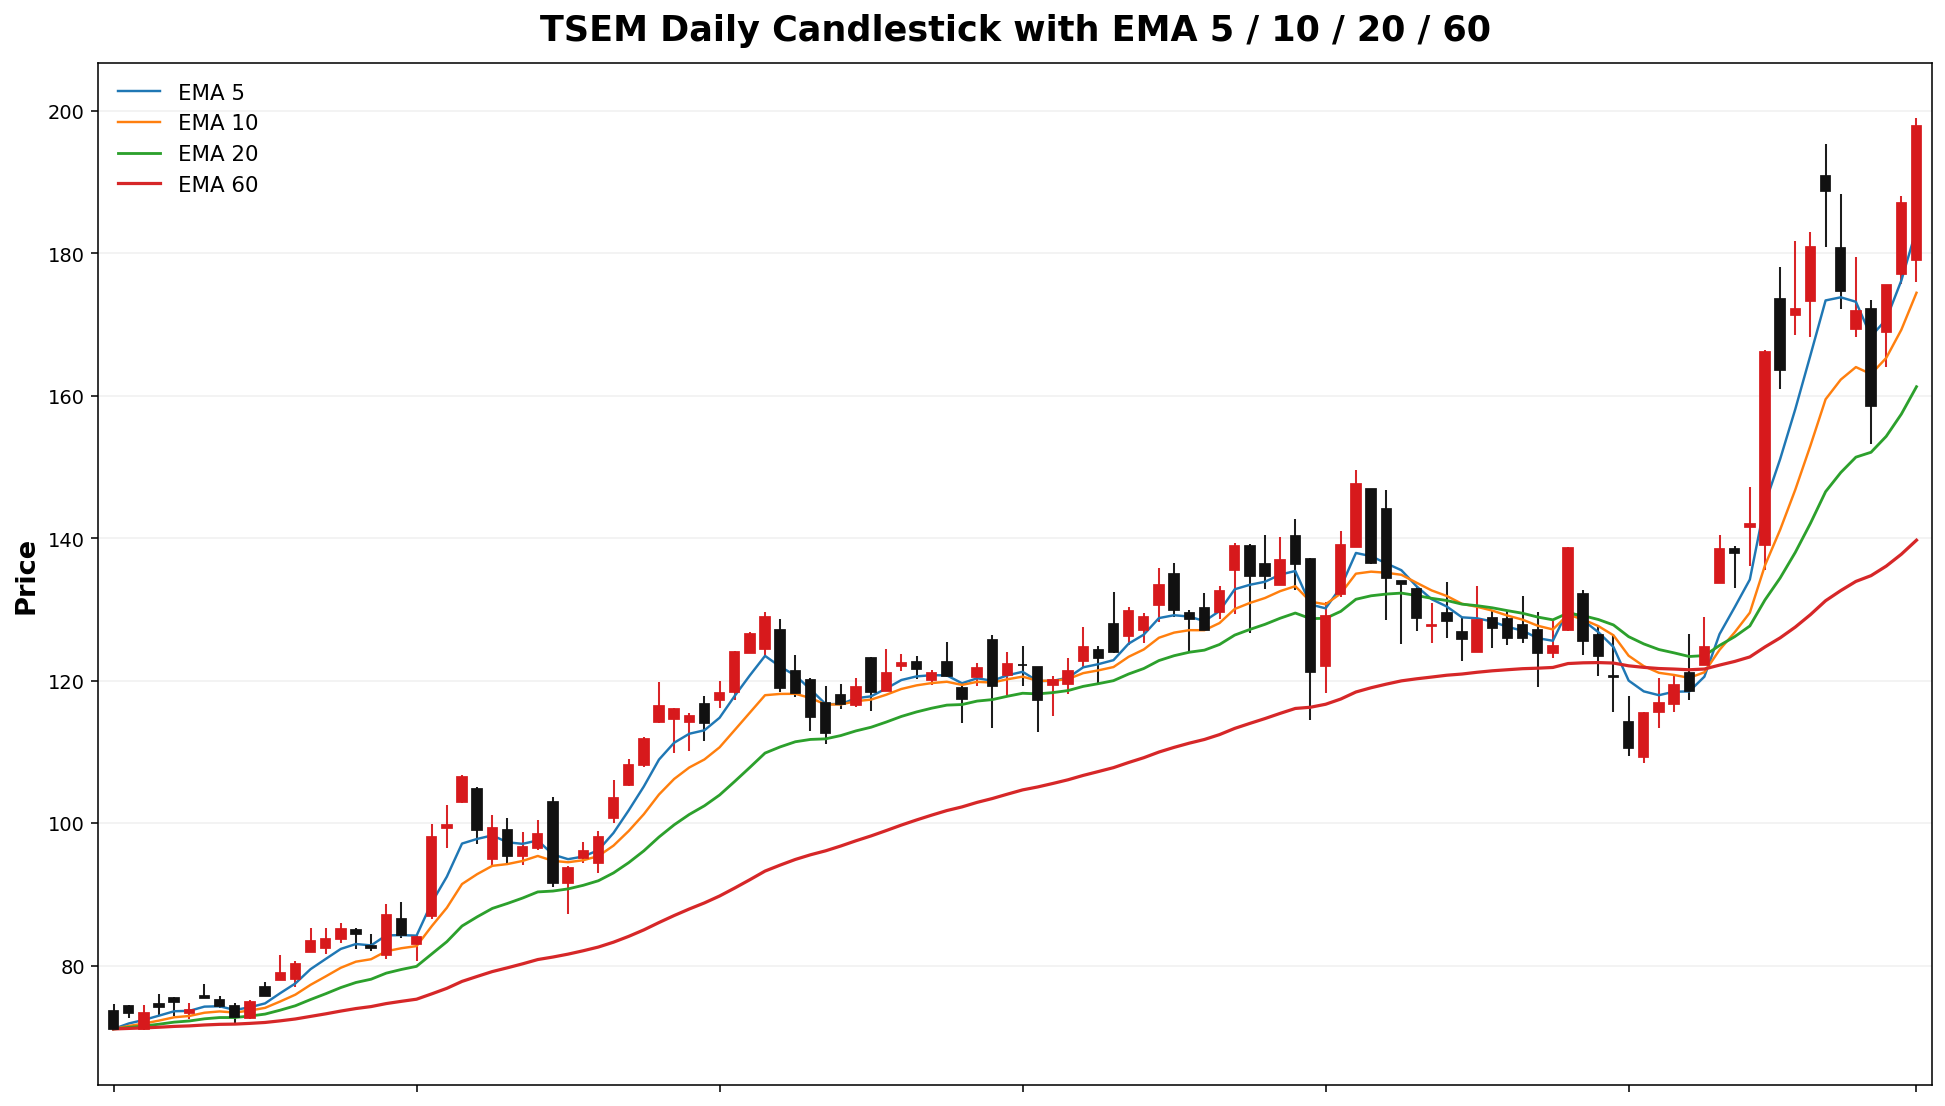
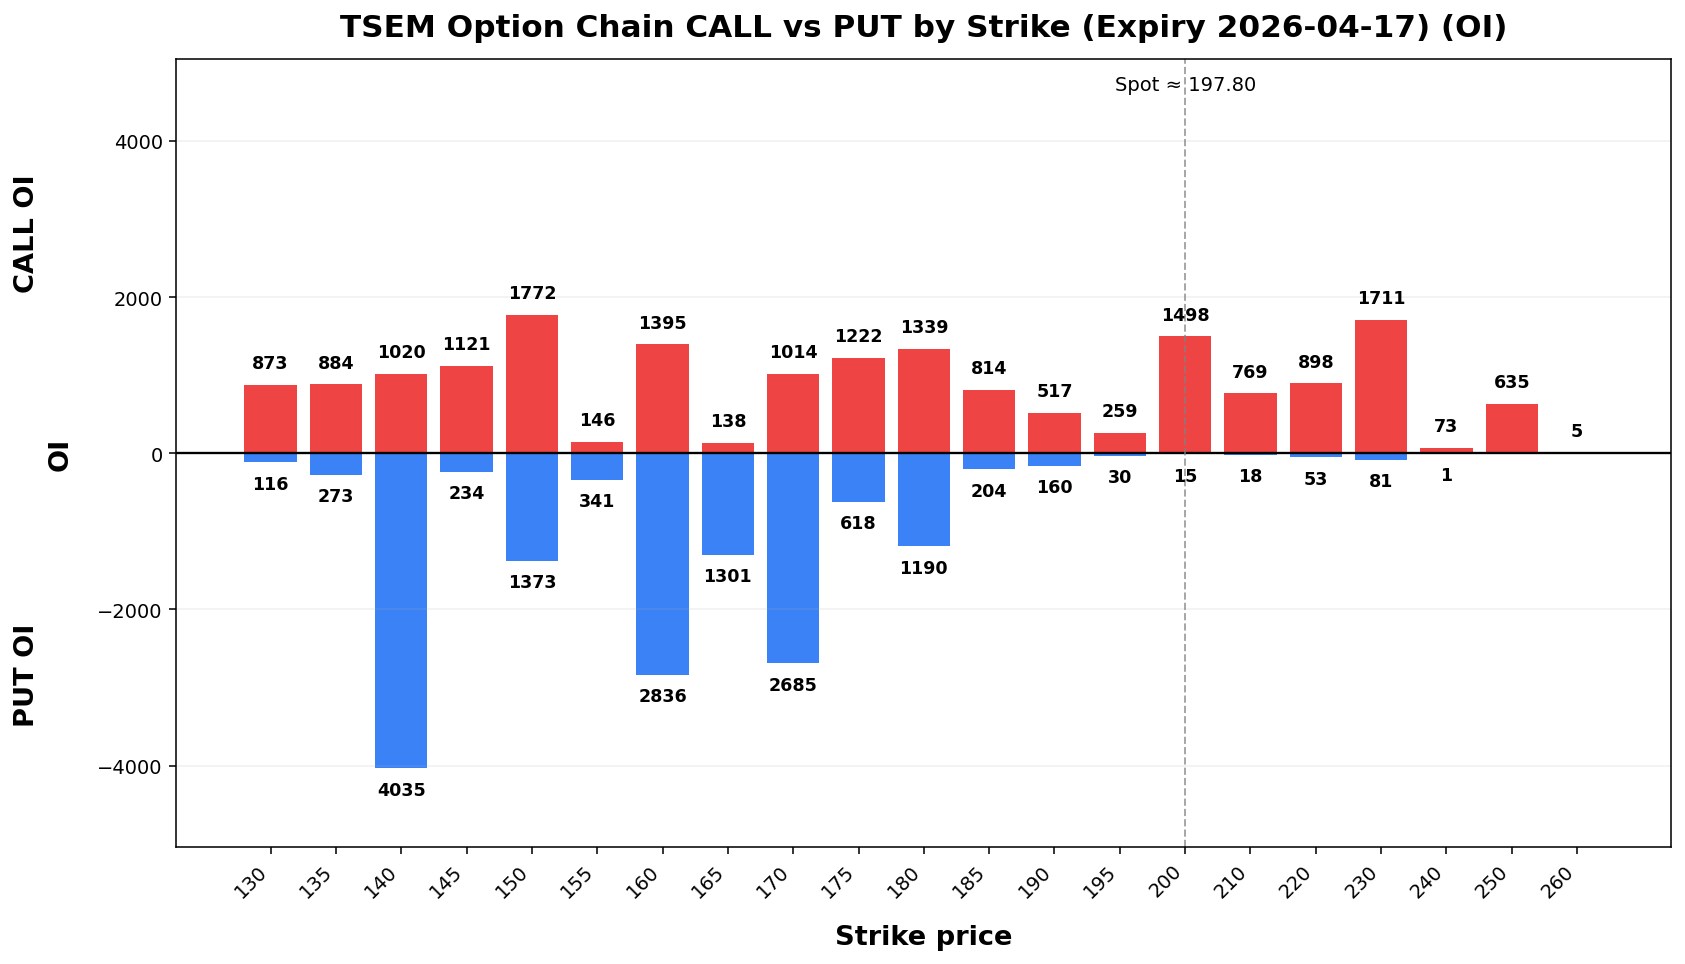
TSEM
Spot: 197.80
Report Time: 2026-04-05 06:49 PM MYT
Regime: TRANSITION
Dealer Gamma: LONG
Term Structure
Expiry |
DTE |
Forward |
ATM IV |
ATM Straddle |
|---|
2026-04-17 |
13 |
198.00 |
78.39% |
28.55 |
2026-05-15 |
41 |
198.70 |
80.58% |
53.00 |
Weekly Range
Confidence |
Low |
High |
Width |
|---|
68% |
176.60 |
219.00 |
42.40 |
80% |
170.63 |
224.97 |
54.34 |
90% |
162.93 |
232.67 |
69.74 |
95% |
156.25 |
239.35 |
83.10 |
Structure & Probabilities
Support |
Resistance |
Gamma Flip |
Max Pain |
P>Res |
P<Sup |
|---|
180.00 |
200.00 |
173.50 |
160.00 |
34.4% |
18.0% |
Flow & Skew
Call Vol |
Put Vol |
Vol P/C |
Call OI |
Put OI |
OI P/C |
Skew |
Skew Bias |
|---|
10,560 |
444 |
0.04 |
21,419 |
27,270 |
1.27 |
6.66 vol pts |
PUT_SKEW |
Tail Risk
Q10 |
Q50 |
Q90 |
Down Tail |
Up Tail |
Down/Up |
|---|
38.45 |
40.25 |
189.23 |
159.35 |
0.00 |
NA |
Daily Technicals
EMA20 |
EMA50 |
VWAP20 |
BB Lower |
BB Mid |
BB Upper |
BB Width |
Vol Ratio |
Path |
|---|
161.25 |
143.38 |
159.86 |
96.06 |
153.04 |
210.02 |
74.46% |
0.89 |
UP trend (expanding) |
Day Plan
180.00-200.00 range: fade extremes
> 200.00: chase only if hold + vol
< 180.00: risk expand; reduce size
Regime: TRANSITION
Tech: UP trend (expanding)
Swing Plan
Accumulate: 180.00-180.00
Trim: 200.00-200.00
Add: close > 200.00
Cut: close < 180.00
Best for: transition regime
Raw Text Summary
📌 TSEM @ 197.80 (2026-04-05 06:49 PM MYT)

• Current price is **197.80**. Key support is around **180.00**, and resistance is around **200.00**.
• For the next week, the model’s **68% expected range** is roughly **176.60 to 219.00**.
• A wider **90% range** is about **162.93 to 232.67**.
• Dealer positioning looks **LONG gamma**, so the market behavior is classified as **TRANSITION**.
• The estimated **gamma flip** is near **173.50**. Crossing and holding beyond this area can change the trading behavior.
• Approximate breakout odds: **above resistance 34.4%**, **below support 18.0%** by the target horizon.
• Options skew is tilted toward **puts**, which suggests traders are paying more for downside protection.
• Near-term implied volatility is lower than the next expiry (**IV1 78.39% vs IV2 80.58%**), which suggests a **contango / calmer front expiry** setup.
• On the daily chart, the stock currently looks like **UP trend (expanding)**.
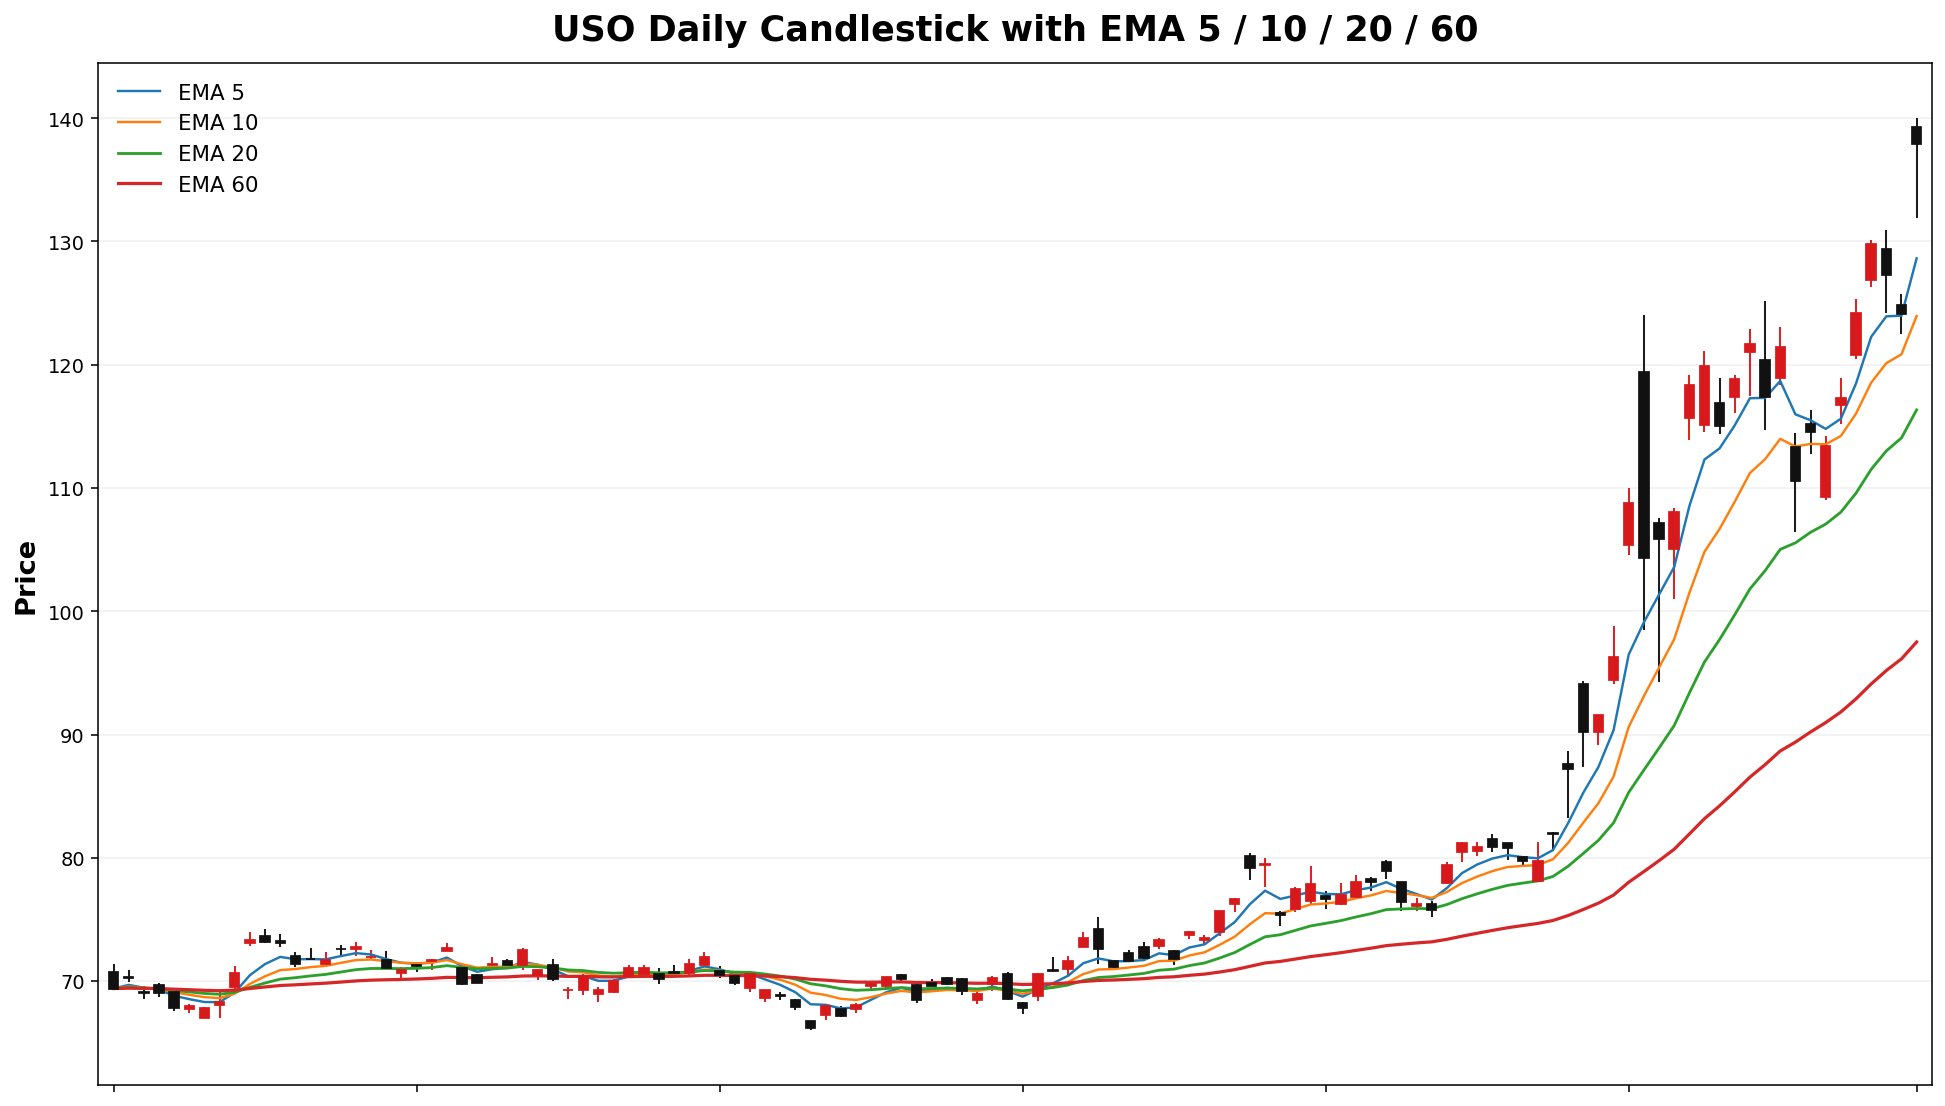
USO
Spot: 137.92
Report Time: 2026-04-05 06:49 PM MYT
Regime: TRANSITION
Dealer Gamma: LONG
Term Structure
Expiry |
DTE |
Forward |
ATM IV |
ATM Straddle |
|---|
2026-04-08 |
4 |
137.91 |
106.05% |
14.07 |
2026-04-10 |
6 |
137.84 |
97.81% |
16.38 |
Weekly Range
Confidence |
Low |
High |
Width |
|---|
68% |
119.66 |
156.18 |
36.52 |
80% |
114.52 |
161.32 |
46.80 |
90% |
107.88 |
167.96 |
60.07 |
95% |
102.13 |
173.71 |
71.58 |
Structure & Probabilities
Support |
Resistance |
Gamma Flip |
Max Pain |
P>Res |
P<Sup |
|---|
135.00 |
140.00 |
117.44 |
122.00 |
44.6% |
35.8% |
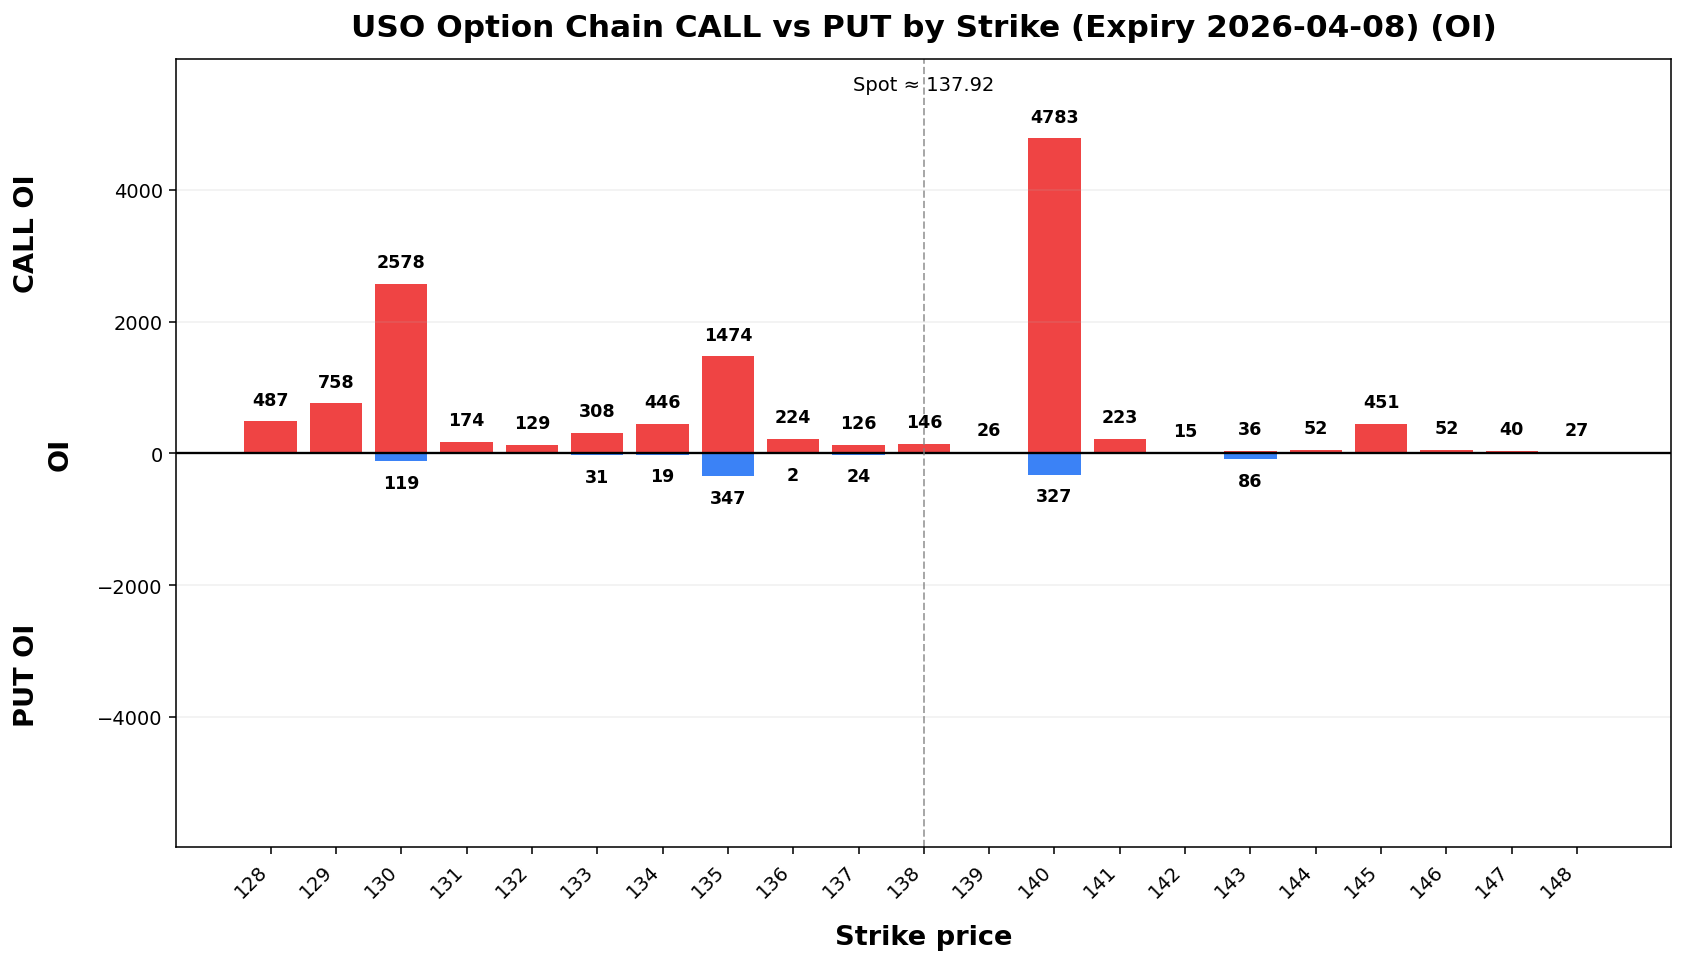
Flow & Skew
Call Vol |
Put Vol |
Vol P/C |
Call OI |
Put OI |
OI P/C |
Skew |
Skew Bias |
|---|
25,711 |
29,056 |
1.13 |
20,630 |
16,676 |
0.81 |
-3.39 vol pts |
CALL_SKEW |
Tail Risk
Q10 |
Q50 |
Q90 |
Down Tail |
Up Tail |
Down/Up |
|---|
114.39 |
133.92 |
151.27 |
23.53 |
13.35 |
1.76 |
Daily Technicals
EMA20 |
EMA50 |
VWAP20 |
BB Lower |
BB Mid |
BB Upper |
BB Width |
Vol Ratio |
Path |
|---|
116.34 |
100.79 |
115.58 |
101.11 |
117.93 |
134.76 |
28.53% |
0.93 |
UP trend (expanding) |
Day Plan
135.00-140.00 range: fade extremes
> 140.00: chase only if hold + vol
< 135.00: risk expand; reduce size
Regime: TRANSITION
Tech: UP trend (expanding)
Swing Plan
Accumulate: 135.00-135.00
Trim: 140.00-140.00
Add: close > 140.00
Cut: close < 135.00
Best for: transition regime
Raw Text Summary
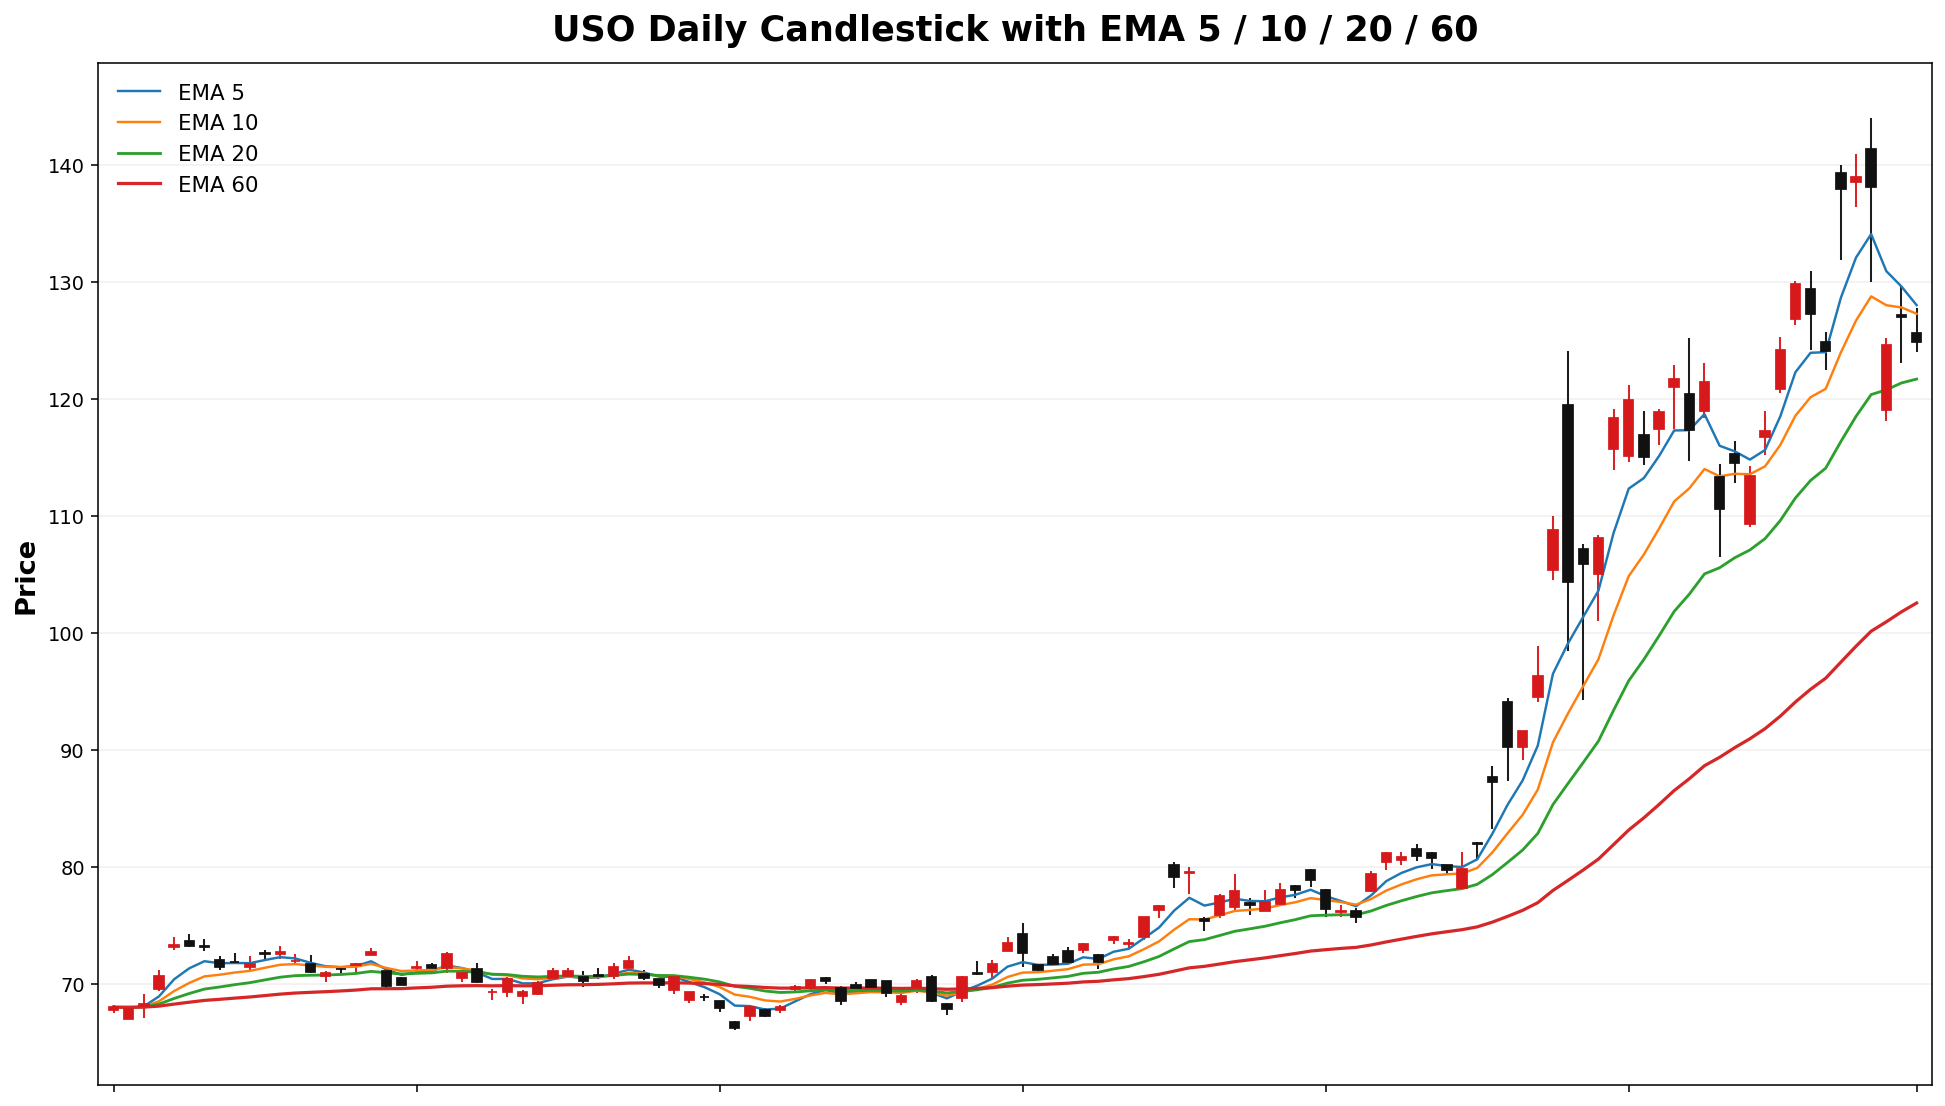
📌 USO @ 137.92 (2026-04-05 06:49 PM MYT)

• Current price is **137.92**. Key support is around **135.00**, and resistance is around **140.00**.
• For the next week, the model’s **68% expected range** is roughly **119.66 to 156.18**.
• A wider **90% range** is about **107.88 to 167.96**.
• Dealer positioning looks **LONG gamma**, so the market behavior is classified as **TRANSITION**.
• The estimated **gamma flip** is near **117.44**. Crossing and holding beyond this area can change the trading behavior.
• Approximate breakout odds: **above resistance 44.6%**, **below support 35.8%** by the target horizon.
• Options skew is tilted toward **calls**, which suggests upside speculation is relatively stronger.
• Near-term implied volatility is higher than the next expiry (**IV1 106.05%76.36% vs IV2 97.81%72.77%**), which suggests **near-term event stress / backwardation**.
• On the daily chart, the stock currently looks like **UP trend (expanding)**.
• The implied distribution shows **heavier downside tail risk** than upside tail potential.
PLASTS
Spot: 35.8894.90
Report Time: 2026-04-0512 06:4908:47 PMAM MYT
Regime: TRENDPIN
Dealer Gamma: SHORTLONG
Term Structure
| Expiry |
DTE |
Forward |
ATM IV |
ATM Straddle |
2026-04-1017 |
6 |
35.6994.85 |
103.32%87.17% |
4.5010.43 |
2026-04-1724 |
13 |
35.7094.86 |
94.61%86.82% |
6.2515.43 |
Weekly Range
| Confidence |
Low |
High |
Width |
| 68% |
30.8583.26 |
40.91106.54 |
10.0523.27 |
| 80% |
29.4479.99 |
42.32109.81 |
12.8829.82 |
| 90% |
27.6175.76 |
44.15114.04 |
16.5338.28 |
| 95% |
26.0372.09 |
117.71 |
45.73 |
19.7061 |
Structure & Probabilities
| Support |
Resistance |
Gamma Flip |
Max Pain |
P>Res |
P<Sup |
35.90.00 |
95.00 |
93.25 |
92.00 |
40.918% |
31.03 |
29.00 |
17.6% |
57.2%33.1% |
Flow & Skew
| Call Vol |
Put Vol |
Vol P/C |
Call OI |
Put OI |
OI P/C |
Skew |
Skew Bias |
3,80220,567 |
4,35515,506 |
1.150.75 |
4,01075,284 |
6,28166,576 |
1.570.88 |
3.122.00 vol pts |
PUT_SKEW |
Tail Risk
| Q10 |
Q50 |
Q90 |
Down Tail |
Up Tail |
Down/Up |
26.8078.18 |
33.7594.28 |
41.64111.79 |
9.0816.72 |
5.7616.89 |
1.580.99 |
Daily Technicals
| EMA20 |
EMA50 |
VWAP20 |
BB Lower |
BB Mid |
BB Upper |
BB Width |
Vol Ratio |
Path |
29.4190.10 |
89.63 |
89.43 |
77.31 |
89.38 |
101.44 |
26.4099% |
30.31 |
20.97 |
28.78 |
36.60 |
54.30% |
1.390.95 |
UP trend (expanding) |
Day Plan
35.90.00-40.9195.00 range: fade extremes- >
40.91:95.00: chase only if hold + vol
- <
35.90.00: risk expand; reduce size
- Regime:
TRENDPIN
- Tech: UP trend (expanding)
Swing Plan
- Accumulate:
35.90.00-35.90.00
- Trim:
40.91-40.9195.00-95.00
- Add: close >
40.9195.00
- Cut: close <
35.90.00
- Best for:
trendpin regime
Raw Text Summary
📌 PLASTS @ 35.8894.90 (2026-04-0512 06:4908:47 PMAM MYT)

• Current price is **35.88*94.90**. Key support is around **35.90.00**, and resistance is around **40.91*95.00**.
• For the next week, the model’s **68% expected range** is roughly **30.8583.26 to 40.91*106.54**.
• A wider **90% range** is about **27.6175.76 to 44.15*114.04**.
• Dealer positioning looks **SHORTLONG gamma**, so the market behavior is classified as **TREND*PIN**.
• The estimated **gamma flip** is near **31.03*93.25**. Crossing and holding beyond this area can change the trading behavior.
• Approximate breakout odds: **above resistance 17.6%40.8%**, **below support 57.2%33.1%** by the target horizon.
• Options skew is tilted toward **puts**, which suggests traders are paying more for downside protection.
• Near-term implied volatility is higher than the next expiry (**IV1 103.32%87.17% vs IV2 94.61%86.82%**), which suggests **near-term event stress / backwardation**.
• On the daily chart, the stock currently looks like **UP trend (expanding)**.
• The implied distribution is **fairly balanced** between upside and downside tails.
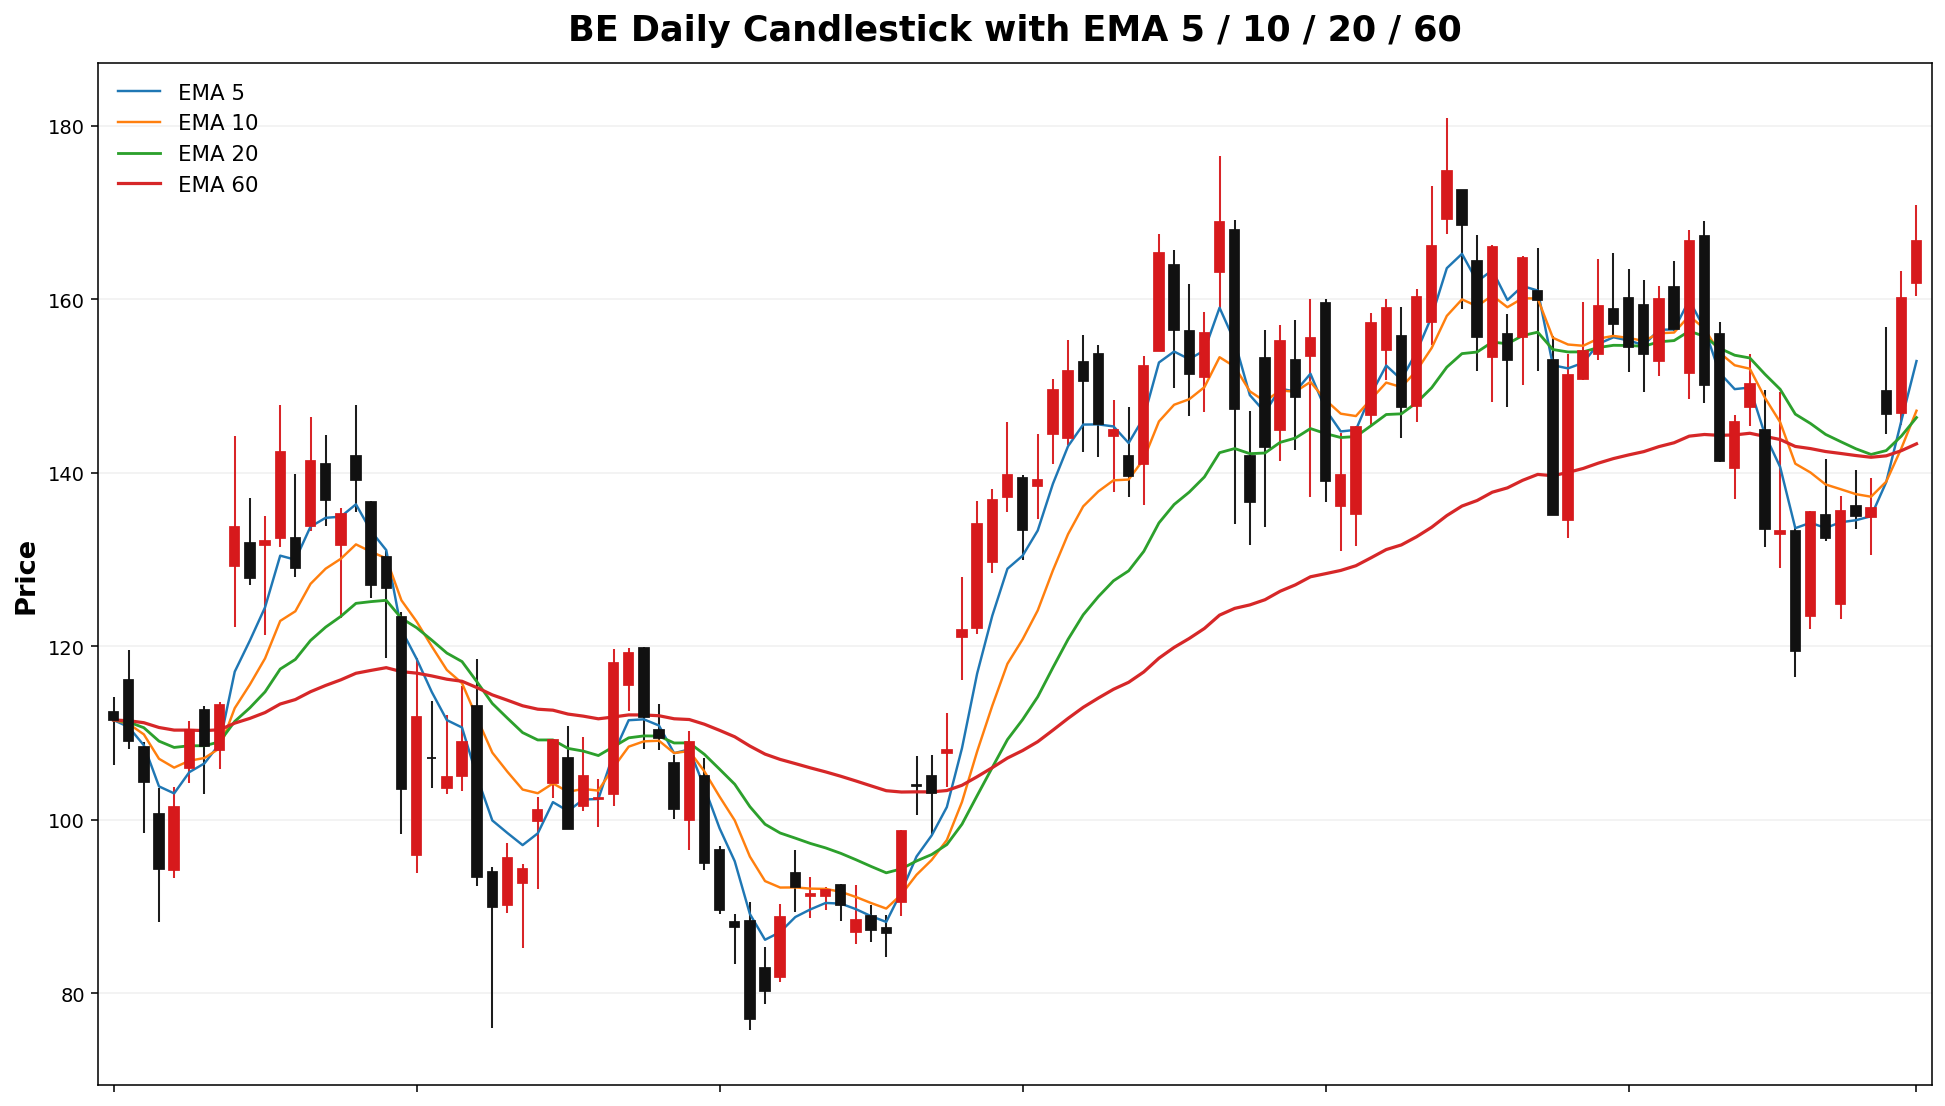
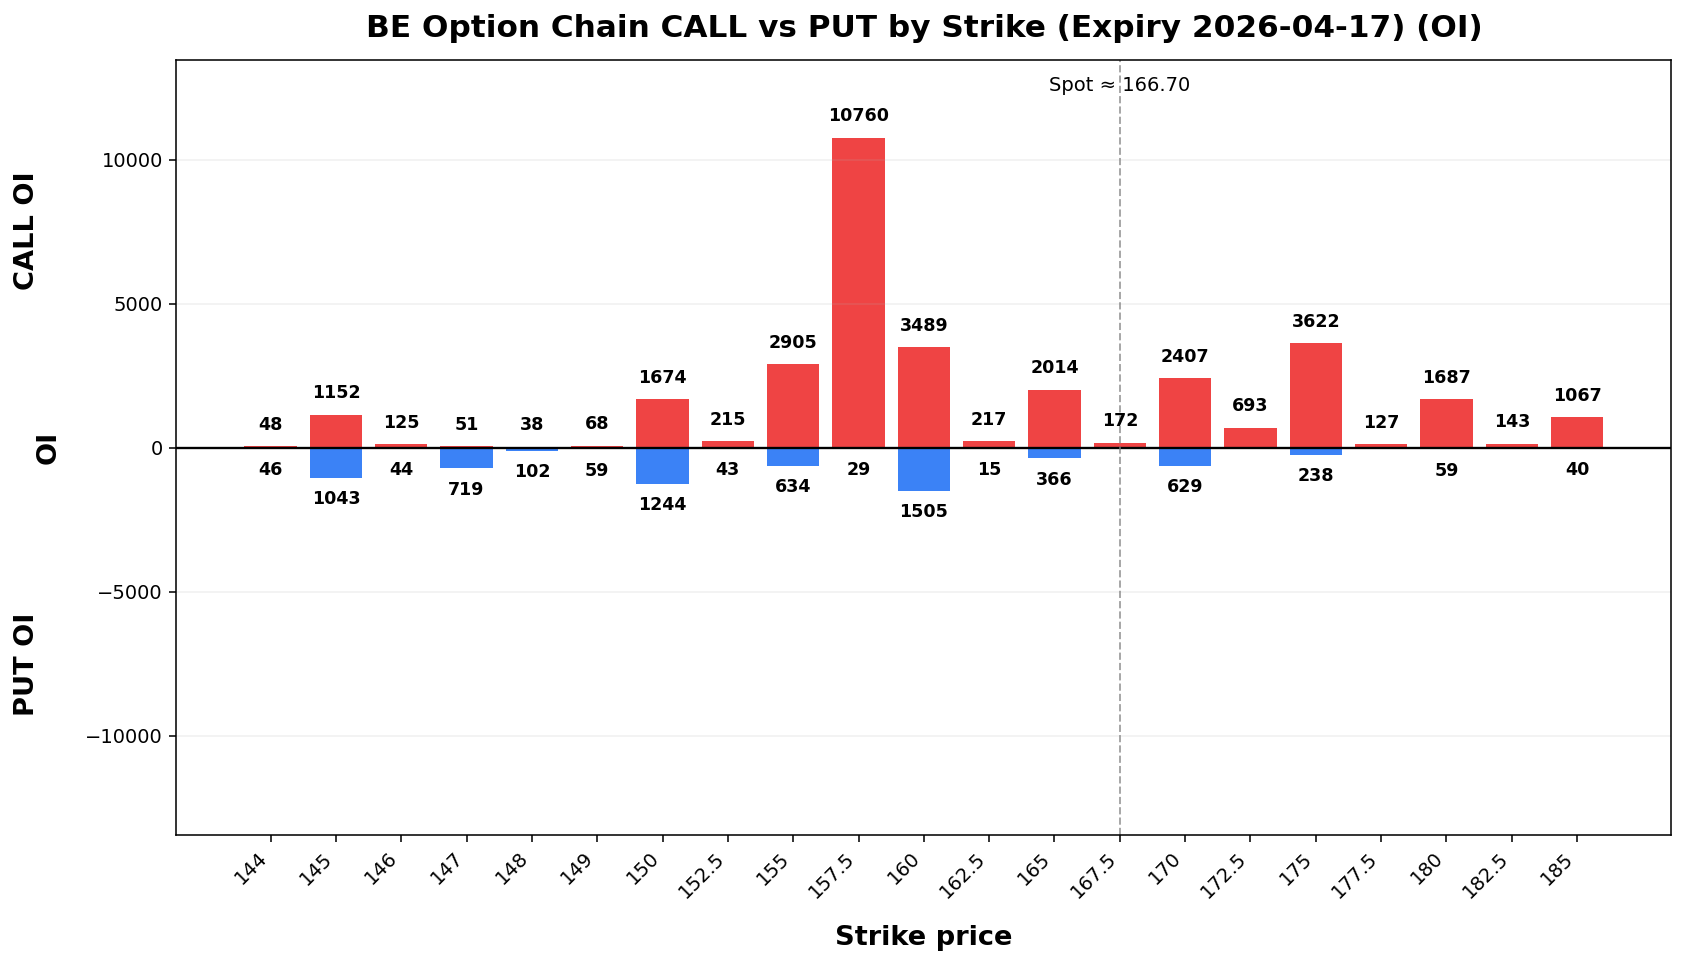
BE
Spot: 166.70
Report Time: 2026-04-12 08:47 AM MYT
Regime: TRANSITION
Dealer Gamma: LONG
Term Structure
| Expiry |
DTE |
Forward |
ATM IV |
ATM Straddle |
| 2026-04-17 |
6 |
166.65 |
84.14% |
17.68 |
| 2026-04-24 |
13 |
166.48 |
82.99% |
25.90 |
Weekly Range
| Confidence |
Low |
High |
Width |
| 68% |
147.04 |
186.36 |
39.32 |
| 80% |
141.51 |
191.89 |
50.39 |
| 90% |
134.36 |
199.04 |
64.67 |
| 95% |
128.17 |
205.23 |
77.06 |
Structure & Probabilities
| Support |
Resistance |
Gamma Flip |
Max Pain |
P>Res |
P<Sup |
| 160.00 |
175.00 |
133.61 |
130.00 |
27.6% |
36.0% |
Flow & Skew
| Call Vol |
Put Vol |
Vol P/C |
Call OI |
Put OI |
OI P/C |
Skew |
Skew Bias |
| 13,590 |
19,911 |
1.47 |
58,865 |
55,746 |
0.95 |
9.84 vol pts |
PUT_SKEW |
Tail Risk
| Q10 |
Q50 |
Q90 |
Down Tail |
Up Tail |
Down/Up |
| 31.54 |
37.72 |
179.30 |
135.16 |
12.60 |
10.72 |
Daily Technicals
| EMA20 |
EMA50 |
VWAP20 |
BB Lower |
BB Mid |
BB Upper |
BB Width |
Vol Ratio |
Path |
| 146.38 |
144.57 |
146.20 |
119.73 |
145.67 |
171.61 |
35.62% |
0.94 |
UP trend (expanding) |
Day Plan
- 160.00-175.00 range: fade extremes
- > 175.00: chase only if hold + vol
- < 160.00: risk expand; reduce size
- Regime: TRANSITION
- Tech: UP trend (expanding)
Swing Plan
- Accumulate: 160.00-160.00
- Trim: 175.00-175.00
- Add: close > 175.00
- Cut: close < 160.00
- Best for: transition regime
Raw Text Summary
📌 BE @ 166.70 (2026-04-12 08:47 AM MYT)

• Current price is **166.70**. Key support is around **160.00**, and resistance is around **175.00**.
• For the next week, the model’s **68% expected range** is roughly **147.04 to 186.36**.
• A wider **90% range** is about **134.36 to 199.04**.
• Dealer positioning looks **LONG gamma**, so the market behavior is classified as **TRANSITION**.
• The estimated **gamma flip** is near **133.61**. Crossing and holding beyond this area can change the trading behavior.
• Approximate breakout odds: **above resistance 27.6%**, **below support 36.0%** by the target horizon.
• Options skew is tilted toward **puts**, which suggests traders are paying more for downside protection.
• Near-term implied volatility is higher than the next expiry (**IV1 84.14% vs IV2 82.99%**), which suggests **near-term event stress / backwardation**.
• On the daily chart, the stock currently looks like **UP trend (expanding)**.
• The implied distribution shows **heavier downside tail risk** than upside tail potential.
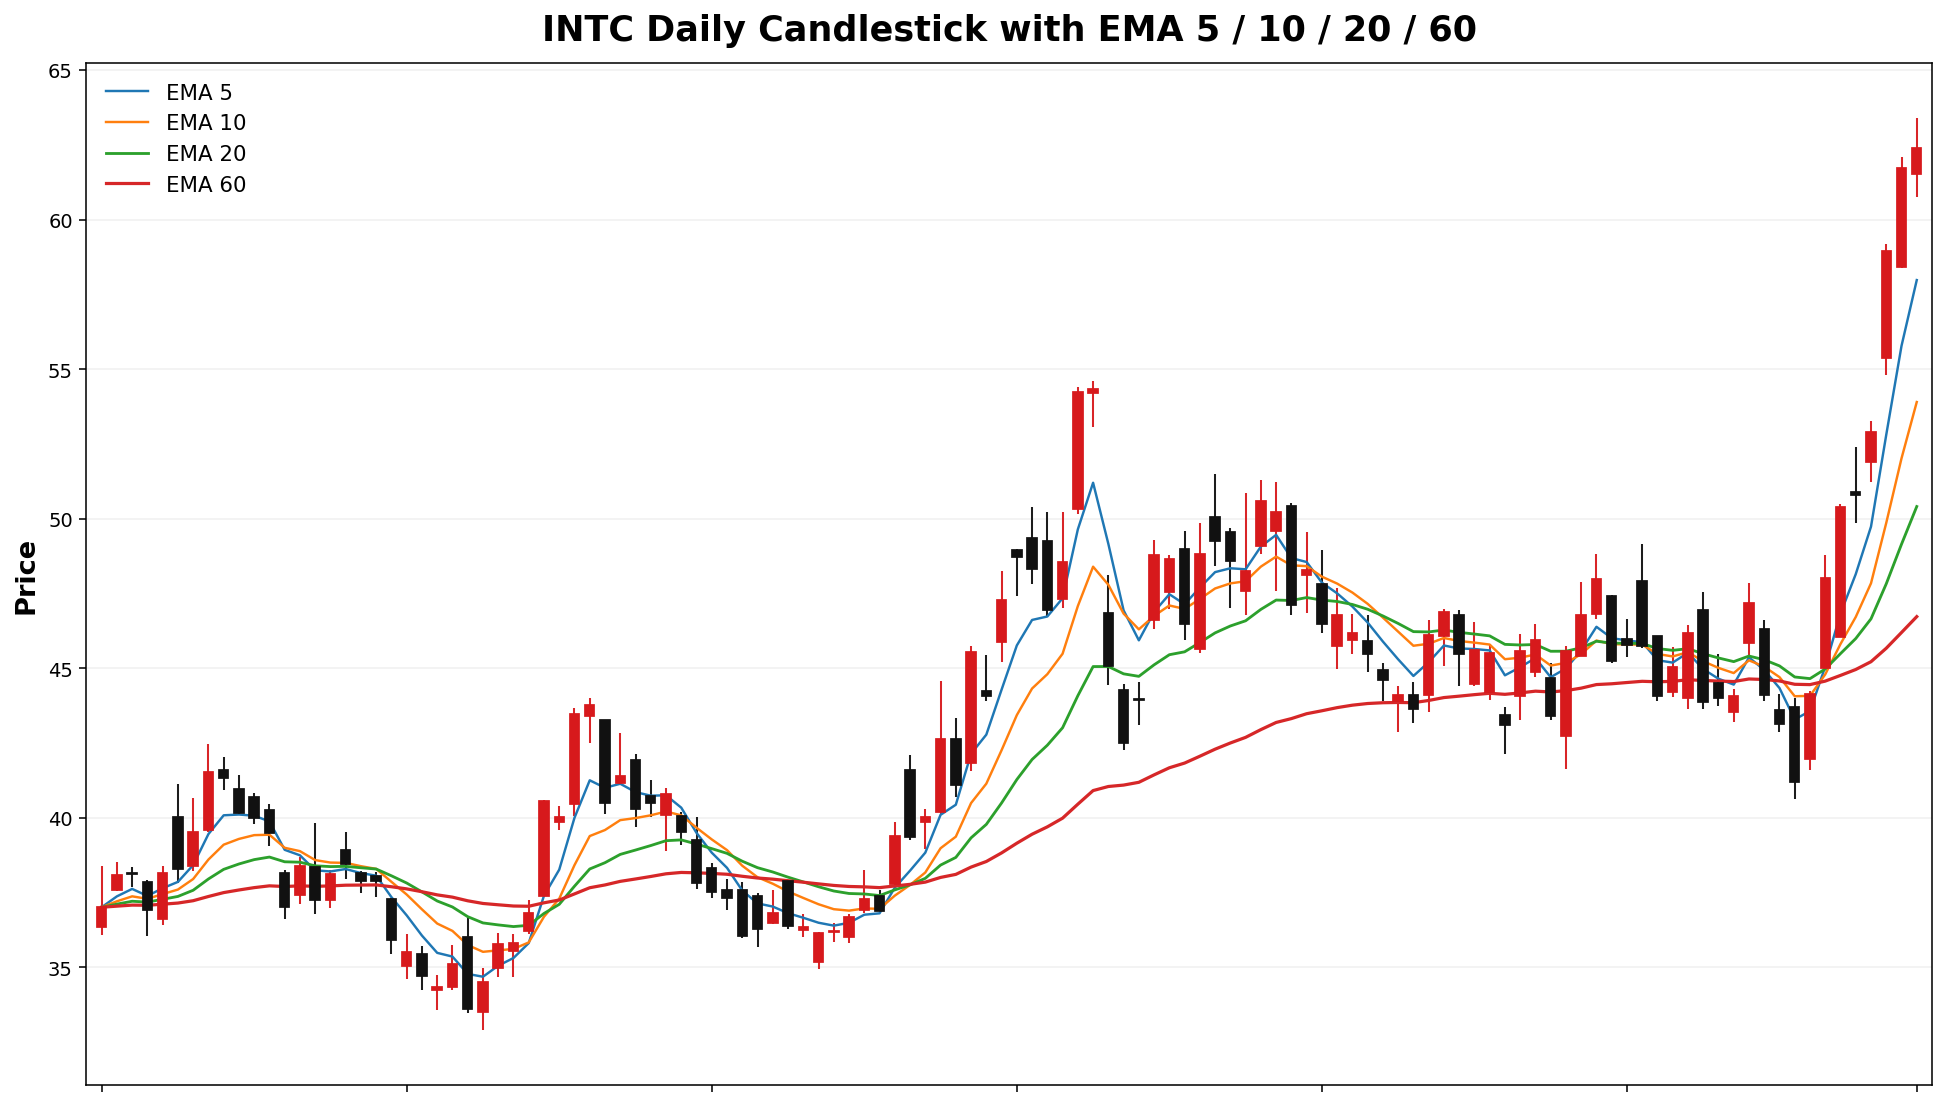
UCOINTC
Spot: 39.6662.38
Report Time: 2026-04-0512 06:4908:47 PMAM MYT
Regime: TRANSITION
Dealer Gamma: LONG
Term Structure
| Expiry |
DTE |
Forward |
ATM IV |
ATM Straddle |
| 2026-04-17 |
136 |
39.4662.41 |
104.76%54.83% |
7.654.31 |
2026-05-1504-24 |
4113 |
39.6762.47 |
97.06%73.22% |
12.808.55 |
Weekly Range
| Confidence |
Low |
High |
Width |
| 68% |
33.40 |
45.56.92 |
12.5267.84 |
10.93 |
| 80% |
31.6455.38 |
47.6869.38 |
16.0514.00 |
| 90% |
29.3653.39 |
49.9671.37 |
20.6017.97 |
| 95% |
27.3951.67 |
51.9373.09 |
24.5421.41 |
Structure & Probabilities
| Support |
Resistance |
Gamma Flip |
Max Pain |
P>Res |
P<Sup |
35.60.00 |
40.65.00 |
27.9547.54 |
30.48.00 |
43.7%25.8% |
17.4%27.1% |
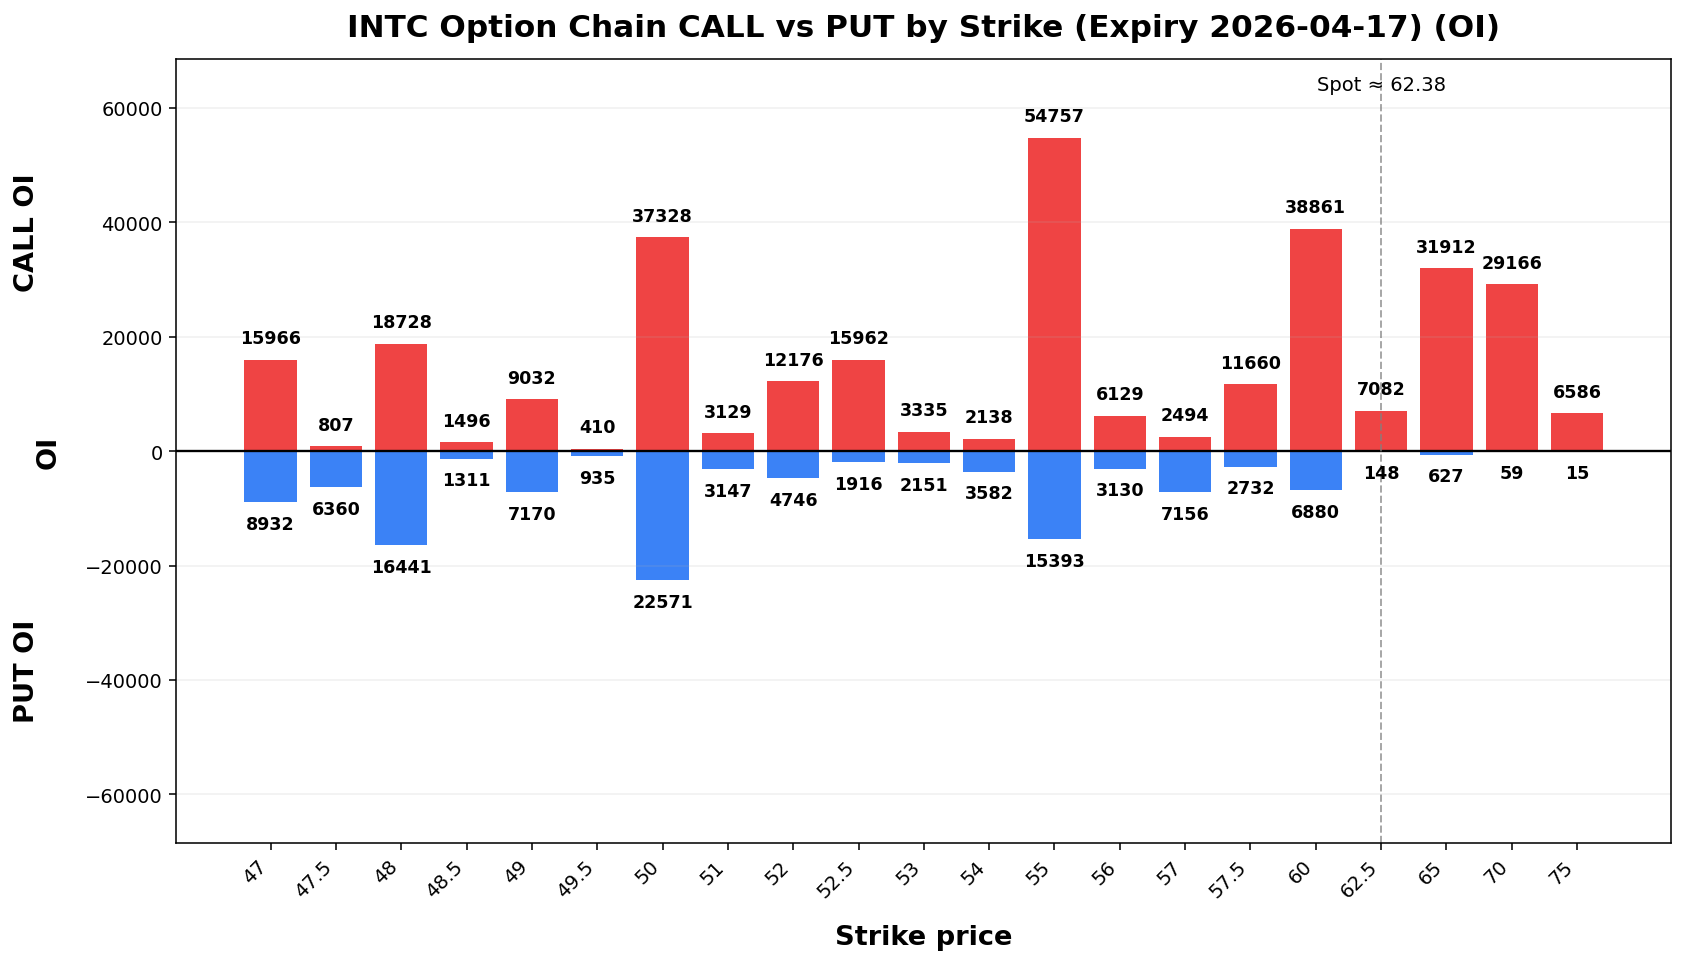
Flow & Skew
| Call Vol |
Put Vol |
Vol P/C |
Call OI |
Put OI |
OI P/C |
Skew |
Skew Bias |
4,90966,469 |
2,79065,617 |
0.5799 |
36,506424,497 |
21,001434,057 |
0.581.02 |
-6.201.51 vol pts |
CALL_SKEW |
Tail Risk
| Q10 |
Q50 |
Q90 |
Down Tail |
Up Tail |
Down/Up |
27.0051.53 |
37.8661.59 |
50.14 |
12.6669.58 |
10.4885 |
7.20 |
1.2151 |
Daily Technicals
| EMA20 |
EMA50 |
VWAP20 |
BB Lower |
BB Mid |
BB Upper |
BB Width |
Vol Ratio |
Path |
37.8950.41 |
32.3047.28 |
37.7749.12 |
33.0535.71 |
39.1948.18 |
45.3260.65 |
31.31%51.77% |
0.8096 |
UP trend (expanding) |
Day Plan
35.60.00-40.65.00 range: fade extremes- >
40.65.00: chase only if hold + vol
- <
35.60.00: risk expand; reduce size
- Regime: TRANSITION
- Tech: UP trend (expanding)
Swing Plan
- Accumulate:
35.60.00-35.60.00
- Trim:
40.65.00-40.65.00
- Add: close >
40.65.00
- Cut: close <
35.60.00
- Best for: transition regime
Raw Text Summary
📌 UCOINTC @ 39.6662.38 (2026-04-0512 06:4908:47 PMAM MYT)

• Current price is **39.66*62.38**. Key support is around **35.60.00**, and resistance is around **40.65.00**.
• For the next week, the model’s **68% expected range** is roughly **33.4056.92 to 45.92*67.84**.
• A wider **90% range** is about **29.3653.39 to 49.96*71.37**.
• Dealer positioning looks **LONG gamma**, so the market behavior is classified as **TRANSITION**.
• The estimated **gamma flip** is near **27.95*47.54**. Crossing and holding beyond this area can change the trading behavior.
• Approximate breakout odds: **above resistance 43.7%25.8%**, **below support 27.1%** by the target horizon.
• Options skew is fairly balanced, so there is **no strong directional bias** from skew alone.
• Near-term implied volatility is lower than the next expiry (**IV1 54.83% vs IV2 73.22%**), which suggests a **contango / calmer front expiry** setup.
• On the daily chart, the stock currently looks like **UP trend (expanding)**.
• The implied distribution shows **heavier downside tail risk** than upside tail potential.
CRWV
Spot: 102.00
Report Time: 2026-04-12 08:47 AM MYT
Regime: TRANSITION
Dealer Gamma: LONG
Term Structure
| Expiry |
DTE |
Forward |
ATM IV |
ATM Straddle |
| 2026-04-17 |
6 |
102.05 |
78.58% |
10.10 |
| 2026-04-24 |
13 |
102.08 |
74.63% |
14.25 |
Weekly Range
| Confidence |
Low |
High |
Width |
| 68% |
90.91 |
113.09 |
22.17 |
| 80% |
87.79 |
116.21 |
28.41 |
| 90% |
83.77 |
120.23 |
36.47 |
| 95% |
80.27 |
123.73 |
43.46 |
Structure & Probabilities
| Support |
Resistance |
Gamma Flip |
Max Pain |
P>Res |
P<Sup |
| 100.00 |
105.00 |
85.25 |
82.50 |
36.2% |
47.1% |
Flow & Skew
| Call Vol |
Put Vol |
Vol P/C |
Call OI |
Put OI |
OI P/C |
Skew |
Skew Bias |
| 146,464 |
92,411 |
0.63 |
188,773 |
179,205 |
0.95 |
7.32 vol pts |
PUT_SKEW |
Tail Risk
| Q10 |
Q50 |
Q90 |
Down Tail |
Up Tail |
Down/Up |
| 82.44 |
101.91 |
117.95 |
19.56 |
15.95 |
1.23 |
Daily Technicals
| EMA20 |
EMA50 |
VWAP20 |
BB Lower |
BB Mid |
BB Upper |
BB Width |
Vol Ratio |
Path |
| 84.60 |
85.13 |
85.11 |
69.57 |
82.91 |
96.26 |
32.19% |
3.11 |
Sideways / Range |
Day Plan
- 100.00-105.00 range: fade extremes
- > 105.00: chase only if hold + vol
- < 100.00: risk expand; reduce size
- Regime: TRANSITION
- Tech: Sideways / Range
Swing Plan
- Accumulate: 100.00-100.00
- Trim: 105.00-105.00
- Add: close > 105.00
- Cut: close < 100.00
- Best for: transition regime
Raw Text Summary
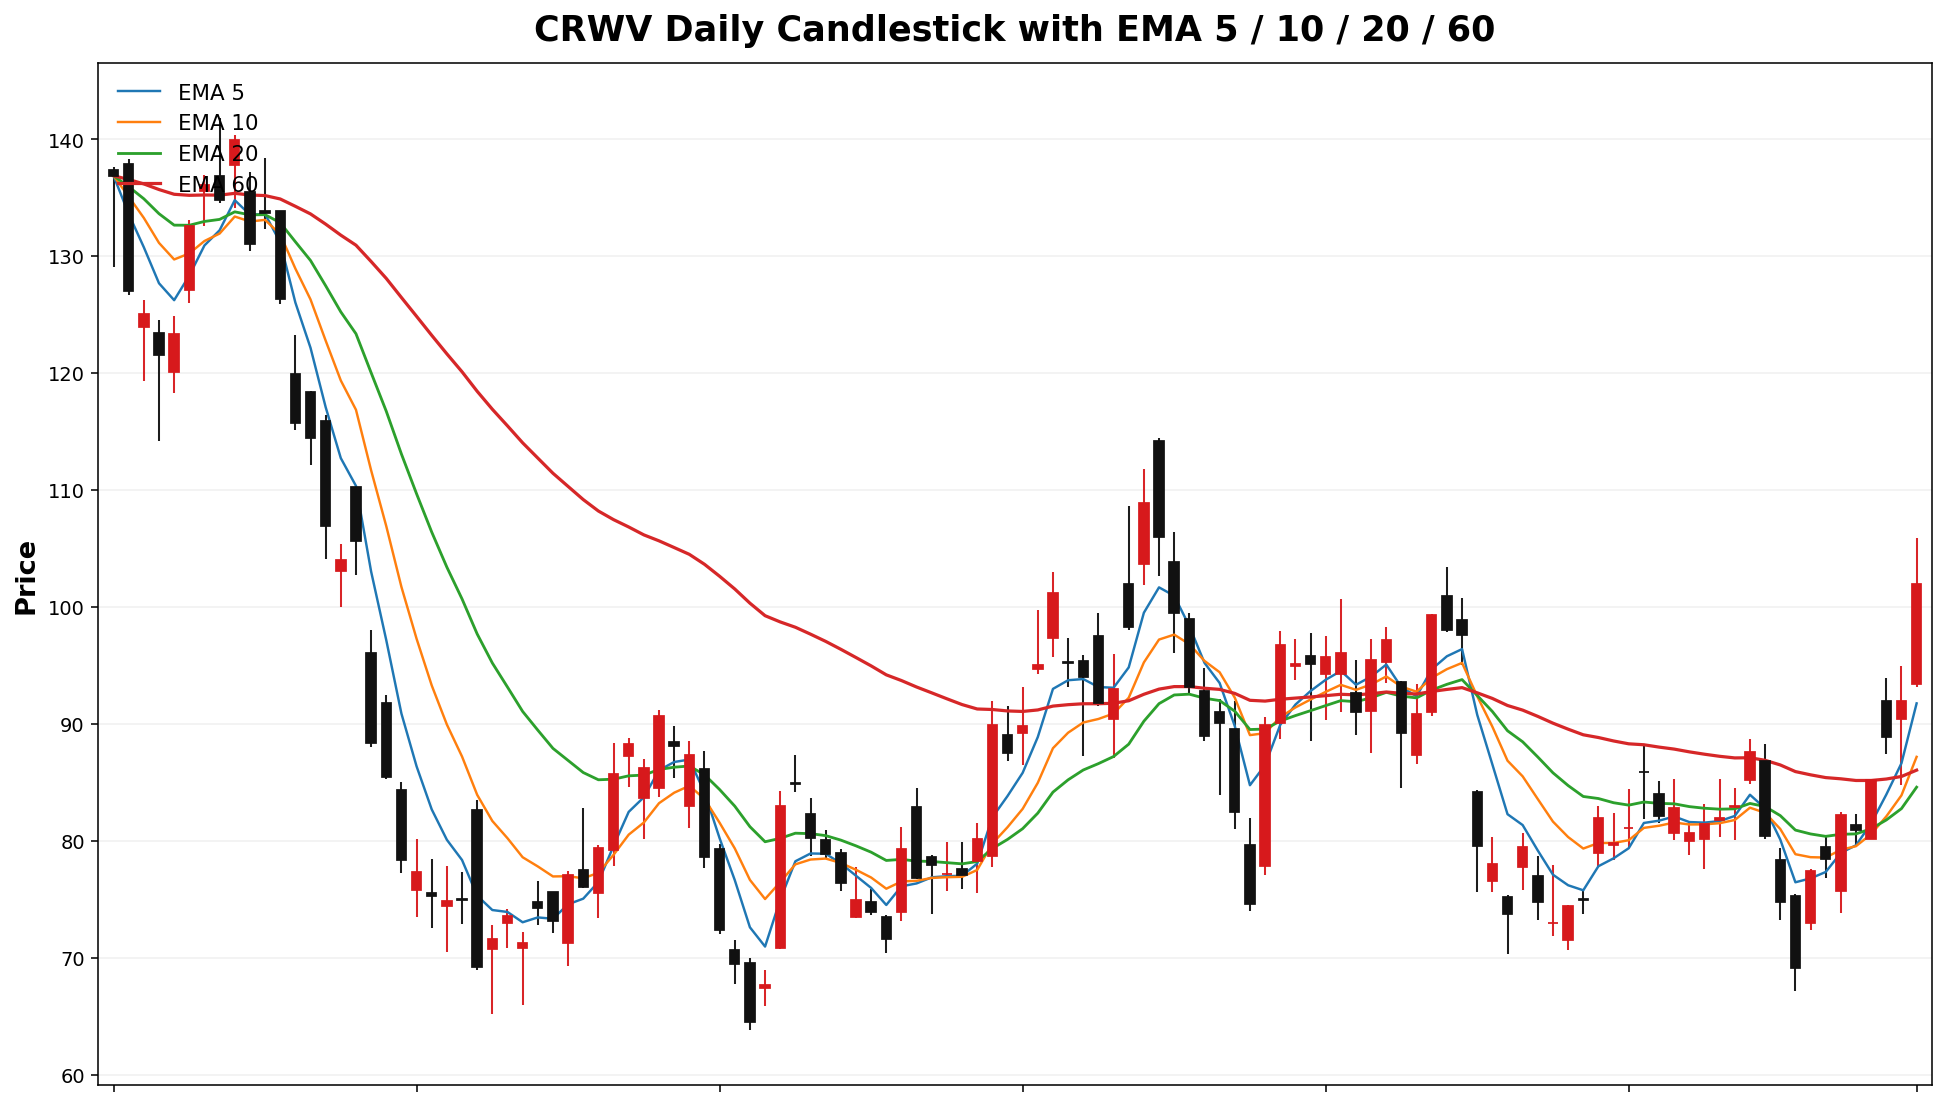
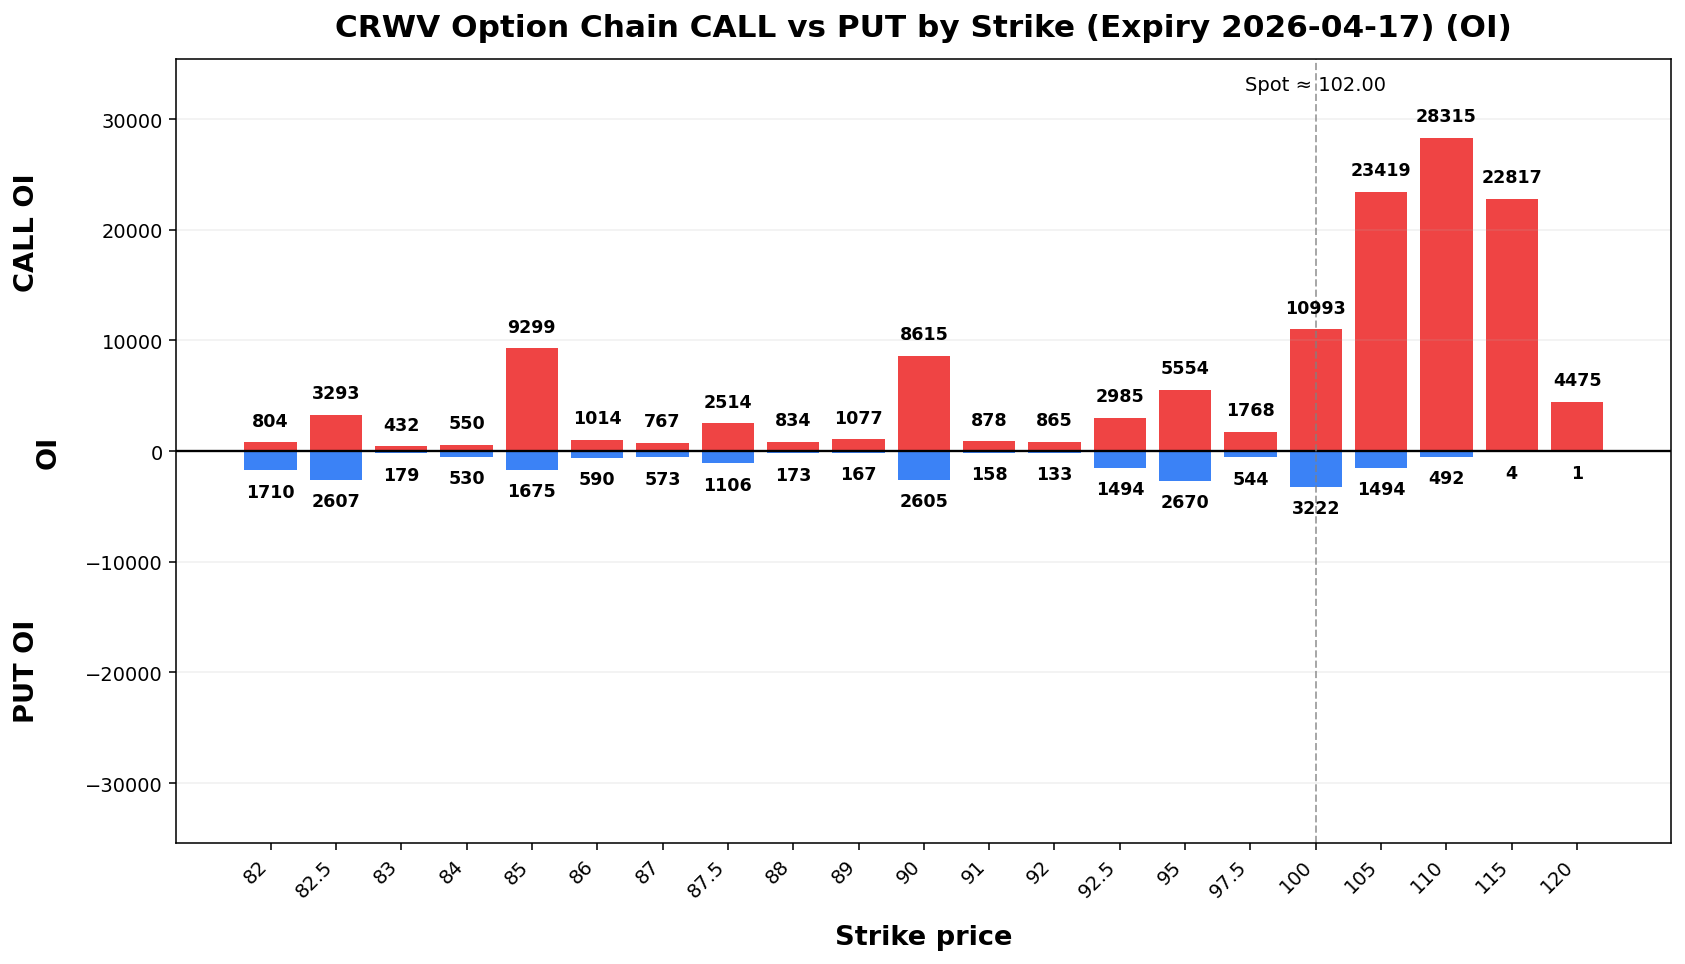
📌 CRWV @ 102.00 (2026-04-12 08:47 AM MYT)

• Current price is **102.00**. Key support is around **100.00**, and resistance is around **105.00**.
• For the next week, the model’s **68% expected range** is roughly **90.91 to 113.09**.
• A wider **90% range** is about **83.77 to 120.23**.
• Dealer positioning looks **LONG gamma**, so the market behavior is classified as **TRANSITION**.
• The estimated **gamma flip** is near **85.25**. Crossing and holding beyond this area can change the trading behavior.
• Approximate breakout odds: **above resistance 36.2%**, **below support 47.1%** by the target horizon.
• Options skew is tilted toward **puts**, which suggests traders are paying more for downside protection.
• Near-term implied volatility is higher than the next expiry (**IV1 78.58% vs IV2 74.63%**), which suggests **near-term event stress / backwardation**.
• Recent volume is **3.11x** the 20-day average, which supports stronger continuation or breakout follow-through.
• On the daily chart, the stock currently looks like **Sideways / Range**.
• The implied distribution shows **heavier downside tail risk** than upside tail potential.
AXTI
Spot: 64.18
Report Time: 2026-04-12 08:47 AM MYT
Regime: TRANSITION
Dealer Gamma: LONG
Term Structure
| Expiry |
DTE |
Forward |
ATM IV |
ATM Straddle |
| 2026-04-17 |
6 |
64.88 |
157.65% |
12.75 |
| 2026-04-24 |
13 |
64.91 |
145.65% |
17.4%50 |
Weekly Range
| Confidence |
Low |
High |
Width |
| 68% |
50.31 |
78.05 |
27.73 |
| 80% |
46.41 |
81.95 |
35.54 |
| 90% |
41.37 |
86.99 |
45.61 |
| 95% |
37.00 |
91.36 |
54.35 |
Structure & Probabilities
| Support |
Resistance |
Gamma Flip |
Max Pain |
P>Res |
P<Sup |
| 60.00 |
65.00 |
48.80 |
50.00 |
46.8% |
31.3% |
Flow & Skew
| Call Vol |
Put Vol |
Vol P/C |
Call OI |
Put OI |
OI P/C |
Skew |
Skew Bias |
| 6,285 |
3,758 |
0.60 |
28,499 |
27,246 |
0.96 |
-3.91 vol pts |
CALL_SKEW |
Tail Risk
| Q10 |
Q50 |
Q90 |
Down Tail |
Up Tail |
Down/Up |
| 45.03 |
65.77 |
84.01 |
19.15 |
19.83 |
0.97 |
Daily Technicals
| EMA20 |
EMA50 |
VWAP20 |
BB Lower |
BB Mid |
BB Upper |
BB Width |
Vol Ratio |
Path |
| 52.80 |
43.11 |
54.44 |
39.10 |
54.98 |
70.87 |
57.80% |
0.93 |
UP trend (expanding) |
Day Plan
- 60.00-65.00 range: fade extremes
- > 65.00: chase only if hold + vol
- < 60.00: risk expand; reduce size
- Regime: TRANSITION
- Tech: UP trend (expanding)
Swing Plan
- Accumulate: 60.00-60.00
- Trim: 65.00-65.00
- Add: close > 65.00
- Cut: close < 60.00
- Best for: transition regime
Raw Text Summary
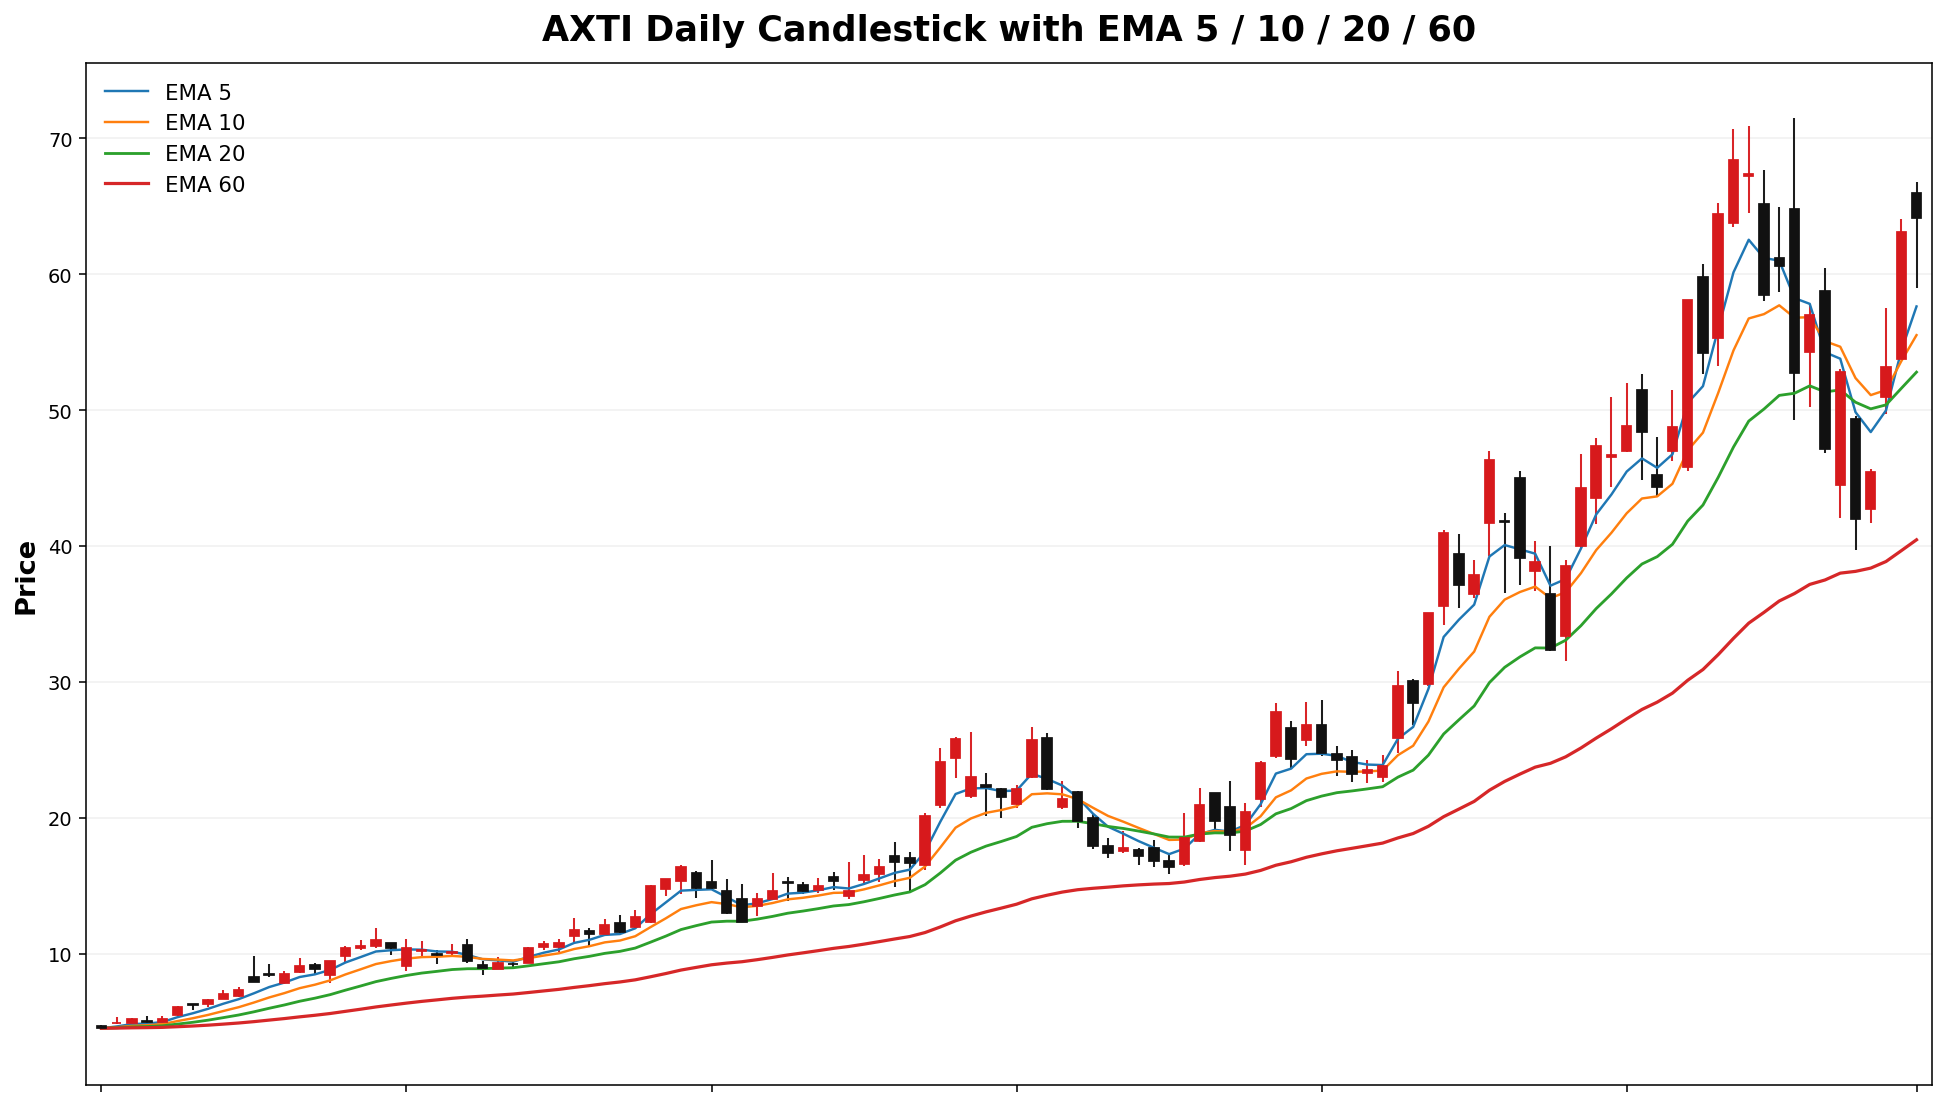
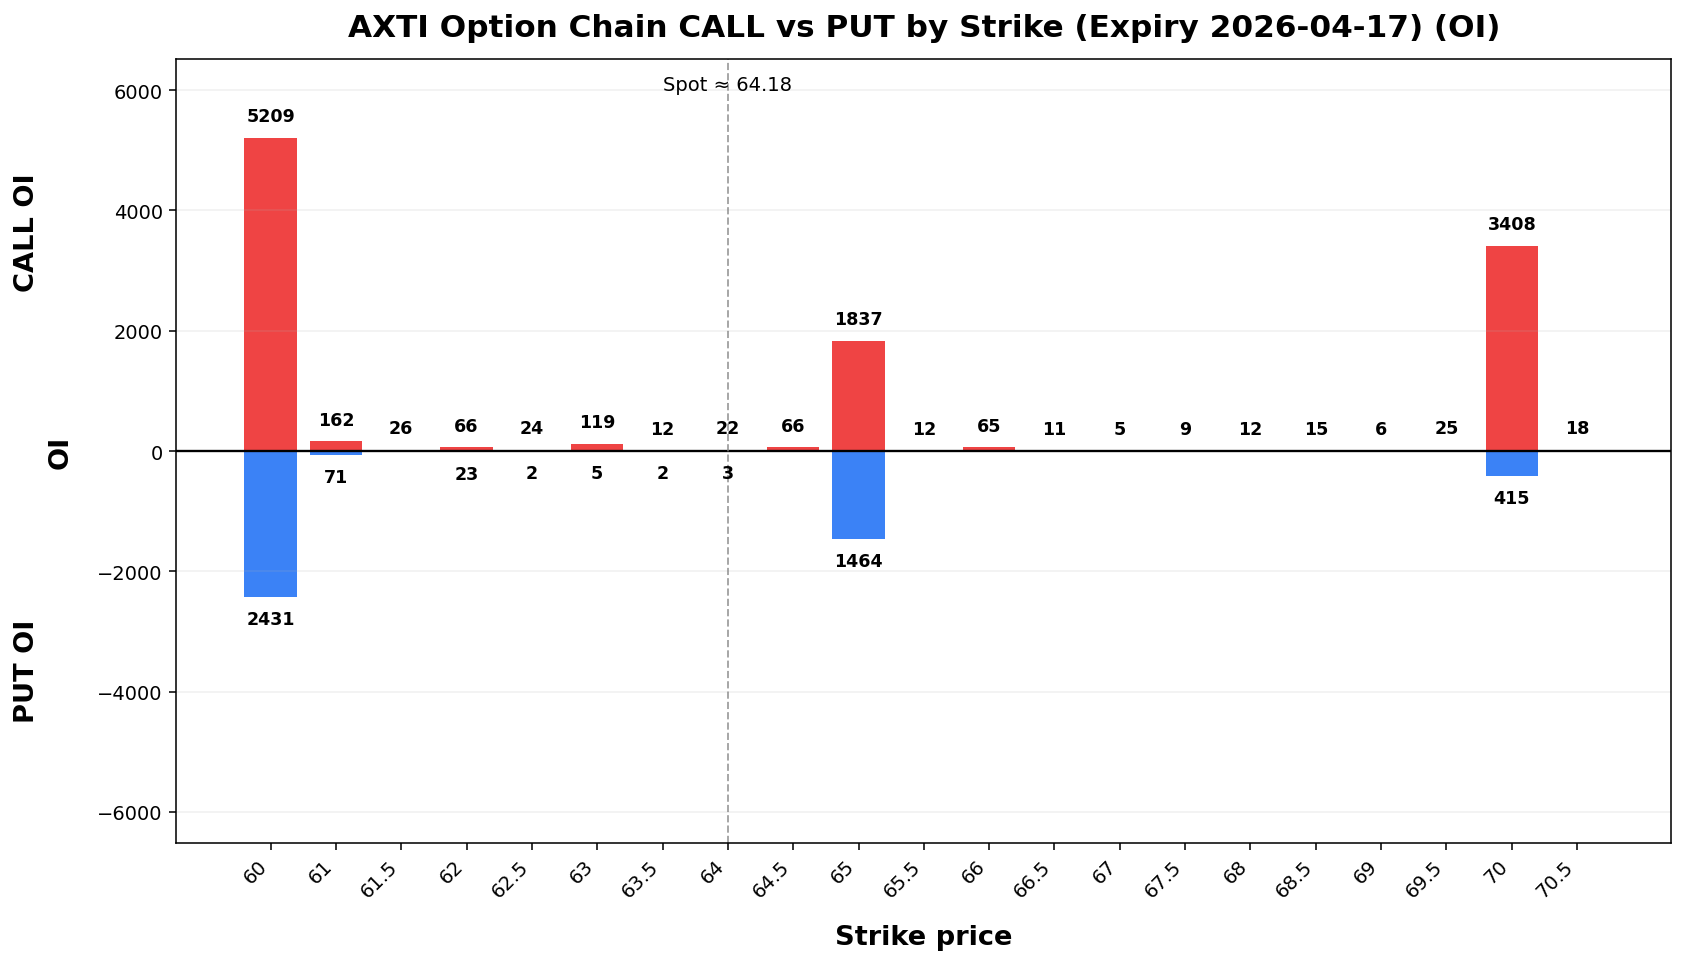
📌 AXTI @ 64.18 (2026-04-12 08:47 AM MYT)

• Current price is **64.18**. Key support is around **60.00**, and resistance is around **65.00**.
• For the next week, the model’s **68% expected range** is roughly **50.31 to 78.05**.
• A wider **90% range** is about **41.37 to 86.99**.
• Dealer positioning looks **LONG gamma**, so the market behavior is classified as **TRANSITION**.
• The estimated **gamma flip** is near **48.80**. Crossing and holding beyond this area can change the trading behavior.
• Approximate breakout odds: **above resistance 46.8%**, **below support 31.3%** by the target horizon.
• Options skew is tilted toward **calls**, which suggests upside speculation is relatively stronger.
• Near-term implied volatility is higher than the next expiry (**IV1 104.76%157.65% vs IV2 97.06%145.65%**), which suggests **near-term event stress / backwardation**.
• On the daily chart, the stock currently looks like **UP trend (expanding)**.
• The implied distribution is **fairly balanced** between upside and downside tails.
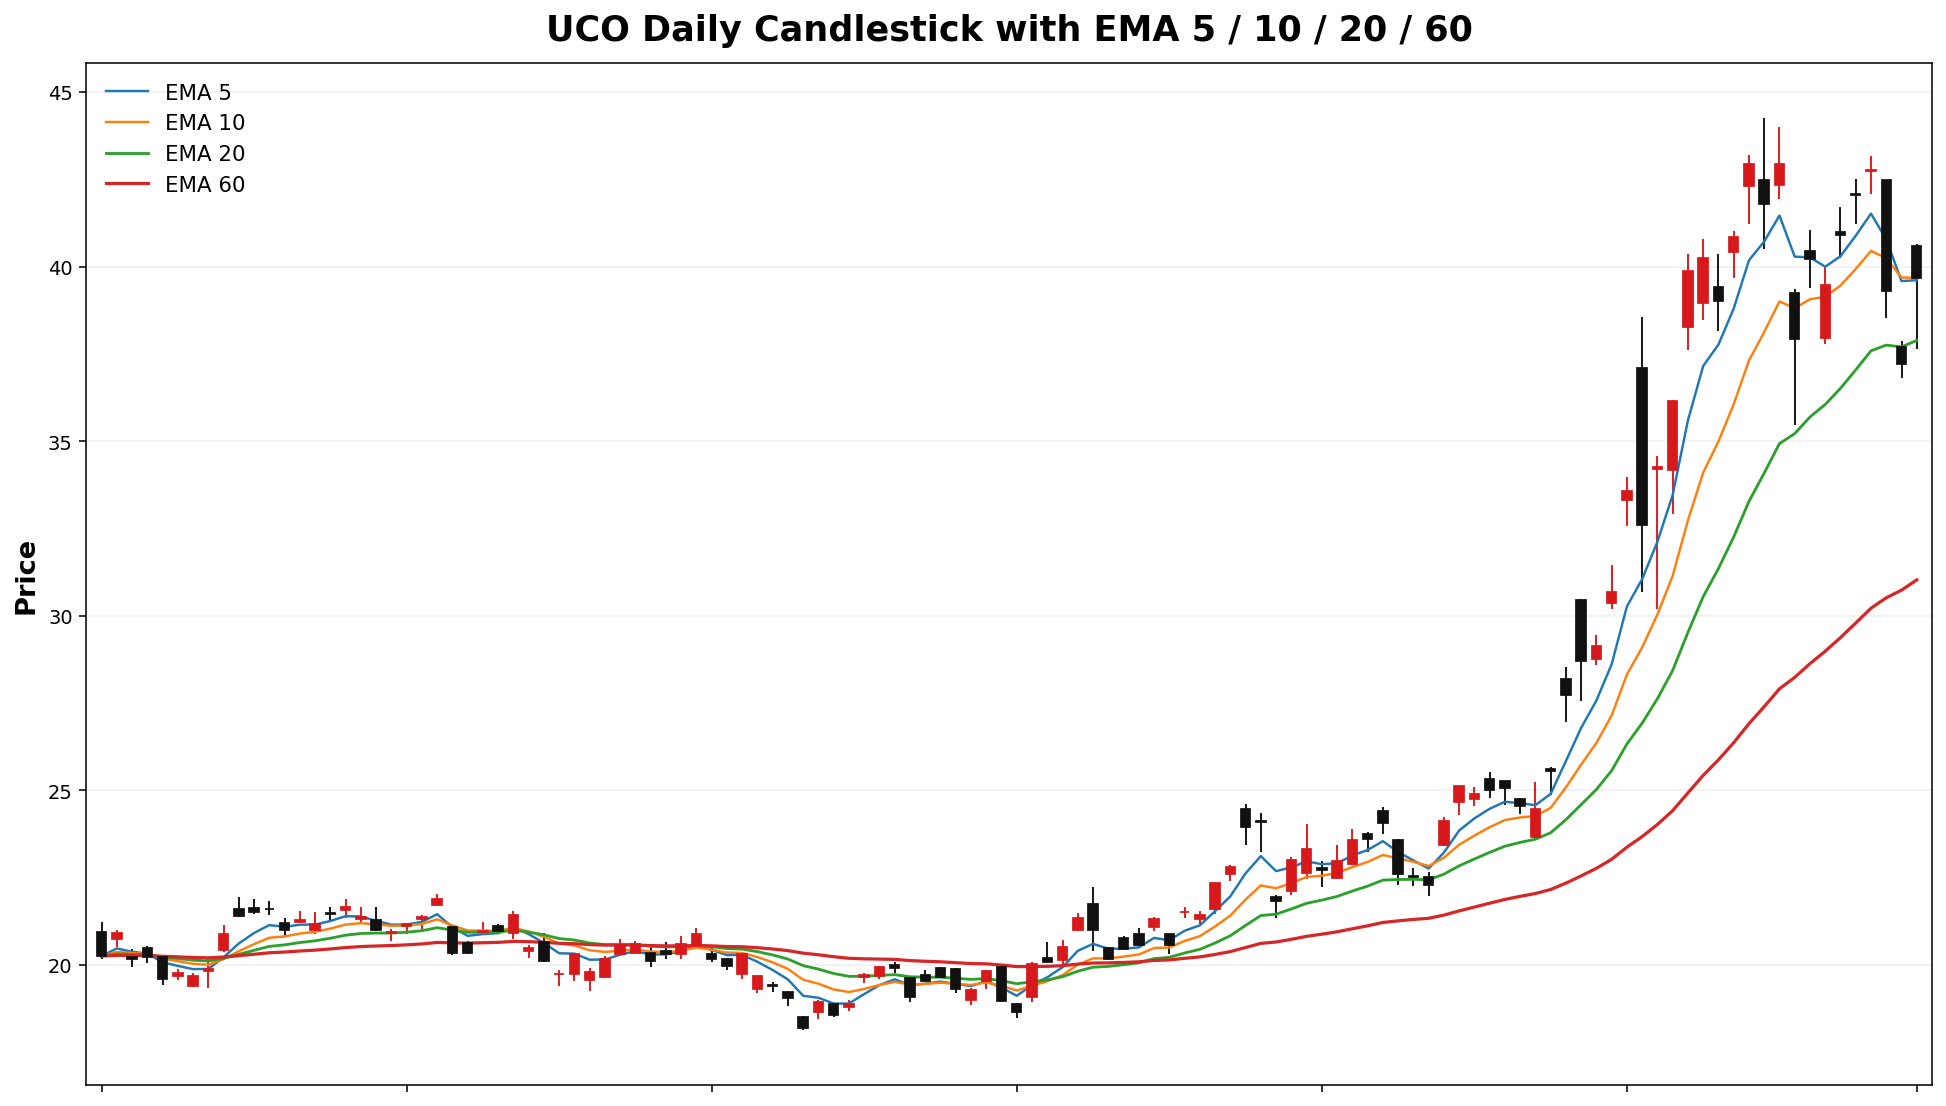
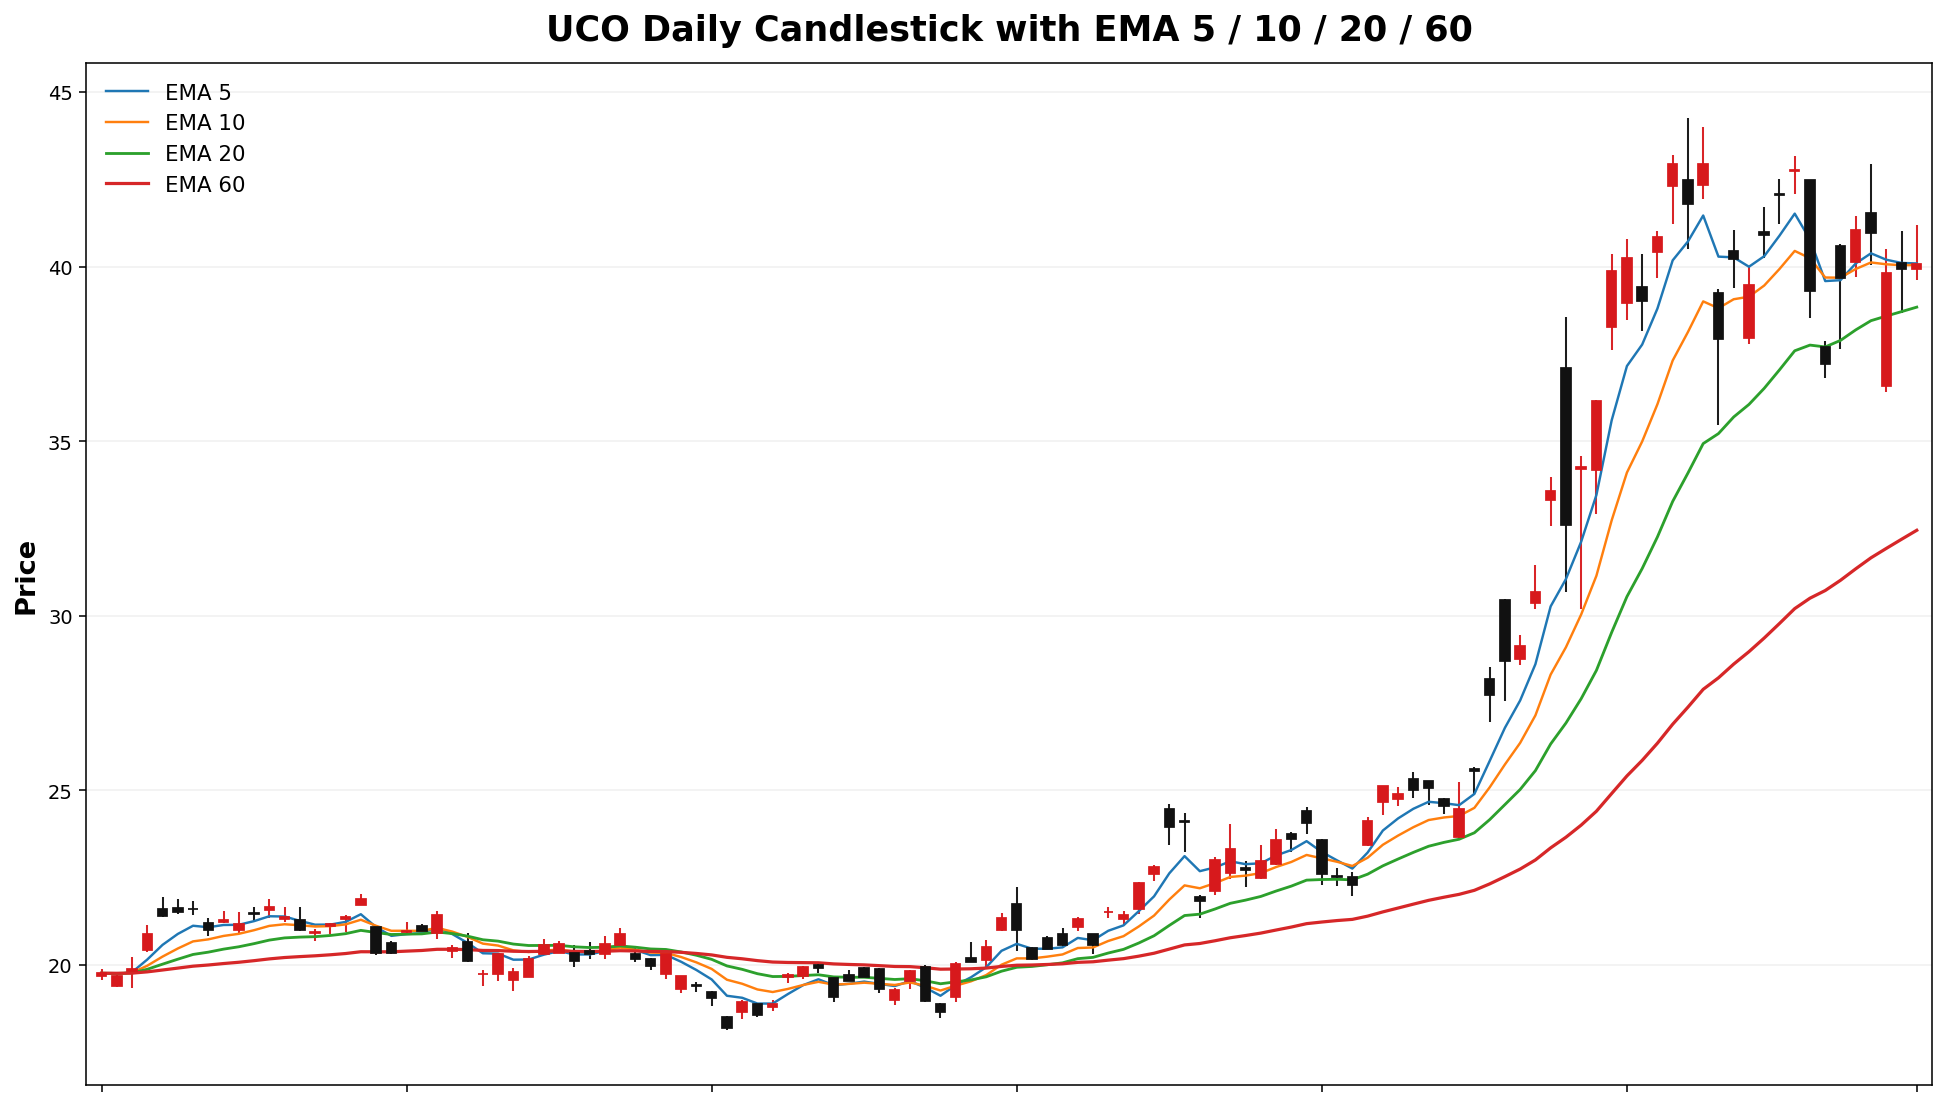
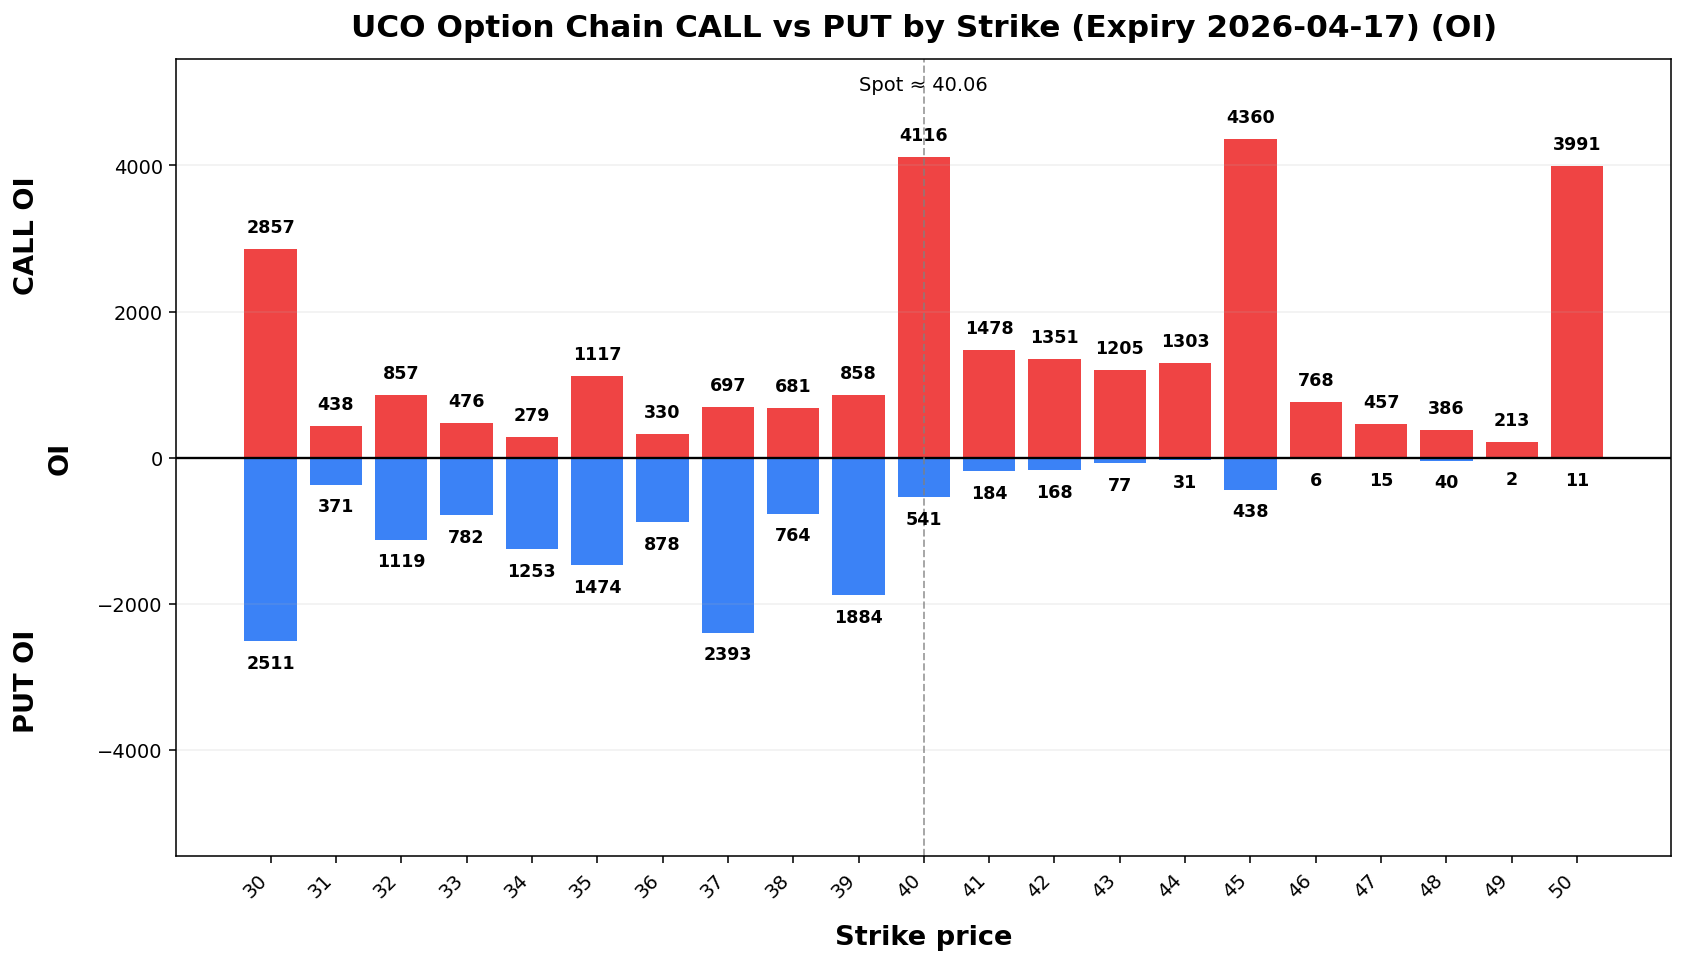
UCO
Spot: 40.06
Report Time: 2026-04-12 08:47 AM MYT
Regime: PIN
Dealer Gamma: LONG
Term Structure
| Expiry |
DTE |
Forward |
ATM IV |
ATM Straddle |
| 2026-04-17 |
6 |
40.04 |
88.15% |
4.45 |
| 2026-05-15 |
34 |
39.93 |
75.49% |
9.20 |
Weekly Range
| Confidence |
Low |
High |
Width |
| 68% |
35.25 |
44.87 |
9.62 |
| 80% |
33.89 |
46.23 |
12.33 |
| 90% |
32.15 |
47.97 |
15.83 |
| 95% |
30.63 |
49.49 |
18.86 |
Structure & Probabilities
| Support |
Resistance |
Gamma Flip |
Max Pain |
P>Res |
P<Sup |
| 40.00 |
45.00 |
34.52 |
33.00 |
13.9% |
37.8% |
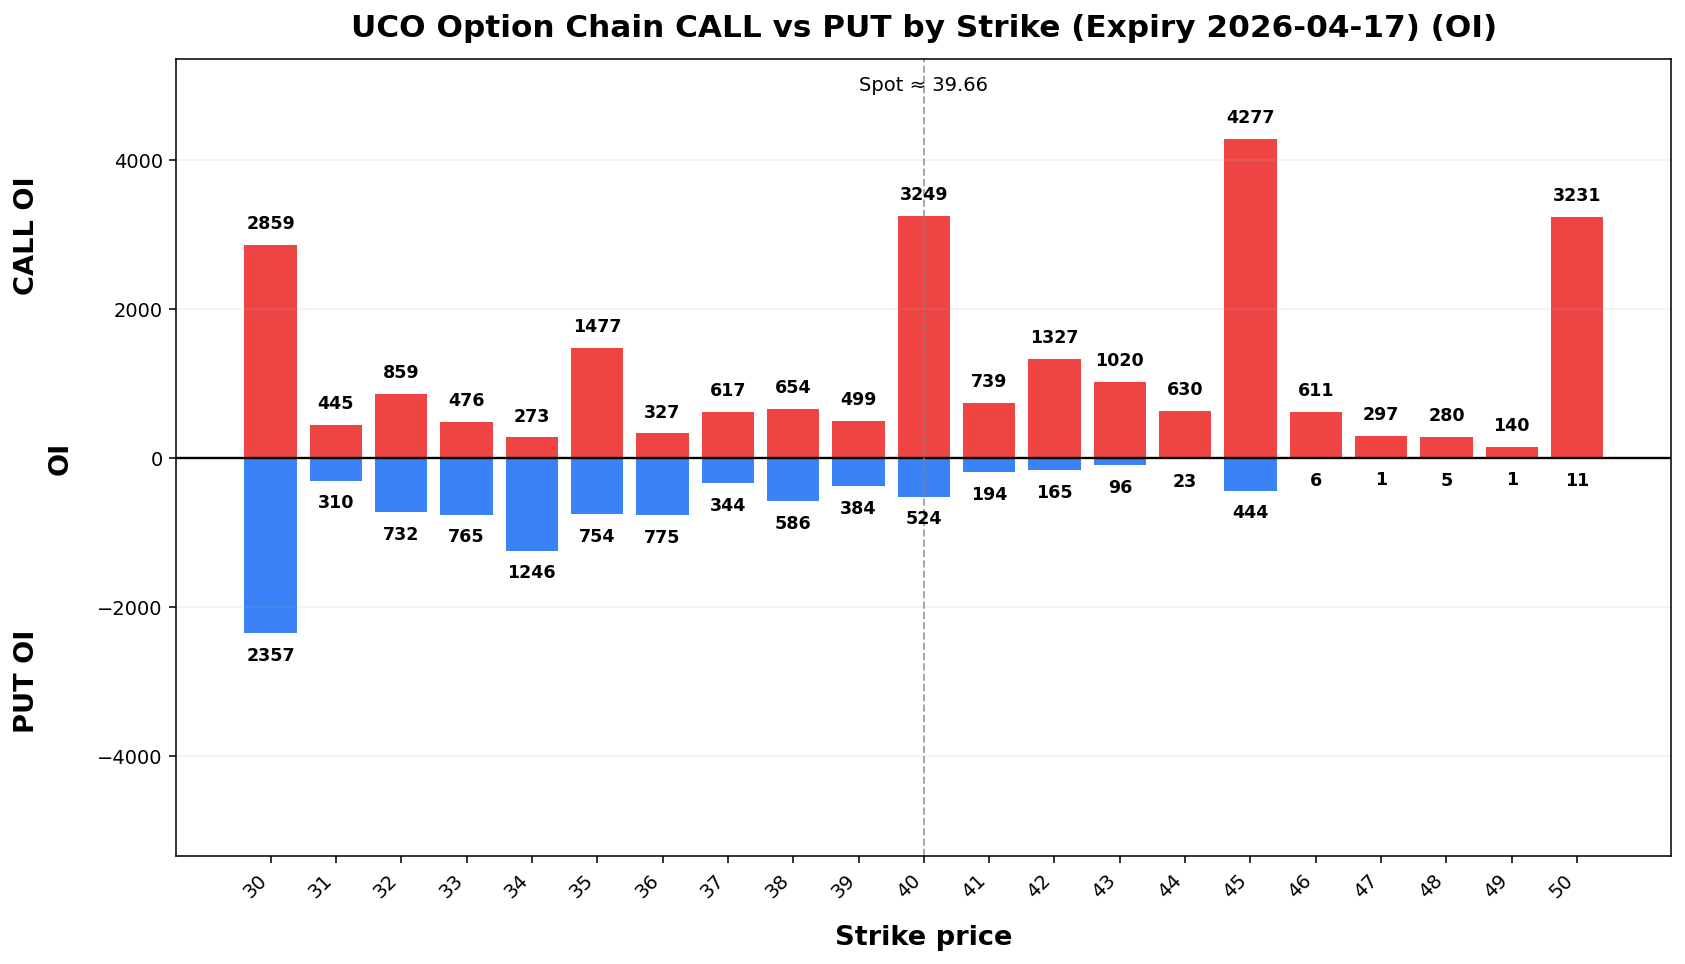
Flow & Skew
| Call Vol |
Put Vol |
Vol P/C |
Call OI |
Put OI |
OI P/C |
Skew |
Skew Bias |
| 2,882 |
1,215 |
0.42 |
39,957 |
26,891 |
0.67 |
-14.36 vol pts |
CALL_SKEW |
Tail Risk
| Q10 |
Q50 |
Q90 |
Down Tail |
Up Tail |
Down/Up |
| 13.53 |
15.86 |
42.88 |
26.53 |
2.82 |
9.41 |
Daily Technicals
| EMA20 |
EMA50 |
VWAP20 |
BB Lower |
BB Mid |
BB Upper |
BB Width |
Vol Ratio |
Path |
| 38.84 |
33.76 |
40.29 |
37.34 |
40.46 |
43.57 |
15.41% |
0.54 |
UP bias |
Day Plan
- 40.00-45.00 range: fade extremes
- > 45.00: chase only if hold + vol
- < 40.00: risk expand; reduce size
- Regime: PIN
- Tech: UP bias
Swing Plan
- Accumulate: 40.00-40.00
- Trim: 45.00-45.00
- Add: close > 45.00
- Cut: close < 40.00
- Best for: pin regime
Raw Text Summary
📌 UCO @ 40.06 (2026-04-12 08:47 AM MYT)

• Current price is **40.06**. Key support is around **40.00**, and resistance is around **45.00**.
• For the next week, the model’s **68% expected range** is roughly **35.25 to 44.87**.
• A wider **90% range** is about **32.15 to 47.97**.
• Dealer positioning looks **LONG gamma**, so the market behavior is classified as **PIN**.
• The estimated **gamma flip** is near **34.52**. Crossing and holding beyond this area can change the trading behavior.
• Approximate breakout odds: **above resistance 13.9%**, **below support 37.8%** by the target horizon.
• Options skew is tilted toward **calls**, which suggests upside speculation is relatively stronger.
• Near-term implied volatility is higher than the next expiry (**IV1 88.15% vs IV2 75.49%**), which suggests **near-term event stress / backwardation**.
• Recent volume is only **0.80x*54x** the 20-day average, so breakouts may be less reliable unless volume improves.
• On the daily chart, the stock currently looks like **UP bias**.
• The implied distribution shows **heavier downside tail risk** than upside tail potential.
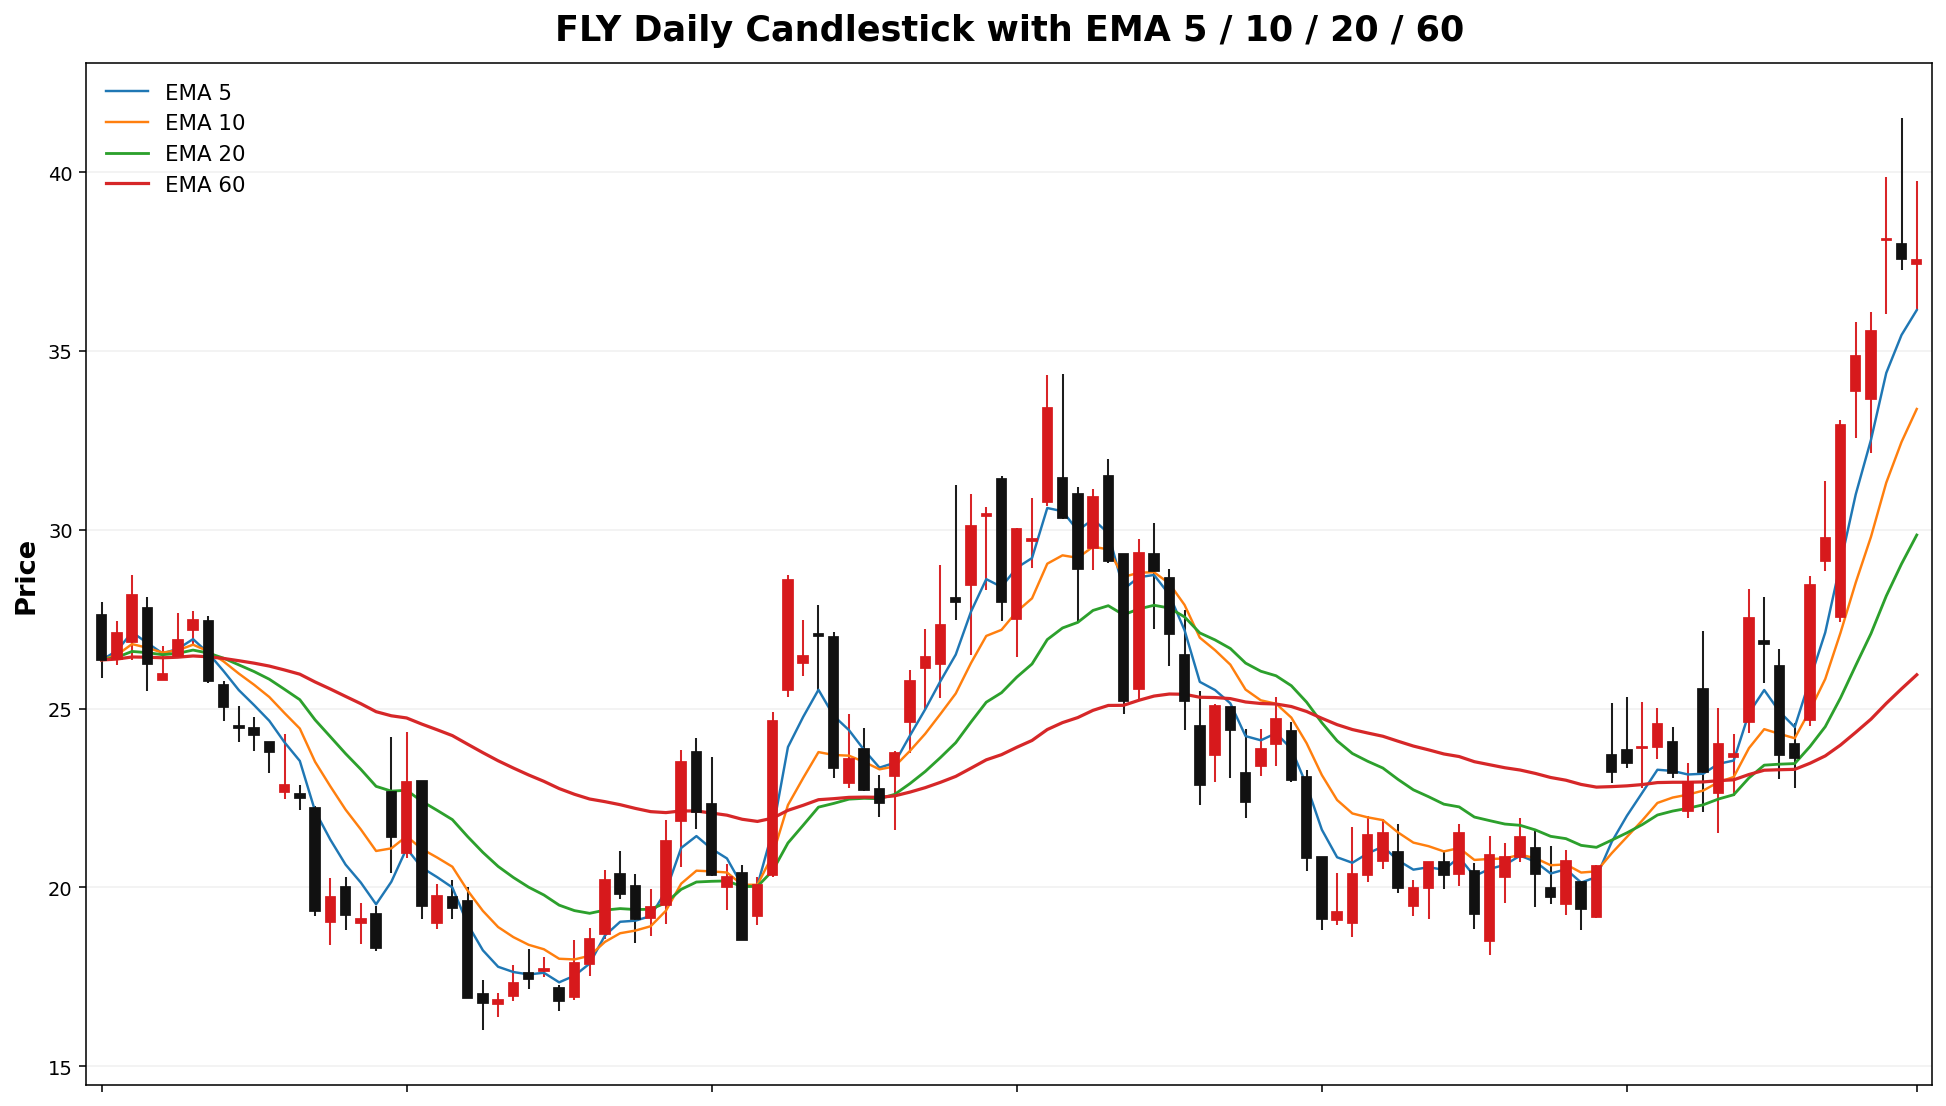
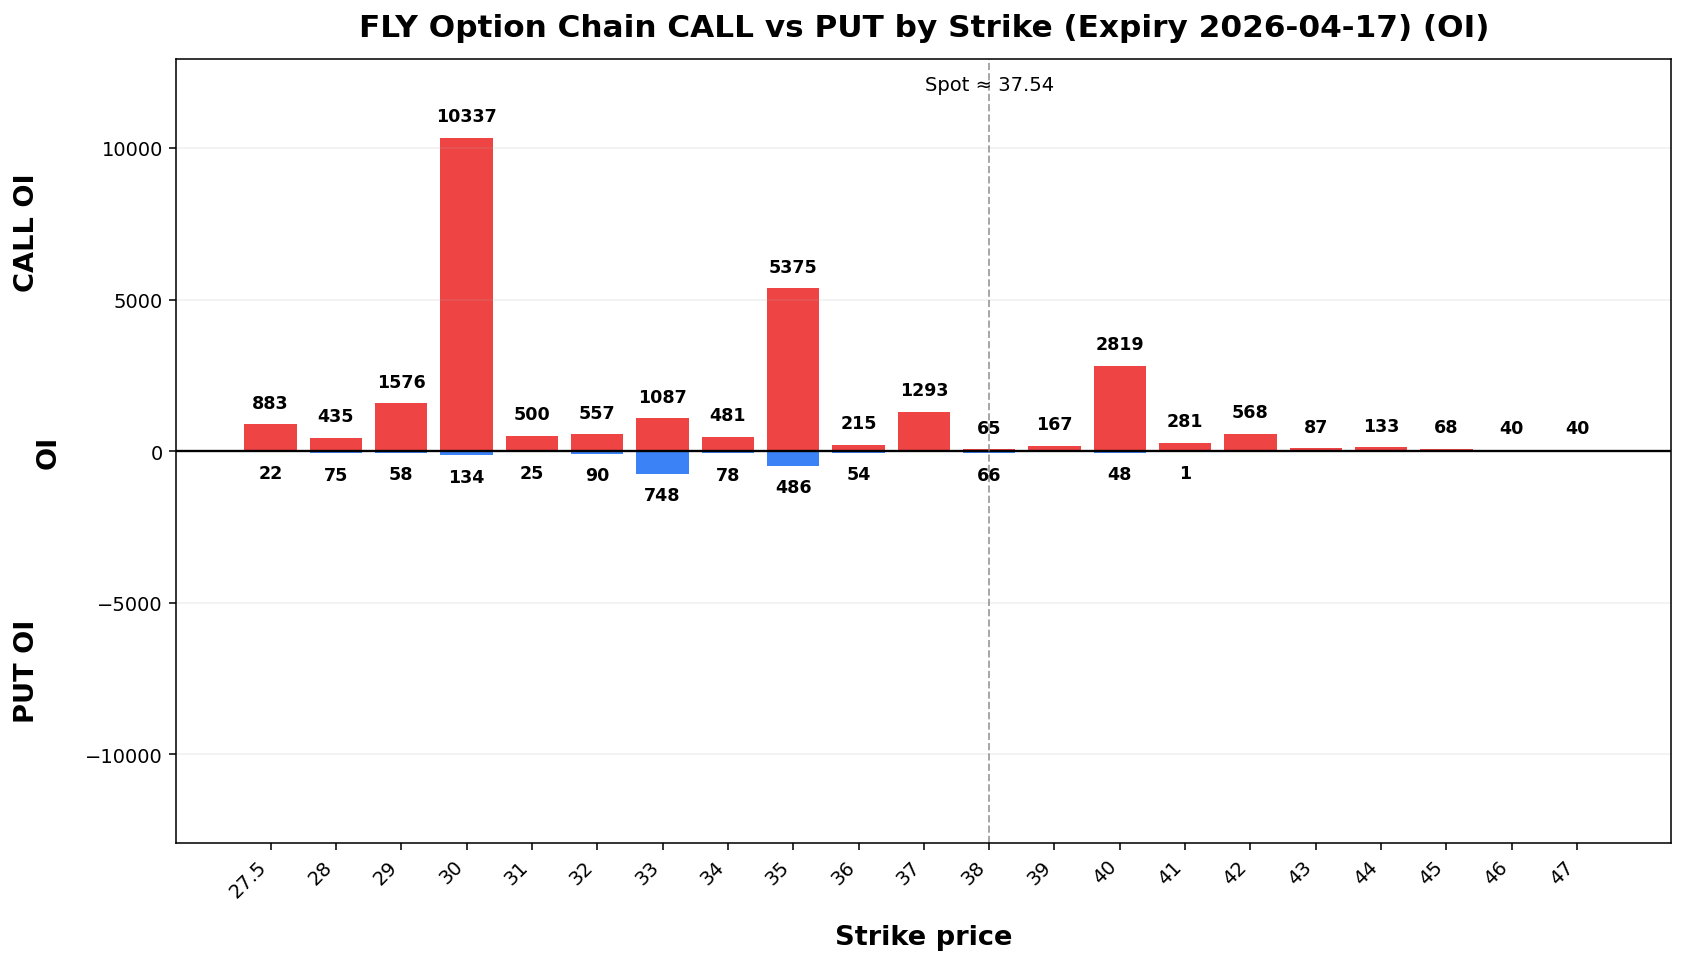
FLY
Spot: 37.54
Report Time: 2026-04-12 08:47 AM MYT
Regime: TREND
Dealer Gamma: SHORT
Term Structure
| Expiry |
DTE |
Forward |
ATM IV |
ATM Straddle |
| 2026-04-17 |
6 |
37.64 |
89.31% |
4.22 |
| 2026-04-24 |
13 |
37.68 |
86.80% |
6.10 |
Weekly Range
| Confidence |
Low |
High |
Width |
| 68% |
32.87 |
42.21 |
9.35 |
| 80% |
31.55 |
43.53 |
11.98 |
| 90% |
29.85 |
45.23 |
15.38 |
| 95% |
28.38 |
46.70 |
18.32 |
Structure & Probabilities
| Support |
Resistance |
Gamma Flip |
Max Pain |
P>Res |
P<Sup |
| 37.00 |
40.00 |
NA |
25.00 |
36.1% |
54.8% |
Flow & Skew
| Call Vol |
Put Vol |
Vol P/C |
Call OI |
Put OI |
OI P/C |
Skew |
Skew Bias |
| 2,625 |
1,083 |
0.41 |
32,631 |
8,435 |
0.26 |
0.88 vol pts |
FLAT |
Tail Risk
| Q10 |
Q50 |
Q90 |
Down Tail |
Up Tail |
Down/Up |
| 22.22 |
36.82 |
43.41 |
15.32 |
5.87 |
2.61 |
Daily Technicals
| EMA20 |
EMA50 |
VWAP20 |
BB Lower |
BB Mid |
BB Upper |
BB Width |
Vol Ratio |
Path |
| 29.85 |
26.48 |
29.25 |
16.96 |
28.28 |
39.60 |
80.08% |
0.89 |
UP trend (expanding) |
Day Plan
- 37.00-40.00 range: fade extremes
- > 40.00: chase only if hold + vol
- < 37.00: risk expand; reduce size
- Regime: TREND
- Tech: UP trend (expanding)
Swing Plan
- Accumulate: 37.00-37.00
- Trim: 40.00-40.00
- Add: close > 40.00
- Cut: close < 37.00
- Best for: trend regime
Raw Text Summary
📌 FLY @ 37.54 (2026-04-12 08:47 AM MYT)

• Current price is **37.54**. Key support is around **37.00**, and resistance is around **40.00**.
• For the next week, the model’s **68% expected range** is roughly **32.87 to 42.21**.
• A wider **90% range** is about **29.85 to 45.23**.
• Dealer positioning looks **SHORT gamma**, so the market behavior is classified as **TREND**.
• Approximate breakout odds: **above resistance 36.1%**, **below support 54.8%** by the target horizon.
• Options skew is fairly balanced, so there is **no strong directional bias** from skew alone.
• Near-term implied volatility is higher than the next expiry (**IV1 89.31% vs IV2 86.80%**), which suggests **near-term event stress / backwardation**.
• On the daily chart, the stock currently looks like **UP trend (expanding)**.
• The implied distribution shows **heavier downside tail risk** than upside tail potential.
HUT
Spot: 66.08
Report Time: 2026-04-12 08:47 AM MYT
Regime: TRANSITION
Dealer Gamma: LONG
Term Structure
| Expiry |
DTE |
Forward |
ATM IV |
ATM Straddle |
| 2026-04-17 |
6 |
65.48 |
84.84% |
7.06 |
| 2026-04-24 |
13 |
66.42 |
82.93% |
10.26 |
Weekly Range
| Confidence |
Low |
High |
Width |
| 68% |
58.25 |
73.92 |
15.67 |
| 80% |
56.05 |
76.12 |
20.08 |
| 90% |
53.20 |
78.97 |
25.77 |
| 95% |
50.73 |
81.44 |
30.70 |
Structure & Probabilities
| Support |
Resistance |
Gamma Flip |
Max Pain |
P>Res |
P<Sup |
| 65.00 |
70.00 |
57.78 |
55.00 |
25.3% |
43.7% |
Flow & Skew
| Call Vol |
Put Vol |
Vol P/C |
Call OI |
Put OI |
OI P/C |
Skew |
Skew Bias |
| 3,116 |
5,027 |
1.61 |
26,779 |
31,154 |
1.16 |
5.91 vol pts |
PUT_SKEW |
Tail Risk
| Q10 |
Q50 |
Q90 |
Down Tail |
Up Tail |
Down/Up |
| 15.28 |
16.42 |
69.29 |
50.80 |
3.21 |
15.83 |
Daily Technicals
| EMA20 |
EMA50 |
VWAP20 |
BB Lower |
BB Mid |
BB Upper |
BB Width |
Vol Ratio |
Path |
| 53.51 |
52.32 |
53.36 |
40.06 |
51.82 |
63.57 |
45.36% |
1.24 |
UP trend (expanding) |
Day Plan
- 65.00-70.00 range: fade extremes
- > 70.00: chase only if hold + vol
- < 65.00: risk expand; reduce size
- Regime: TRANSITION
- Tech: UP trend (expanding)
Swing Plan
- Accumulate: 65.00-65.00
- Trim: 70.00-70.00
- Add: close > 70.00
- Cut: close < 65.00
- Best for: transition regime
Raw Text Summary
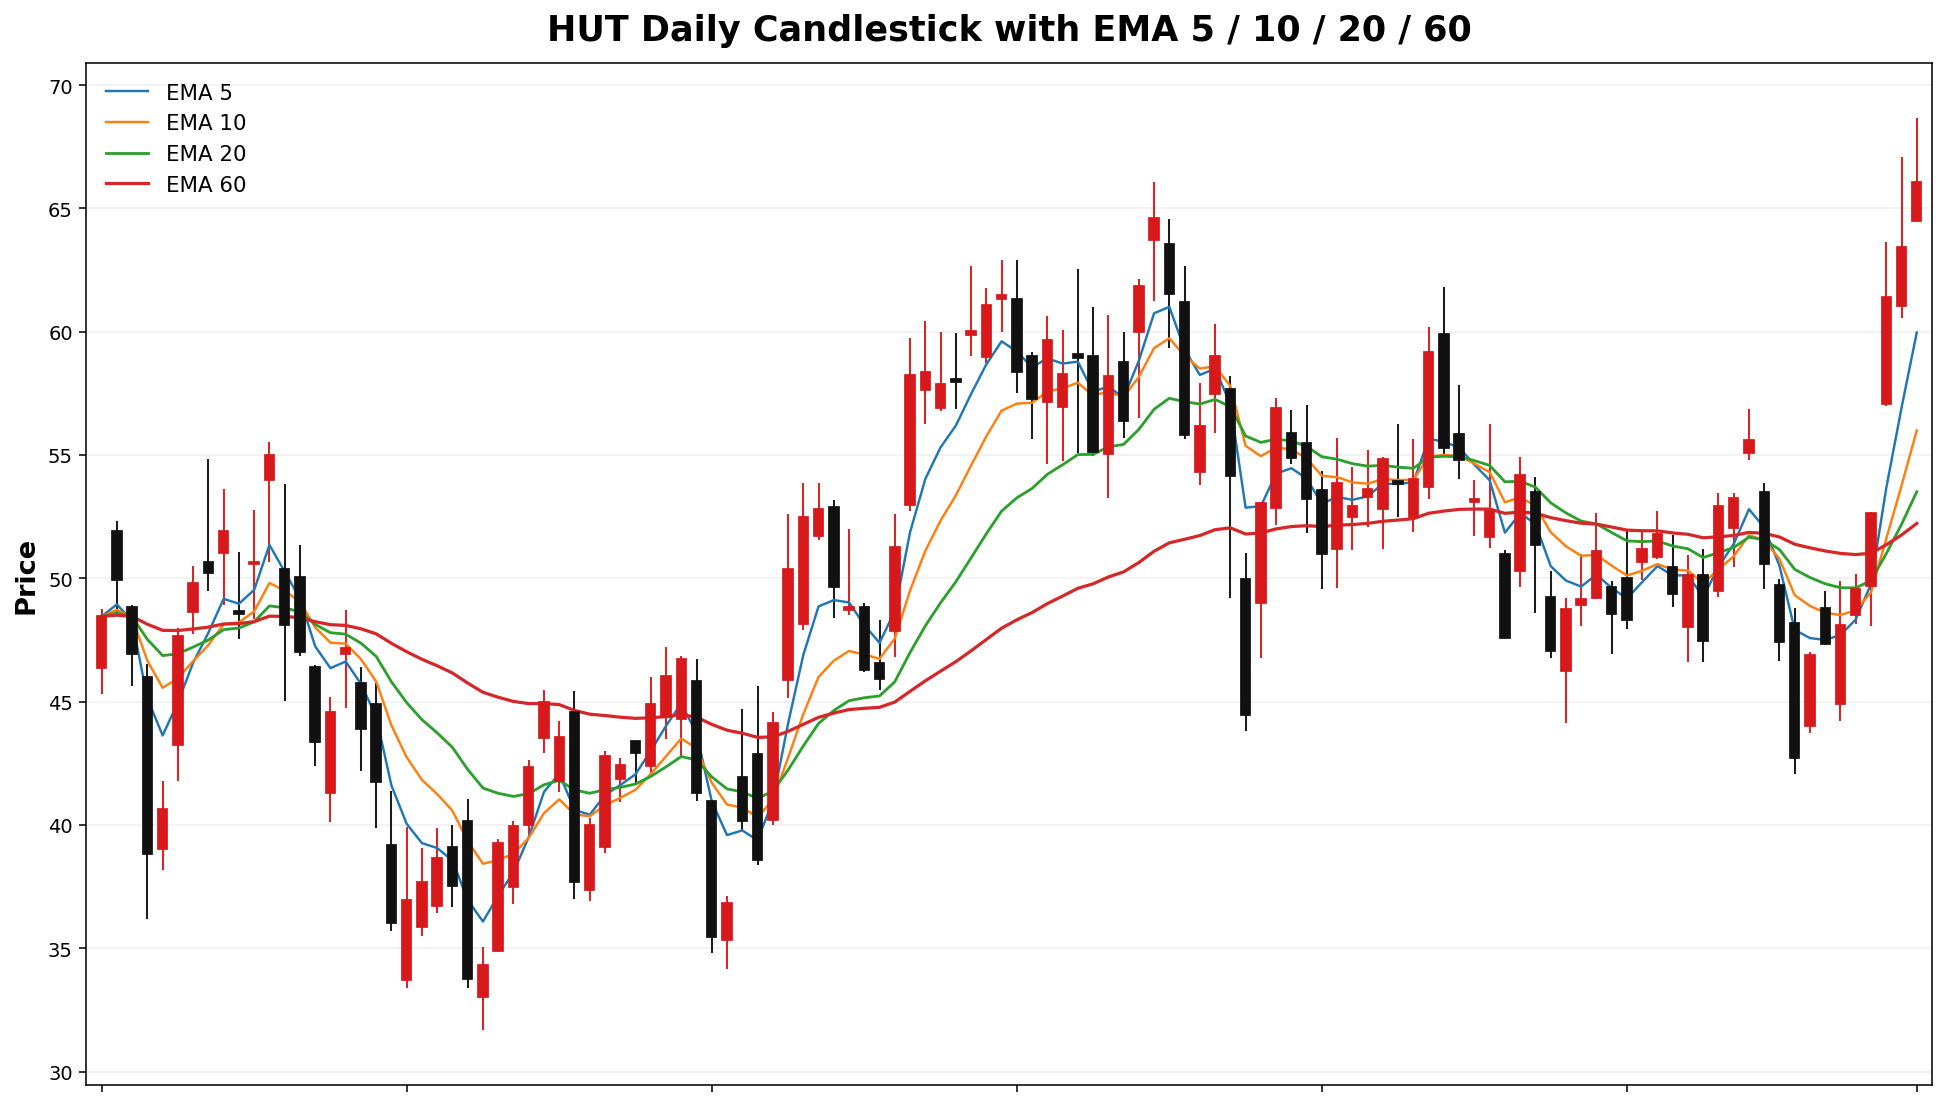
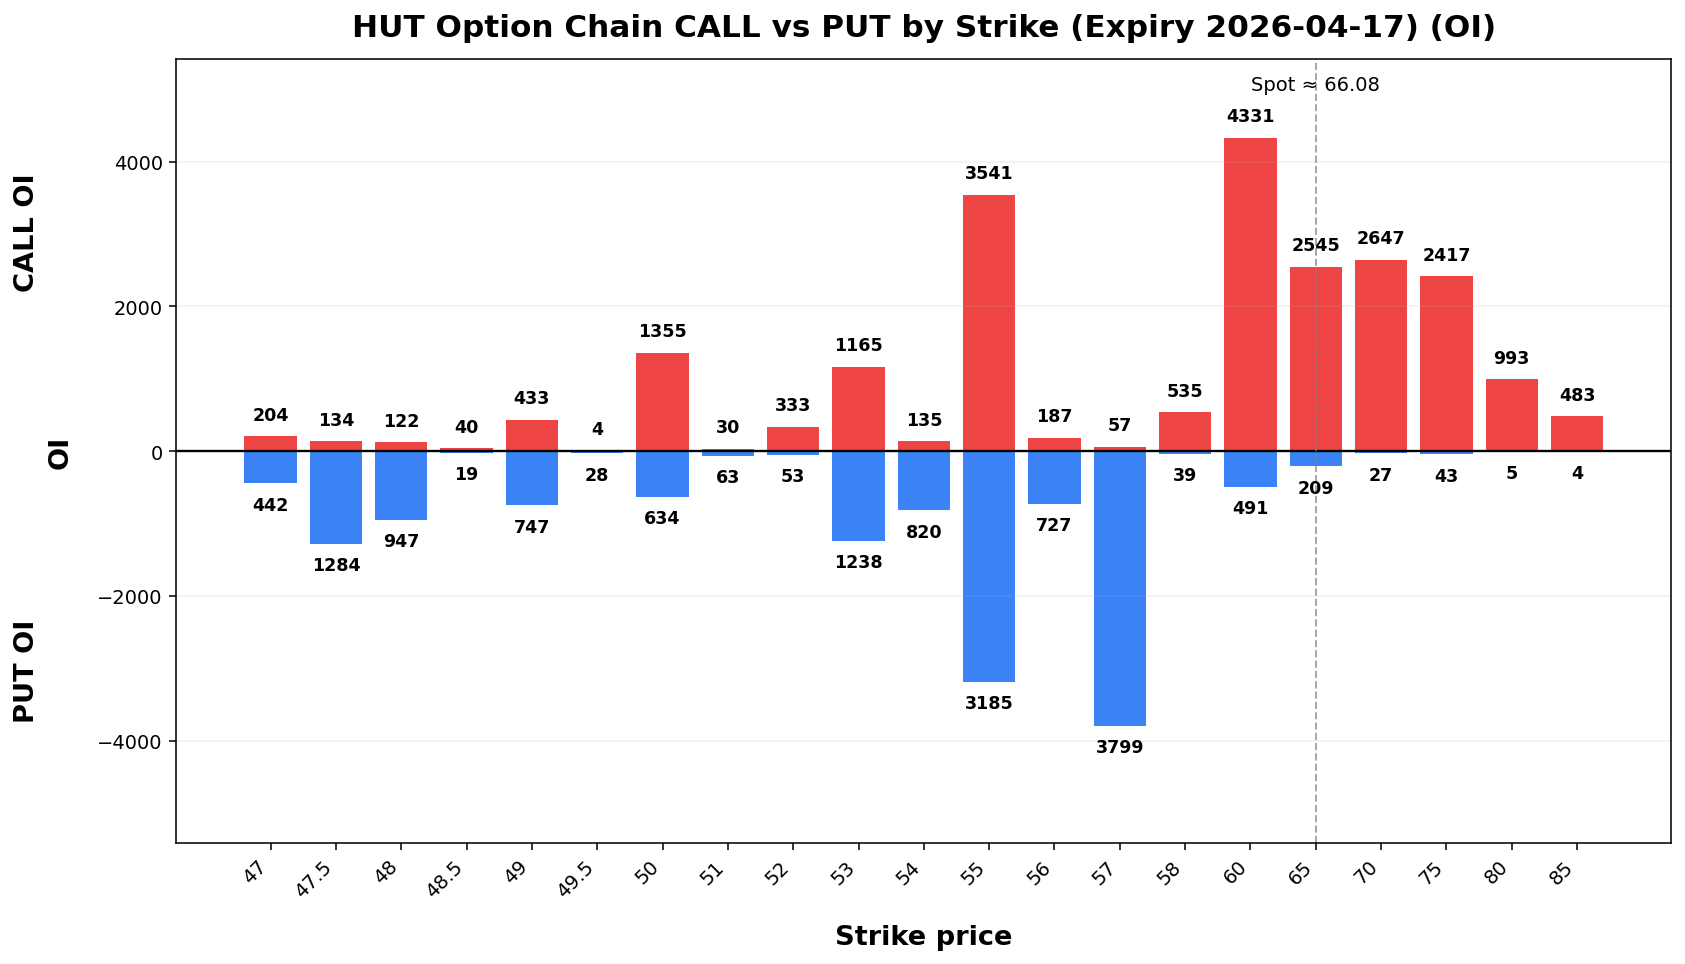
📌 HUT @ 66.08 (2026-04-12 08:47 AM MYT)

• Current price is **66.08**. Key support is around **65.00**, and resistance is around **70.00**.
• For the next week, the model’s **68% expected range** is roughly **58.25 to 73.92**.
• A wider **90% range** is about **53.20 to 78.97**.
• Dealer positioning looks **LONG gamma**, so the market behavior is classified as **TRANSITION**.
• The estimated **gamma flip** is near **57.78**. Crossing and holding beyond this area can change the trading behavior.
• Approximate breakout odds: **above resistance 25.3%**, **below support 43.7%** by the target horizon.
• Options skew is tilted toward **puts**, which suggests traders are paying more for downside protection.
• Near-term implied volatility is higher than the next expiry (**IV1 84.84% vs IV2 82.93%**), which suggests **near-term event stress / backwardation**.
• On the daily chart, the stock currently looks like **UP trend (expanding)**.
• The implied distribution shows **heavier downside tail risk** than upside tail potential.
Spot: 123.80
Report Time: 2026-04-12 08:48 AM MYT
Regime: TRANSITION
Dealer Gamma: LONG
Term Structure
| Expiry |
DTE |
Forward |
ATM IV |
ATM Straddle |
| 2026-04-17 |
6 |
120.14 |
62.82% |
9.80 |
| 2026-05-15 |
34 |
123.90 |
72.09% |
27.15 |
Weekly Range
| Confidence |
Low |
High |
Width |
| 68% |
112.43 |
135.17 |
22.73 |
| 80% |
109.23 |
138.37 |
29.13 |
| 90% |
105.11 |
142.49 |
37.39 |
| 95% |
101.52 |
146.08 |
44.55 |
Structure & Probabilities
| Support |
Resistance |
Gamma Flip |
Max Pain |
P>Res |
P<Sup |
| 120.00 |
135.17 |
98.45 |
80.00 |
11.9% |
33.1% |
Flow & Skew
| Call Vol |
Put Vol |
Vol P/C |
Call OI |
Put OI |
OI P/C |
Skew |
Skew Bias |
| 9,119 |
133 |
0.01 |
1,589 |
2,916 |
1.84 |
13.82 vol pts |
PUT_SKEW |
Tail Risk
| Q10 |
Q50 |
Q90 |
Down Tail |
Up Tail |
Down/Up |
| 122.25 |
129.35 |
139.19 |
1.55 |
15.39 |
0.10 |
Daily Technicals
| EMA20 |
EMA50 |
VWAP20 |
BB Lower |
BB Mid |
BB Upper |
BB Width |
Vol Ratio |
Path |
| 104.13 |
94.14 |
102.25 |
81.91 |
101.61 |
121.32 |
38.79% |
1.25 |
UP trend (expanding) |
Day Plan
- 120.00-135.17 range: fade extremes
- > 135.17: chase only if hold + vol
- < 120.00: risk expand; reduce size
- Regime: TRANSITION
- Tech: UP trend (expanding)
Swing Plan
- Accumulate: 120.00-120.00
- Trim: 135.17-135.17
- Add: close > 135.17
- Cut: close < 120.00
- Best for: transition regime
Raw Text Summary
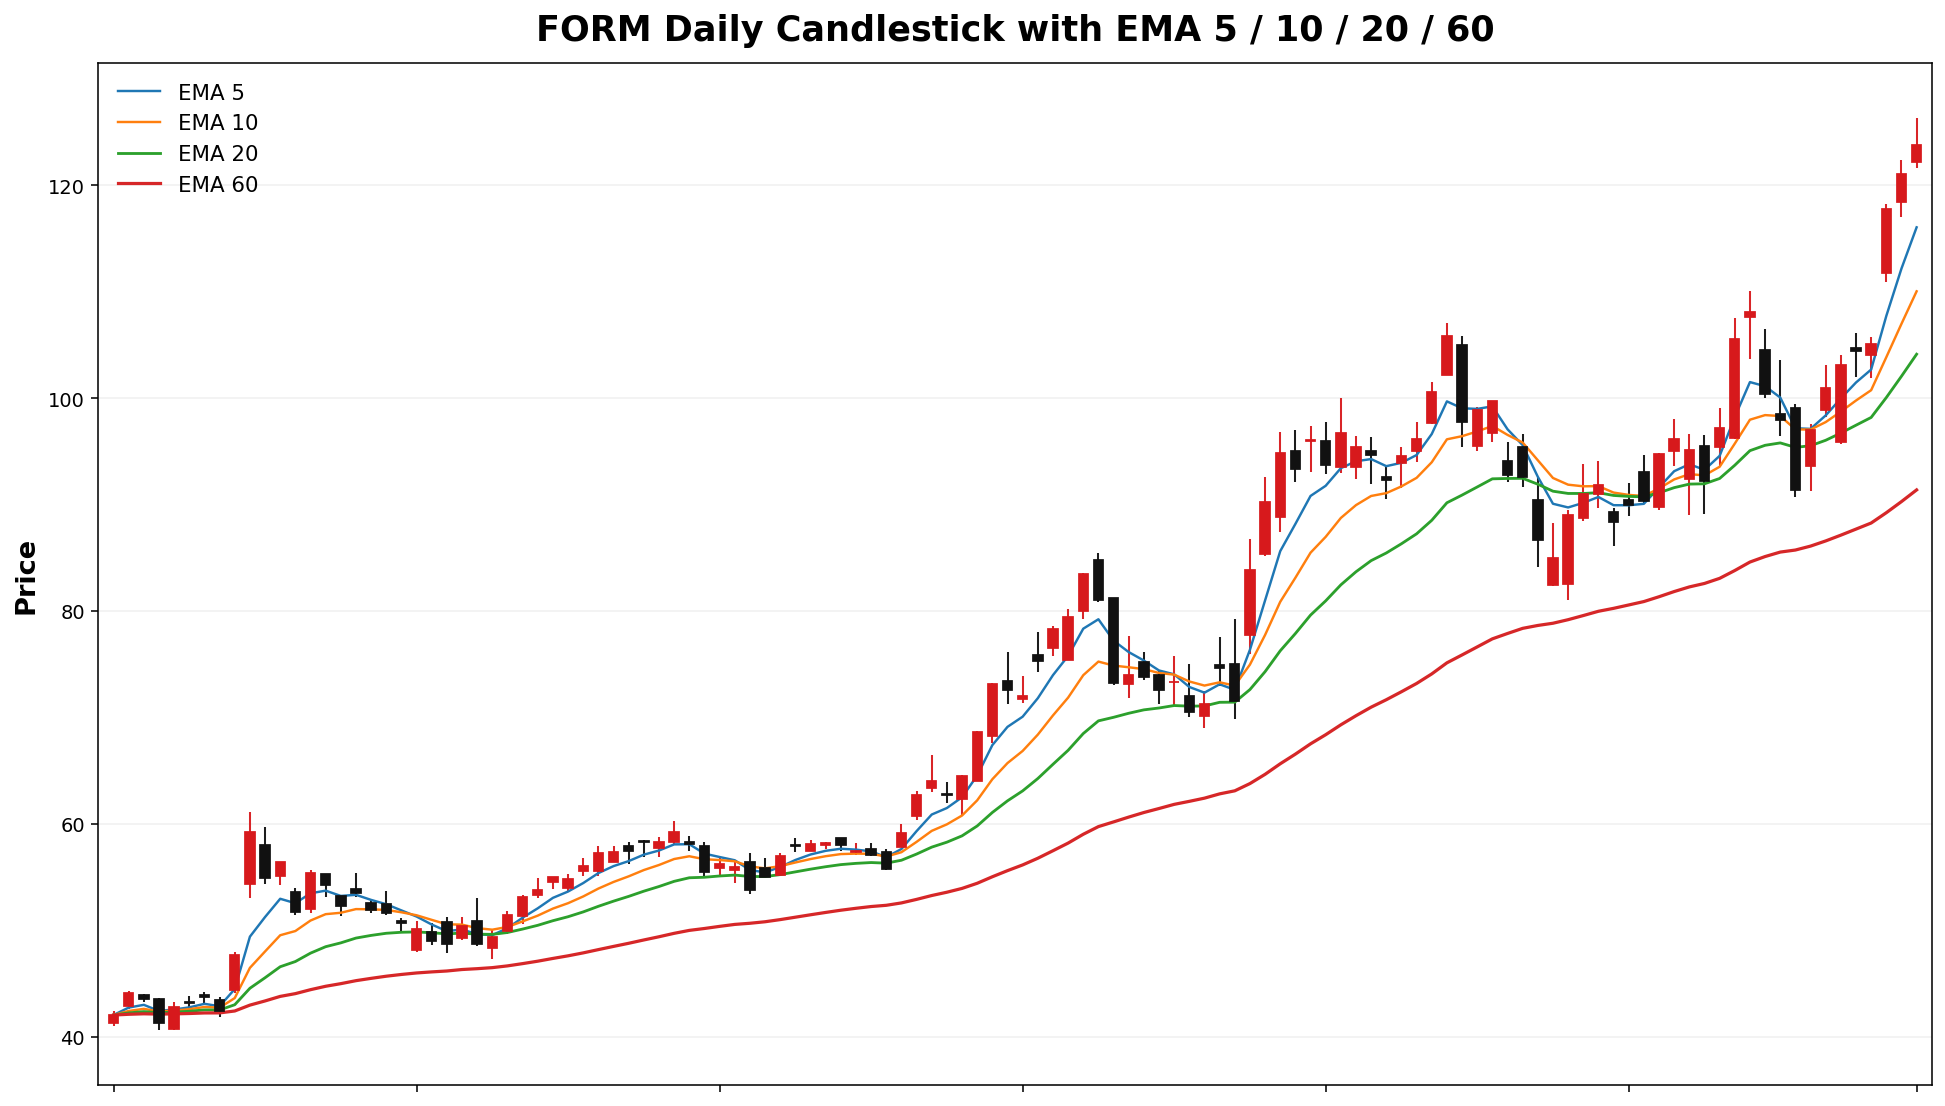
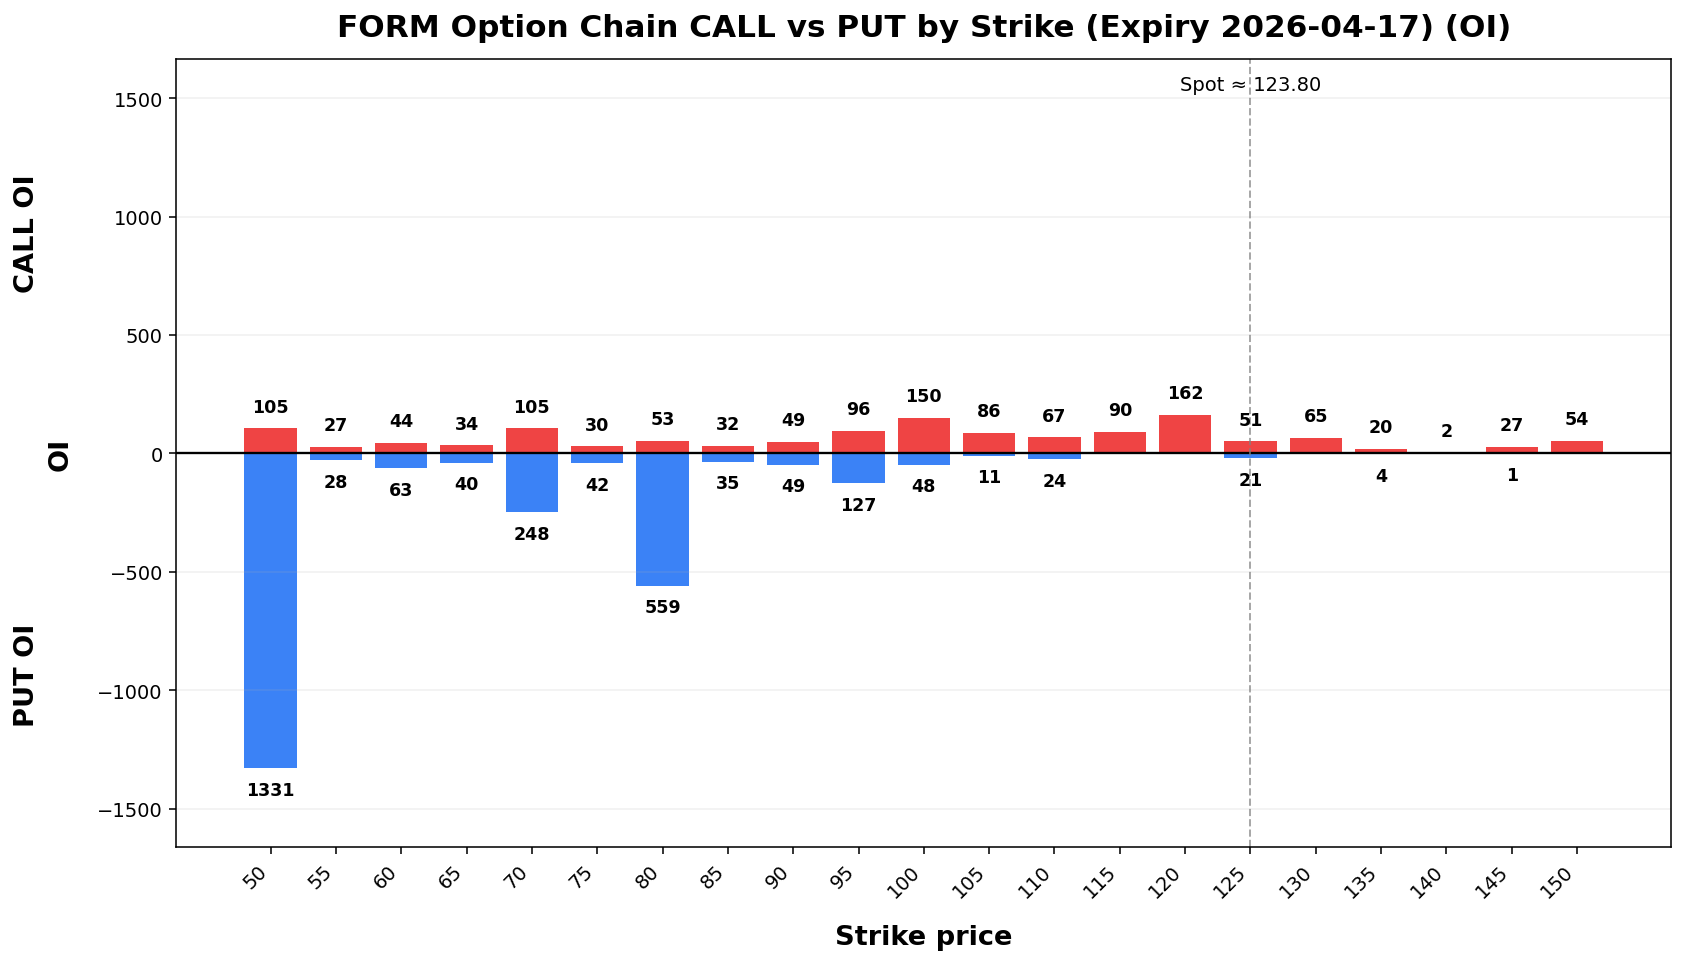
📌 FORM @ 123.80 (2026-04-12 08:48 AM MYT)

• Current price is **123.80**. Key support is around **120.00**, and resistance is around **135.17**.
• For the next week, the model’s **68% expected range** is roughly **112.43 to 135.17**.
• A wider **90% range** is about **105.11 to 142.49**.
• Dealer positioning looks **LONG gamma**, so the market behavior is classified as **TRANSITION**.
• The estimated **gamma flip** is near **98.45**. Crossing and holding beyond this area can change the trading behavior.
• Approximate breakout odds: **above resistance 11.9%**, **below support 33.1%** by the target horizon.
• Options skew is tilted toward **puts**, which suggests traders are paying more for downside protection.
• Near-term implied volatility is lower than the next expiry (**IV1 62.82% vs IV2 72.09%**), which suggests a **contango / calmer front expiry** setup.
• On the daily chart, the stock currently looks like **UP trend (expanding)**.
• The implied distribution shows **more upside tail potential** than downside tail risk.
DOCN
Spot: 75.59
Report Time: 2026-04-12 08:48 AM MYT
Regime: TREND
Dealer Gamma: SHORT
Term Structure
| Expiry |
DTE |
Forward |
ATM IV |
ATM Straddle |
| 2026-04-17 |
6 |
75.63 |
87.14% |
8.30 |
| 2026-04-24 |
13 |
75.84 |
77.74% |
11.00 |
Weekly Range
| Confidence |
Low |
High |
Width |
| 68% |
66.66 |
84.52 |
17.85 |
| 80% |
64.15 |
87.03 |
22.88 |
| 90% |
60.91 |
90.27 |
29.36 |
| 95% |
58.10 |
93.08 |
34.99 |
Structure & Probabilities
| Support |
Resistance |
Gamma Flip |
Max Pain |
P>Res |
P<Sup |
| 75.00 |
78.00 |
71.92 |
75.00 |
49.0% |
70.5% |
Flow & Skew
| Call Vol |
Put Vol |
Vol P/C |
Call OI |
Put OI |
OI P/C |
Skew |
Skew Bias |
| 6,120 |
5,035 |
0.82 |
11,112 |
8,170 |
0.74 |
12.84 vol pts |
PUT_SKEW |
Tail Risk
| Q10 |
Q50 |
Q90 |
Down Tail |
Up Tail |
Down/Up |
| 47.11 |
77.21 |
87.42 |
28.48 |
11.83 |
2.41 |
Daily Technicals
| EMA20 |
EMA50 |
VWAP20 |
BB Lower |
BB Mid |
BB Upper |
BB Width |
Vol Ratio |
Path |
| 81.00 |
71.83 |
83.77 |
71.42 |
83.06 |
94.70 |
28.03% |
1.81 |
UP trend (expanding) |
Day Plan
- 75.00-78.00 range: fade extremes
- > 78.00: chase only if hold + vol
- < 75.00: risk expand; reduce size
- Regime: TREND
- Tech: UP trend (expanding)
Swing Plan
- Accumulate: 75.00-75.00
- Trim: 78.00-78.00
- Add: close > 78.00
- Cut: close < 75.00
- Best for: trend regime
- Bias: downside break risk elevated
Raw Text Summary
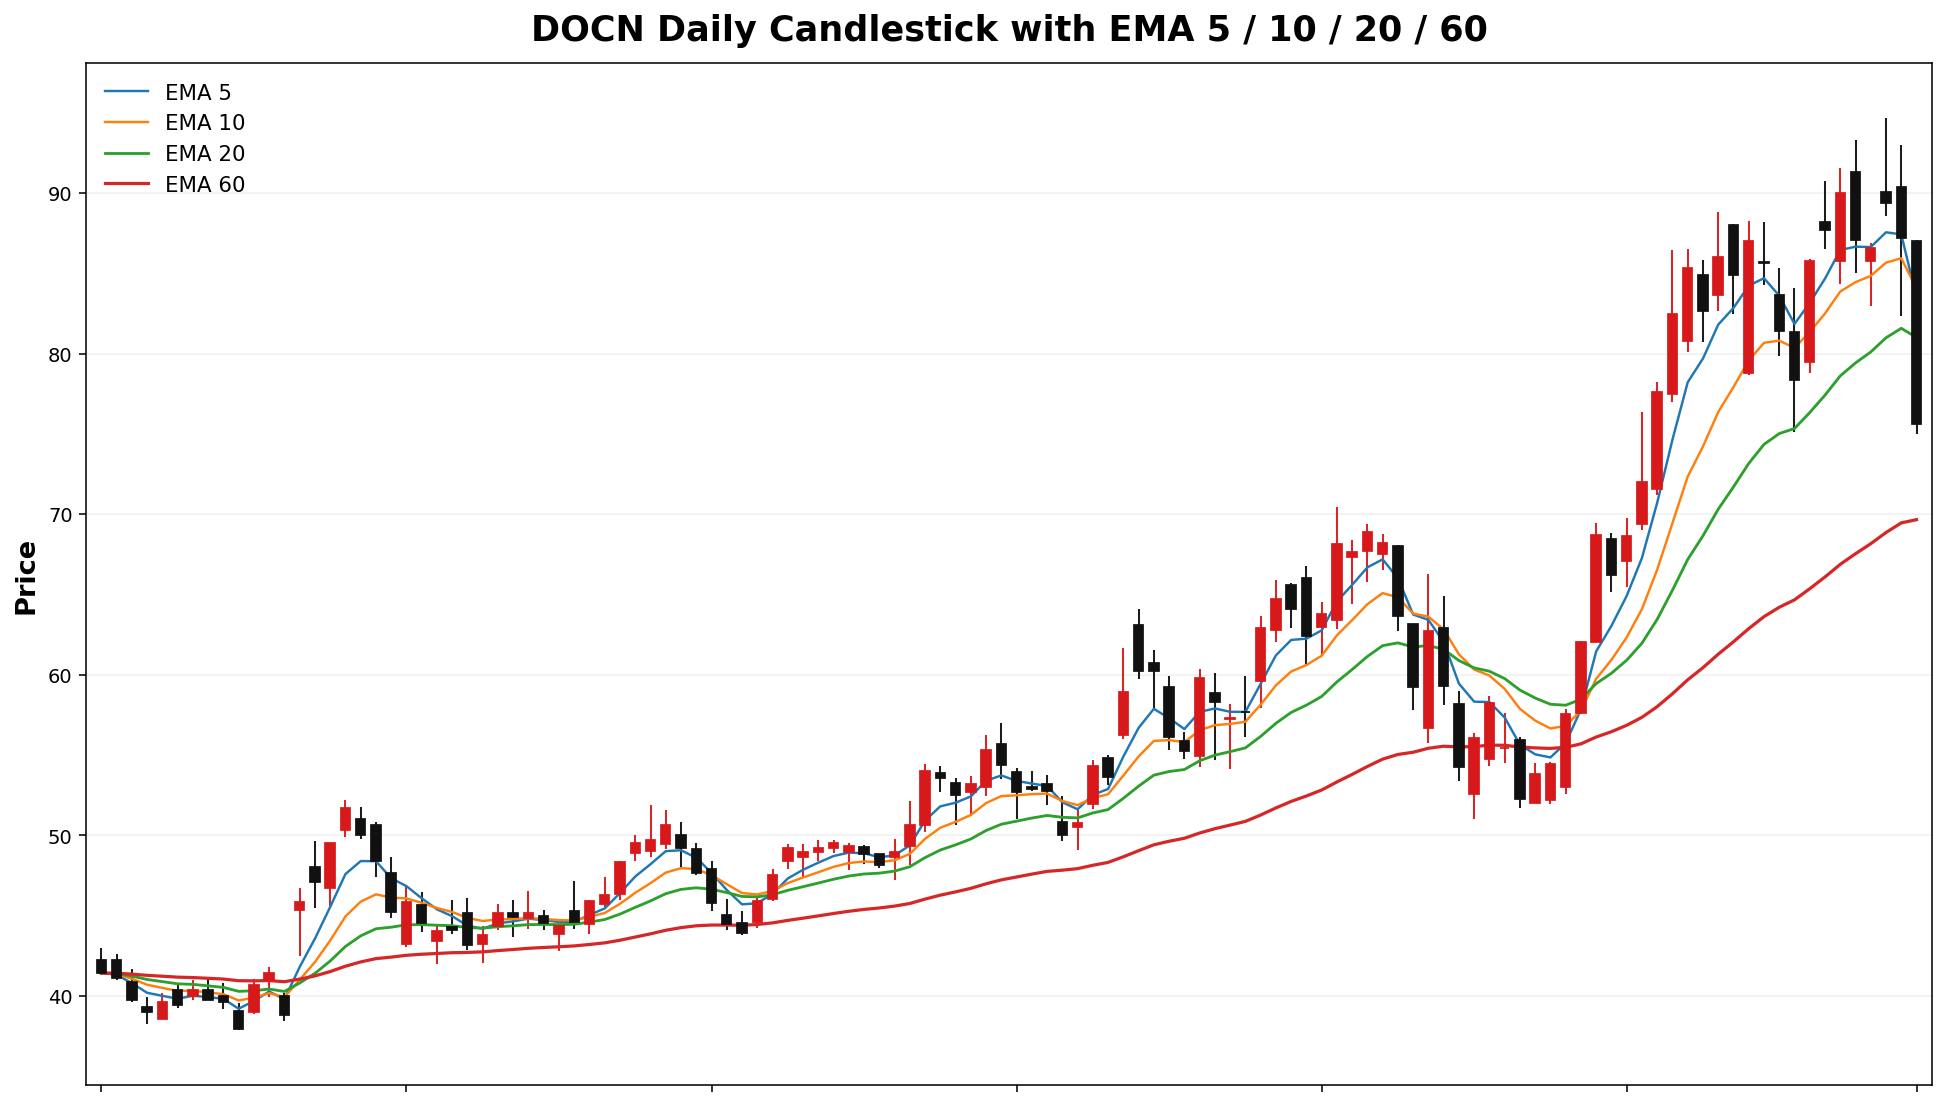
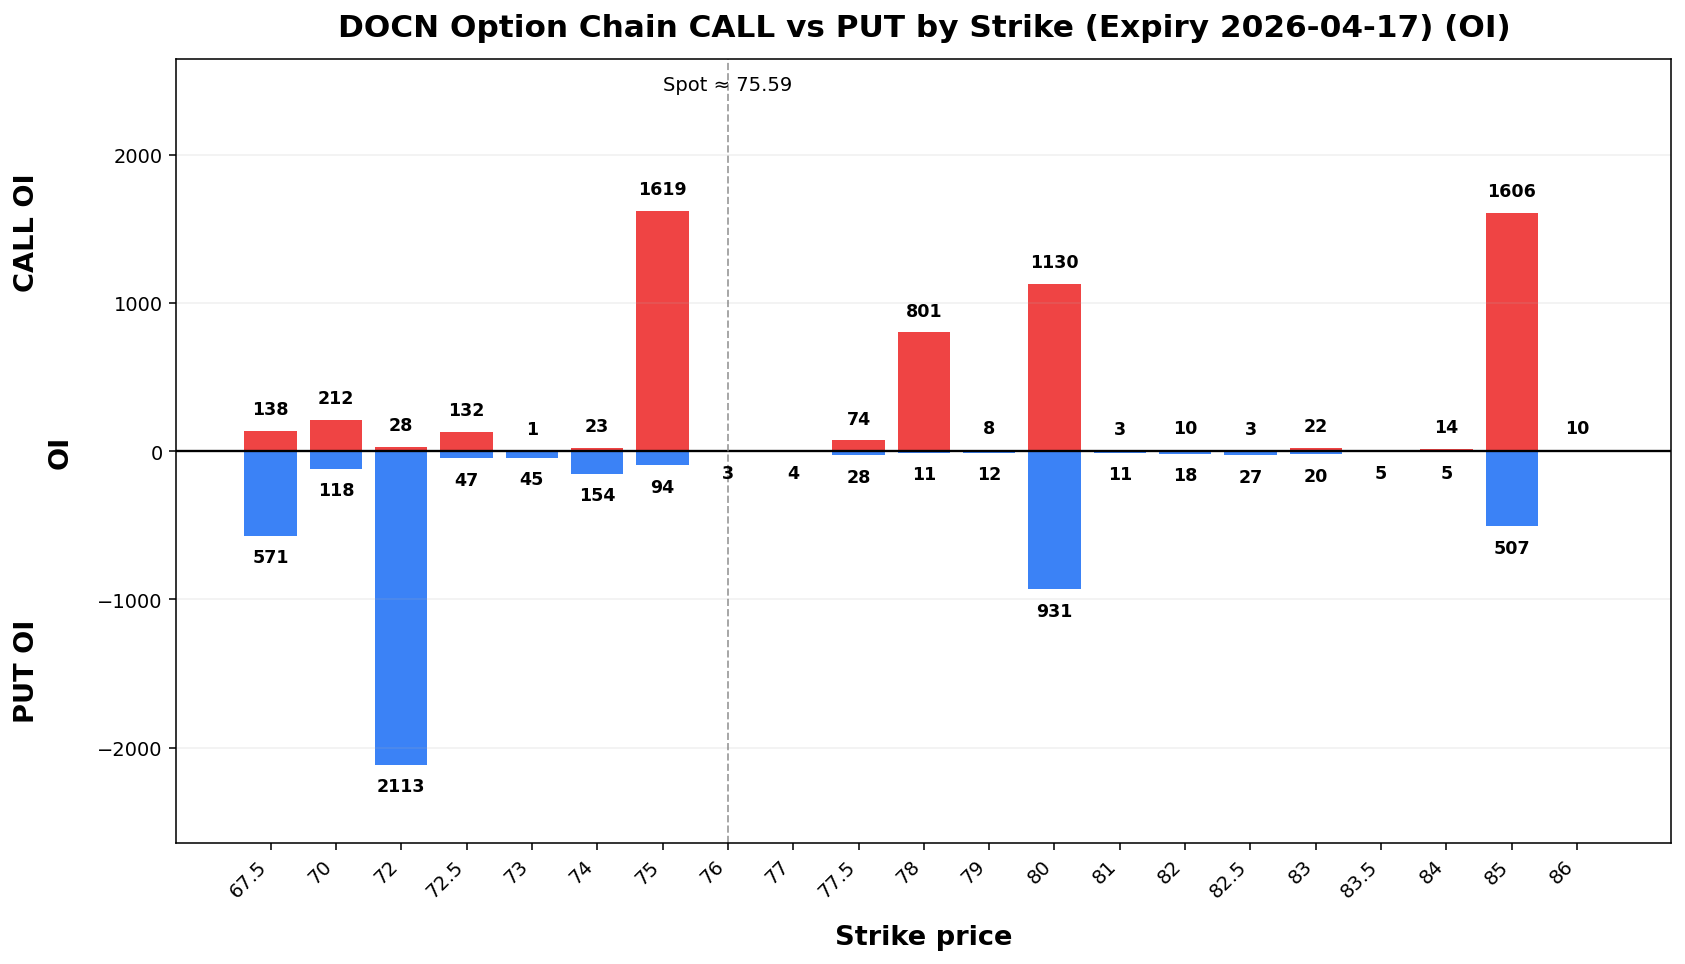
📌 DOCN @ 75.59 (2026-04-12 08:48 AM MYT)

• Current price is **75.59**. Key support is around **75.00**, and resistance is around **78.00**.
• For the next week, the model’s **68% expected range** is roughly **66.66 to 84.52**.
• A wider **90% range** is about **60.91 to 90.27**.
• Dealer positioning looks **SHORT gamma**, so the market behavior is classified as **TREND**.
• The estimated **gamma flip** is near **71.92**. Crossing and holding beyond this area can change the trading behavior.
• Approximate breakout odds: **above resistance 49.0%**, **below support 70.5%** by the target horizon.
• Options skew is tilted toward **puts**, which suggests traders are paying more for downside protection.
• Near-term implied volatility is higher than the next expiry (**IV1 87.14% vs IV2 77.74%**), which suggests **near-term event stress / backwardation**.
• Recent volume is **1.81x** the 20-day average, which supports stronger continuation or breakout follow-through.
• On the daily chart, the stock currently looks like **UP trend (expanding)**.
• The implied distribution shows **heavier downside tail risk** than upside tail potential.
ALAB
Spot: 149.05
Report Time: 2026-04-12 08:48 AM MYT
Regime: TRANSITION
Dealer Gamma: LONG
Term Structure
| Expiry |
DTE |
Forward |
ATM IV |
ATM Straddle |
| 2026-04-17 |
6 |
149.37 |
72.41% |
13.60 |
| 2026-04-24 |
13 |
149.60 |
67.83% |
18.93 |
Weekly Range
| Confidence |
Low |
High |
Width |
| 68% |
134.19 |
163.91 |
29.72 |
| 80% |
130.01 |
168.09 |
38.08 |
| 90% |
124.61 |
173.49 |
48.88 |
| 95% |
119.93 |
178.17 |
58.24 |
Structure & Probabilities
| Support |
Resistance |
Gamma Flip |
Max Pain |
P>Res |
P<Sup |
| 145.00 |
150.00 |
124.49 |
121.00 |
47.4% |
39.2% |
Flow & Skew
| Call Vol |
Put Vol |
Vol P/C |
Call OI |
Put OI |
OI P/C |
Skew |
Skew Bias |
| 19,056 |
5,788 |
0.30 |
25,813 |
19,606 |
0.76 |
0.37 vol pts |
FLAT |
Tail Risk
| Q10 |
Q50 |
Q90 |
Down Tail |
Up Tail |
Down/Up |
| 129.37 |
147.90 |
170.87 |
19.68 |
21.82 |
0.90 |
Daily Technicals
| EMA20 |
EMA50 |
VWAP20 |
BB Lower |
BB Mid |
BB Upper |
BB Width |
Vol Ratio |
Path |
| 122.63 |
130.17 |
121.81 |
100.10 |
120.51 |
140.92 |
33.87% |
2.38 |
Sideways / Range |
Day Plan
- 145.00-150.00 range: fade extremes
- > 150.00: chase only if hold + vol
- < 145.00: risk expand; reduce size
- Regime: TRANSITION
- Tech: Sideways / Range
Swing Plan
- Accumulate: 145.00-145.00
- Trim: 150.00-150.00
- Add: close > 150.00
- Cut: close < 145.00
- Best for: transition regime
Raw Text Summary
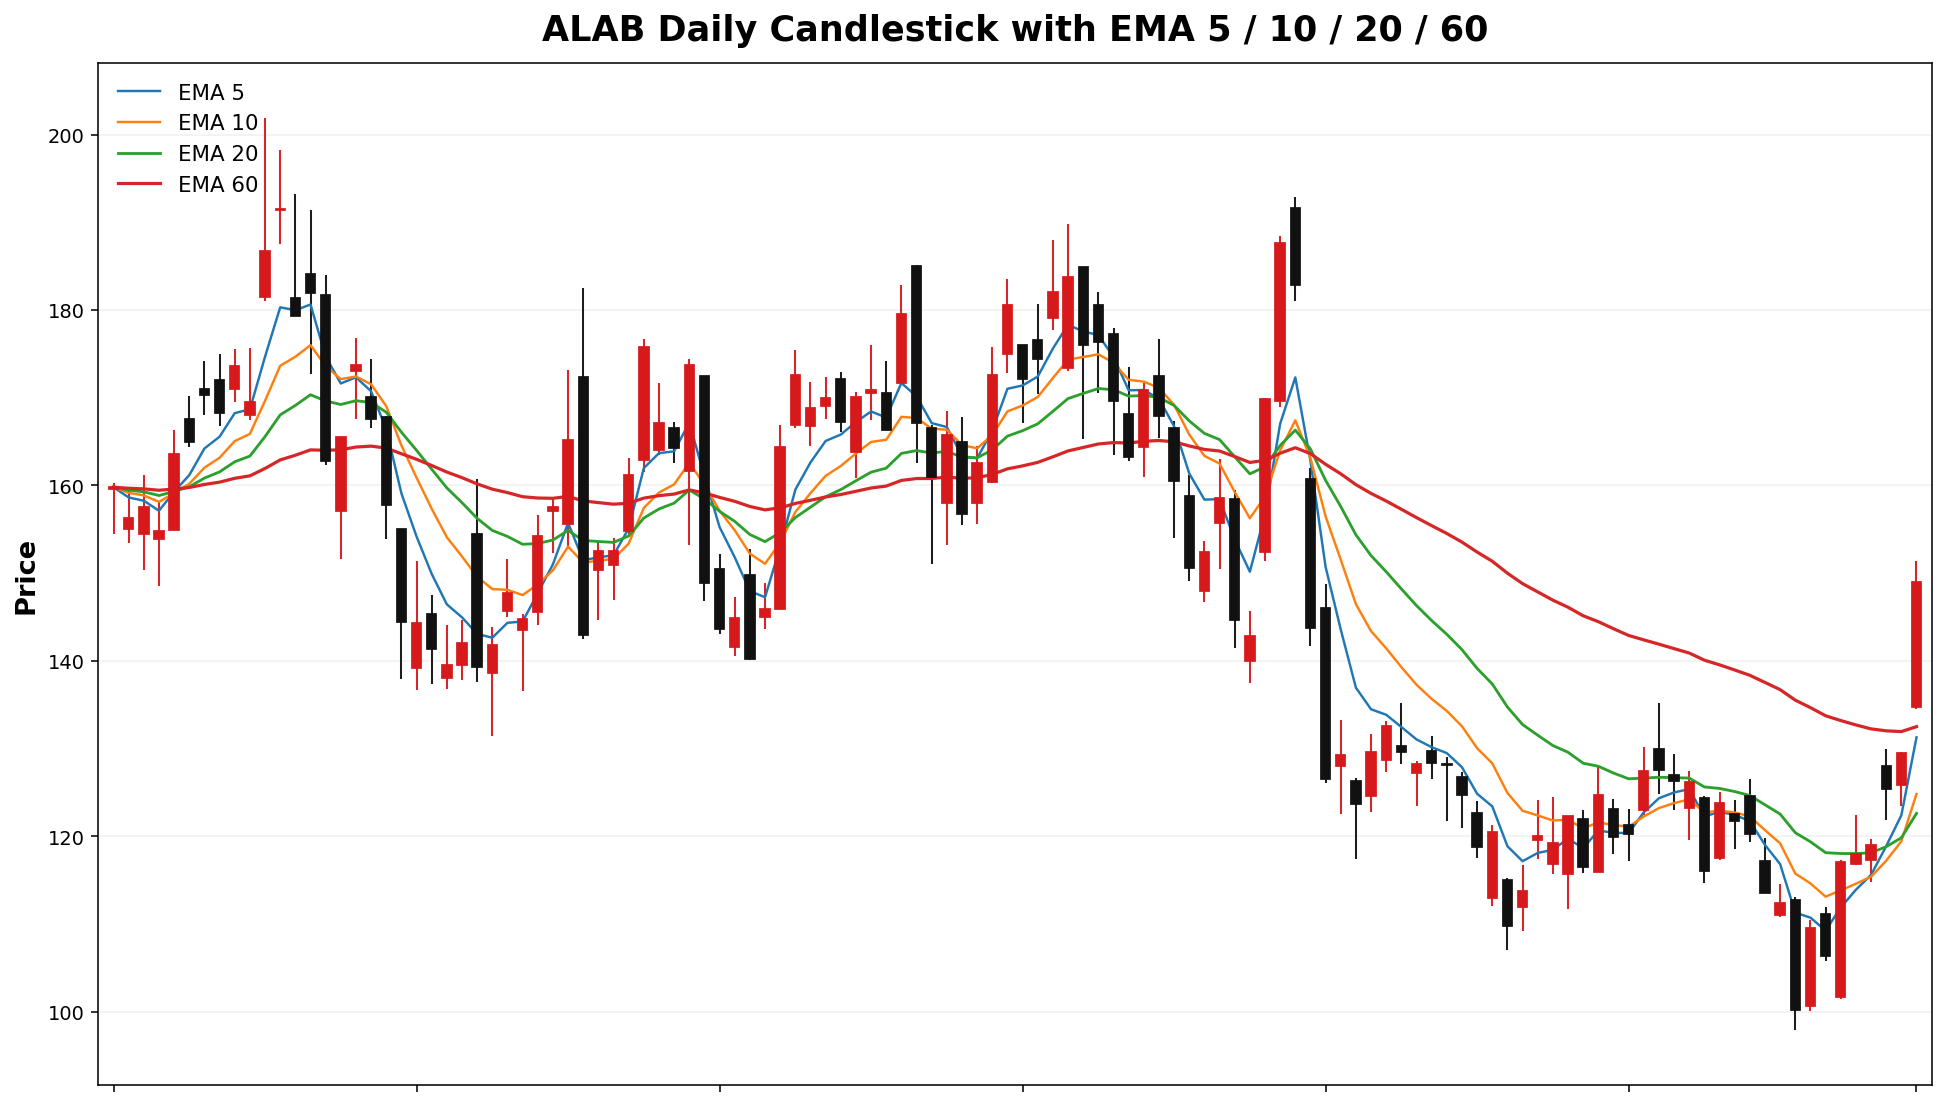
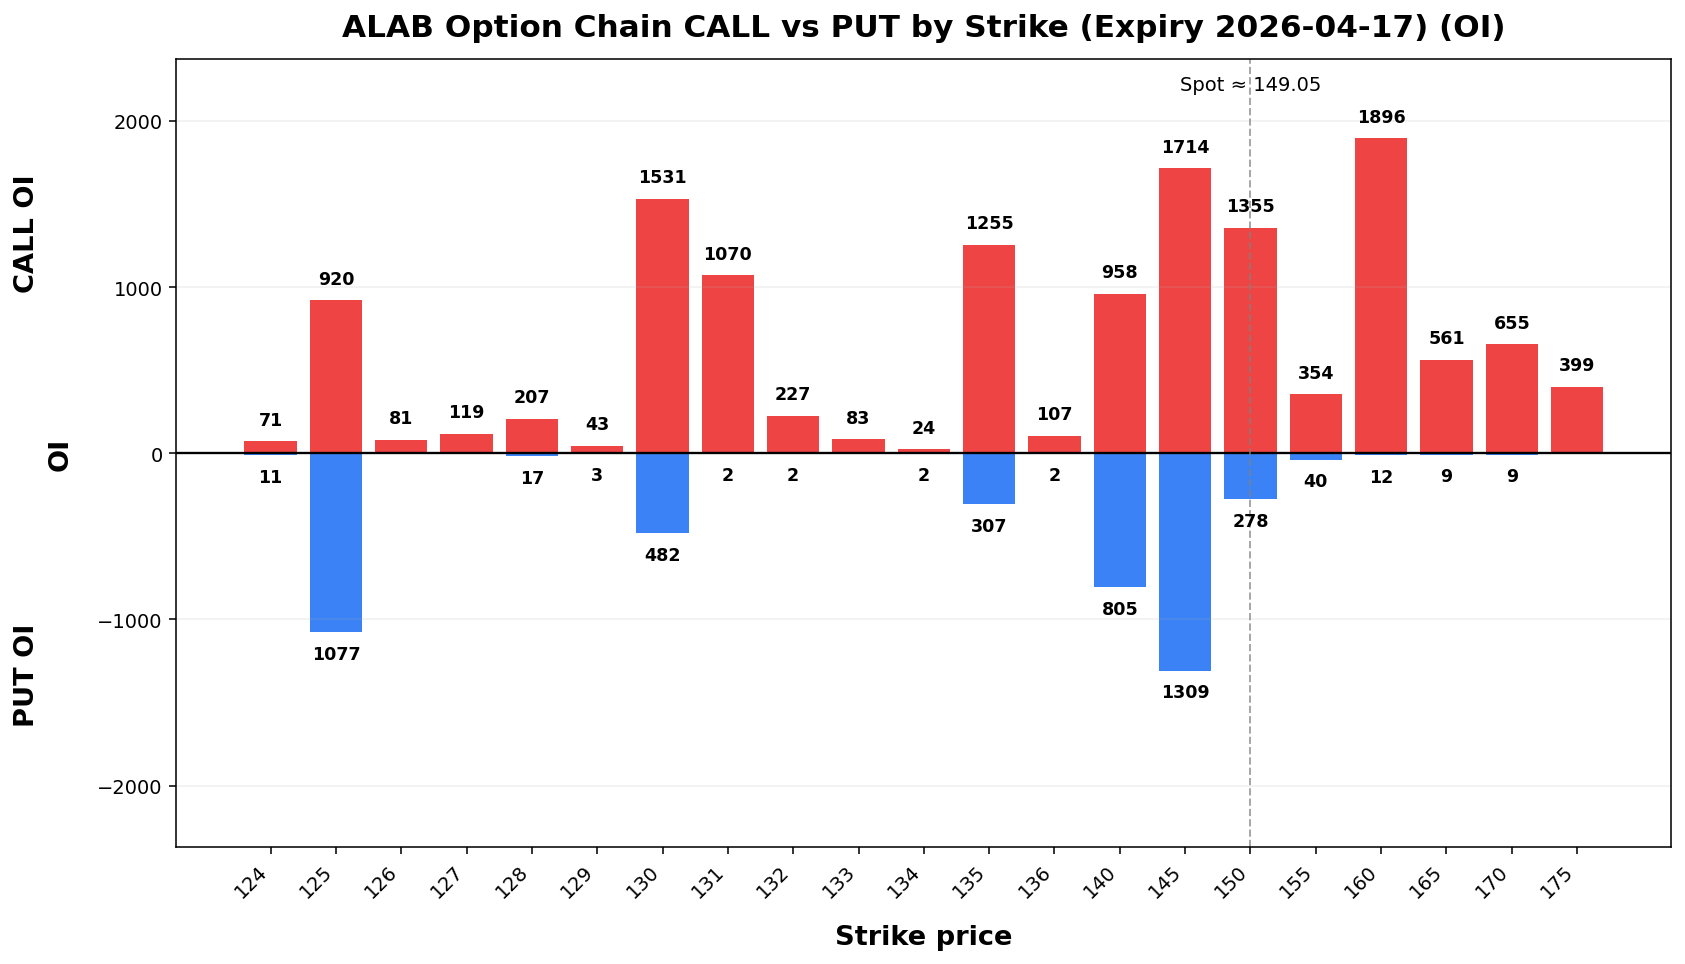
📌 ALAB @ 149.05 (2026-04-12 08:48 AM MYT)

• Current price is **149.05**. Key support is around **145.00**, and resistance is around **150.00**.
• For the next week, the model’s **68% expected range** is roughly **134.19 to 163.91**.
• A wider **90% range** is about **124.61 to 173.49**.
• Dealer positioning looks **LONG gamma**, so the market behavior is classified as **TRANSITION**.
• The estimated **gamma flip** is near **124.49**. Crossing and holding beyond this area can change the trading behavior.
• Approximate breakout odds: **above resistance 47.4%**, **below support 39.2%** by the target horizon.
• Options skew is fairly balanced, so there is **no strong directional bias** from skew alone.
• Near-term implied volatility is higher than the next expiry (**IV1 72.41% vs IV2 67.83%**), which suggests **near-term event stress / backwardation**.
• Recent volume is **2.38x** the 20-day average, which supports stronger continuation or breakout follow-through.
• On the daily chart, the stock currently looks like **Sideways / Range**.
• The implied distribution is **fairly balanced** between upside and downside tails.
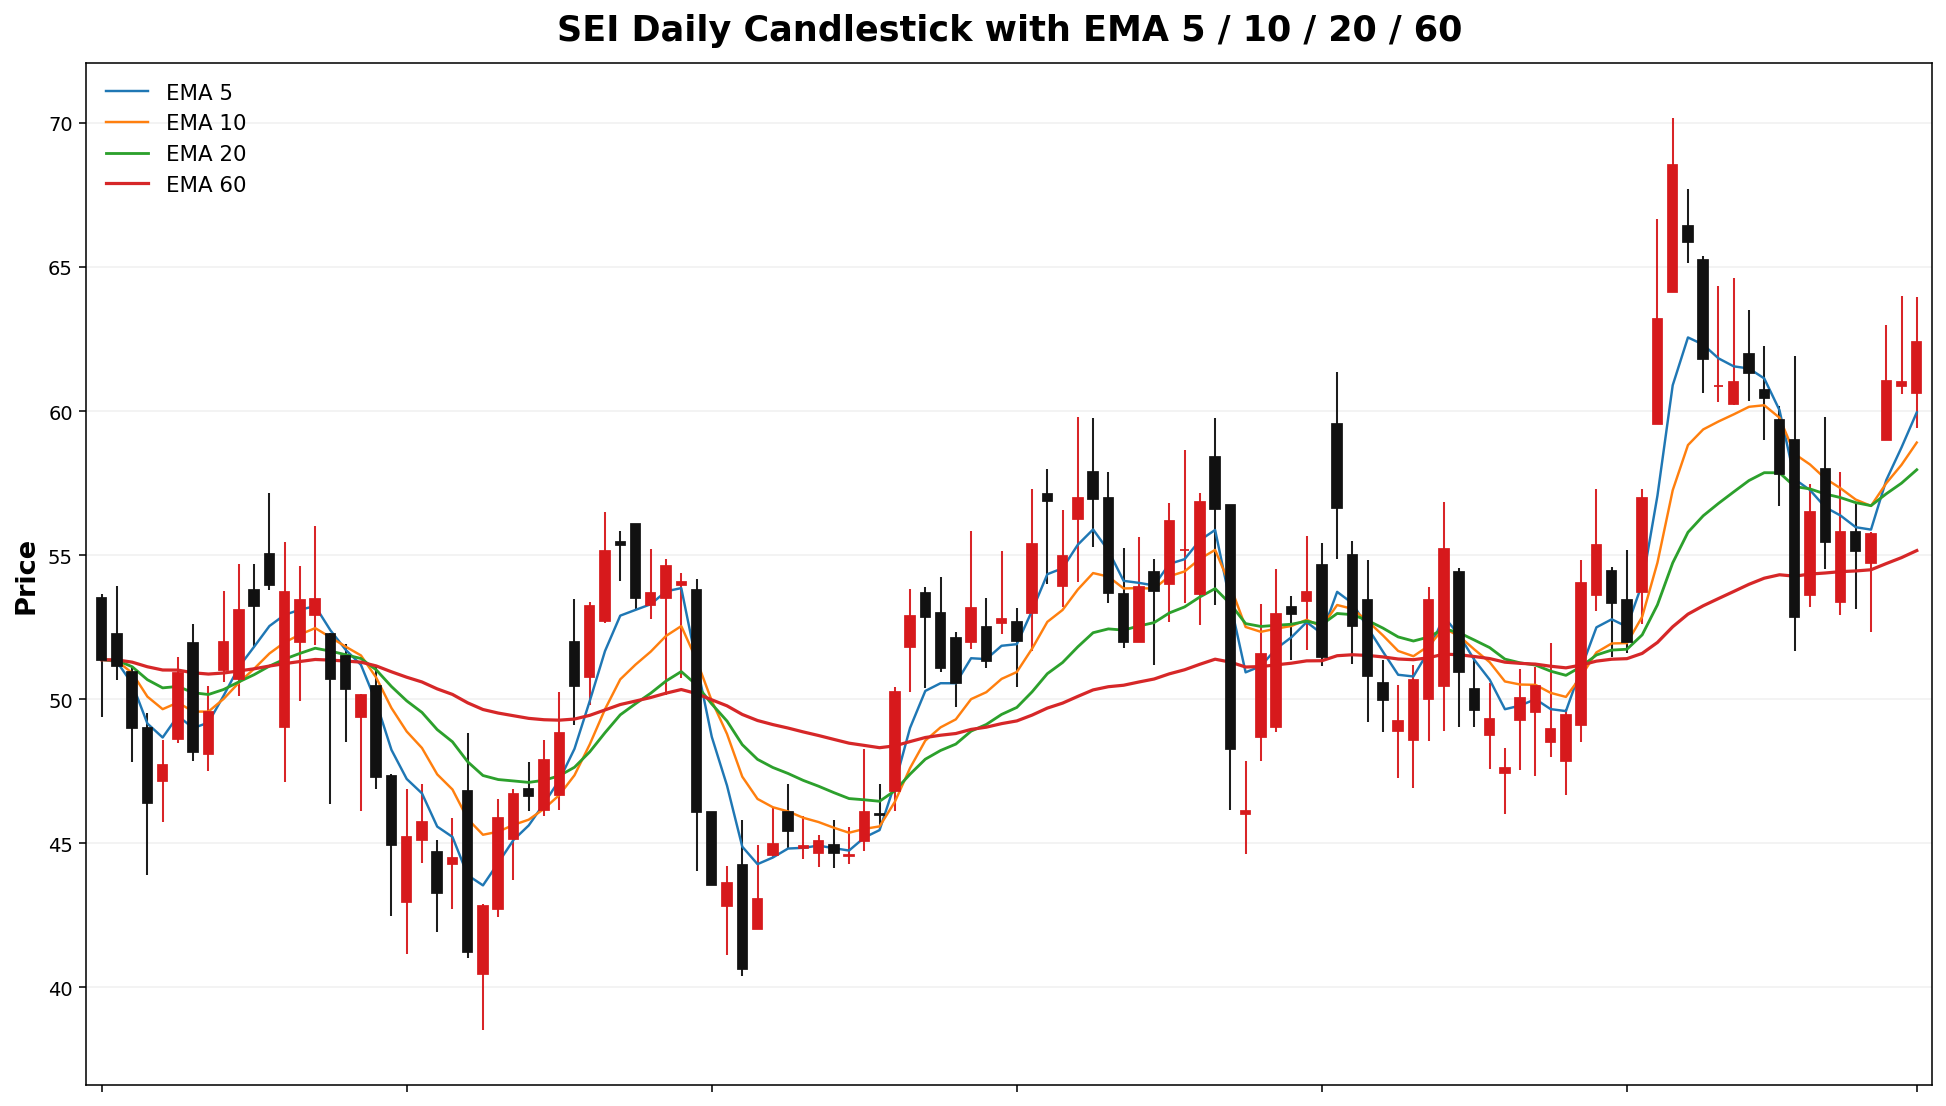
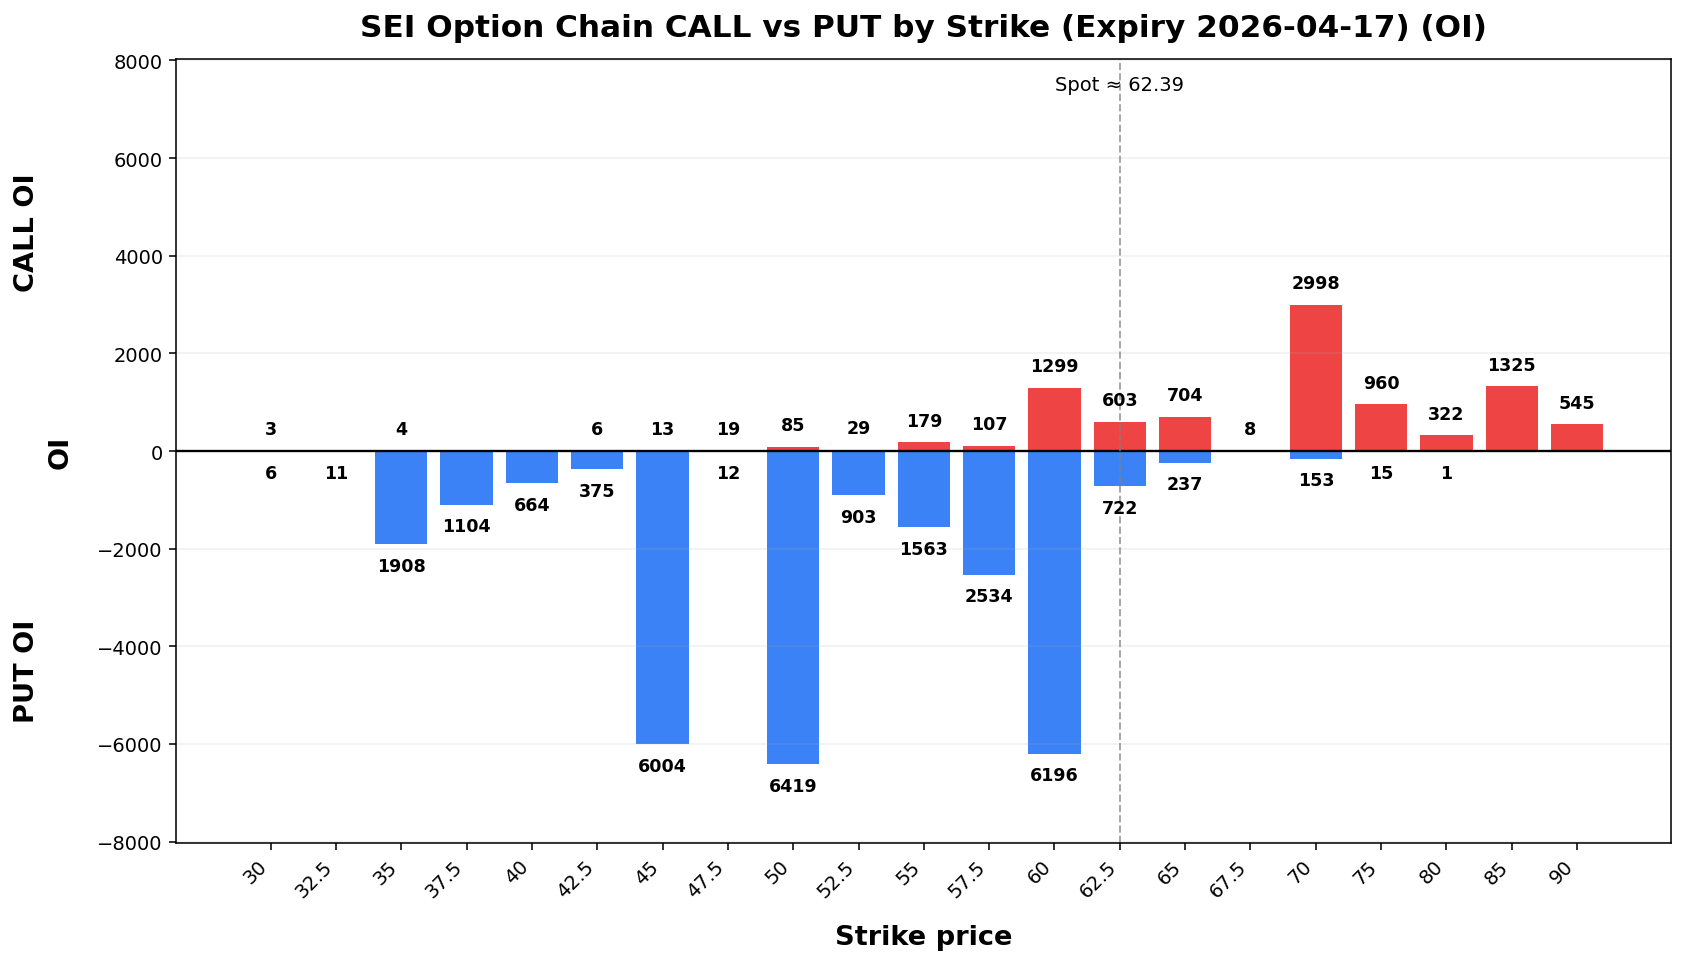
SEI
Spot: 62.39
Report Time: 2026-04-12 08:48 AM MYT
Regime: TREND
Dealer Gamma: SHORT
Term Structure
| Expiry |
DTE |
Forward |
ATM IV |
ATM Straddle |
| 2026-04-17 |
6 |
62.34 |
83.95% |
6.60 |
| 2026-05-15 |
34 |
62.71 |
85.88% |
16.30 |
Weekly Range
| Confidence |
Low |
High |
Width |
| 68% |
54.97 |
69.81 |
14.84 |
| 80% |
52.88 |
71.90 |
19.02 |
| 90% |
50.19 |
74.59 |
24.41 |
| 95% |
47.85 |
76.93 |
29.08 |
Structure & Probabilities
| Support |
Resistance |
Gamma Flip |
Max Pain |
P>Res |
P<Sup |
| 60.00 |
70.00 |
68.22 |
60.00 |
14.4% |
42.2% |
Flow & Skew
| Call Vol |
Put Vol |
Vol P/C |
Call OI |
Put OI |
OI P/C |
Skew |
Skew Bias |
| 509 |
499 |
0.98 |
9,220 |
28,827 |
3.13 |
5.91 vol pts |
PUT_SKEW |
Tail Risk
| Q10 |
Q50 |
Q90 |
Down Tail |
Up Tail |
Down/Up |
| 49.65 |
62.02 |
72.81 |
12.74 |
10.42 |
1.22 |
Daily Technicals
| EMA20 |
EMA50 |
VWAP20 |
BB Lower |
BB Mid |
BB Upper |
BB Width |
Vol Ratio |
Path |
| 57.97 |
55.58 |
60.63 |
50.78 |
59.29 |
67.80 |
28.70% |
0.71 |
UP trend (expanding) |
Day Plan
- 60.00-70.00 range: fade extremes
- > 70.00: chase only if hold + vol
- < 60.00: risk expand; reduce size
- Regime: TREND
- Tech: UP trend (expanding)
Swing Plan
- Accumulate: 60.00-60.00
- Trim: 70.00-70.00
- Add: close > 70.00
- Cut: close < 60.00
- Best for: trend regime
Raw Text Summary
📌 SEI @ 62.39 (2026-04-12 08:48 AM MYT)

• Current price is **62.39**. Key support is around **60.00**, and resistance is around **70.00**.
• For the next week, the model’s **68% expected range** is roughly **54.97 to 69.81**.
• A wider **90% range** is about **50.19 to 74.59**.
• Dealer positioning looks **SHORT gamma**, so the market behavior is classified as **TREND**.
• The estimated **gamma flip** is near **68.22**. Crossing and holding beyond this area can change the trading behavior.
• Approximate breakout odds: **above resistance 14.4%**, **below support 42.2%** by the target horizon.
• Options skew is tilted toward **puts**, which suggests traders are paying more for downside protection.
• Near-term implied volatility is lower than the next expiry (**IV1 83.95% vs IV2 85.88%**), which suggests a **contango / calmer front expiry** setup.
• Recent volume is only **0.71x** the 20-day average, so breakouts may be less reliable unless volume improves.
• On the daily chart, the stock currently looks like **UP trend (expanding)**.
• The implied distribution shows **heavier downside tail risk** than upside tail potential.
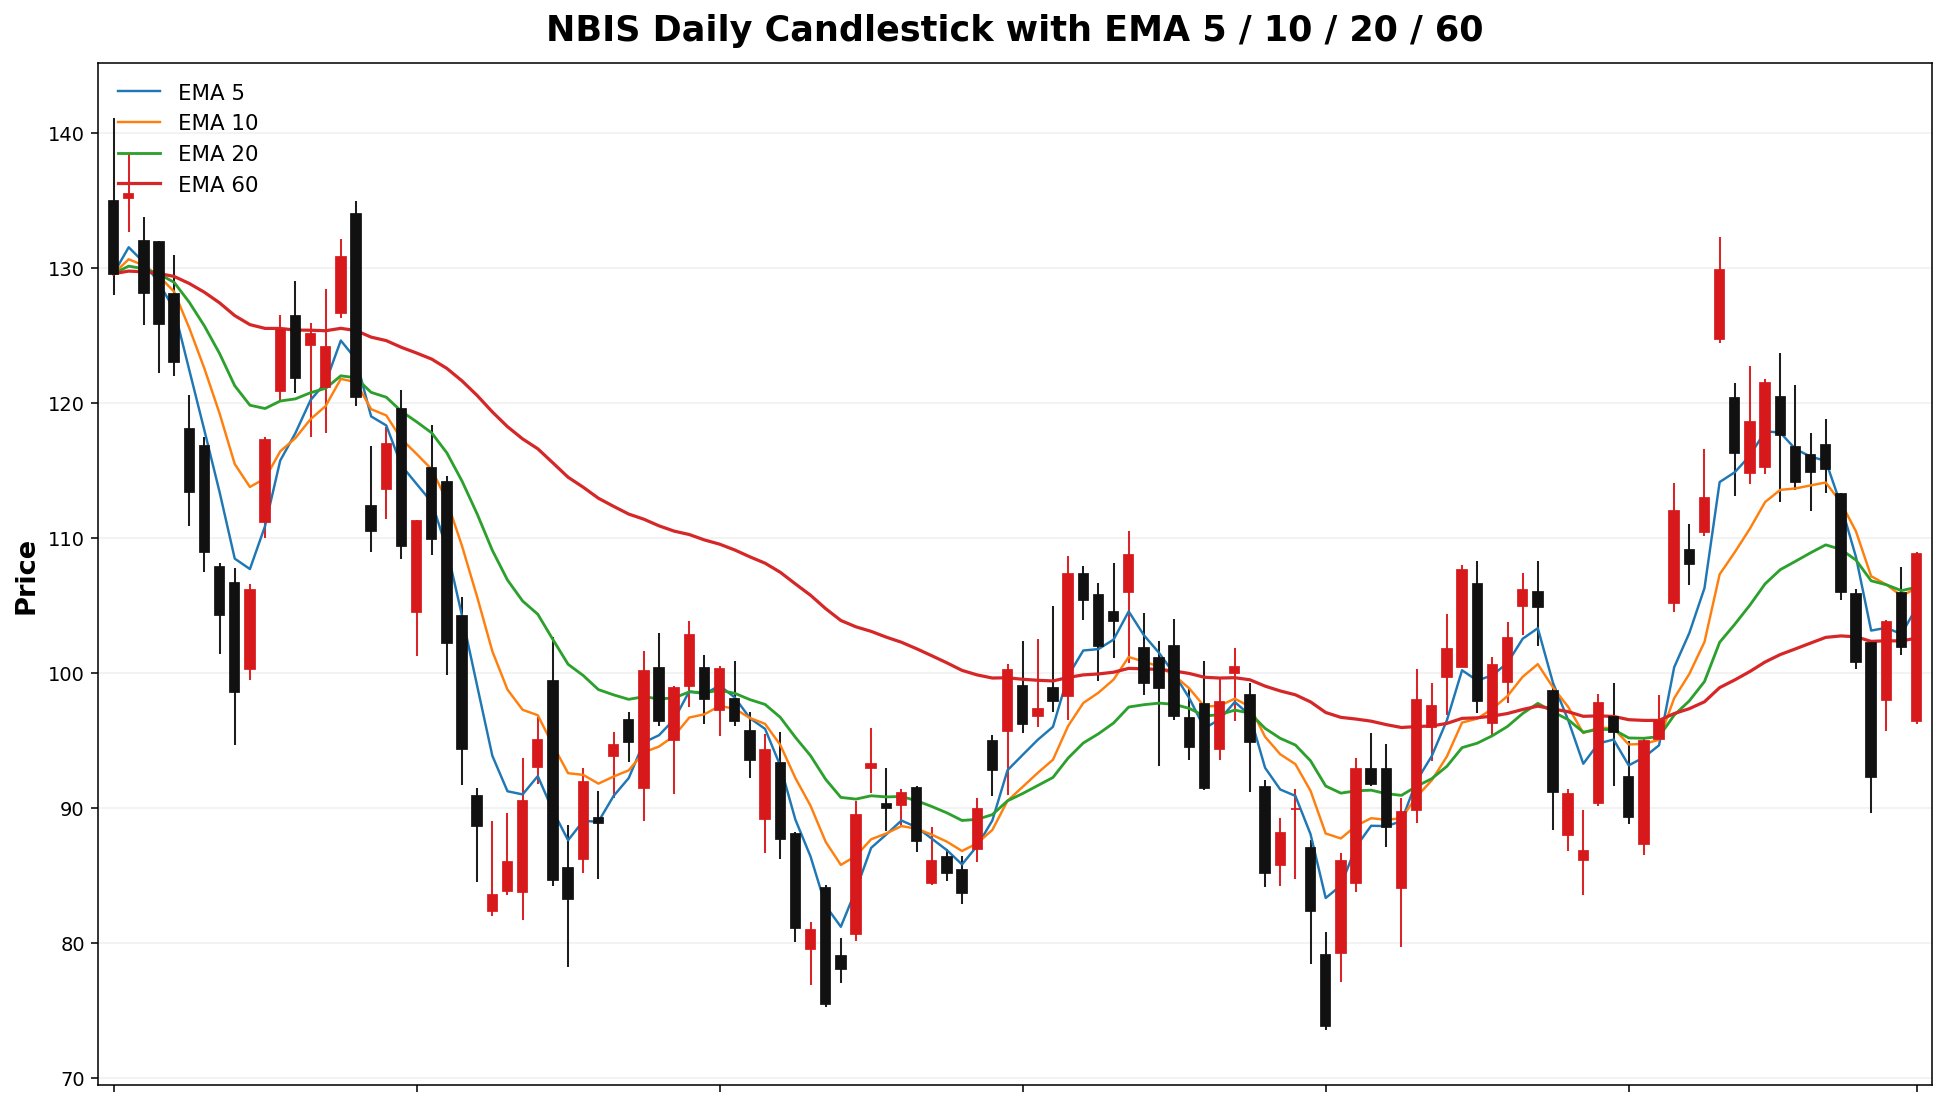
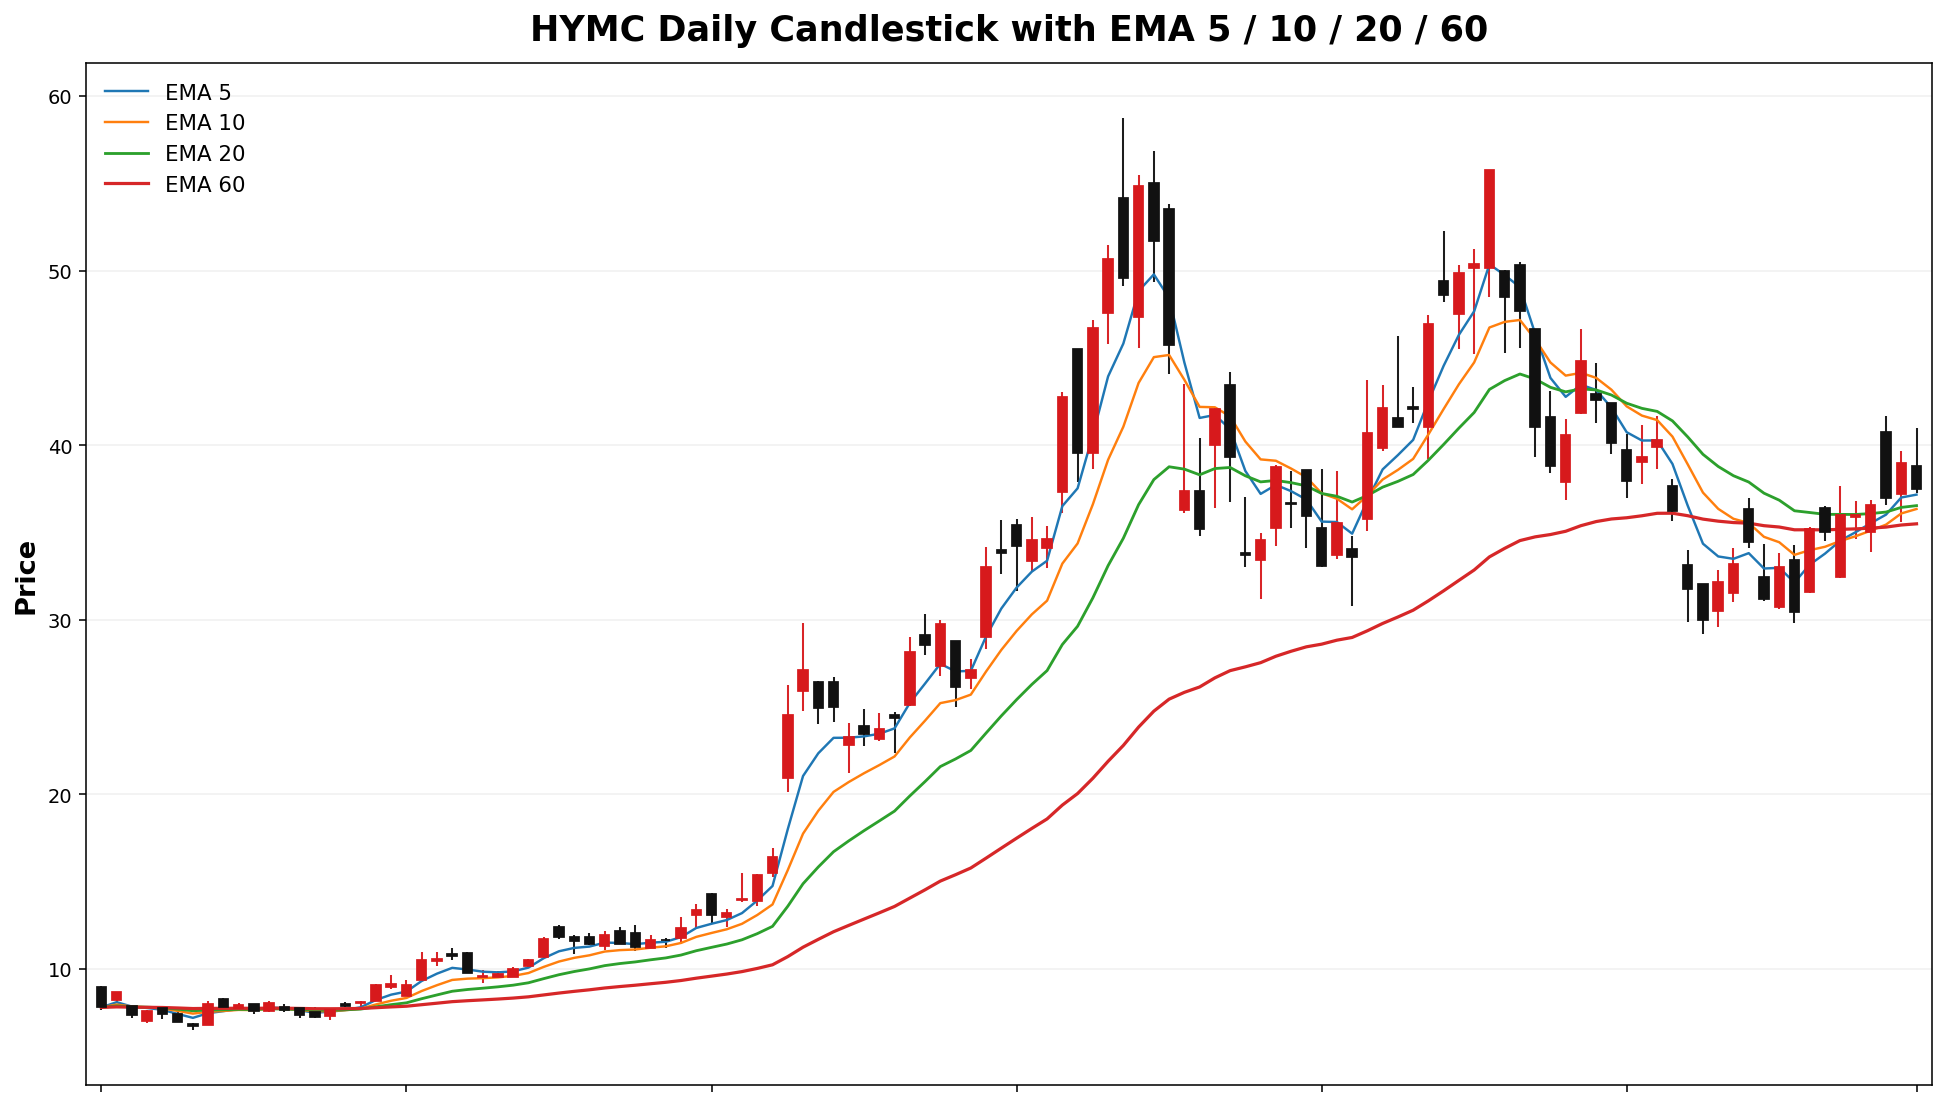
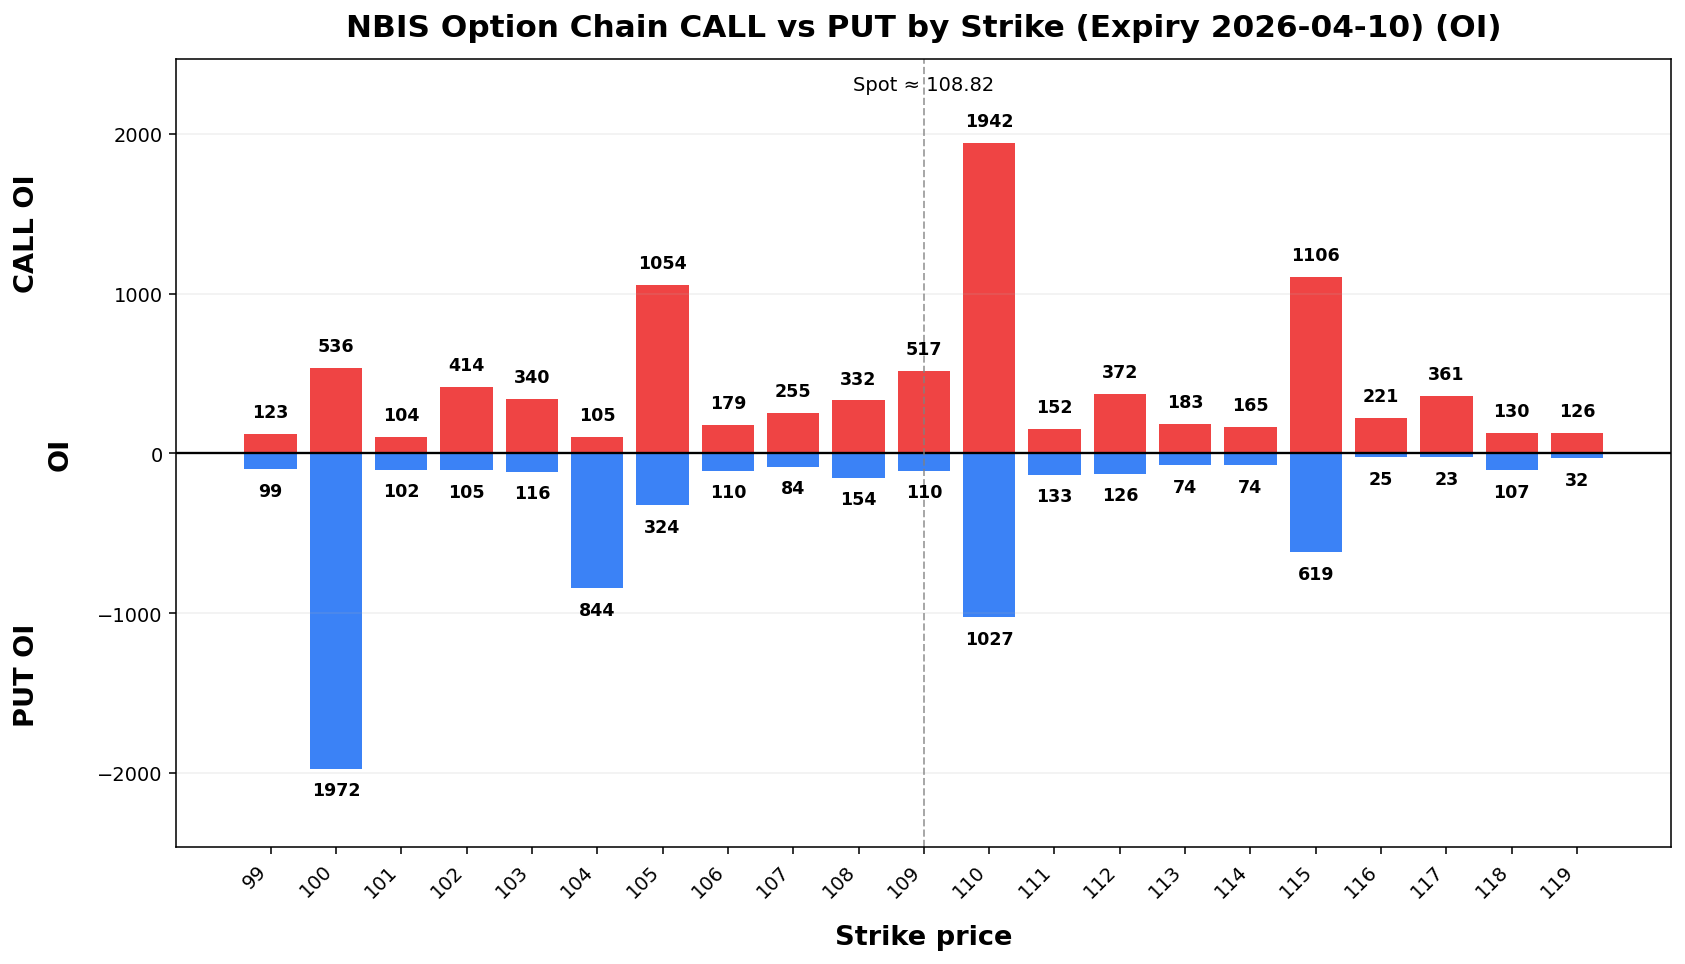
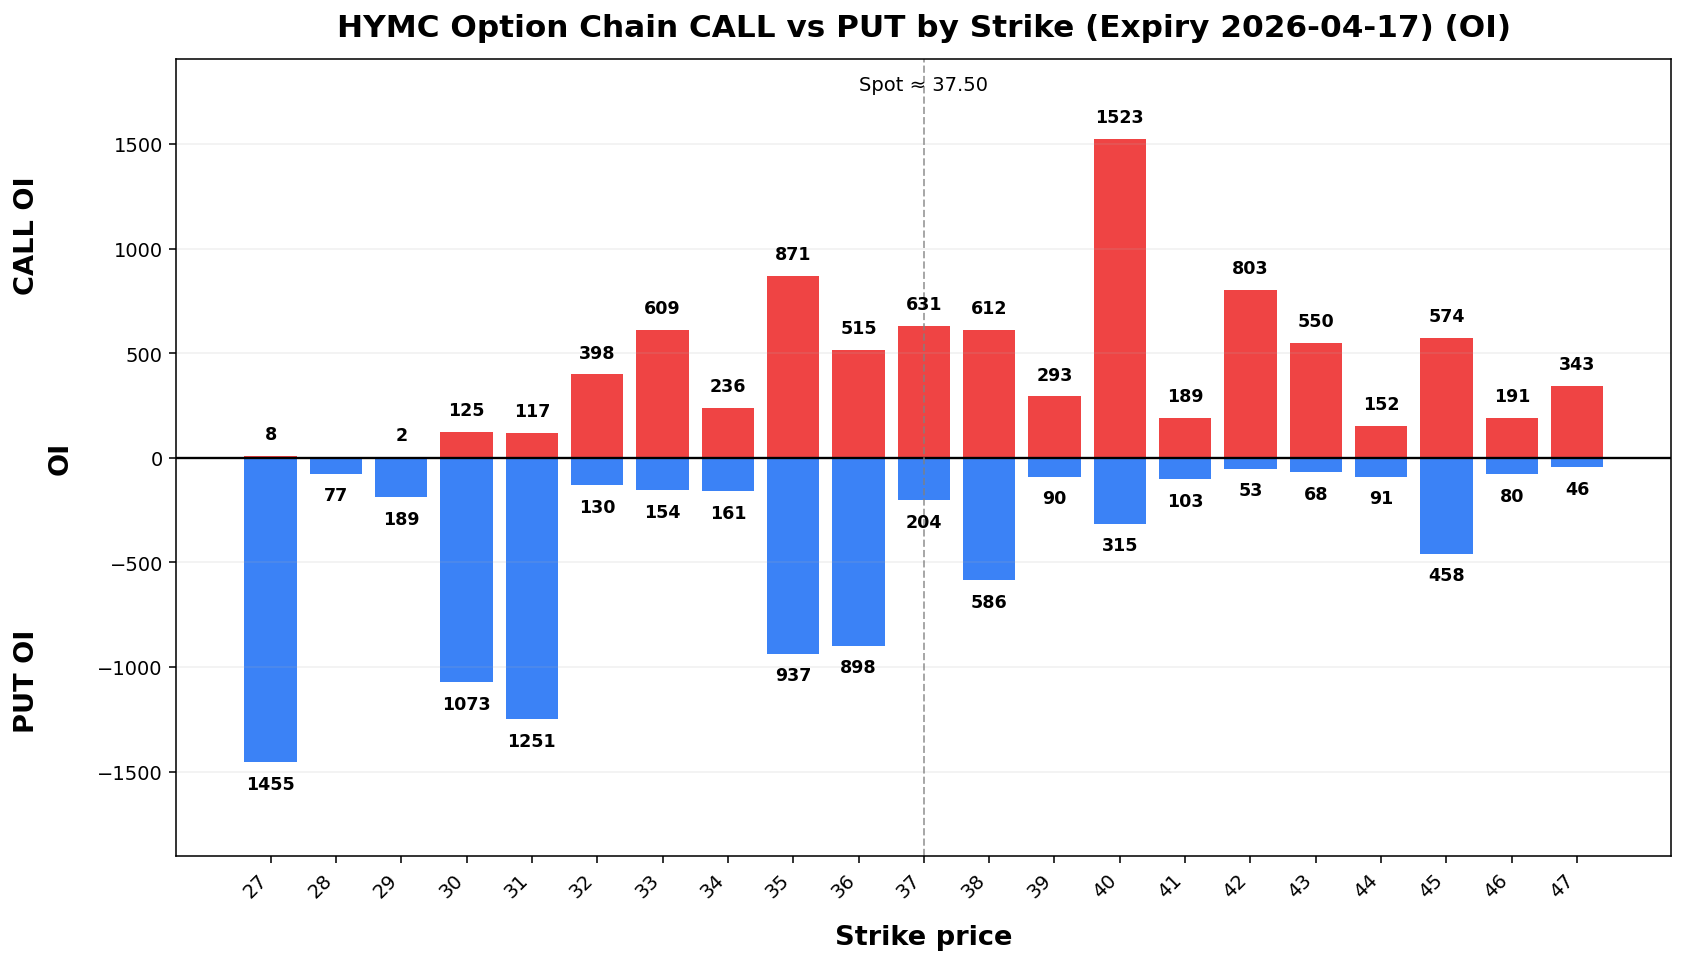
NBISHYMC
Spot: 108.8237.50
Report Time: 2026-04-0512 06:4908:48 PMAM MYT
Regime: TRANSITION
Dealer Gamma: LONG
Term Structure
| Expiry |
DTE |
Forward |
ATM IV |
ATM Straddle |
2026-04-1017 |
6 |
108.8137.52 |
74.76%88.35% |
9.884.18 |
2026-04-1705-15 |
1334 |
108.8837.61 |
71.12%82.40% |
14.259.40 |
Weekly Range
| Confidence |
Low |
High |
Width |
| 68% |
97.6132.91 |
120.0342.09 |
22.429.19 |
| 80% |
94.4631.61 |
123.1843.39 |
28.7311.77 |
| 90% |
90.3829.94 |
127.2645.06 |
36.8715.11 |
| 95% |
86.8528.50 |
130.7946.50 |
43.9418.00 |
Structure & Probabilities
| Support |
Resistance |
Gamma Flip |
Max Pain |
P>Res |
P<Sup |
105.36.00 |
110.40.00 |
103.7934.10 |
105.36.00 |
35.0%22.4% |
33.5%34.0% |
Flow & Skew
| Call Vol |
Put Vol |
Vol P/C |
Call OI |
Put OI |
OI P/C |
Skew |
Skew Bias |
20,545900 |
11,978537 |
0.5860 |
17,28213,029 |
17,25510,114 |
1.000.78 |
8.404.69 vol pts |
PUT_SKEW |
Tail Risk
| Q10 |
Q50 |
Q90 |
Down Tail |
Up Tail |
Down/Up |
89.8730.85 |
108.8437.49 |
124.0543.32 |
18.956.65 |
15.235.82 |
1.2414 |
Daily Technicals
| EMA20 |
EMA50 |
VWAP20 |
BB Lower |
BB Mid |
BB Upper |
BB Width |
Vol Ratio |
Path |
106.3636.54 |
102.6836.31 |
111.9534.42 |
87.6929.09 |
108.7635.12 |
129.8441.15 |
38.76%34.35% |
0.7371 |
SidewaysUP /trend Range(expanding) |
Day Plan
105.36.00-110.40.00 range: fade extremes- >
110.40.00: chase only if hold + vol
- <
105.36.00: risk expand; reduce size
- Regime: TRANSITION
- Tech:
SidewaysUP /trend Range(expanding)
Swing Plan
- Accumulate:
105.36.00-105.36.00
- Trim:
110.40.00-110.40.00
- Add: close >
110.40.00
- Cut: close <
105.36.00
- Best for: transition regime
Raw Text Summary
📌 NBISHYMC @ 108.8237.50 (2026-04-0512 06:4908:48 PMAM MYT)

• Current price is **108.82*37.50**. Key support is around **105.36.00**, and resistance is around **110.40.00**.
• For the next week, the model’s **68% expected range** is roughly **97.6132.91 to 120.03*42.09**.
• A wider **90% range** is about **90.3829.94 to 127.26*45.06**.
• Dealer positioning looks **LONG gamma**, so the market behavior is classified as **TRANSITION**.
• The estimated **gamma flip** is near **103.79*34.10**. Crossing and holding beyond this area can change the trading behavior.
• Approximate breakout odds: **above resistance 35.0%22.4%**, **below support 33.5%34.0%** by the target horizon.
• Options skew is tilted toward **puts**, which suggests traders are paying more for downside protection.
• Near-term implied volatility is higher than the next expiry (**IV1 74.76%88.35% vs IV2 71.12%82.40%**), which suggests **near-term event stress / backwardation**.
• Recent volume is only **0.73x** the 20-day average, so breakouts may be less reliable unless volume improves.
• On the daily chart, the stock currently looks like **Sideways / Range**.
• The implied distribution shows **heavier downside tail risk** than upside tail potential.
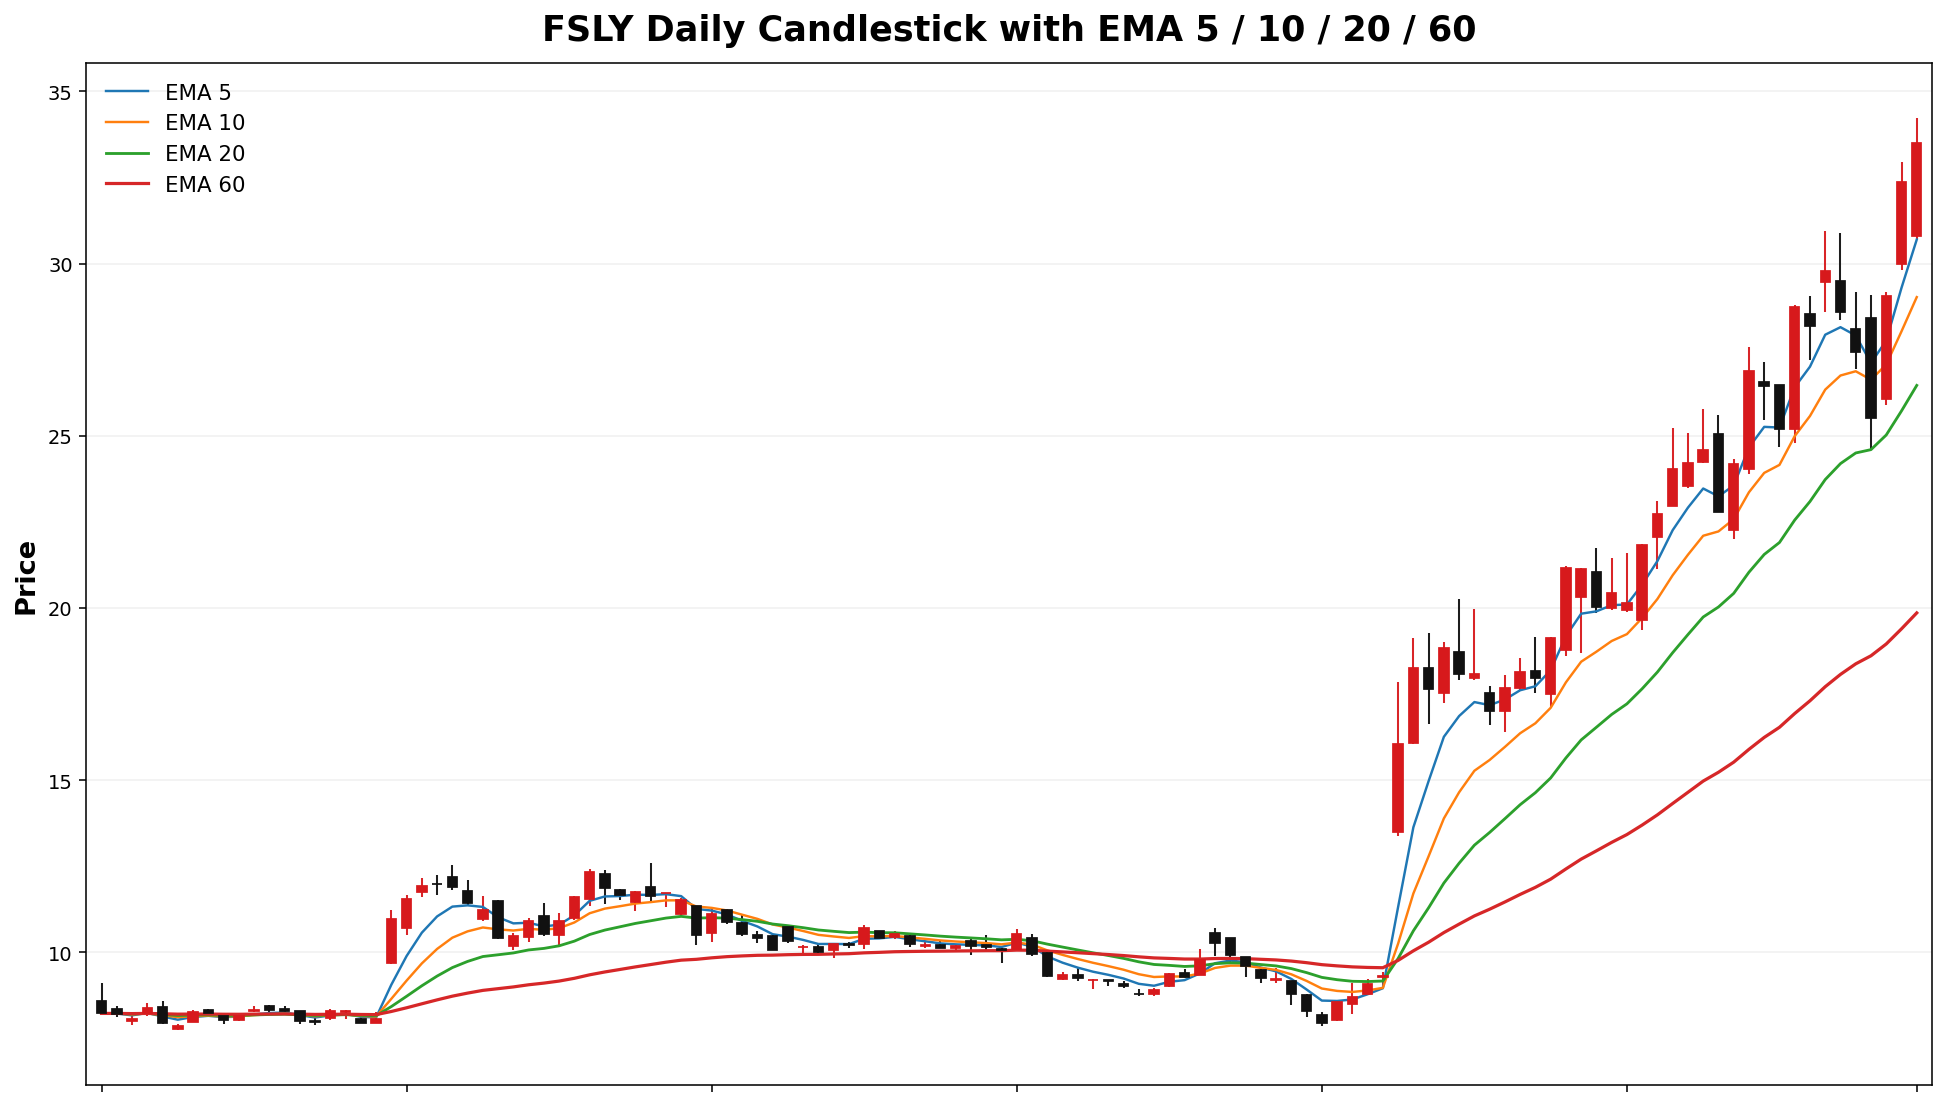
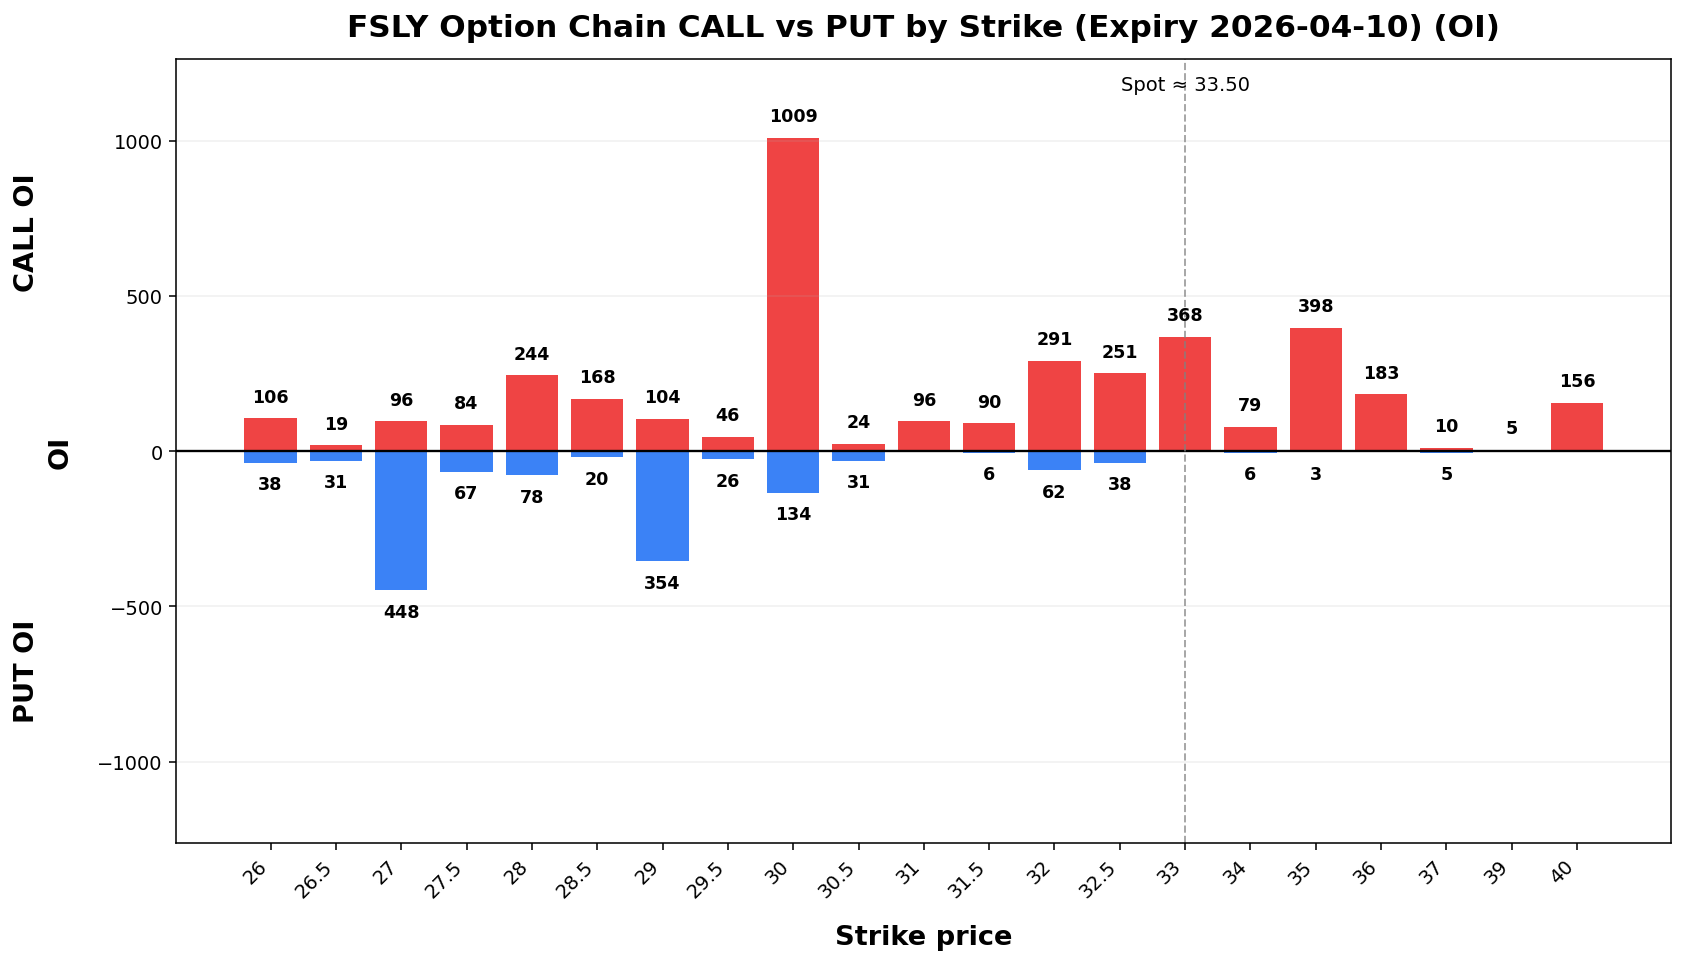
FSLY
Spot: 33.50
Report Time: 2026-04-05 06:49 PM MYT
Regime: TRANSITION
Dealer Gamma: LONG
Term Structure
Expiry |
DTE |
Forward |
ATM IV |
ATM Straddle |
|---|
2026-04-10 |
6 |
33.46 |
97.13% |
3.95 |
2026-04-17 |
13 |
33.47 |
92.41% |
5.70 |
Weekly Range
Confidence |
Low |
High |
Width |
|---|
68% |
29.02 |
37.98 |
8.97 |
80% |
27.75 |
39.25 |
11.49 |
90% |
26.13 |
40.87 |
14.75 |
95% |
24.71 |
42.29 |
17.58 |
Structure & Probabilities
Support |
Resistance |
Gamma Flip |
Max Pain |
P>Res |
P<Sup |
|---|
33.00 |
35.00 |
26.95 |
25.00 |
32.9% |
40.7% |
Flow & Skew
Call Vol |
Put Vol |
Vol P/C |
Call OI |
Put OI |
OI P/C |
Skew |
Skew Bias |
|---|
3,886 |
1,589 |
0.41 |
5,255 |
8,218 |
1.56 |
1.76 vol pts |
PUT_SKEW |
Tail Risk
Q10 |
Q50 |
Q90 |
Down Tail |
Up Tail |
Down/Up |
|---|
20.04 |
31.76 |
37.62 |
13.46 |
4.12 |
3.27 |
Daily Technicals
EMA20 |
EMA50 |
VWAP20 |
BB Lower |
BB Mid |
BB Upper |
BB Width |
Vol Ratio |
Path |
|---|
26.46 |
21.04 |
26.23 |
19.41 |
26.31 |
33.22 |
52.48% |
0.96 |
UP trend (expanding) |
Day Plan
33.00-35.00 range: fade extremes
> 35.00: chase only if hold + vol
< 33.00: risk expand; reduce size
Regime: TRANSITION
Tech: UP trend (expanding)
Swing Plan
Accumulate: 33.00-33.00
Trim: 35.00-35.00
Add: close > 35.00
Cut: close < 33.00
Best for: transition regime
Raw Text Summary
📌 FSLY @ 33.50 (2026-04-05 06:49 PM MYT)

• Current price is **33.50**. Key support is around **33.00**, and resistance is around **35.00**.
• For the next week, the model’s **68% expected range** is roughly **29.02 to 37.98**.
• A wider **90% range** is about **26.13 to 40.87**.
• Dealer positioning looks **LONG gamma**, so the market behavior is classified as **TRANSITION**.
• The estimated **gamma flip** is near **26.95**. Crossing and holding beyond this area can change the trading behavior.
• Approximate breakout odds: **above resistance 32.9%**, **below support 40.7%** by the target horizon.
• Options skew is fairly balanced, so there is **no strong directional bias** from skew alone.
• Near-term implied volatility is higher than the next expiry (**IV1 97.13% vs IV2 92.41%**), which suggests **near-term event stress / backwardation**.
• On the daily chart, the stock currently looks like **UP trend (expanding)**.
• The implied distribution shows **heavier downside tail risk** than upside tail potential.
SEDG
Spot: 48.75
Report Time: 2026-04-05 06:49 PM MYT
Regime: TREND
Dealer Gamma: SHORT
Term Structure
Expiry |
DTE |
Forward |
ATM IV |
ATM Straddle |
|---|
2026-04-10 |
6 |
48.96 |
87.37% |
5.17 |
2026-04-17 |
13 |
48.90 |
76.04% |
6.83 |
Weekly Range
Confidence |
Low |
High |
Width |
|---|
68% |
43.09 |
54.41 |
11.32 |
80% |
41.50 |
56.00 |
14.50 |
90% |
39.44 |
58.06 |
18.61 |
95% |
37.66 |
59.84 |
22.18 |
Structure & Probabilities
Support |
Resistance |
Gamma Flip |
Max Pain |
P>Res |
P<Sup |
|---|
48.00 |
50.00 |
47.91 |
48.00 |
46.3% |
50.2% |
Flow & Skew
Call Vol |
Put Vol |
Vol P/C |
Call OI |
Put OI |
OI P/C |
Skew |
Skew Bias |
|---|
991 |
1,597 |
1.61 |
1,355 |
1,383 |
1.02 |
-0.88 vol pts |
FLAT |
Tail Risk
Q10 |
Q50 |
Q90 |
Down Tail |
Up Tail |
Down/Up |
|---|
40.87 |
49.45 |
55.97 |
7.88 |
7.22 |
1.09 |
Daily Technicals
EMA20 |
EMA50 |
VWAP20 |
BB Lower |
BB Mid |
BB Upper |
BB Width |
Vol Ratio |
Path |
|---|
45.90 |
41.08 |
44.92 |
31.31 |
44.37 |
57.43 |
58.87% |
0.68 |
UP trend (expanding) |
Day Plan
48.00-50.00 range: fade extremes
> 50.00: chase only if hold + vol
< 48.00: risk expand; reduce size
Regime: TREND
Tech: UP trend (expanding)
Swing Plan
Accumulate: 48.00-48.00
Trim: 50.00-50.00
Add: close > 50.00
Cut: close < 48.00
Best for: trend regime
Raw Text Summary
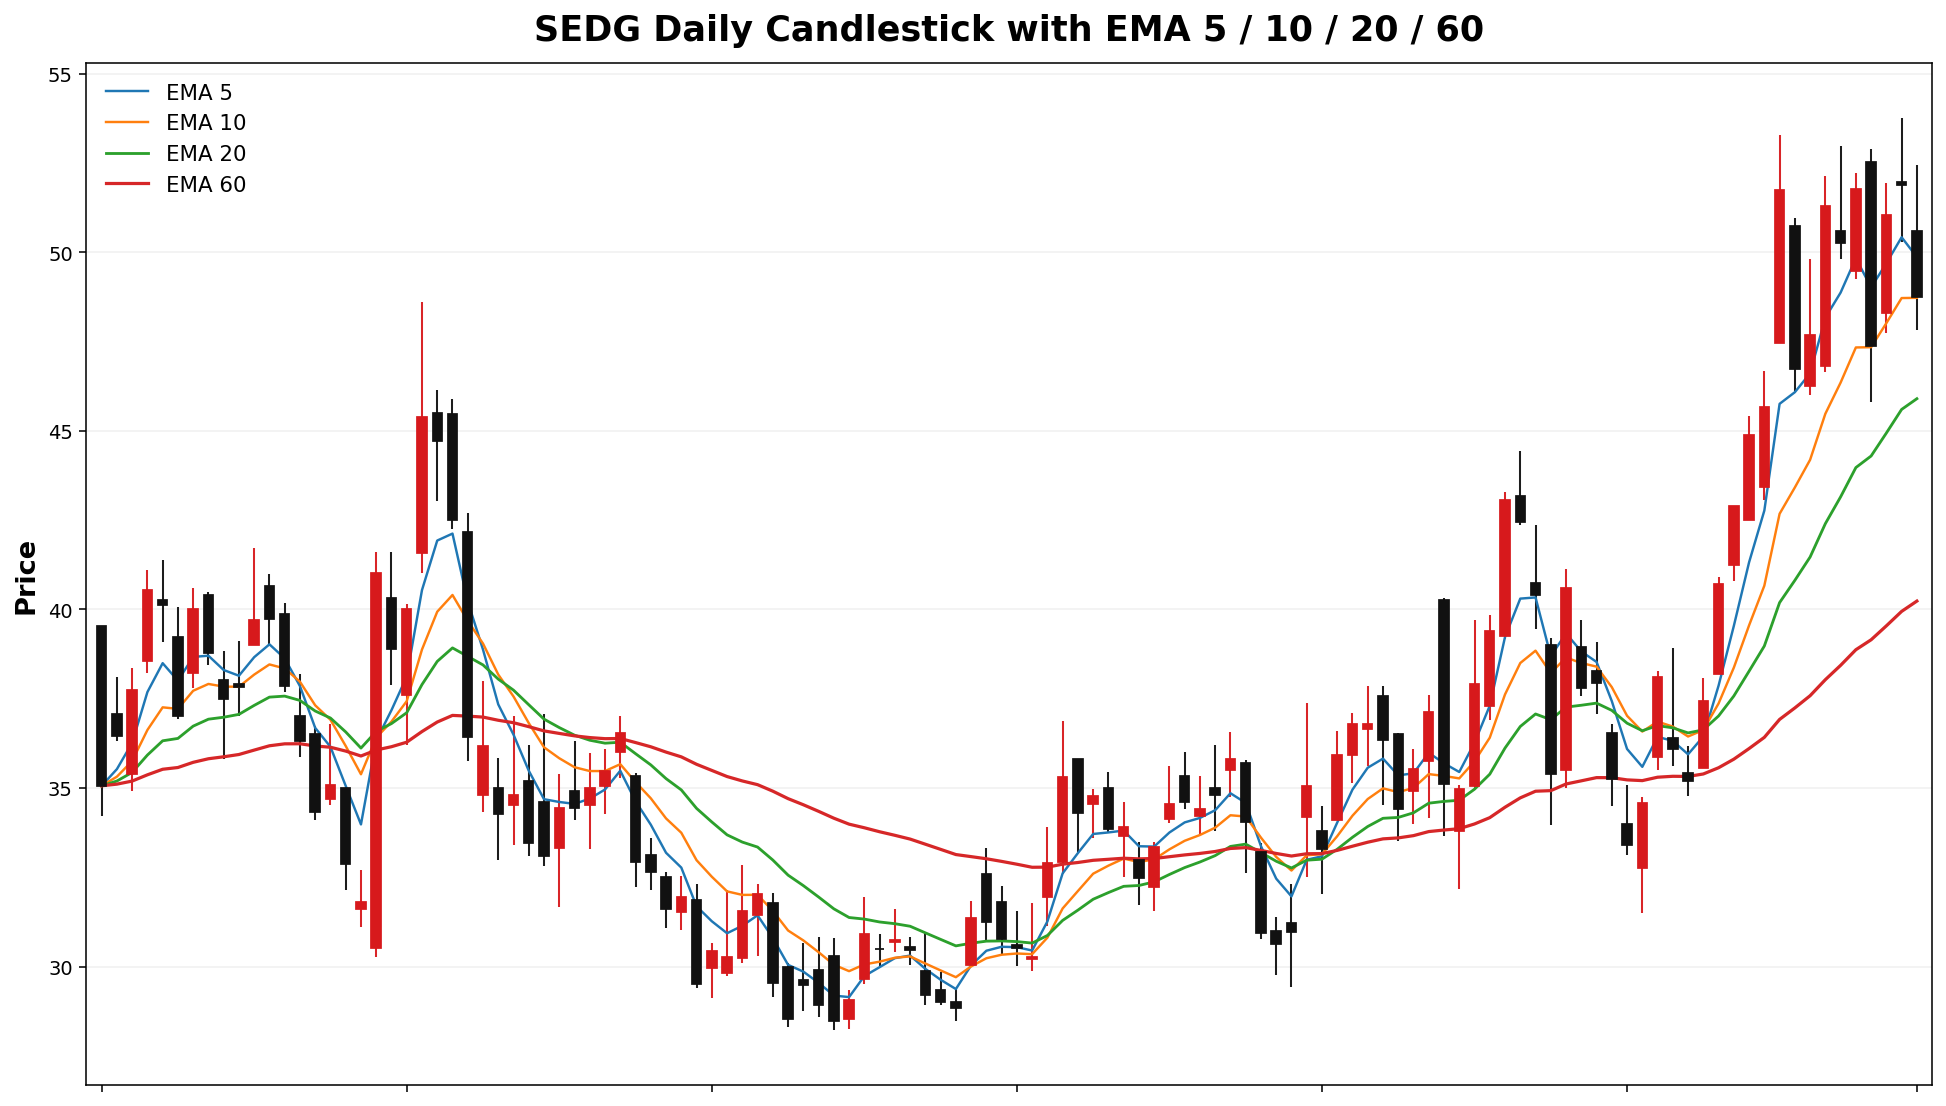
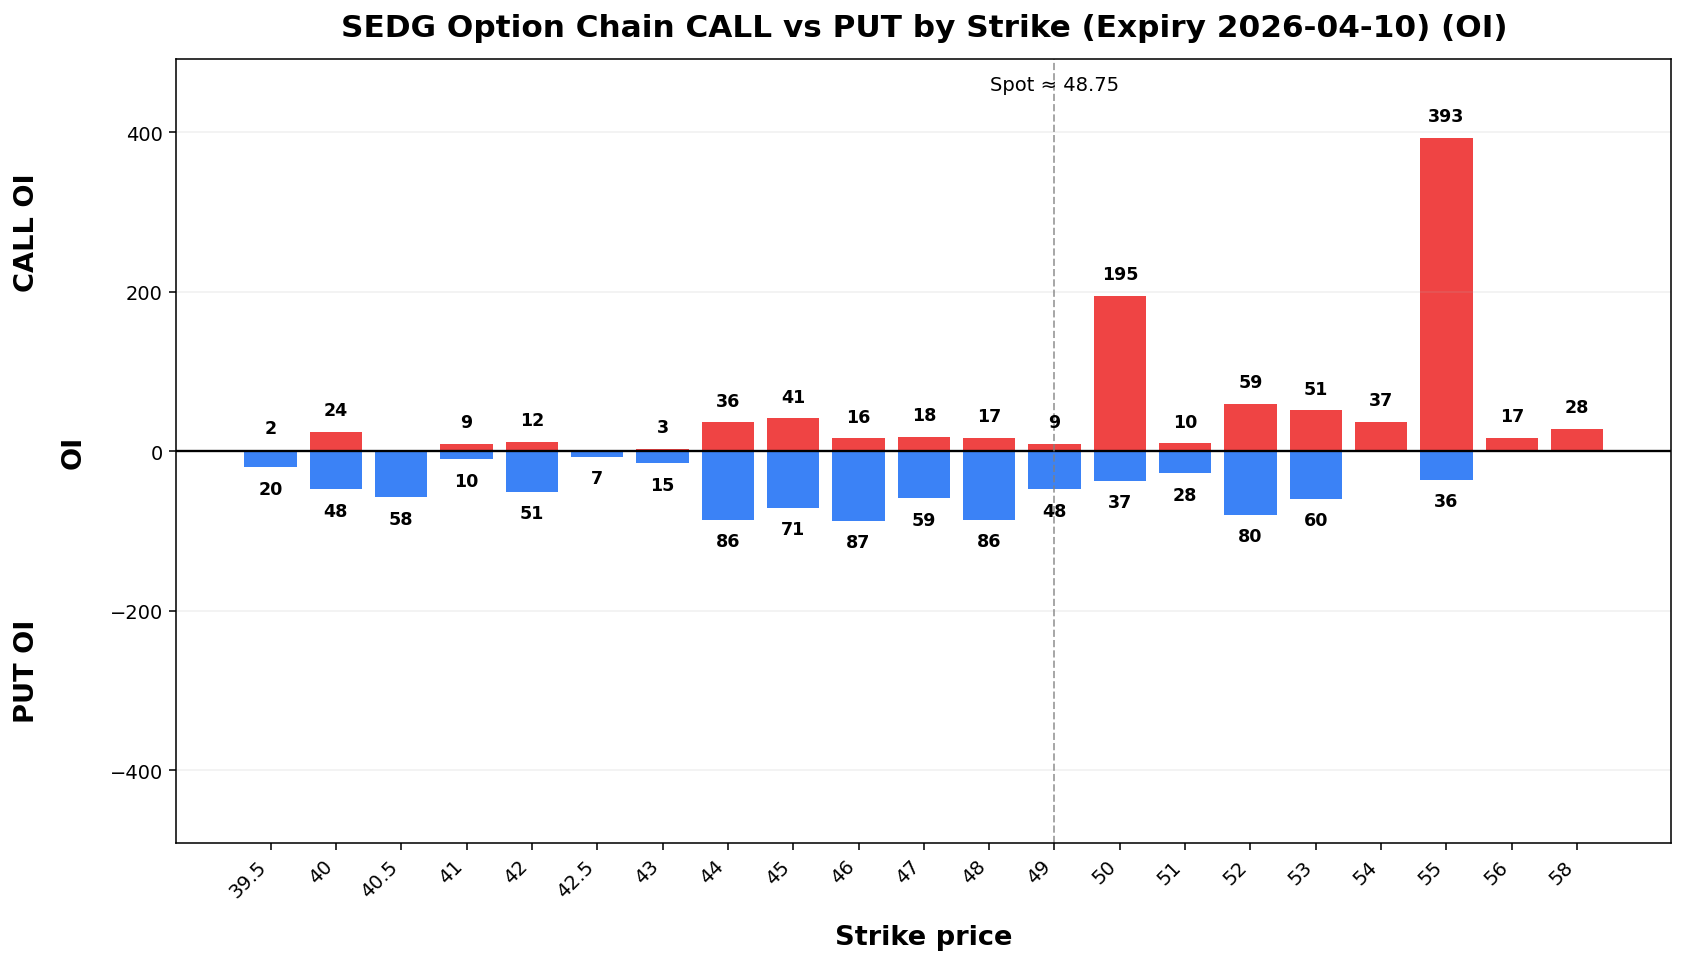
📌 SEDG @ 48.75 (2026-04-05 06:49 PM MYT)

• Current price is **48.75**. Key support is around **48.00**, and resistance is around **50.00**.
• For the next week, the model’s **68% expected range** is roughly **43.09 to 54.41**.
• A wider **90% range** is about **39.44 to 58.06**.
• Dealer positioning looks **SHORT gamma**, so the market behavior is classified as **TREND**.
• The estimated **gamma flip** is near **47.91**. Crossing and holding beyond this area can change the trading behavior.
• Approximate breakout odds: **above resistance 46.3%**, **below support 50.2%** by the target horizon.
• Options skew is fairly balanced, so there is **no strong directional bias** from skew alone.
• Near-term implied volatility is higher than the next expiry (**IV1 87.37% vs IV2 76.04%**), which suggests **near-term event stress / backwardation**.
• Recent volume is only **0.68x** the 20-day average, so breakouts may be less reliable unless volume improves.
• On the daily chart, the stock currently looks like **UP trend (expanding)**.
• The implied distribution is **fairly balanced** between upside and downside tails.
AA
Spot: 71.53
Report Time: 2026-04-05 06:50 PM MYT
Regime: TRANSITION
Dealer Gamma: LONG
Term Structure
Expiry |
DTE |
Forward |
ATM IV |
ATM Straddle |
|---|
2026-04-10 |
6 |
71.49 |
61.16% |
5.31 |
2026-04-17 |
13 |
71.49 |
64.16% |
8.45 |
Weekly Range
Confidence |
Low |
High |
Width |
|---|
68% |
65.23 |
77.83 |
12.60 |
80% |
63.45 |
79.61 |
16.15 |
90% |
61.17 |
81.89 |
20.73 |
95% |
59.18 |
83.88 |
24.70 |
Structure & Probabilities
Support |
Resistance |
Gamma Flip |
Max Pain |
P>Res |
P<Sup |
|---|
71.00 |
72.00 |
59.71 |
62.00 |
35.3% |
41.9% |
Flow & Skew
Call Vol |
Put Vol |
Vol P/C |
Call OI |
Put OI |
OI P/C |
Skew |
Skew Bias |
|---|
2,099 |
1,884 |
0.90 |
5,967 |
3,812 |
0.64 |
4.69 vol pts |
PUT_SKEW |
Tail Risk
Q10 |
Q50 |
Q90 |
Down Tail |
Up Tail |
Down/Up |
|---|
57.61 |
69.97 |
77.00 |
13.92 |
5.47 |
2.54 |
Daily Technicals
EMA20 |
EMA50 |
VWAP20 |
BB Lower |
BB Mid |
BB Upper |
BB Width |
Vol Ratio |
Path |
|---|
63.05 |
60.68 |
62.82 |
52.90 |
62.50 |
72.09 |
30.71% |
0.88 |
UP trend (expanding) |
Day Plan
71.00-72.00 range: fade extremes
> 72.00: chase only if hold + vol
< 71.00: risk expand; reduce size
Regime: TRANSITION
Tech: UP trend (expanding)
Swing Plan
Accumulate: 71.00-71.00
Trim: 72.00-72.00
Add: close > 72.00
Cut: close < 71.00
Best for: transition regime
Raw Text Summary
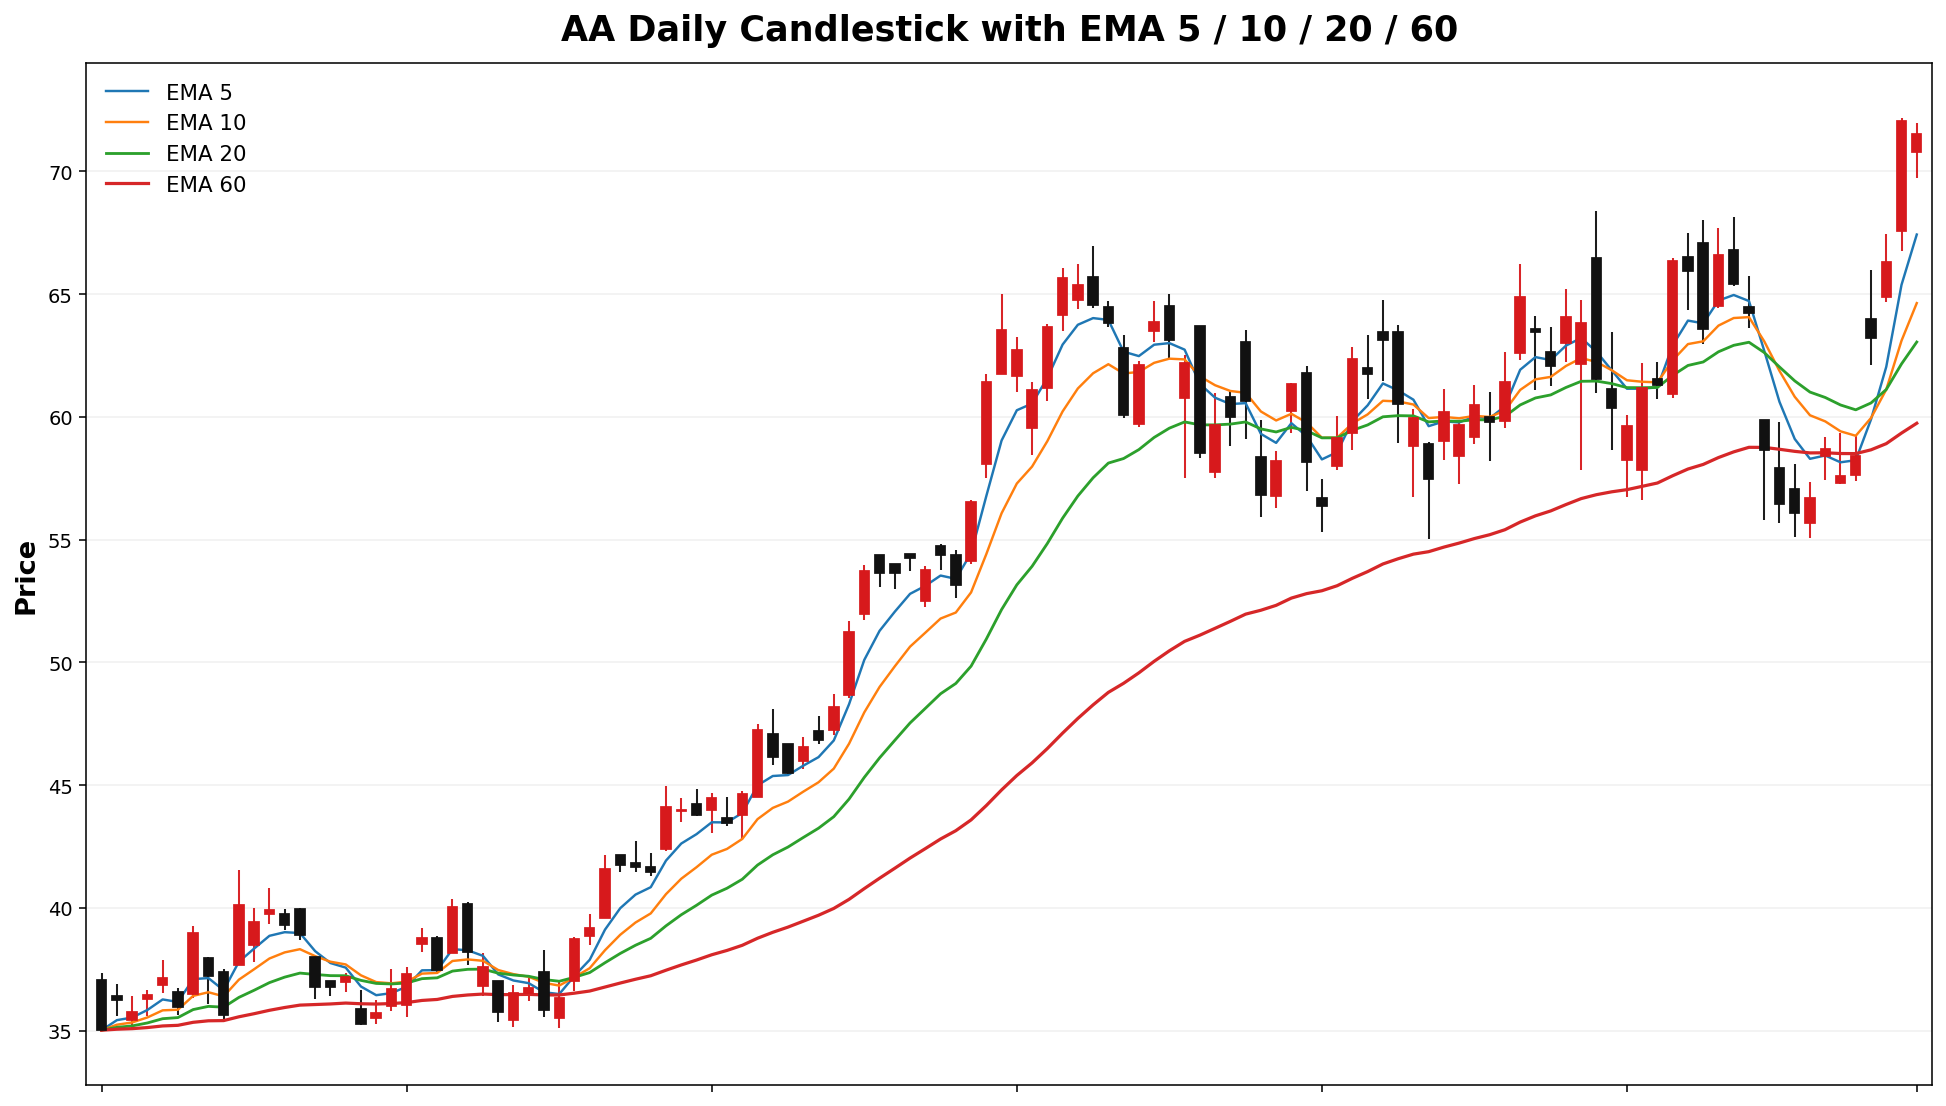
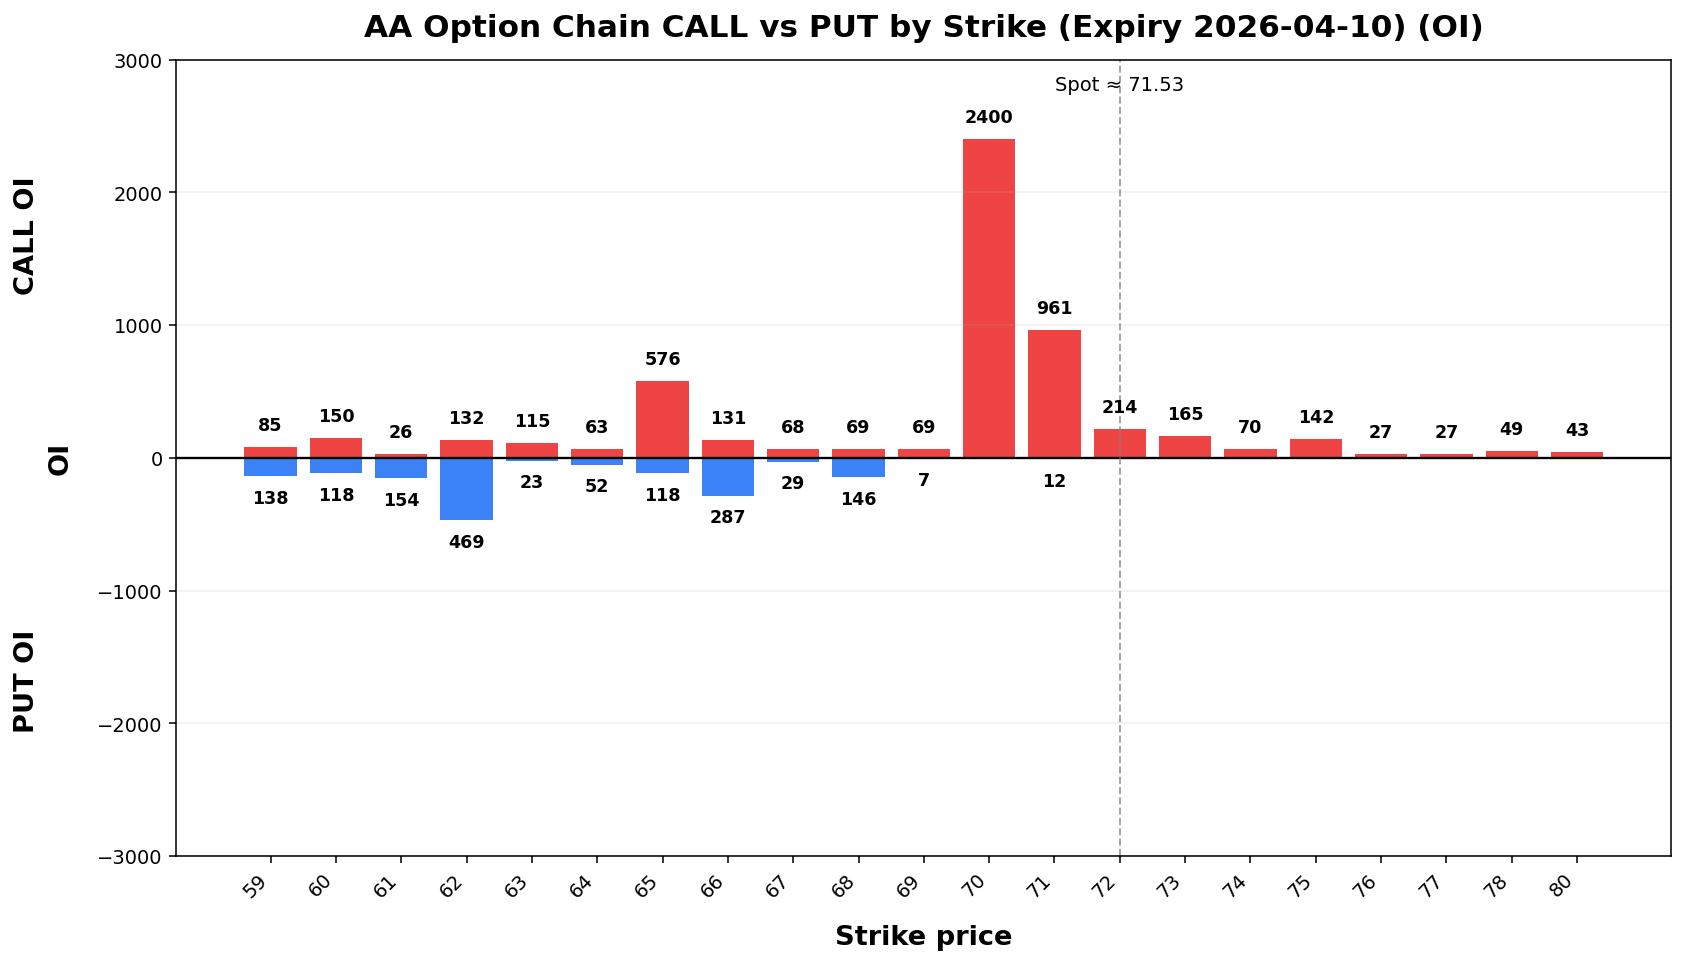
📌 AA @ 71.53 (2026-04-05 06:50 PM MYT)

• Current price is **71.53**. Key support is around **71.00**, and resistance is around **72.00**.
• For the next week, the model’s **68% expected range** is roughly **65.23 to 77.83**.
• A wider **90% range** is about **61.17 to 81.89**.
• Dealer positioning looks **LONG gamma**, so the market behavior is classified as **TRANSITION**.
• The estimated **gamma flip** is near **59.71**. Crossing and holding beyond this area can change the trading behavior.
• Approximate breakout odds: **above resistance 35.3%**, **below support 41.9%** by the target horizon.
• Options skew is tilted toward **puts**, which suggests traders are paying more for downside protection.
• Near-term implied volatility is lower than the next expiry (**IV1 61.16% vs IV2 64.16%**), which suggests a **contango / calmer front expiry** setup.
• On the daily chart, the stock currently looks like **UP trend (expanding)**.
• The implied distribution shows **heavier downside tail risk** than upside tail potential.
AAOI
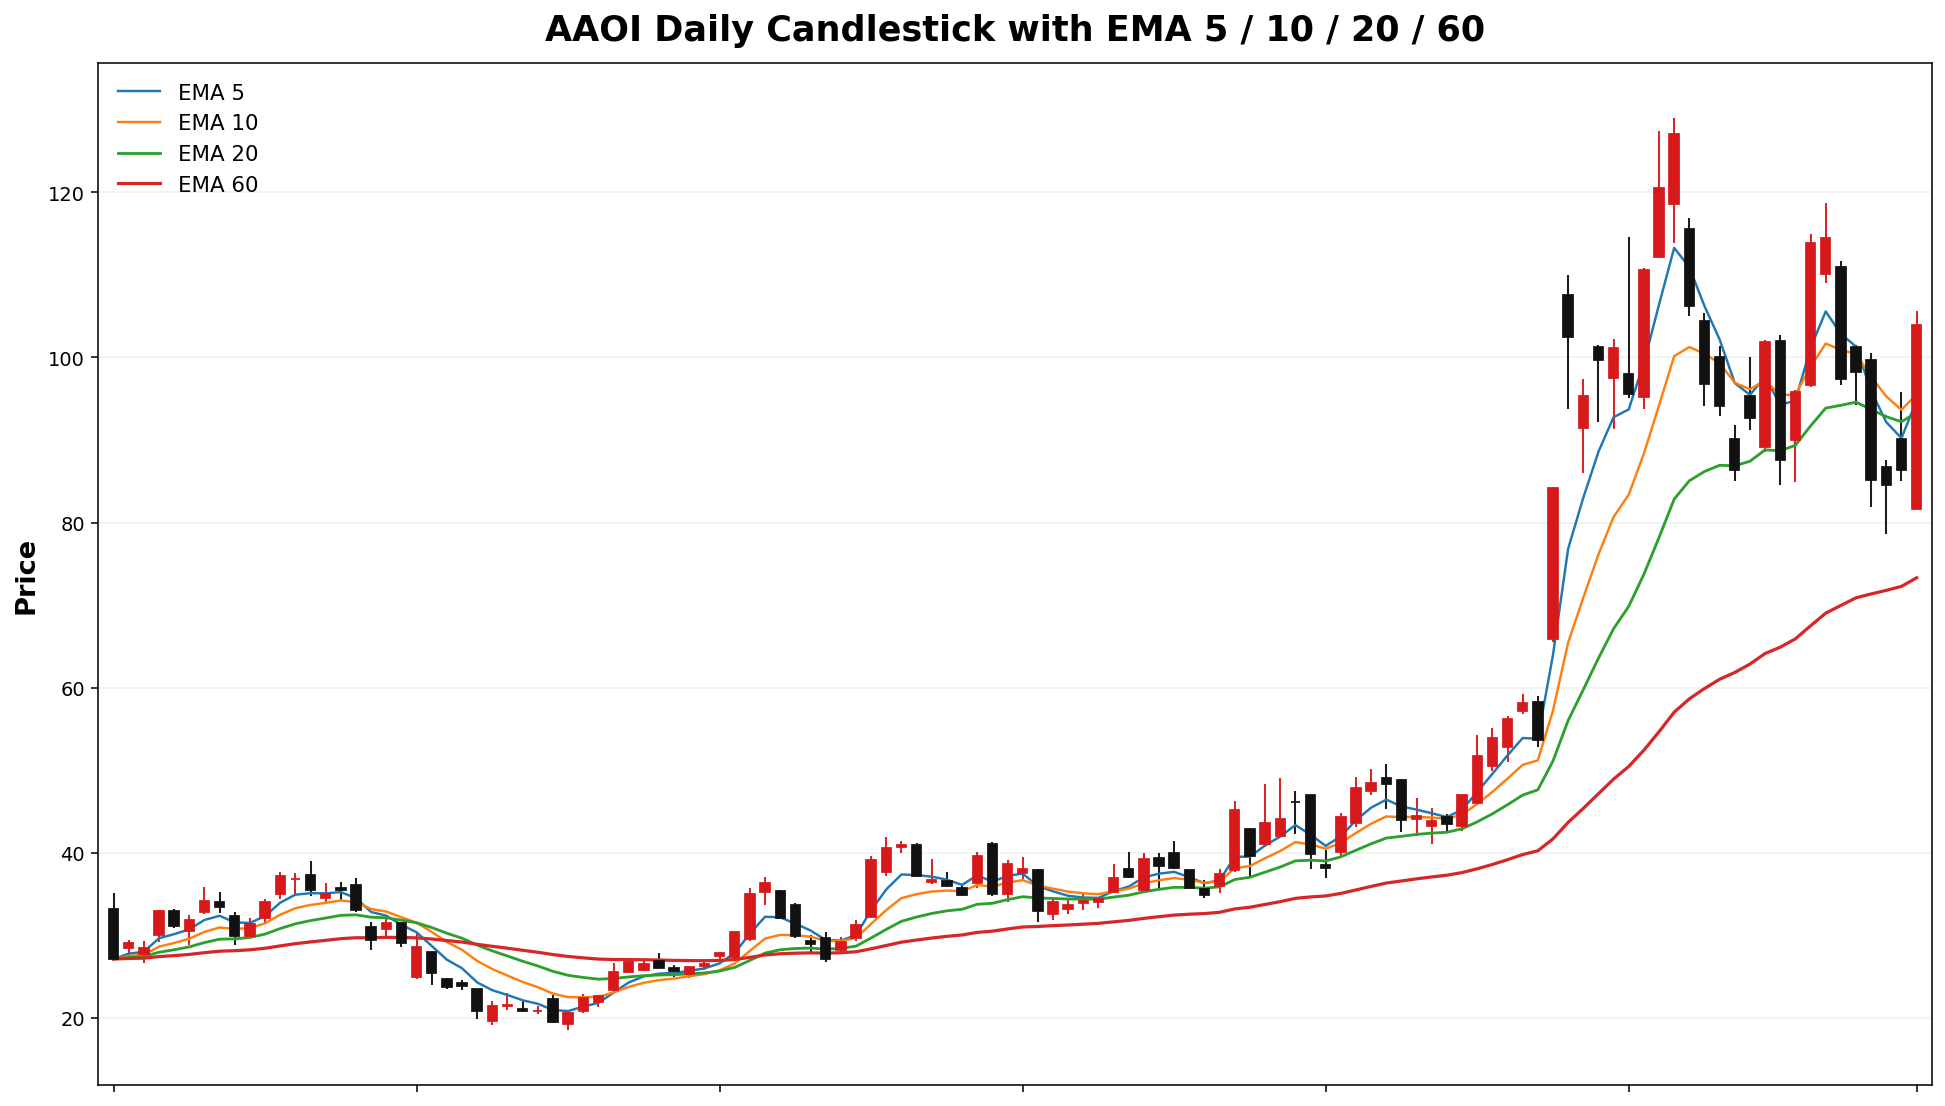
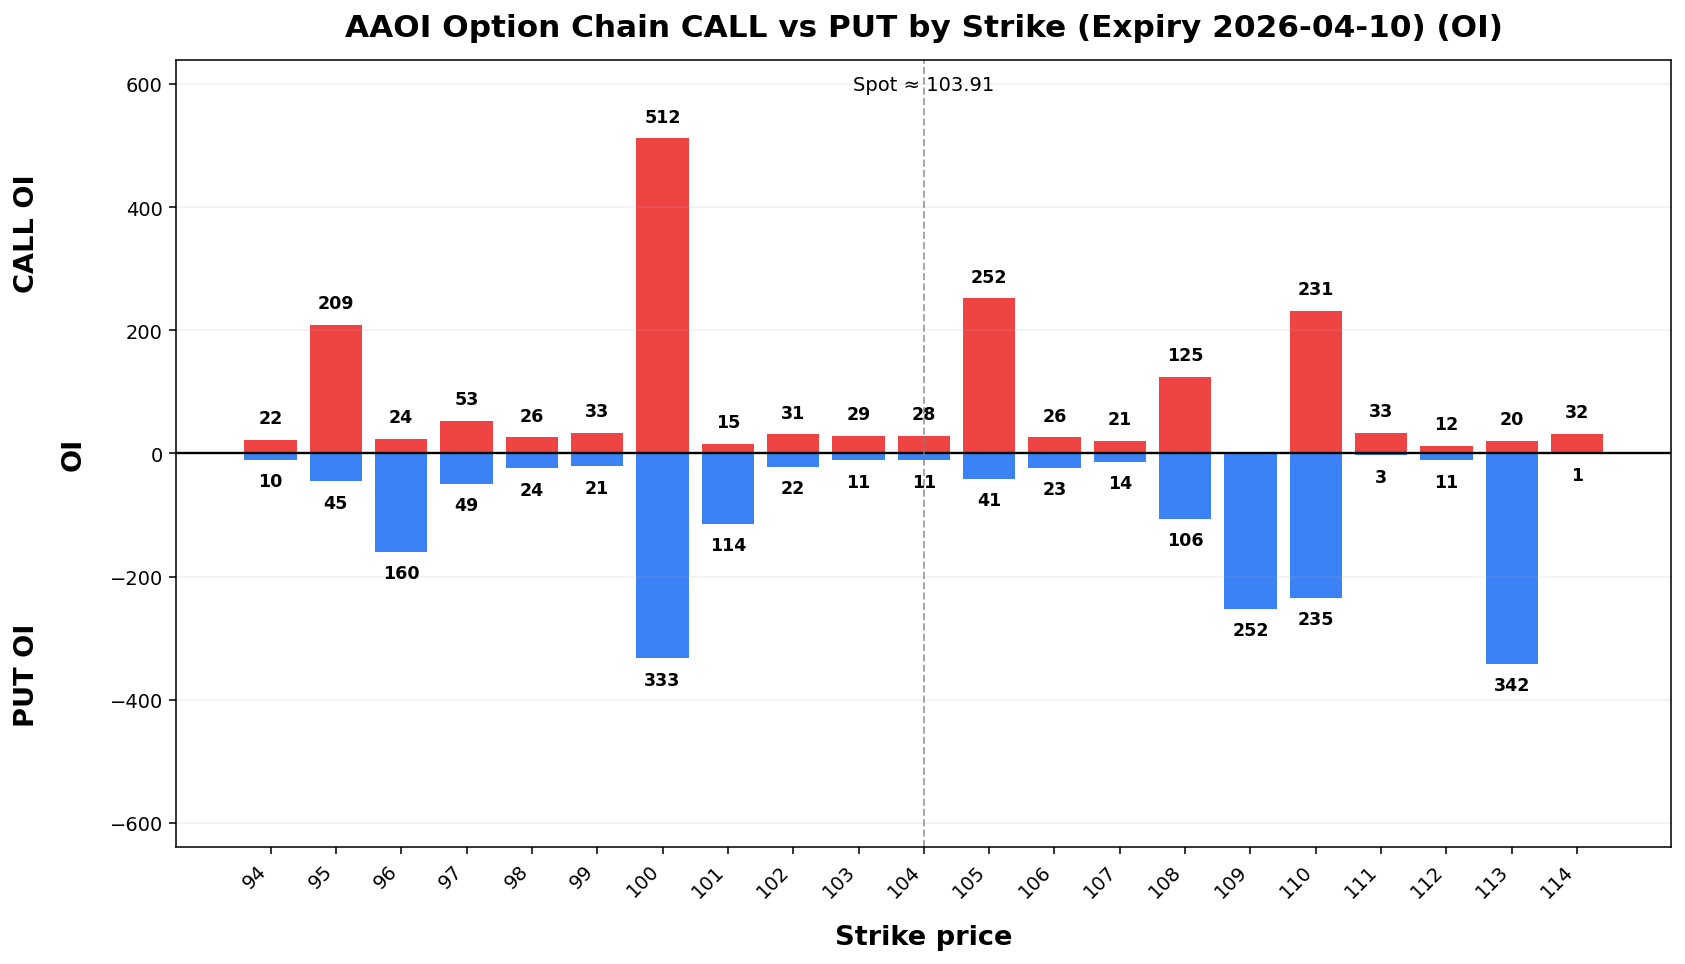
Spot: 103.91
Report Time: 2026-04-05 06:50 PM MYT
Regime: PIN
Dealer Gamma: LONG
Term Structure
Expiry |
DTE |
Forward |
ATM IV |
ATM Straddle |
|---|
2026-04-10 |
6 |
103.70 |
126.85% |
16.00 |
2026-04-17 |
13 |
103.87 |
114.73% |
21.95 |
Weekly Range
Confidence |
Low |
High |
Width |
|---|
68% |
86.13 |
121.69 |
35.56 |
80% |
81.12 |
126.70 |
45.57 |
90% |
74.66 |
133.16 |
58.49 |
95% |
69.06 |
138.76 |
69.70 |
Structure & Probabilities
Support |
Resistance |
Gamma Flip |
Max Pain |
P>Res |
P<Sup |
|---|
100.00 |
105.00 |
105.89 |
97.00 |
43.7% |
45.4% |
Flow & Skew
Call Vol |
Put Vol |
Vol P/C |
Call OI |
Put OI |
OI P/C |
Skew |
Skew Bias |
|---|
9,063 |
8,565 |
0.95 |
5,349 |
8,319 |
1.56 |
20.31 vol pts |
PUT_SKEW |
Tail Risk
Q10 |
Q50 |
Q90 |
Down Tail |
Up Tail |
Down/Up |
|---|
55.36 |
97.36 |
127.76 |
48.55 |
23.85 |
2.04 |
Daily Technicals
EMA20 |
EMA50 |
VWAP20 |
BB Lower |
BB Mid |
BB Upper |
BB Width |
Vol Ratio |
Path |
|---|
93.32 |
77.60 |
99.76 |
75.44 |
99.95 |
124.45 |
49.04% |
1.51 |
UP trend (expanding) |
Day Plan
100.00-105.00 range: fade extremes
> 105.00: chase only if hold + vol
< 100.00: risk expand; reduce size
Regime: PIN
Tech: UP trend (expanding)
Swing Plan
Accumulate: 100.00-100.00
Trim: 105.00-105.00
Add: close > 105.00
Cut: close < 100.00
Best for: pin regime
Raw Text Summary
📌 AAOI @ 103.91 (2026-04-05 06:50 PM MYT)

• Current price is **103.91**. Key support is around **100.00**, and resistance is around **105.00**.
• For the next week, the model’s **68% expected range** is roughly **86.13 to 121.69**.
• A wider **90% range** is about **74.66 to 133.16**.
• Dealer positioning looks **LONG gamma**, so the market behavior is classified as **PIN**.
• The estimated **gamma flip** is near **105.89**. Crossing and holding beyond this area can change the trading behavior.
• Approximate breakout odds: **above resistance 43.7%**, **below support 45.4%** by the target horizon.
• Options skew is tilted toward **puts**, which suggests traders are paying more for downside protection.
• Near-term implied volatility is higher than the next expiry (**IV1 126.85% vs IV2 114.73%**), which suggests **near-term event stress / backwardation**.
• Recent volume is **1.51x** the 20-day average, which supports stronger continuation or breakout follow-through.
• On the daily chart, the stock currently looks like **UP trend (expanding)**.
• The implied distribution shows **heavier downside tail risk** than upside tail potential.
CRWV
Spot: 82.24
Report Time: 2026-04-05 06:50 PM MYT
Regime: TRANSITION
Dealer Gamma: LONG
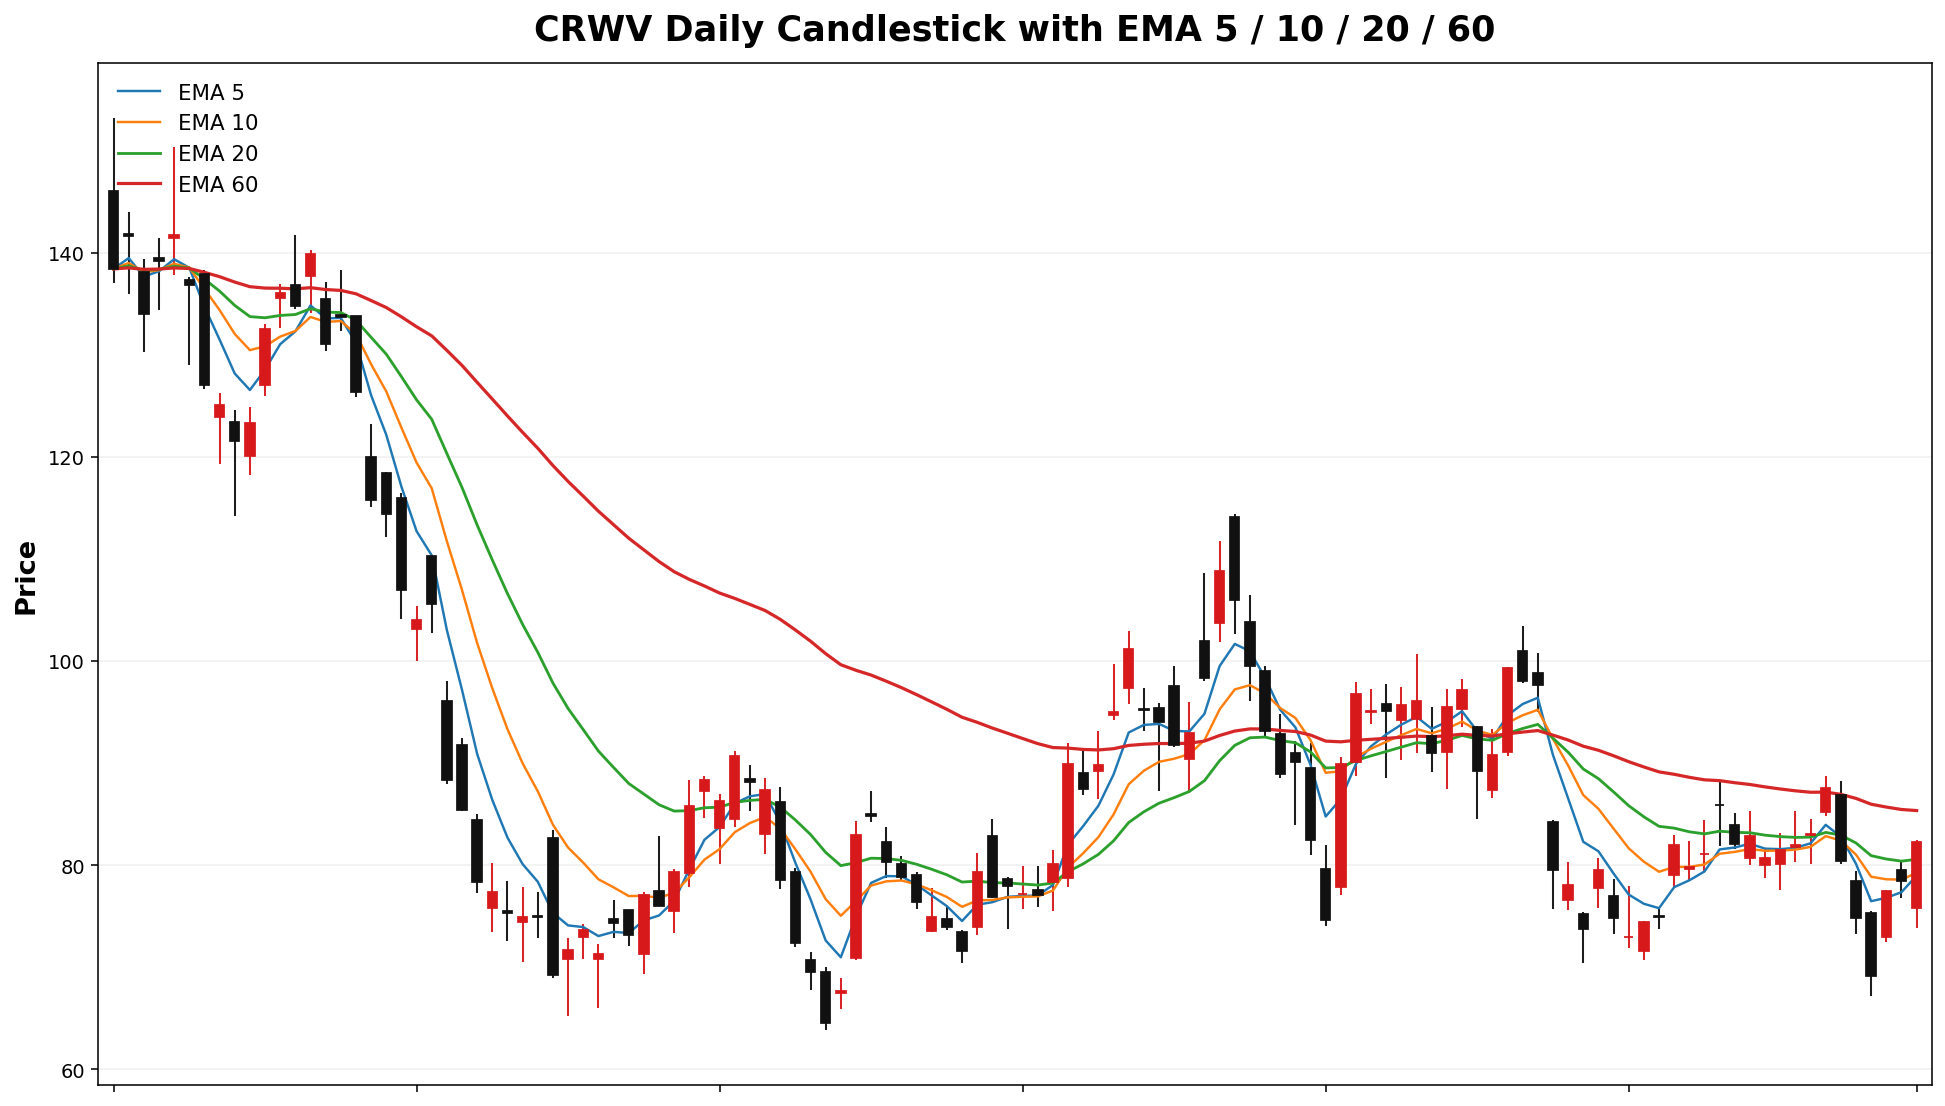
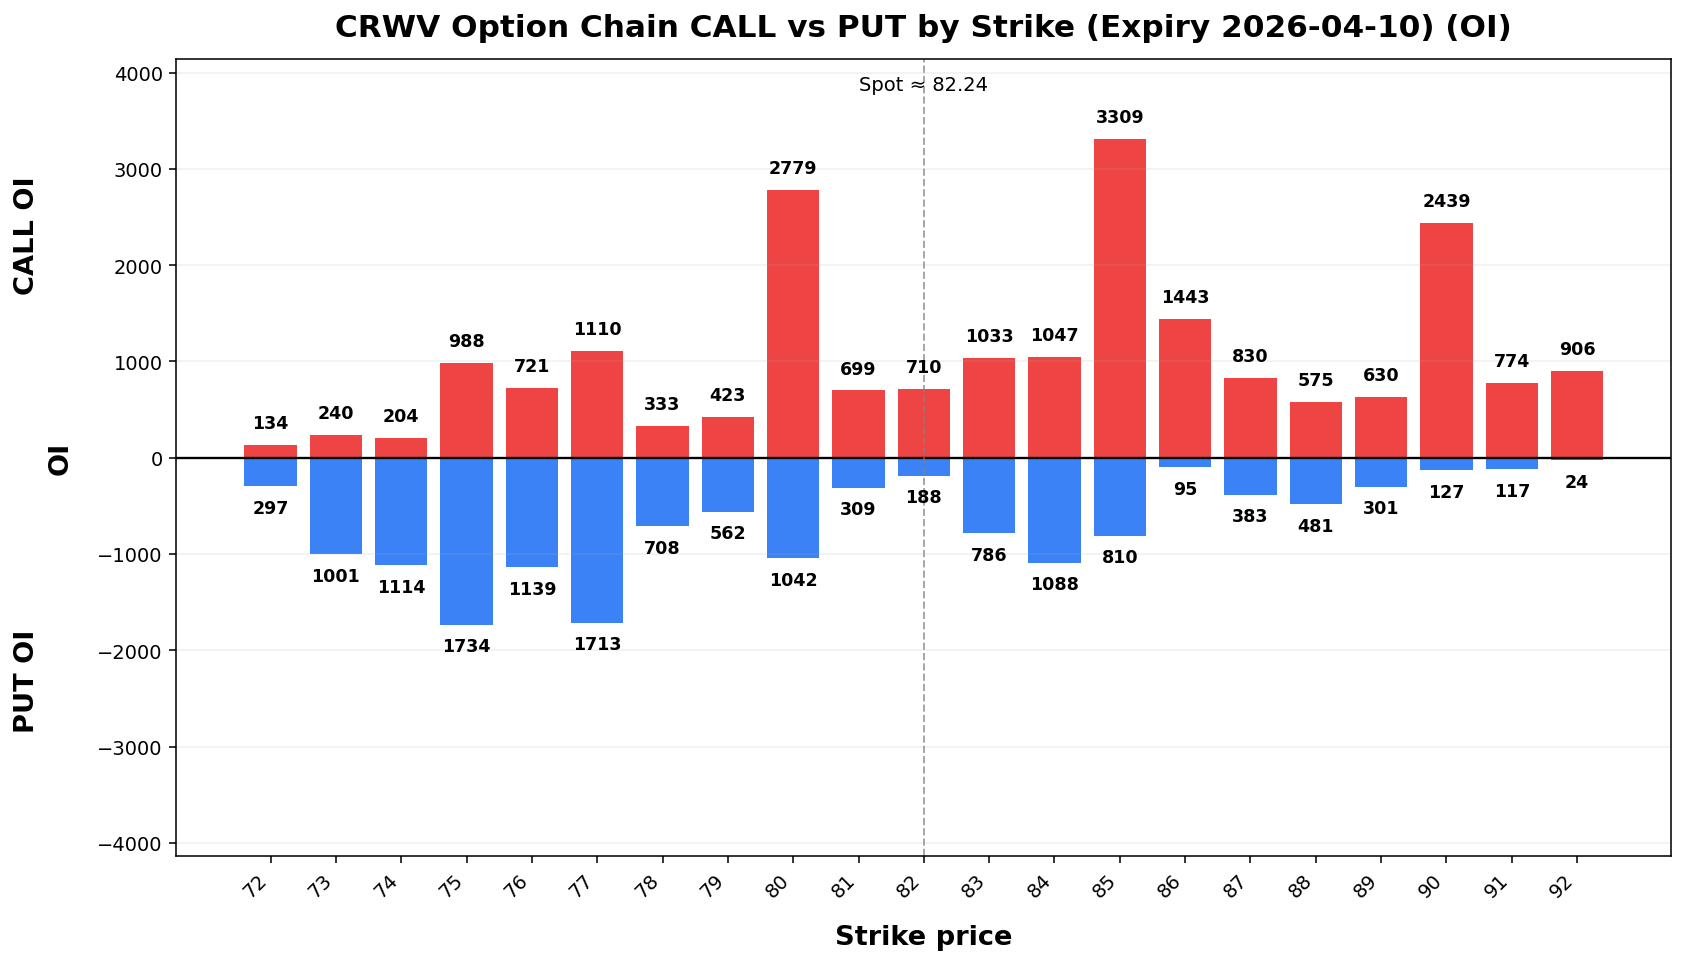
Term Structure
Expiry |
DTE |
Forward |
ATM IV |
ATM Straddle |
|---|
2026-04-10 |
6 |
82.21 |
77.13% |
7.70 |
2026-04-17 |
13 |
82.23 |
72.65% |
11.00 |
Weekly Range
Confidence |
Low |
High |
Width |
|---|
68% |
73.54 |
90.94 |
17.41 |
80% |
71.09 |
93.39 |
22.31 |
90% |
67.93 |
96.55 |
28.63 |
95% |
65.18 |
99.30 |
34.11 |
Structure & Probabilities
Support |
Resistance |
Gamma Flip |
Max Pain |
P>Res |
P<Sup |
|---|
80.00 |
85.00 |
79.69 |
80.00 |
30.8% |
39.1% |
Flow & Skew
Call Vol |
Put Vol |
Vol P/C |
Call OI |
Put OI |
OI P/C |
Skew |
Skew Bias |
|---|
23,965 |
40,515 |
1.69 |
31,413 |
46,333 |
1.47 |
11.33 vol pts |
PUT_SKEW |
Tail Risk
Q10 |
Q50 |
Q90 |
Down Tail |
Up Tail |
Down/Up |
|---|
64.13 |
82.09 |
93.53 |
18.11 |
11.29 |
1.61 |
Daily Technicals
EMA20 |
EMA50 |
VWAP20 |
BB Lower |
BB Mid |
BB Upper |
BB Width |
Vol Ratio |
Path |
|---|
80.57 |
84.00 |
79.39 |
70.63 |
79.67 |
88.70 |
22.68% |
0.94 |
DOWN trend (expanding) |
Day Plan
80.00-85.00 range: fade extremes
> 85.00: chase only if hold + vol
< 80.00: risk expand; reduce size
Regime: TRANSITION
Tech: DOWN trend (expanding)
Swing Plan
Accumulate: 80.00-80.00
Trim: 85.00-85.00
Add: close > 85.00
Cut: close < 80.00
Best for: transition regime
Raw Text Summary
📌 CRWV @ 82.24 (2026-04-05 06:50 PM MYT)

• Current price is **82.24**. Key support is around **80.00**, and resistance is around **85.00**.
• For the next week, the model’s **68% expected range** is roughly **73.54 to 90.94**.
• A wider **90% range** is about **67.93 to 96.55**.
• Dealer positioning looks **LONG gamma**, so the market behavior is classified as **TRANSITION**.
• The estimated **gamma flip** is near **79.69**. Crossing and holding beyond this area can change the trading behavior.
• Approximate breakout odds: **above resistance 30.8%**, **below support 39.1%** by the target horizon.
• Options skew is tilted toward **puts**, which suggests traders are paying more for downside protection.
• Near-term implied volatility is higher than the next expiry (**IV1 77.13% vs IV2 72.65%**), which suggests **near-term event stress / backwardation**.
• On the daily chart, the stock currently looks like **DOWN trend (expanding)**.
• The implied distribution shows **heavier downside tail risk** than upside tail potential.
DOCN
Spot: 90.01
Report Time: 2026-04-05 06:50 PM MYT
Regime: TRANSITION
Dealer Gamma: LONG
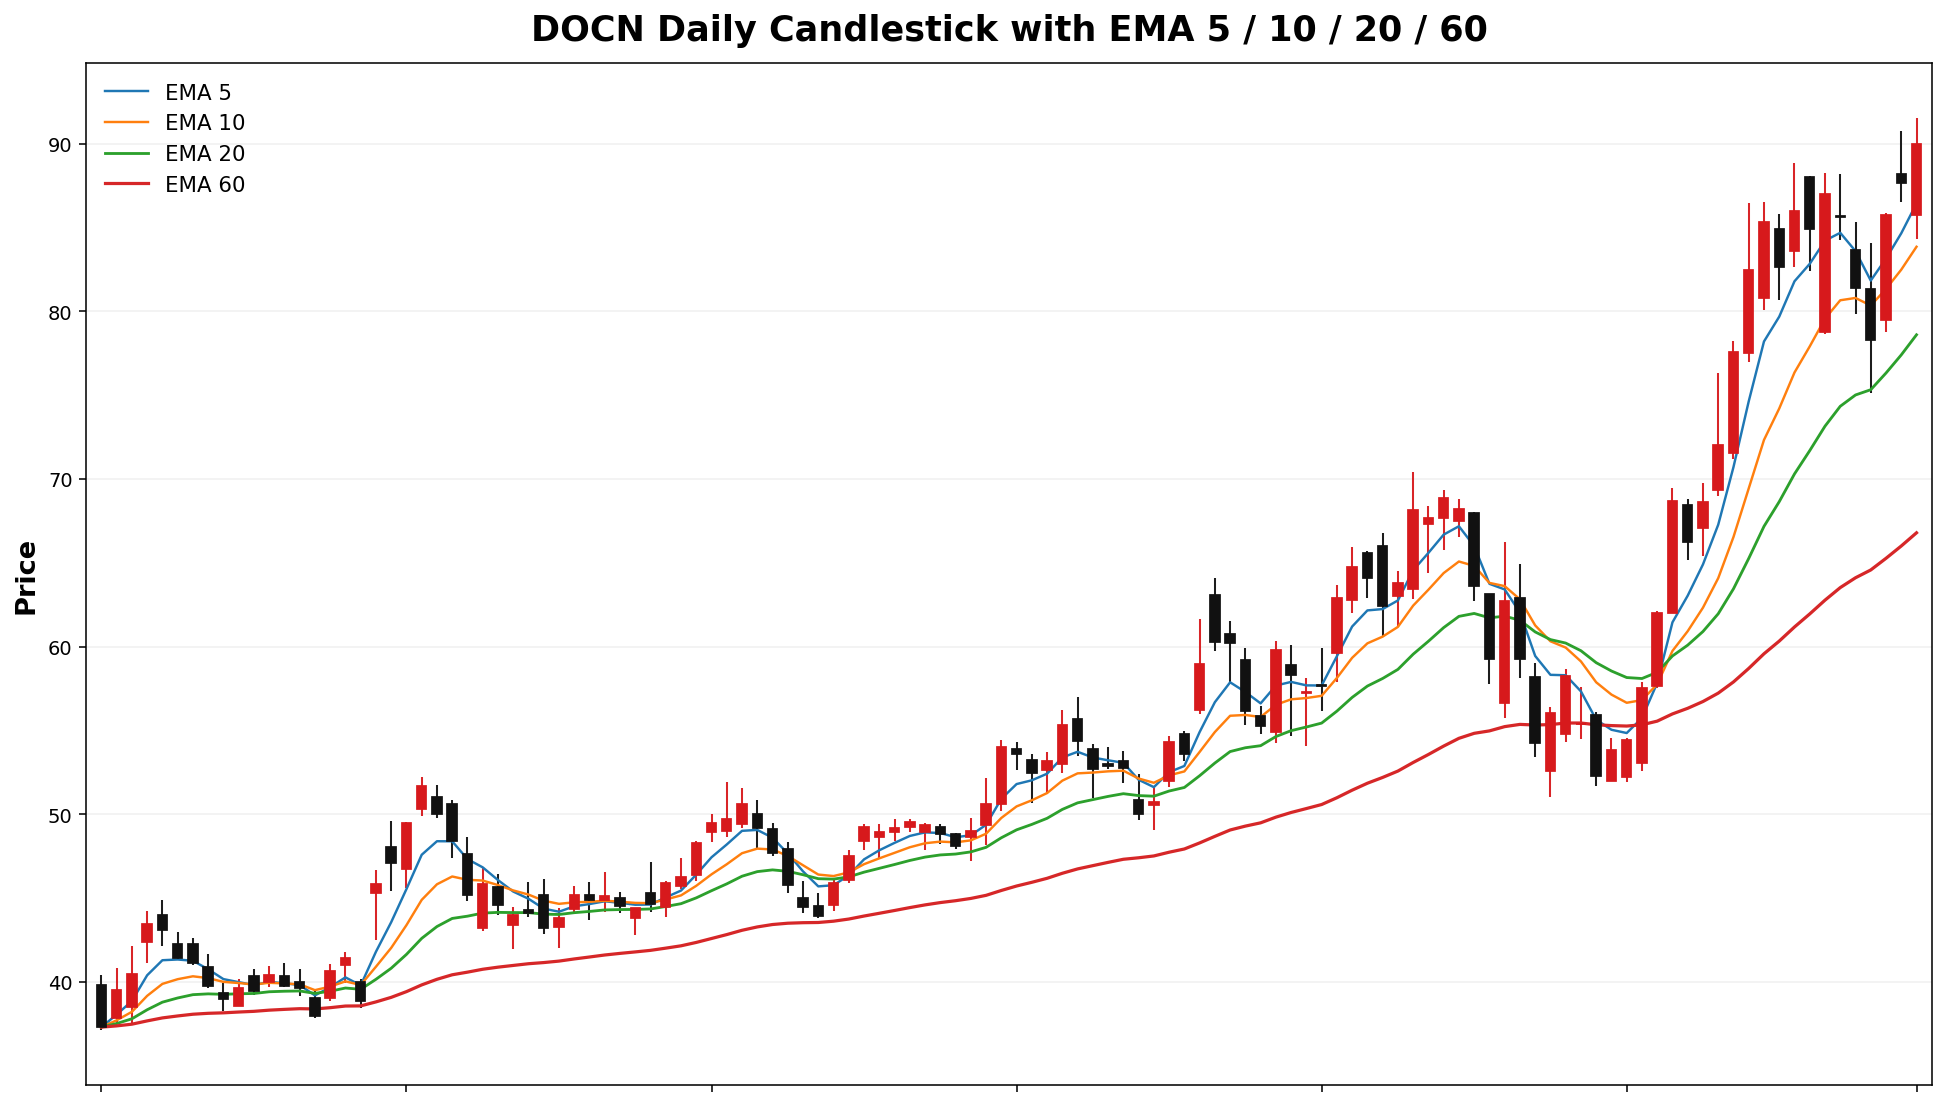
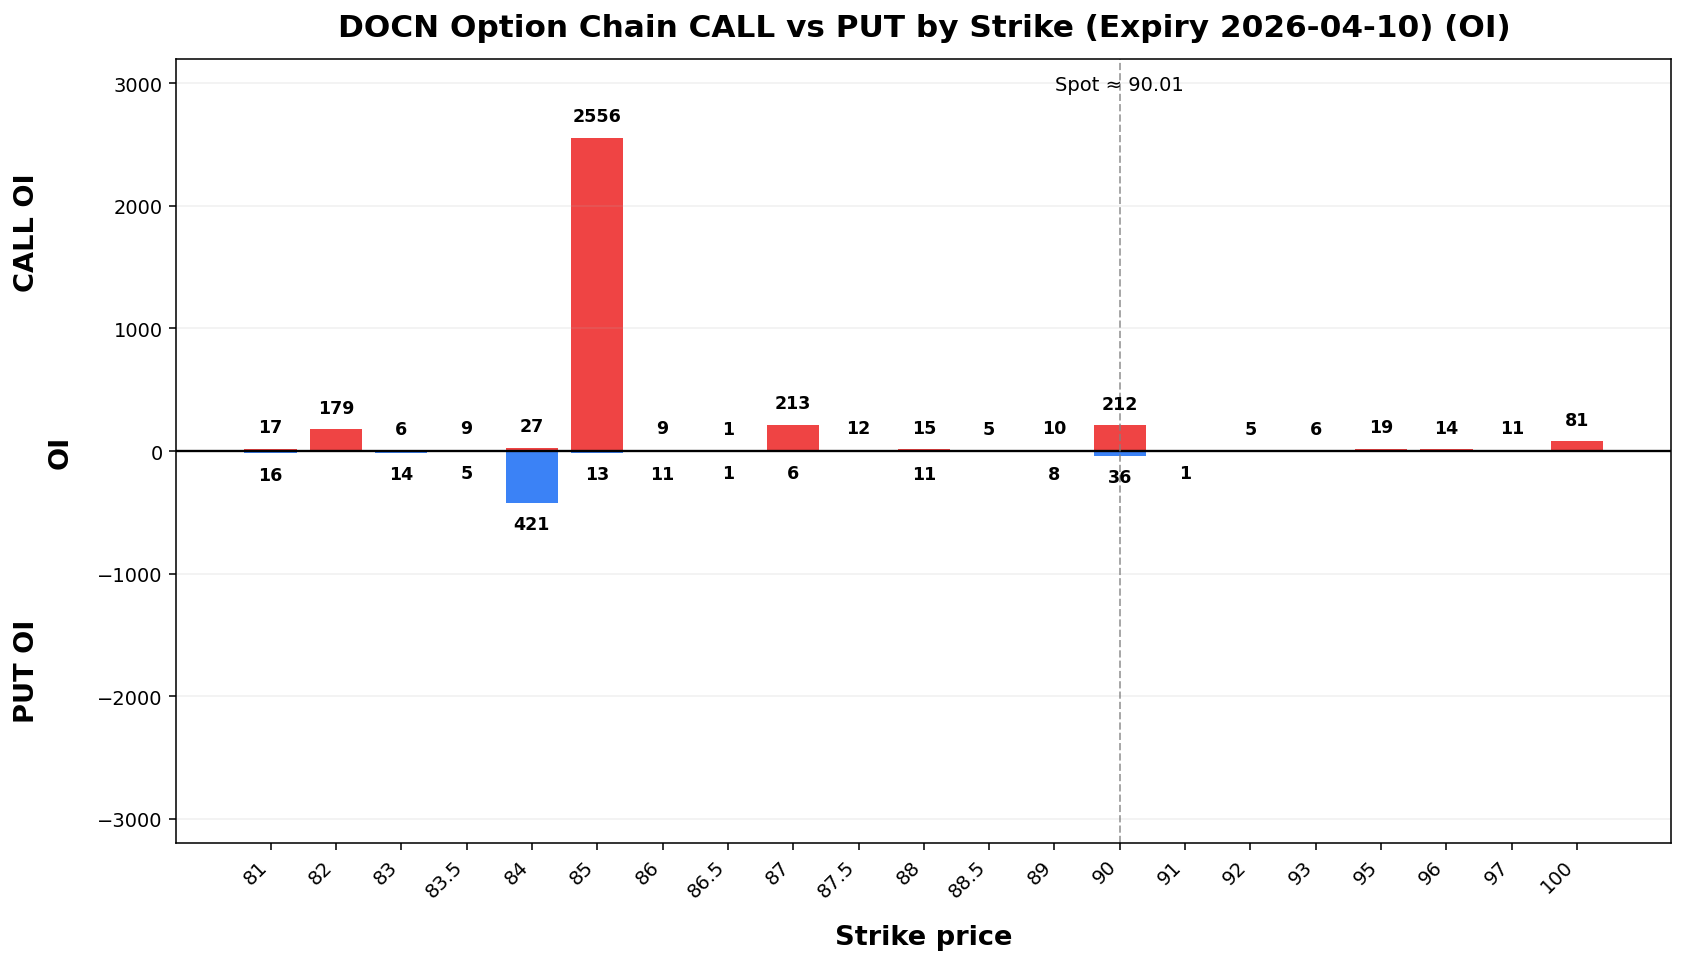
Term Structure
Expiry |
DTE |
Forward |
ATM IV |
ATM Straddle |
|---|
2026-04-10 |
6 |
89.63 |
78.71% |
8.60 |
2026-04-17 |
13 |
89.63 |
71.81% |
11.90 |
Weekly Range
Confidence |
Low |
High |
Width |
|---|
68% |
80.42 |
99.60 |
19.18 |
80% |
77.72 |
102.30 |
24.58 |
90% |
74.23 |
105.79 |
31.55 |
95% |
71.21 |
108.81 |
37.60 |
Structure & Probabilities
Support |
Resistance |
Gamma Flip |
Max Pain |
P>Res |
P<Sup |
|---|
90.00 |
99.60 |
66.90 |
75.00 |
12.1% |
45.6% |
Flow & Skew
Call Vol |
Put Vol |
Vol P/C |
Call OI |
Put OI |
OI P/C |
Skew |
Skew Bias |
|---|
3,371 |
1,048 |
0.31 |
6,200 |
3,168 |
0.51 |
14.75 vol pts |
PUT_SKEW |
Tail Risk
Q10 |
Q50 |
Q90 |
Down Tail |
Up Tail |
Down/Up |
|---|
72.49 |
88.17 |
101.41 |
17.52 |
11.40 |
1.54 |
Daily Technicals
EMA20 |
EMA50 |
VWAP20 |
BB Lower |
BB Mid |
BB Upper |
BB Width |
Vol Ratio |
Path |
|---|
78.61 |
68.91 |
78.84 |
55.58 |
77.22 |
98.86 |
56.04% |
0.76 |
UP trend (expanding) |
Day Plan
90.00-99.60 range: fade extremes
> 99.60: chase only if hold + vol
< 90.00: risk expand; reduce size
Regime: TRANSITION
Tech: UP trend (expanding)
Swing Plan
Accumulate: 90.00-90.00
Trim: 99.60-99.60
Add: close > 99.60
Cut: close < 90.00
Best for: transition regime
Raw Text Summary
📌 DOCN @ 90.01 (2026-04-05 06:50 PM MYT)

• Current price is **90.01**. Key support is around **90.00**, and resistance is around **99.60**.
• For the next week, the model’s **68% expected range** is roughly **80.42 to 99.60**.
• A wider **90% range** is about **74.23 to 105.79**.
• Dealer positioning looks **LONG gamma**, so the market behavior is classified as **TRANSITION**.
• The estimated **gamma flip** is near **66.90**. Crossing and holding beyond this area can change the trading behavior.
• Approximate breakout odds: **above resistance 12.1%**, **below support 45.6%** by the target horizon.
• Options skew is tilted toward **puts**, which suggests traders are paying more for downside protection.
• Near-term implied volatility is higher than the next expiry (**IV1 78.71% vs IV2 71.81%**), which suggests **near-term event stress / backwardation**.
• Recent volume is only **0.76x*71x** the 20-day average, so breakouts may be less reliable unless volume improves.
• On the daily chart, the stock currently looks like **UP trend (expanding)**.
• The implied distribution shows **heavier downside tail risk** than upside tail potential.
UVXYPL
Spot: 50.5334.67
Report Time: 2026-04-0512 06:5008:48 PMAM MYT
Regime: TRANSITION
Dealer Gamma: LONG
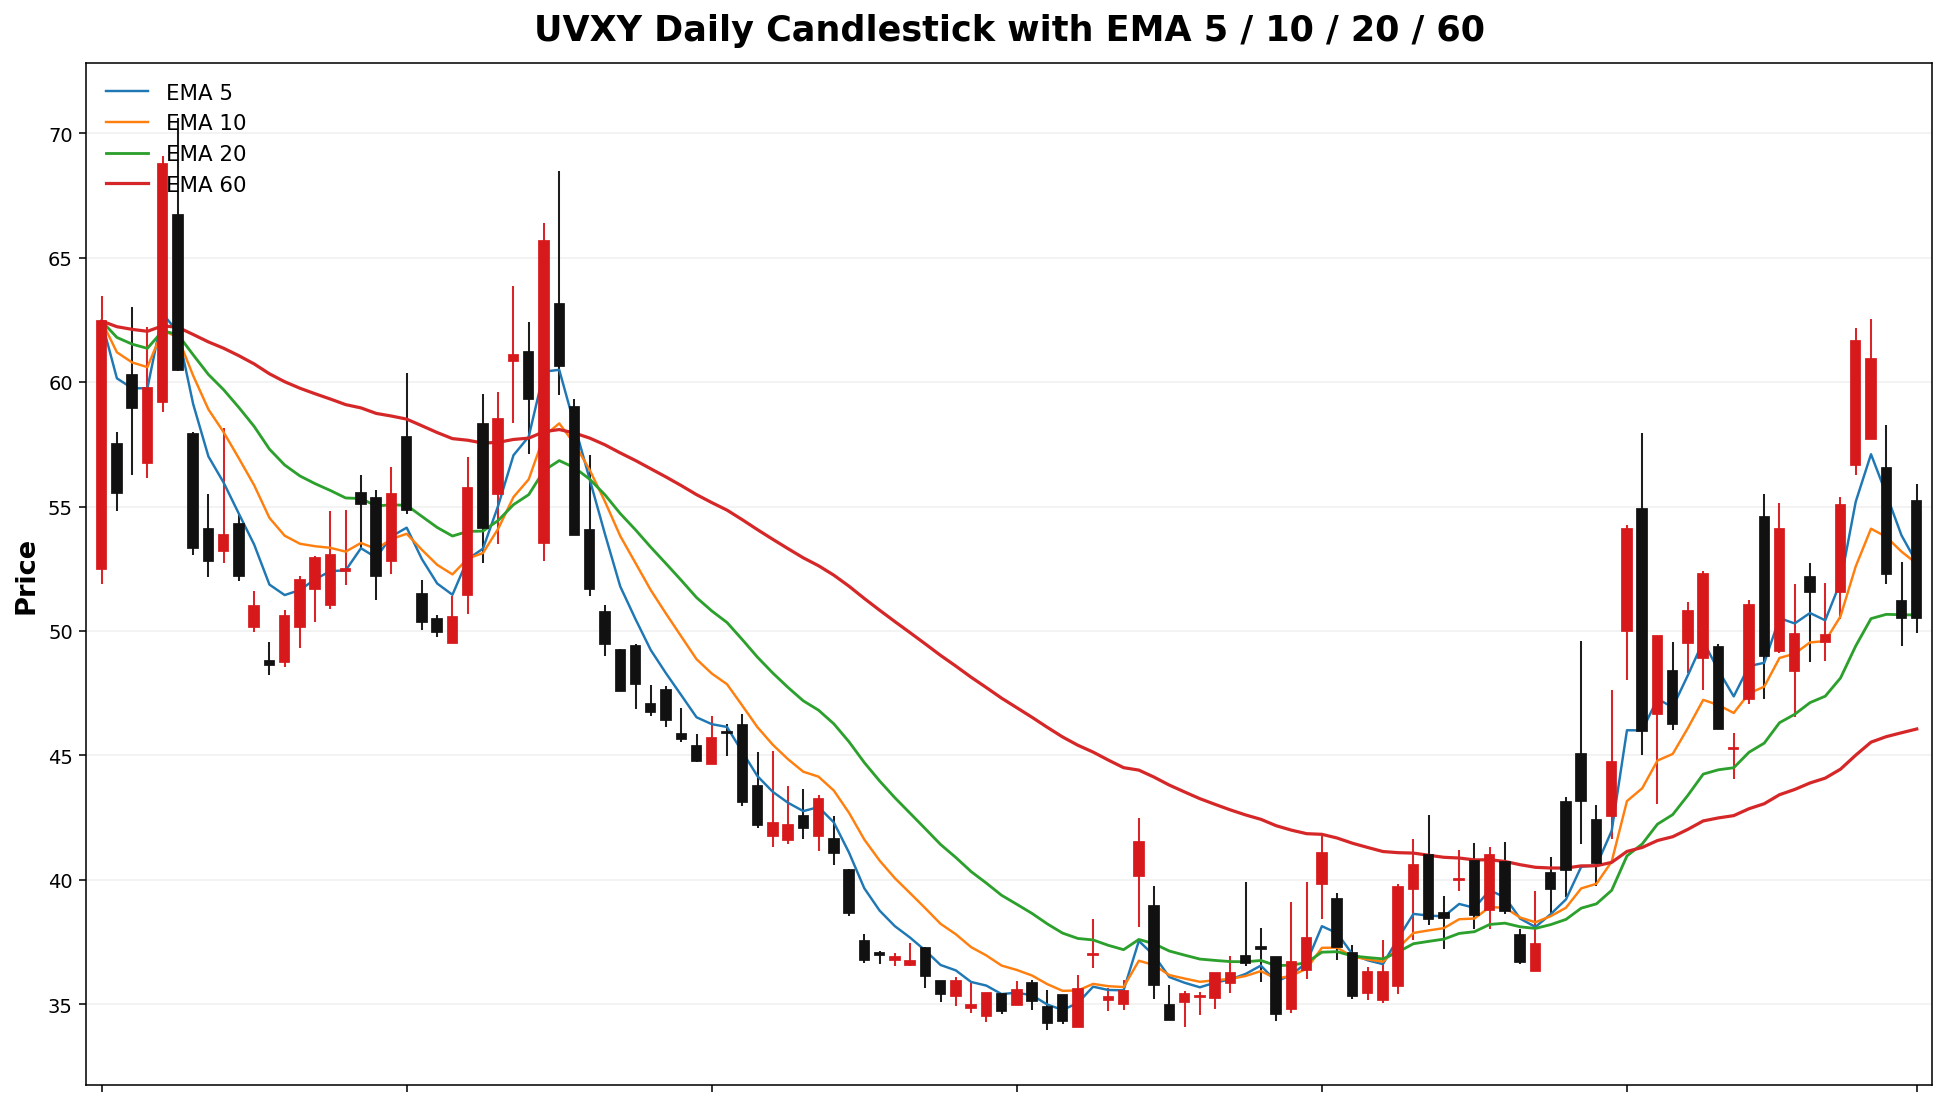
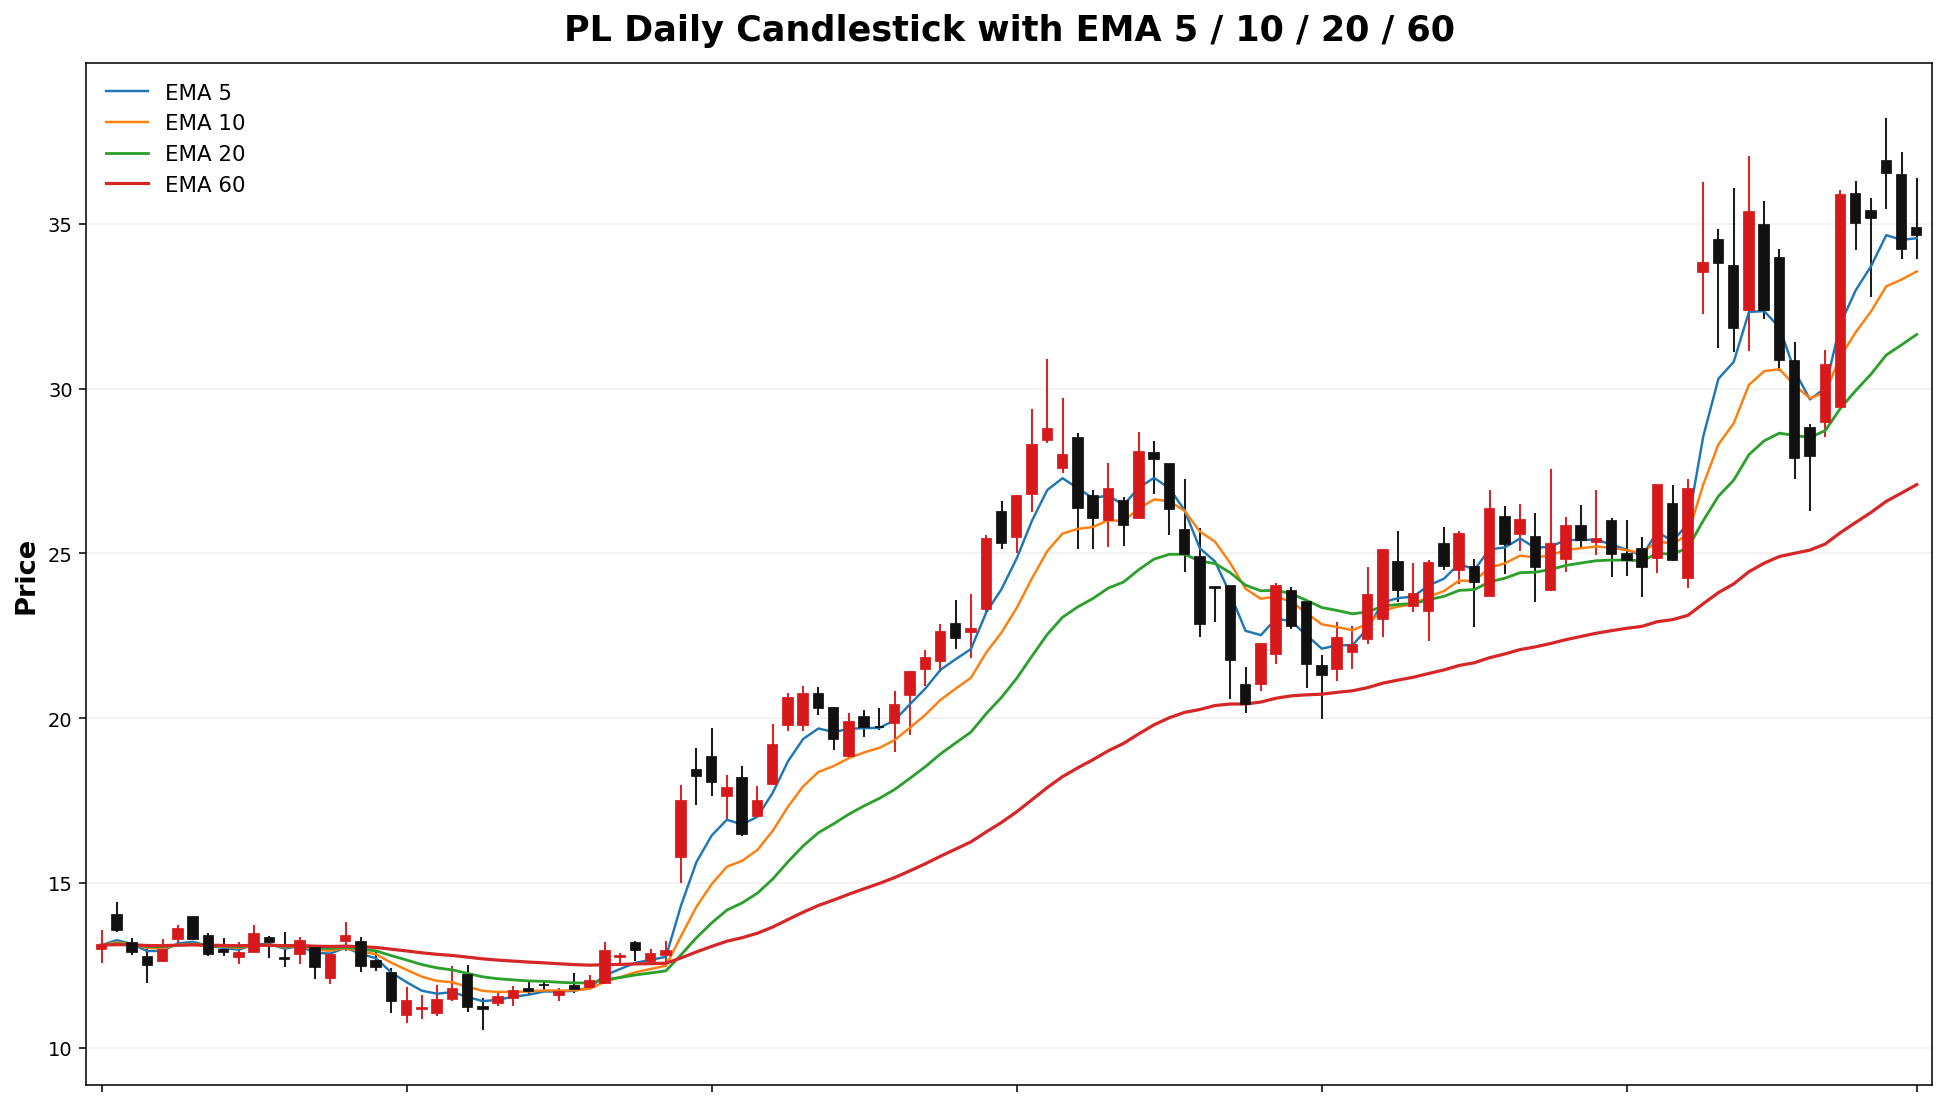
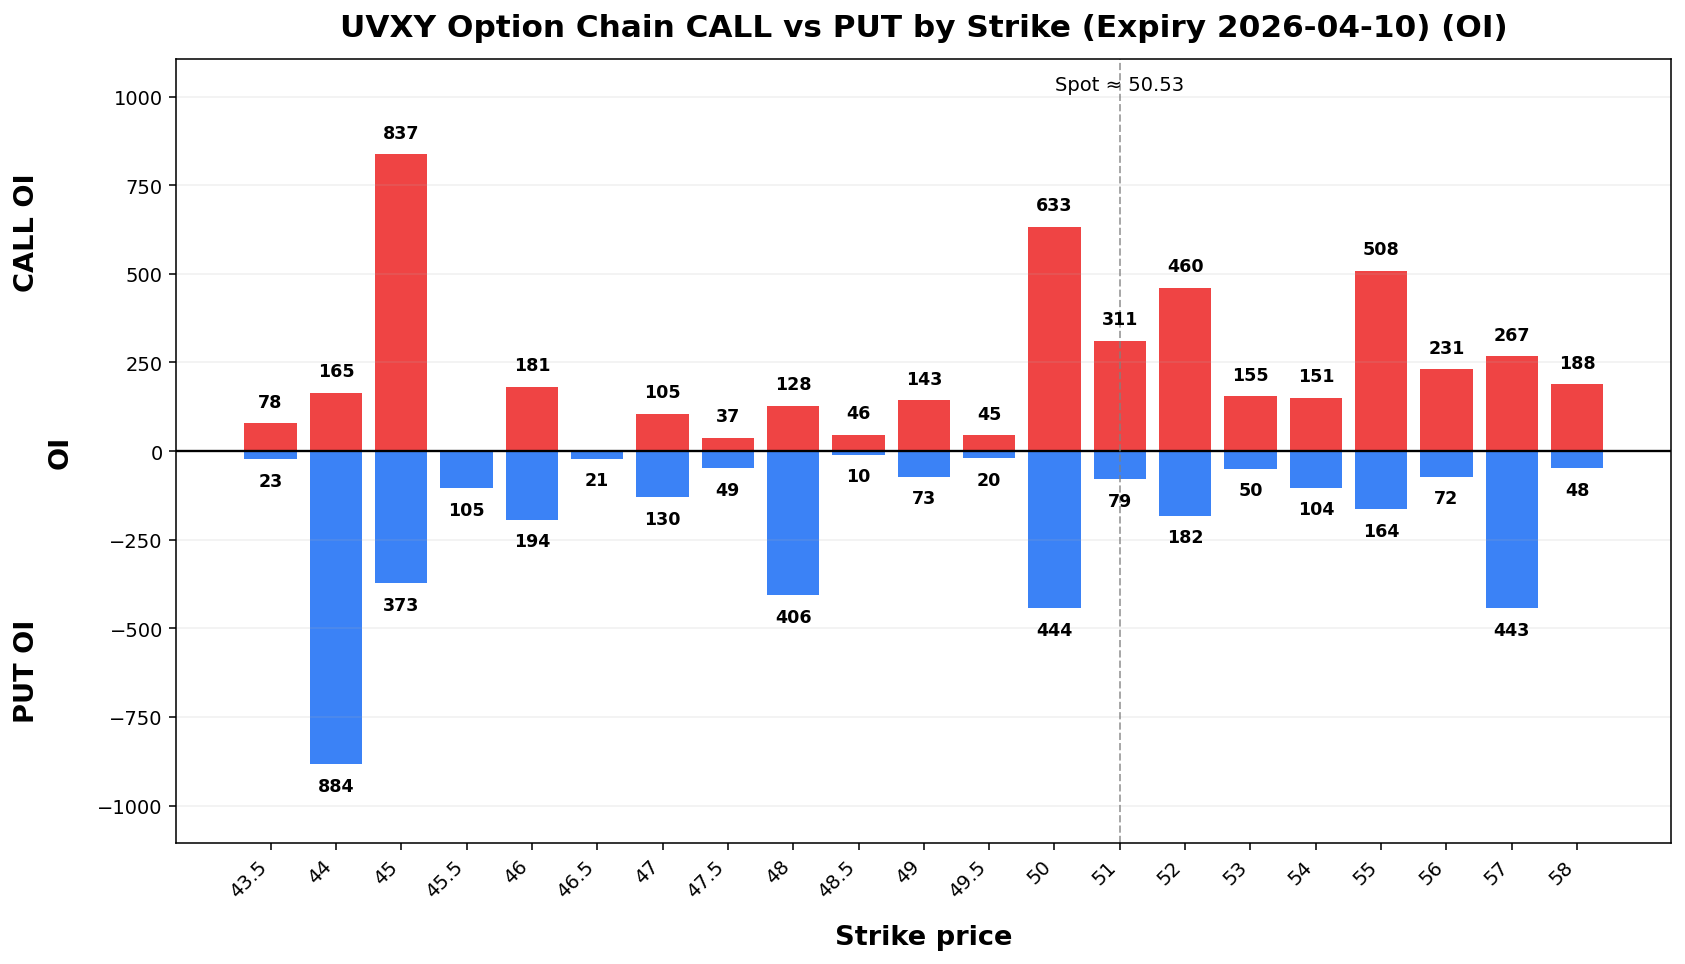
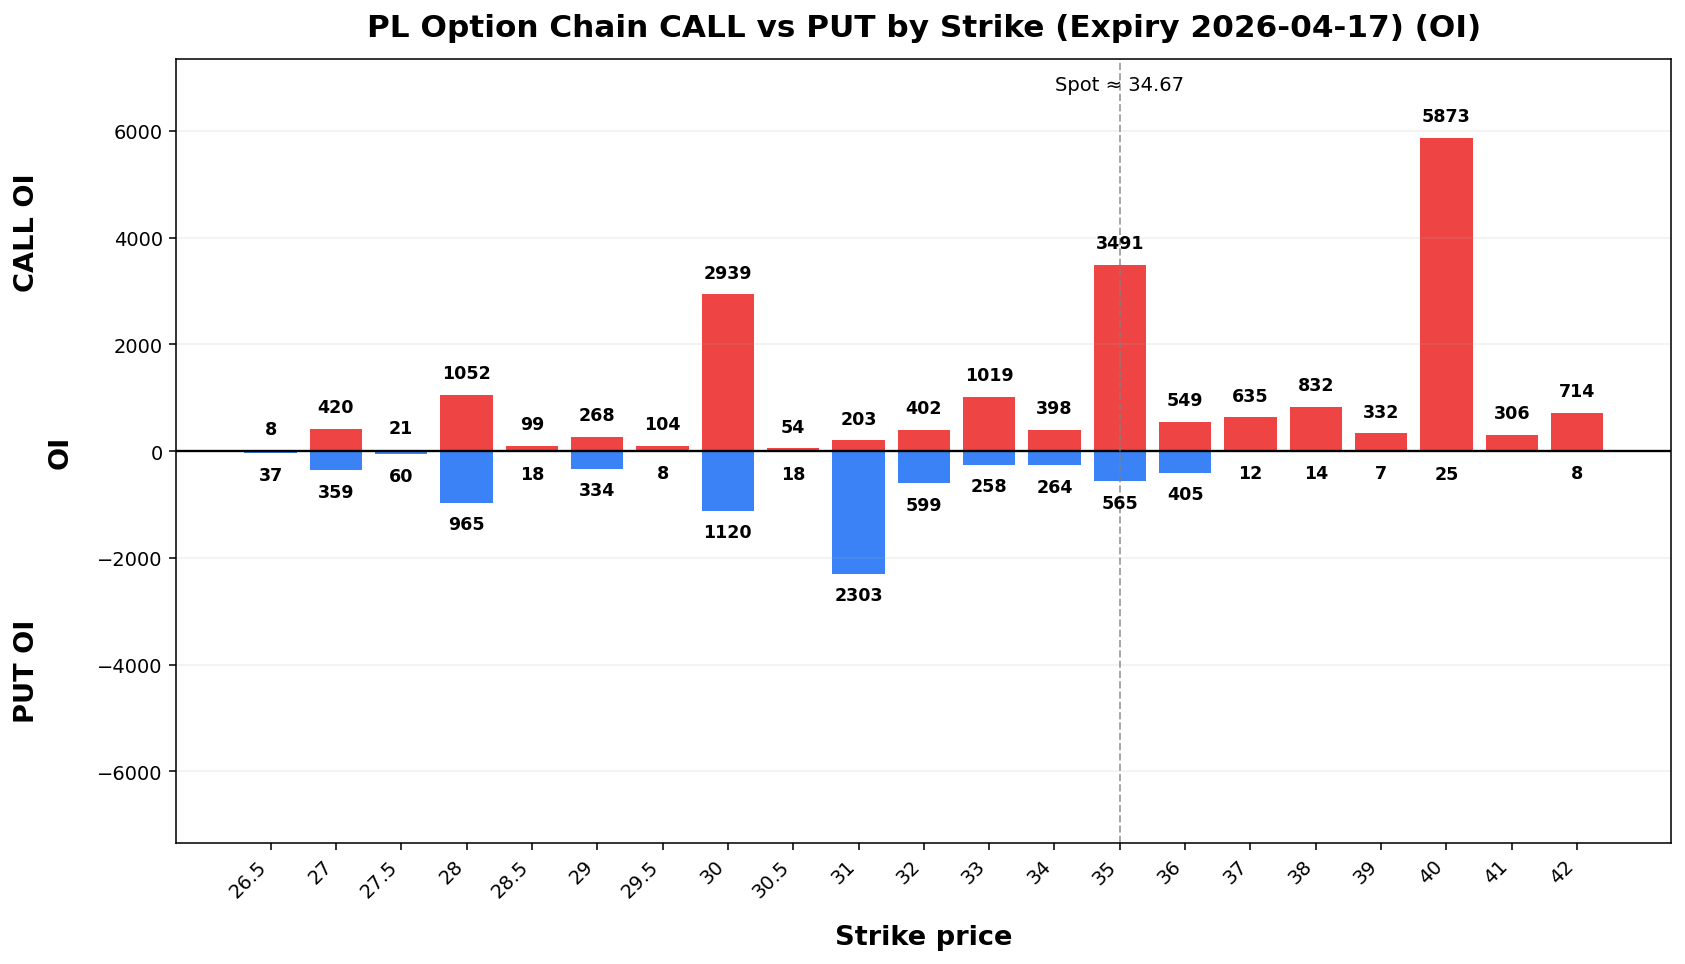
Term Structure
| Expiry |
DTE |
Forward |
ATM IV |
ATM Straddle |
2026-04-1017 |
6 |
50.7234.69 |
121.46%86.98% |
7.453.80 |
2026-04-1724 |
13 |
50.9834.82 |
120.39%81.66% |
11.205.30 |
Weekly Range
| Confidence |
Low |
High |
Width |
| 68% |
41.9230.52 |
59.1438.82 |
17.228.31 |
| 80% |
39.5029.35 |
61.5639.99 |
22.0710.65 |
| 90% |
36.3727.84 |
64.6941.50 |
28.3313.67 |
| 95% |
33.6526.53 |
67.4142.81 |
33.7516.29 |
Structure & Probabilities
| Support |
Resistance |
Gamma Flip |
Max Pain |
P>Res |
P<Sup |
50.31.00 |
55.35.00 |
44.8923.53 |
49.21.00 |
27.6%42.8% |
36.3%14.4% |
Flow & Skew
| Call Vol |
Put Vol |
Vol P/C |
Call OI |
Put OI |
OI P/C |
Skew |
Skew Bias |
9,1103,359 |
3,5734,397 |
1.31 |
40,556 |
34,621 |
0.39 |
13,654 |
8,668 |
0.6385 |
-45.617.91 vol pts |
CALL_SKEW |
Tail Risk
| Q10 |
Q50 |
Q90 |
Down Tail |
Up Tail |
Down/Up |
33.1227.11 |
46.9734.23 |
61.6040.83 |
17.417.56 |
11.076.16 |
1.5723 |
Daily Technicals
| EMA20 |
EMA50 |
VWAP20 |
BB Lower |
BB Mid |
BB Upper |
BB Width |
Vol Ratio |
Path |
50.6431.65 |
46.4827.98 |
51.1431.78 |
42.6323.05 |
51.3531.22 |
60.0739.40 |
33.98%52.37% |
0.7449 |
SidewaysUP /trend Range(expanding) |
Day Plan
50.31.00-55.35.00 range: fade extremes- >
55.35.00: chase only if hold + vol
- <
50.31.00: risk expand; reduce size
- Regime: TRANSITION
- Tech:
SidewaysUP /trend Range(expanding)
Swing Plan
- Accumulate:
50.31.00-50.31.00
- Trim:
55.35.00-55.35.00
- Add: close >
55.35.00
- Cut: close <
50.31.00
- Best for: transition regime
Raw Text Summary
📌 UVXYPL @ 50.5334.67 (2026-04-0512 06:5008:48 PMAM MYT)

• Current price is **50.53*34.67**. Key support is around **50.31.00**, and resistance is around **55.35.00**.
• For the next week, the model’s **68% expected range** is roughly **41.9230.52 to 59.14*38.82**.
• A wider **90% range** is about **36.3727.84 to 64.69*41.50**.
• Dealer positioning looks **LONG gamma**, so the market behavior is classified as **TRANSITION**.
• The estimated **gamma flip** is near **44.89*23.53**. Crossing and holding beyond this area can change the trading behavior.
• Approximate breakout odds: **above resistance 27.6%42.8%**, **below support 36.3%14.4%** by the target horizon.
• Options skew is tilted toward **calls**, which suggests upside speculation is relatively stronger.
• Near-term implied volatility is higher than the next expiry (**IV1 121.46%86.98% vs IV2 81.66%**), which suggests **near-term event stress / backwardation**.
• Recent volume is only **0.49x** the 20-day average, so breakouts may be less reliable unless volume improves.
• On the daily chart, the stock currently looks like **UP trend (expanding)**.
• The implied distribution shows **heavier downside tail risk** than upside tail potential.
RDDT
Spot: 139.73
Report Time: 2026-04-12 08:48 AM MYT
Regime: TRANSITION
Dealer Gamma: LONG
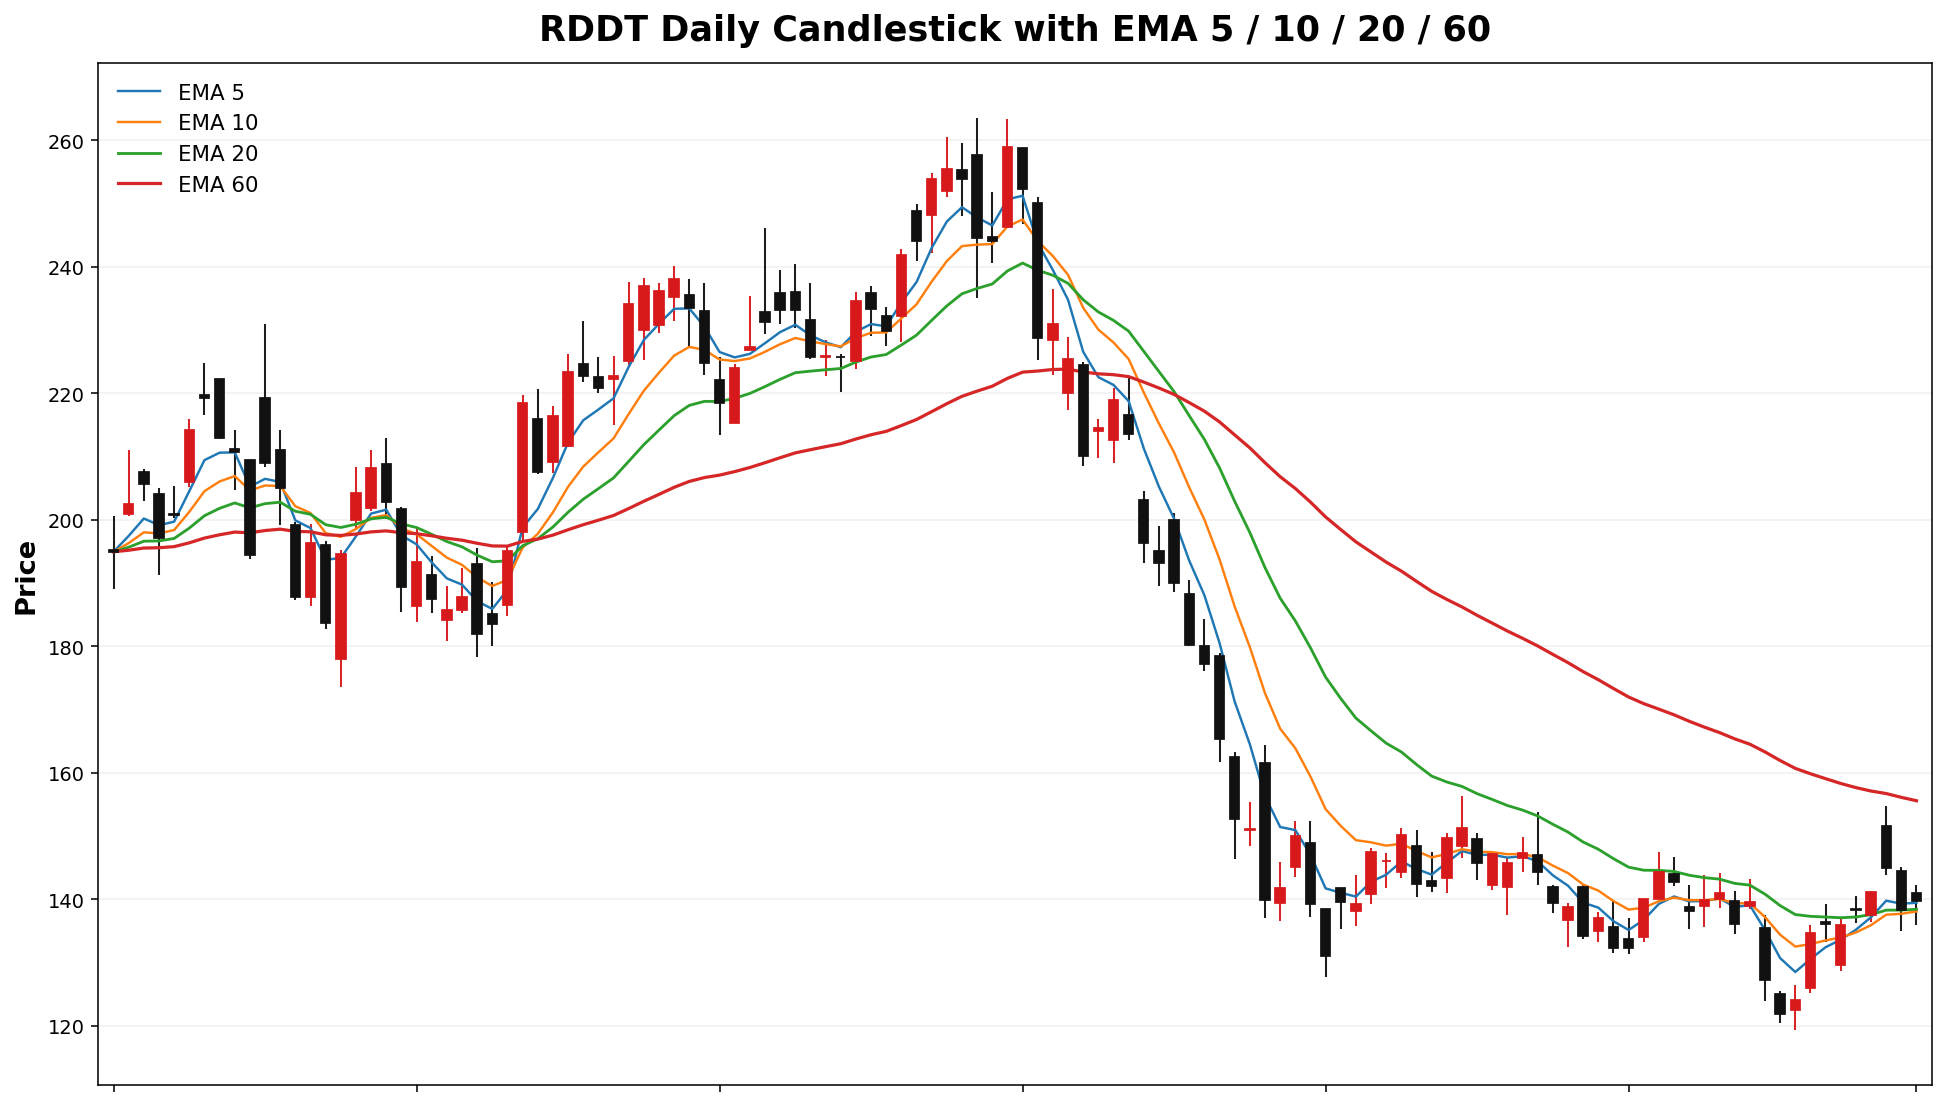
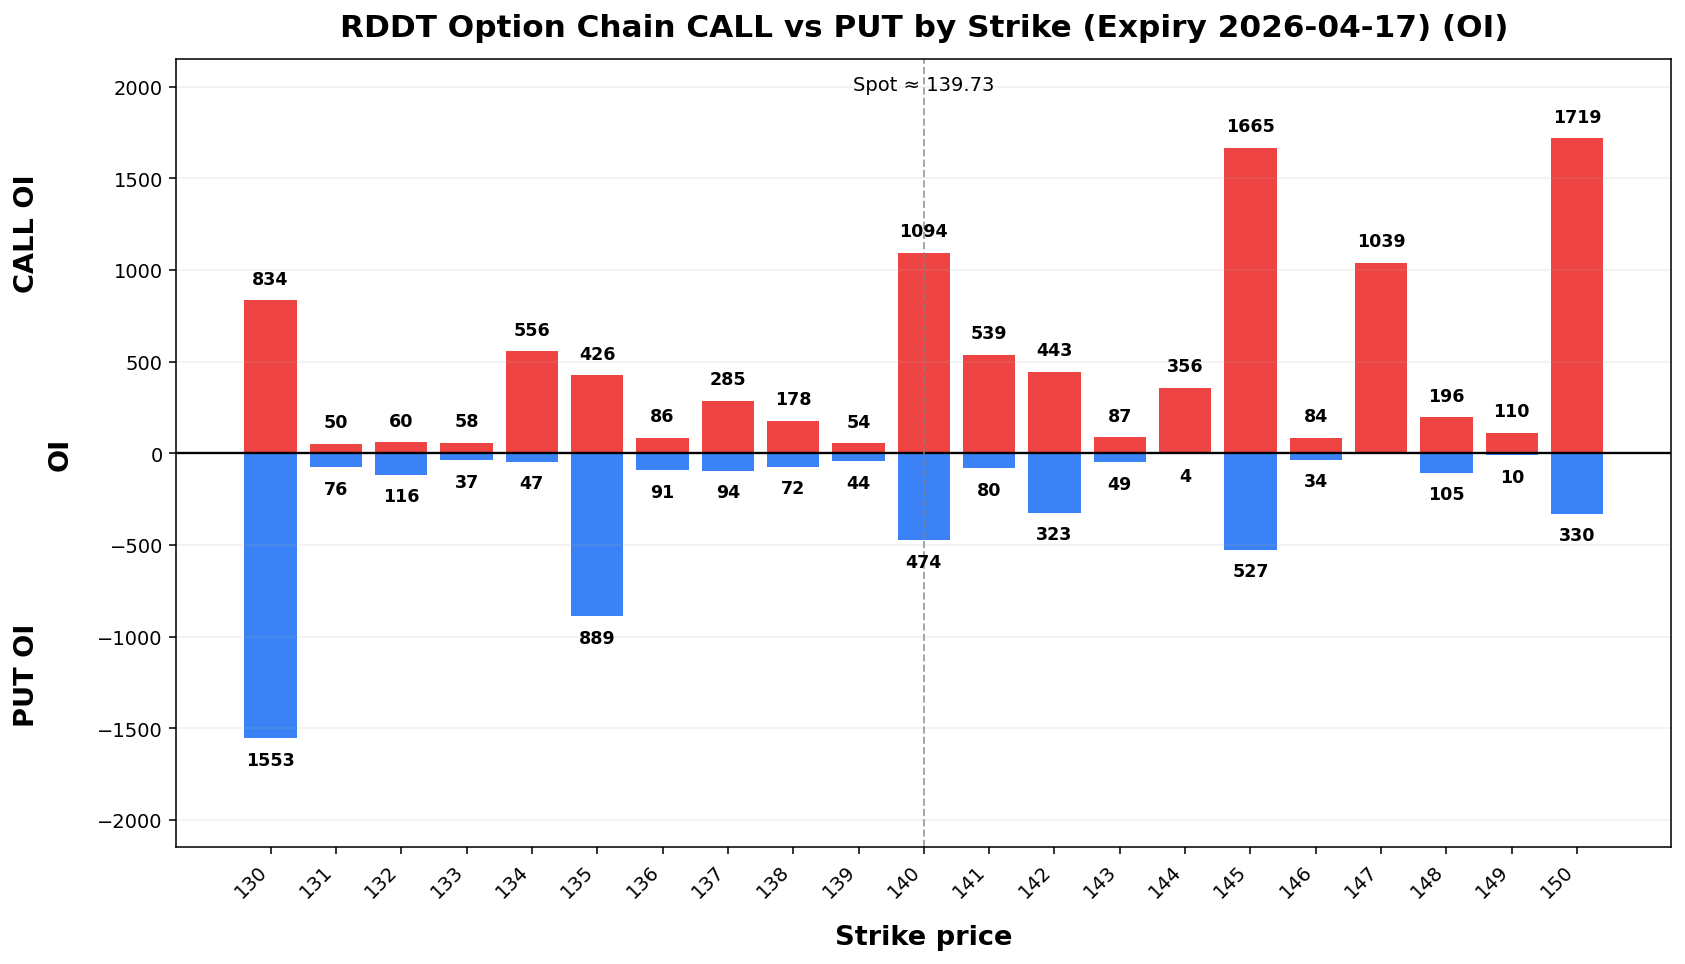
Term Structure
| Expiry |
DTE |
Forward |
ATM IV |
ATM Straddle |
| 2026-04-17 |
6 |
139.94 |
58.92% |
10.38 |
| 2026-04-24 |
13 |
139.94 |
58.78% |
15.38 |
Weekly Range
| Confidence |
Low |
High |
Width |
| 68% |
128.14 |
151.32 |
23.17 |
| 80% |
124.88 |
154.58 |
29.70 |
| 90% |
120.39%67 |
158.79 |
38.12 |
| 95% |
117.02 |
162.44 |
45.42 |
Structure & Probabilities
| Support |
Resistance |
Gamma Flip |
Max Pain |
P>Res |
P<Sup |
| 125.00 |
145.00 |
132.66 |
140.00 |
23.6% |
8.9% |
Flow & Skew
| Call Vol |
Put Vol |
Vol P/C |
Call OI |
Put OI |
OI P/C |
Skew |
Skew Bias |
| 7,464 |
4,685 |
0.63 |
38,104 |
19,864 |
0.52 |
7.47 vol pts |
PUT_SKEW |
Tail Risk
| Q10 |
Q50 |
Q90 |
Down Tail |
Up Tail |
Down/Up |
| 124.61 |
139.74 |
155.16 |
15.12 |
15.43 |
0.98 |
Daily Technicals
| EMA20 |
EMA50 |
VWAP20 |
BB Lower |
BB Mid |
BB Upper |
BB Width |
Vol Ratio |
Path |
| 138.44 |
151.26 |
136.41 |
124.36 |
136.84 |
149.32 |
18.24% |
0.74 |
Sideways / Range |
Day Plan
- 125.00-145.00 range: fade extremes
- > 145.00: chase only if hold + vol
- < 125.00: risk expand; reduce size
- Regime: TRANSITION
- Tech: Sideways / Range
Swing Plan
- Accumulate: 125.00-125.00
- Trim: 145.00-145.00
- Add: close > 145.00
- Cut: close < 125.00
- Best for: transition regime
Raw Text Summary
📌 RDDT @ 139.73 (2026-04-12 08:48 AM MYT)

• Current price is **139.73**. Key support is around **125.00**, and resistance is around **145.00**.
• For the next week, the model’s **68% expected range** is roughly **128.14 to 151.32**.
• A wider **90% range** is about **120.67 to 158.79**.
• Dealer positioning looks **LONG gamma**, so the market behavior is classified as **TRANSITION**.
• The estimated **gamma flip** is near **132.66**. Crossing and holding beyond this area can change the trading behavior.
• Approximate breakout odds: **above resistance 23.6%**, **below support 8.9%** by the target horizon.
• Options skew is tilted toward **puts**, which suggests traders are paying more for downside protection.
• Near-term implied volatility is higher than the next expiry (**IV1 58.92% vs IV2 58.78%**), which suggests **near-term event stress / backwardation**.
• Recent volume is only **0.74x** the 20-day average, so breakouts may be less reliable unless volume improves.
• On the daily chart, the stock currently looks like **Sideways / Range**.
• The implied distribution showsis **heavierfairly balanced** between upside and downside tail risk** than upside tail potential.tails.
GSATCRDO
Spot: 77.73119.59
Report Time: 2026-04-0512 06:5008:48 PMAM MYT
Regime: TRANSITION
Dealer Gamma: LONG
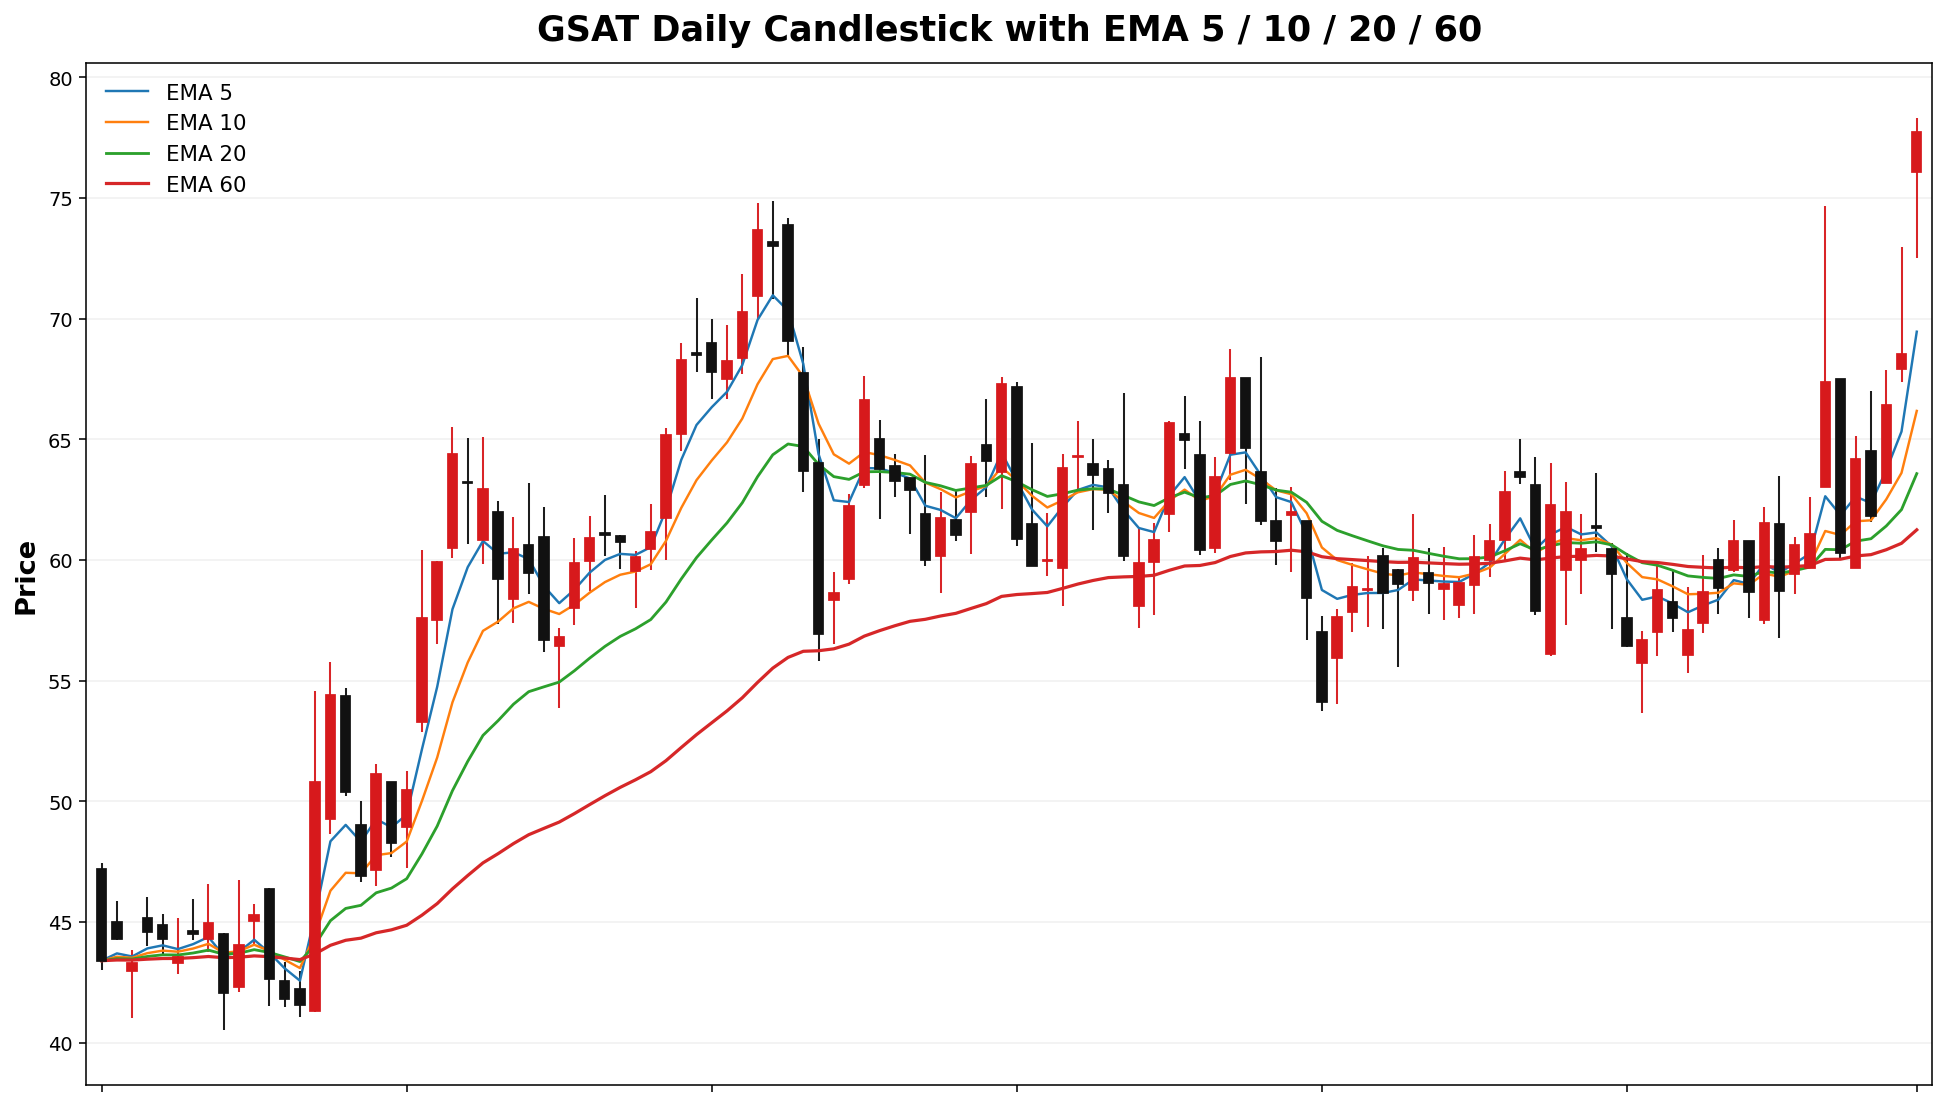
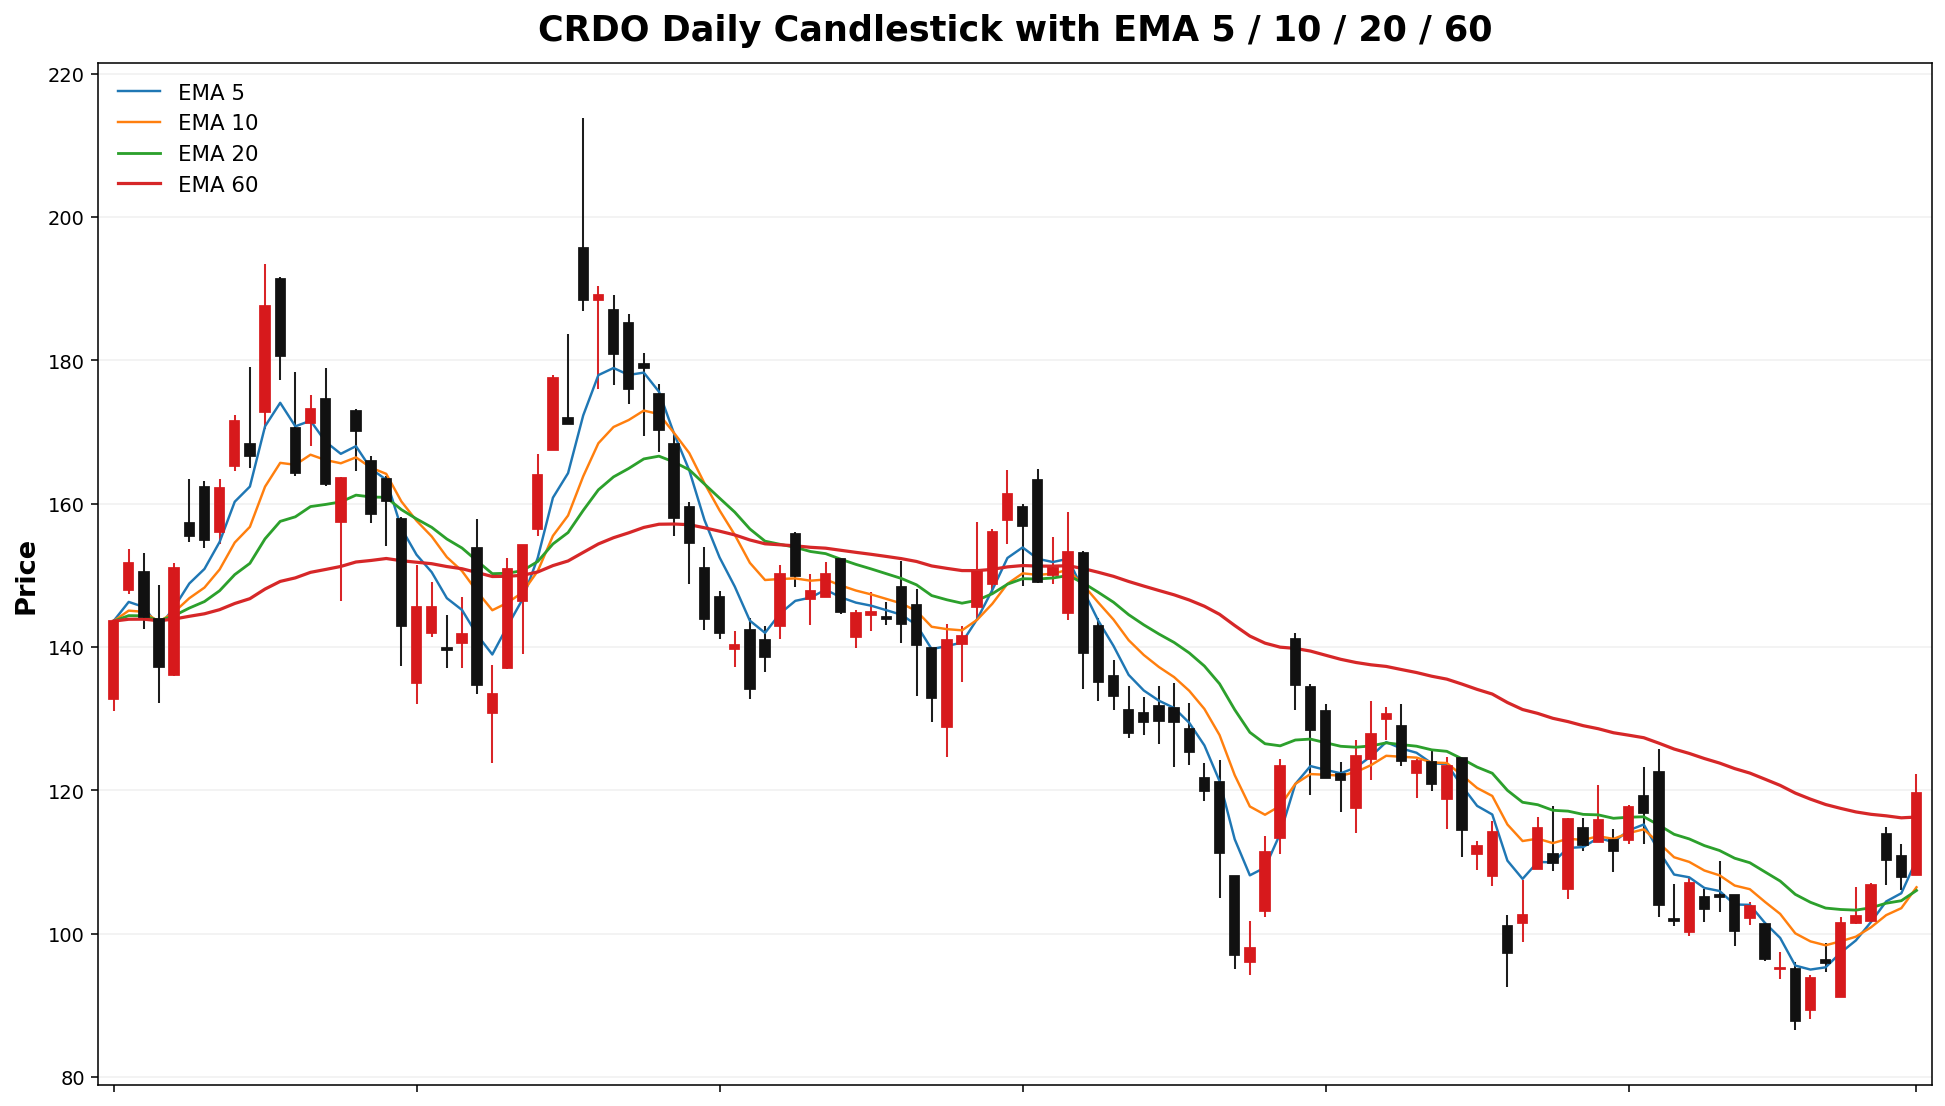
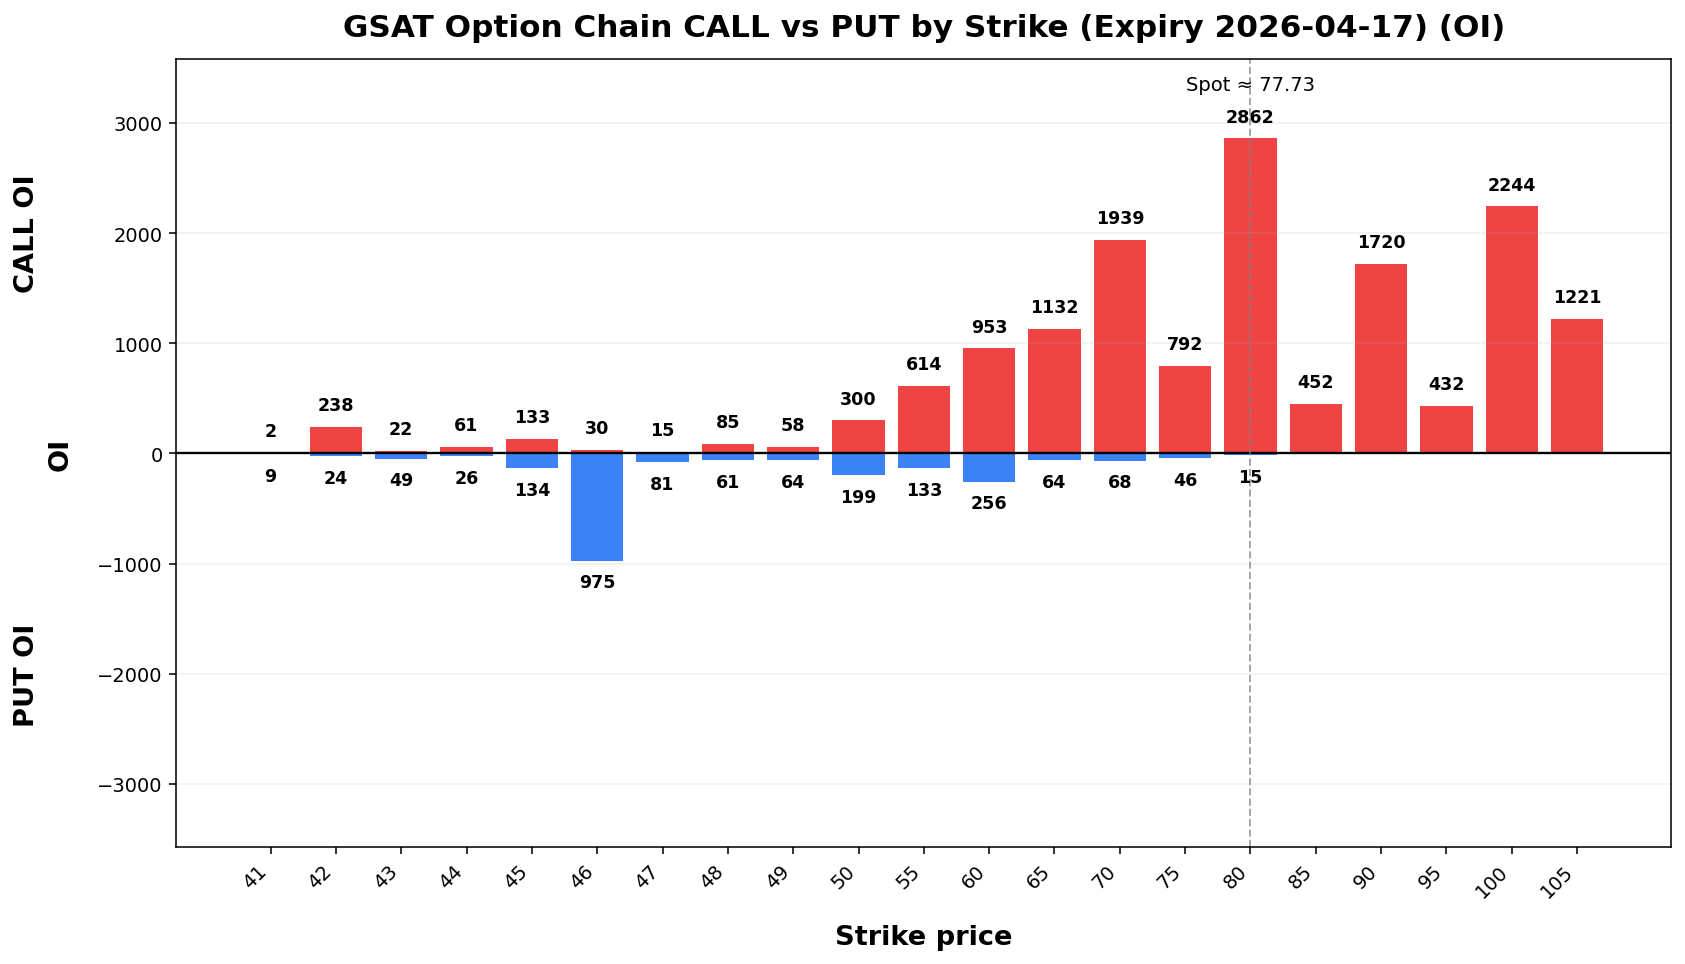
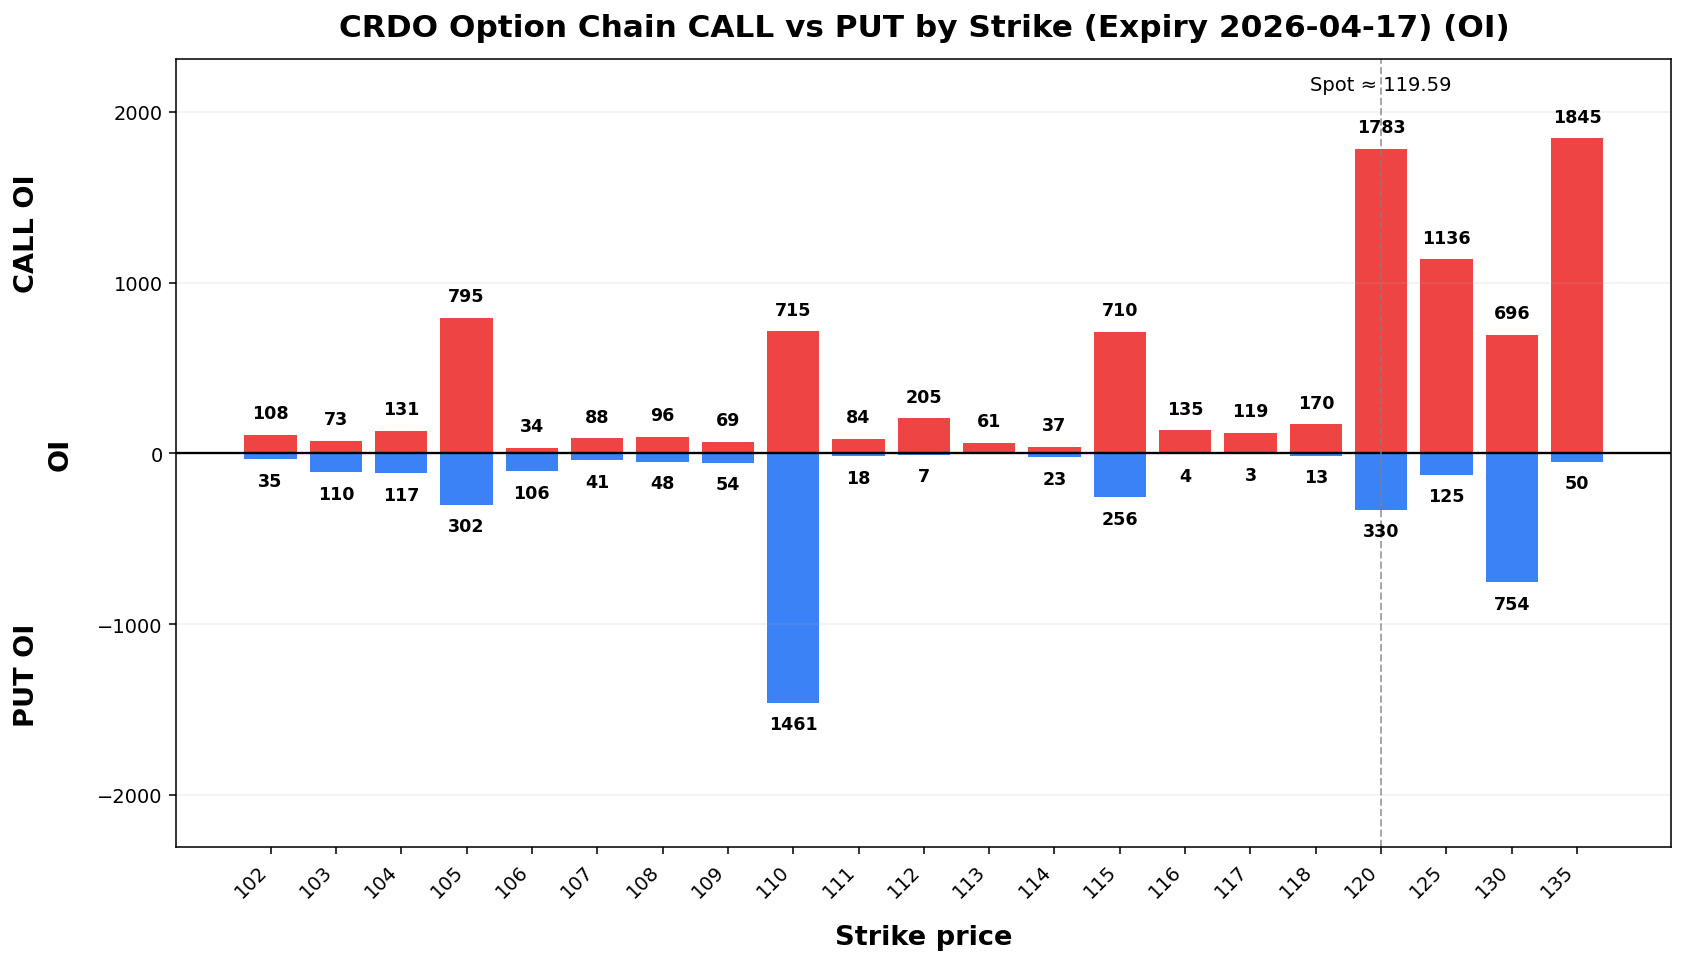
Term Structure
| Expiry |
DTE |
Forward |
ATM IV |
ATM Straddle |
| 2026-04-17 |
136 |
77.00119.87 |
76.16%31% |
10.9011.50 |
2026-05-1504-24 |
4113 |
74.120.33 |
53.78%72.14% |
13.9016.15 |
Weekly Range
| Confidence |
Low |
High |
Width |
| 68% |
67.47 |
87.106.99 |
20.51132.19 |
25.21 |
| 80% |
64.59103.44 |
90.87135.74 |
26.2832.30 |
| 90% |
60.98.86 |
94.60140.32 |
33.7441.46 |
| 95% |
57.6394.89 |
97.83144.29 |
40.2049.40 |
Structure & Probabilities
| Support |
Resistance |
Gamma Flip |
Max Pain |
P>Res |
P<Sup |
70.110.00 |
80.120.00 |
52.51111.58 |
46.109.00 |
41.2% |
22.5% |
Flow & Skew
Call Vol |
Put Vol |
Vol P/C |
Call OI |
Put OI |
OI P/C |
Skew |
Skew Bias |
|---|
6,953 |
1,809 |
0.26 |
16,424 |
13,852 |
0.84 |
-1.71 vol pts |
CALL_SKEW |
Tail Risk
Q10 |
Q50 |
Q90 |
Down Tail |
Up Tail |
Down/Up |
|---|
19.22 |
20.10 |
20.98 |
58.51 |
0.00 |
NA |
Daily Technicals
EMA20 |
EMA50 |
VWAP20 |
BB Lower |
BB Mid |
BB Upper |
BB Width |
Vol Ratio |
Path |
|---|
63.57 |
61.56 |
65.60 |
51.30 |
61.59 |
71.88 |
33.43% |
4.39 |
UP trend (expanding) |
Day Plan
70.00-80.00 range: fade extremes
> 80.00: chase only if hold + vol
< 70.00: risk expand; reduce size
Regime: TRANSITION
Tech: UP trend (expanding)
Swing Plan
Accumulate: 70.00-70.00
Trim: 80.00-80.00
Add: close > 80.00
Cut: close < 70.00
Best for: transition regime
Raw Text Summary
📌 GSAT @ 77.73 (2026-04-05 06:50 PM MYT)

• Current price is **77.73**. Key support is around **70.00**, and resistance is around **80.00**.
• For the next week, the model’s **68% expected range** is roughly **67.47 to 87.99**.
• A wider **90% range** is about **60.86 to 94.60**.
• Dealer positioning looks **LONG gamma**, so the market behavior is classified as **TRANSITION**.
• The estimated **gamma flip** is near **52.51**. Crossing and holding beyond this area can change the trading behavior.
• Approximate breakout odds: **above resistance 41.2%**, **below support 22.5%** by the target horizon.
• Options skew is fairly balanced, so there is **no strong directional bias** from skew alone.
• Near-term implied volatility is higher than the next expiry (**IV1 76.16% vs IV2 53.78%**), which suggests **near-term event stress / backwardation**.
• Recent volume is **4.39x** the 20-day average, which supports stronger continuation or breakout follow-through.
• On the daily chart, the stock currently looks like **UP trend (expanding)**.
GUSH
Spot: 42.16
Report Time: 2026-04-05 06:50 PM MYT
Regime: TRANSITION
Dealer Gamma: LONG
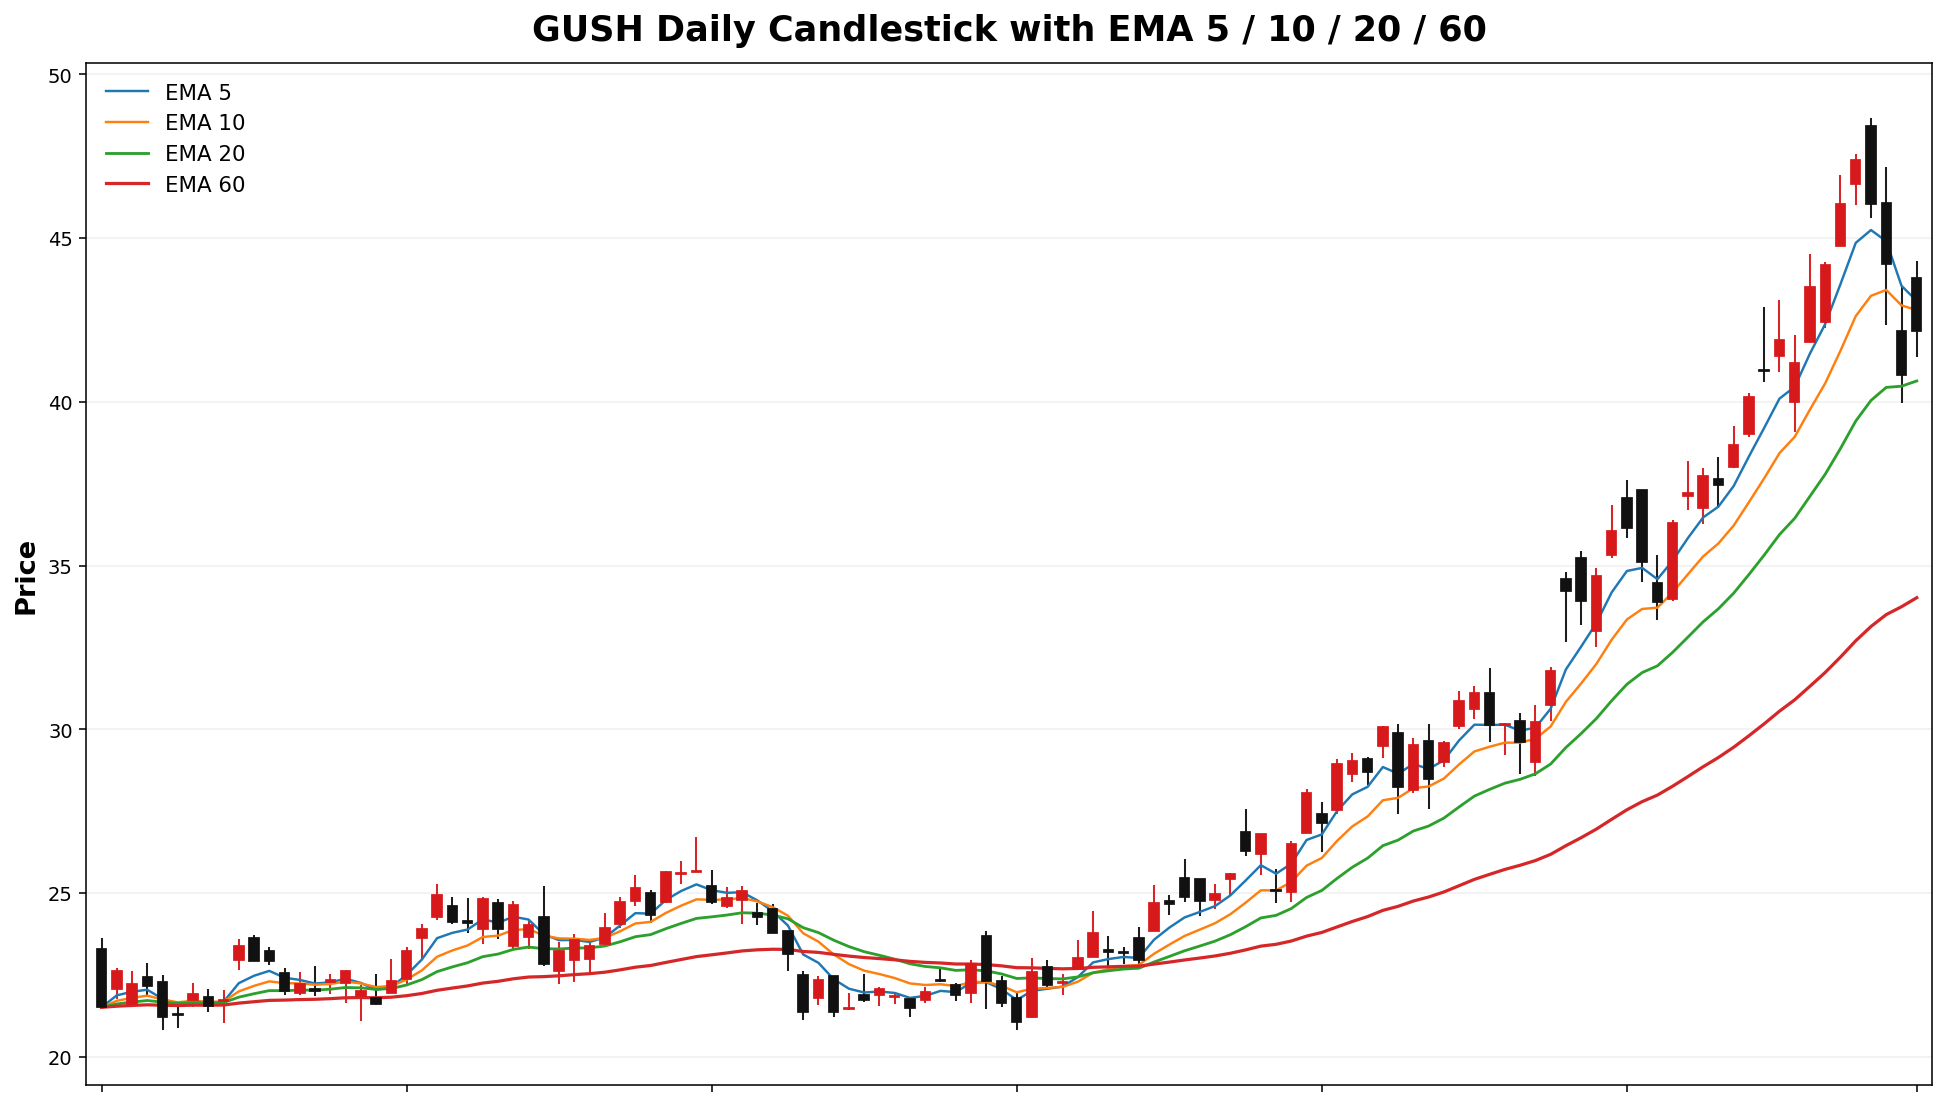
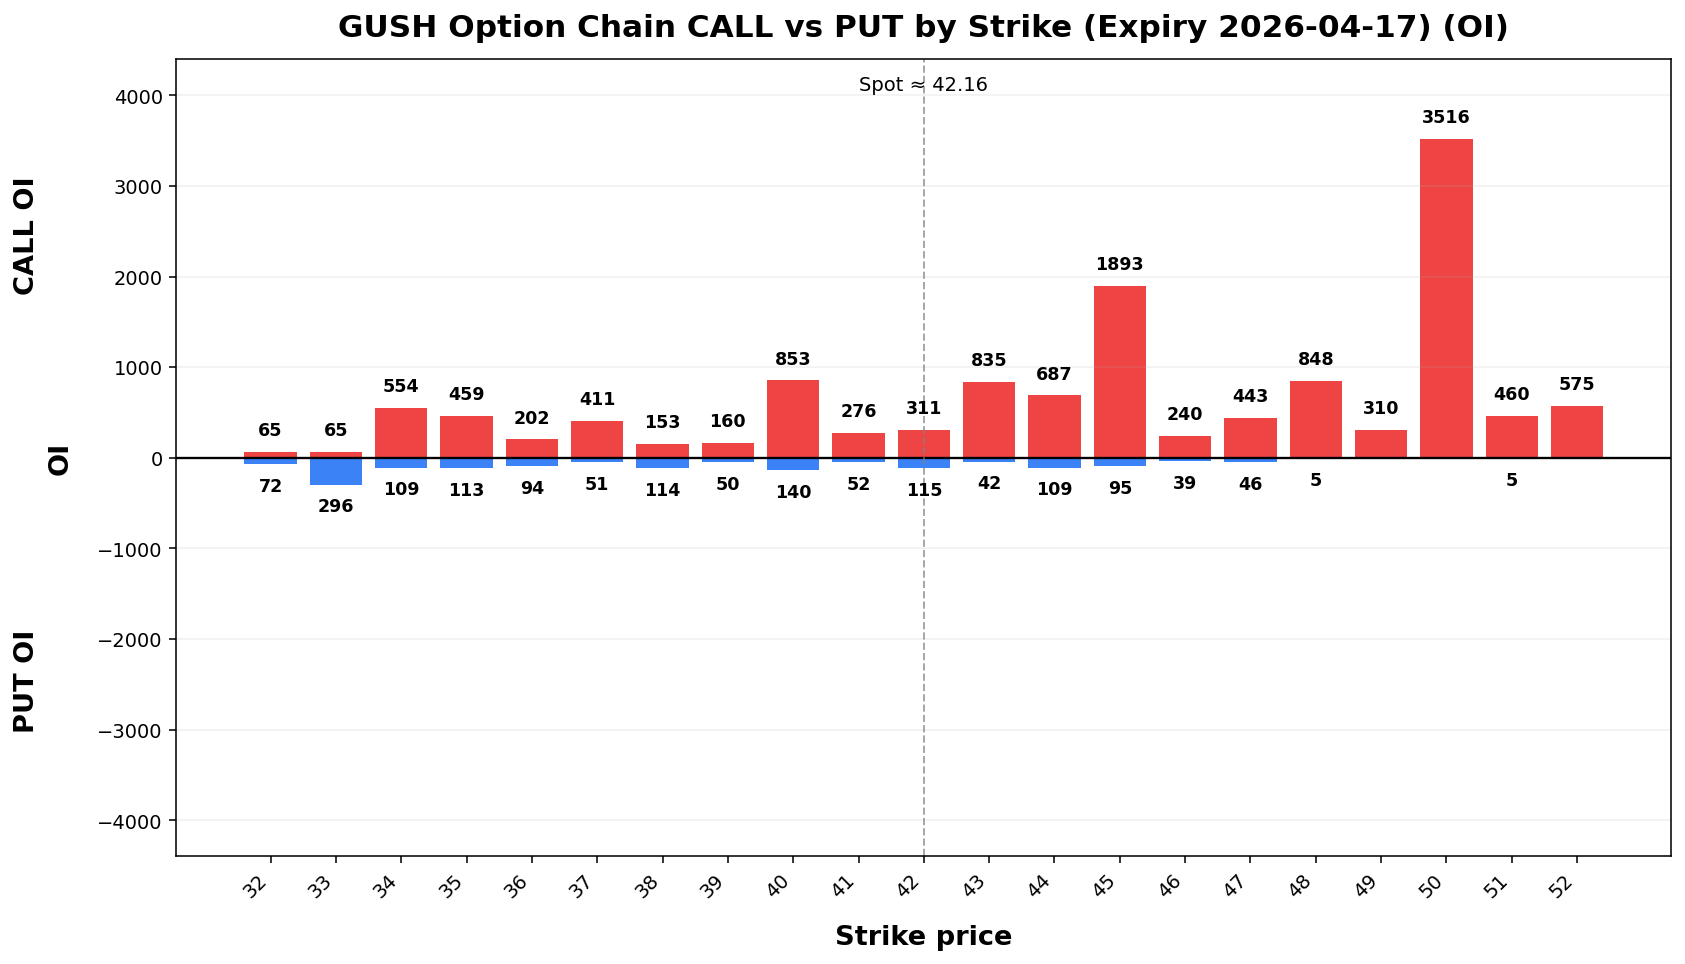
Term Structure
Expiry |
DTE |
Forward |
ATM IV |
ATM Straddle |
|---|
2026-04-17 |
13 |
41.99 |
68.28% |
5.30 |
2026-05-15 |
41 |
42.16 |
59.56% |
8.35 |
Weekly Range
Confidence |
Low |
High |
Width |
|---|
68% |
37.64 |
46.68 |
9.05 |
80% |
36.36 |
47.96 |
11.59 |
90% |
34.72 |
49.60 |
14.88 |
95% |
33.30 |
51.02 |
17.73 |
Structure & Probabilities
Support |
Resistance |
Gamma Flip |
Max Pain |
P>Res |
P<Sup |
|---|
40.00 |
43.00 |
NA |
34.00 |
35.0% |
31.1% |
Flow & Skew
Call Vol |
Put Vol |
Vol P/C |
Call OI |
Put OI |
OI P/C |
Skew |
Skew Bias |
|---|
2,958 |
391 |
0.13 |
16,563 |
2,104 |
0.13 |
10.11 vol pts |
PUT_SKEW |
Tail Risk
Q10 |
Q50 |
Q90 |
Down Tail |
Up Tail |
Down/Up |
|---|
30.22 |
41.40 |
47.82 |
11.94 |
5.66 |
2.11 |
Daily Technicals
EMA20 |
EMA50 |
VWAP20 |
BB Lower |
BB Mid |
BB Upper |
BB Width |
Vol Ratio |
Path |
|---|
40.64 |
35.26 |
40.17 |
32.73 |
40.55 |
48.37 |
38.58% |
0.90 |
UP trend (expanding) |
Day Plan
40.00-43.00 range: fade extremes
> 43.00: chase only if hold + vol
< 40.00: risk expand; reduce size
Regime: TRANSITION
Tech: UP trend (expanding)
Swing Plan
Accumulate: 40.00-40.00
Trim: 43.00-43.00
Add: close > 43.00
Cut: close < 40.00
Best for: transition regime
Raw Text Summary
📌 GUSH @ 42.16 (2026-04-05 06:50 PM MYT)

• Current price is **42.16**. Key support is around **40.00**, and resistance is around **43.00**.
• For the next week, the model’s **68% expected range** is roughly **37.64 to 46.68**.
• A wider **90% range** is about **34.72 to 49.60**.
• Dealer positioning looks **LONG gamma**, so the market behavior is classified as **TRANSITION**.
• Approximate breakout odds: **above resistance 35.0%**, **below support 31.1%** by the target horizon.
• Options skew is tilted toward **puts**, which suggests traders are paying more for downside protection.
• Near-term implied volatility is higher than the next expiry (**IV1 68.28% vs IV2 59.56%**), which suggests **near-term event stress / backwardation**.
• On the daily chart, the stock currently looks like **UP trend (expanding)**.
• The implied distribution shows **heavier downside tail risk** than upside tail potential.
SQQQ
Spot: 77.29
Report Time: 2026-04-05 06:50 PM MYT
Regime: PIN
Dealer Gamma: LONG
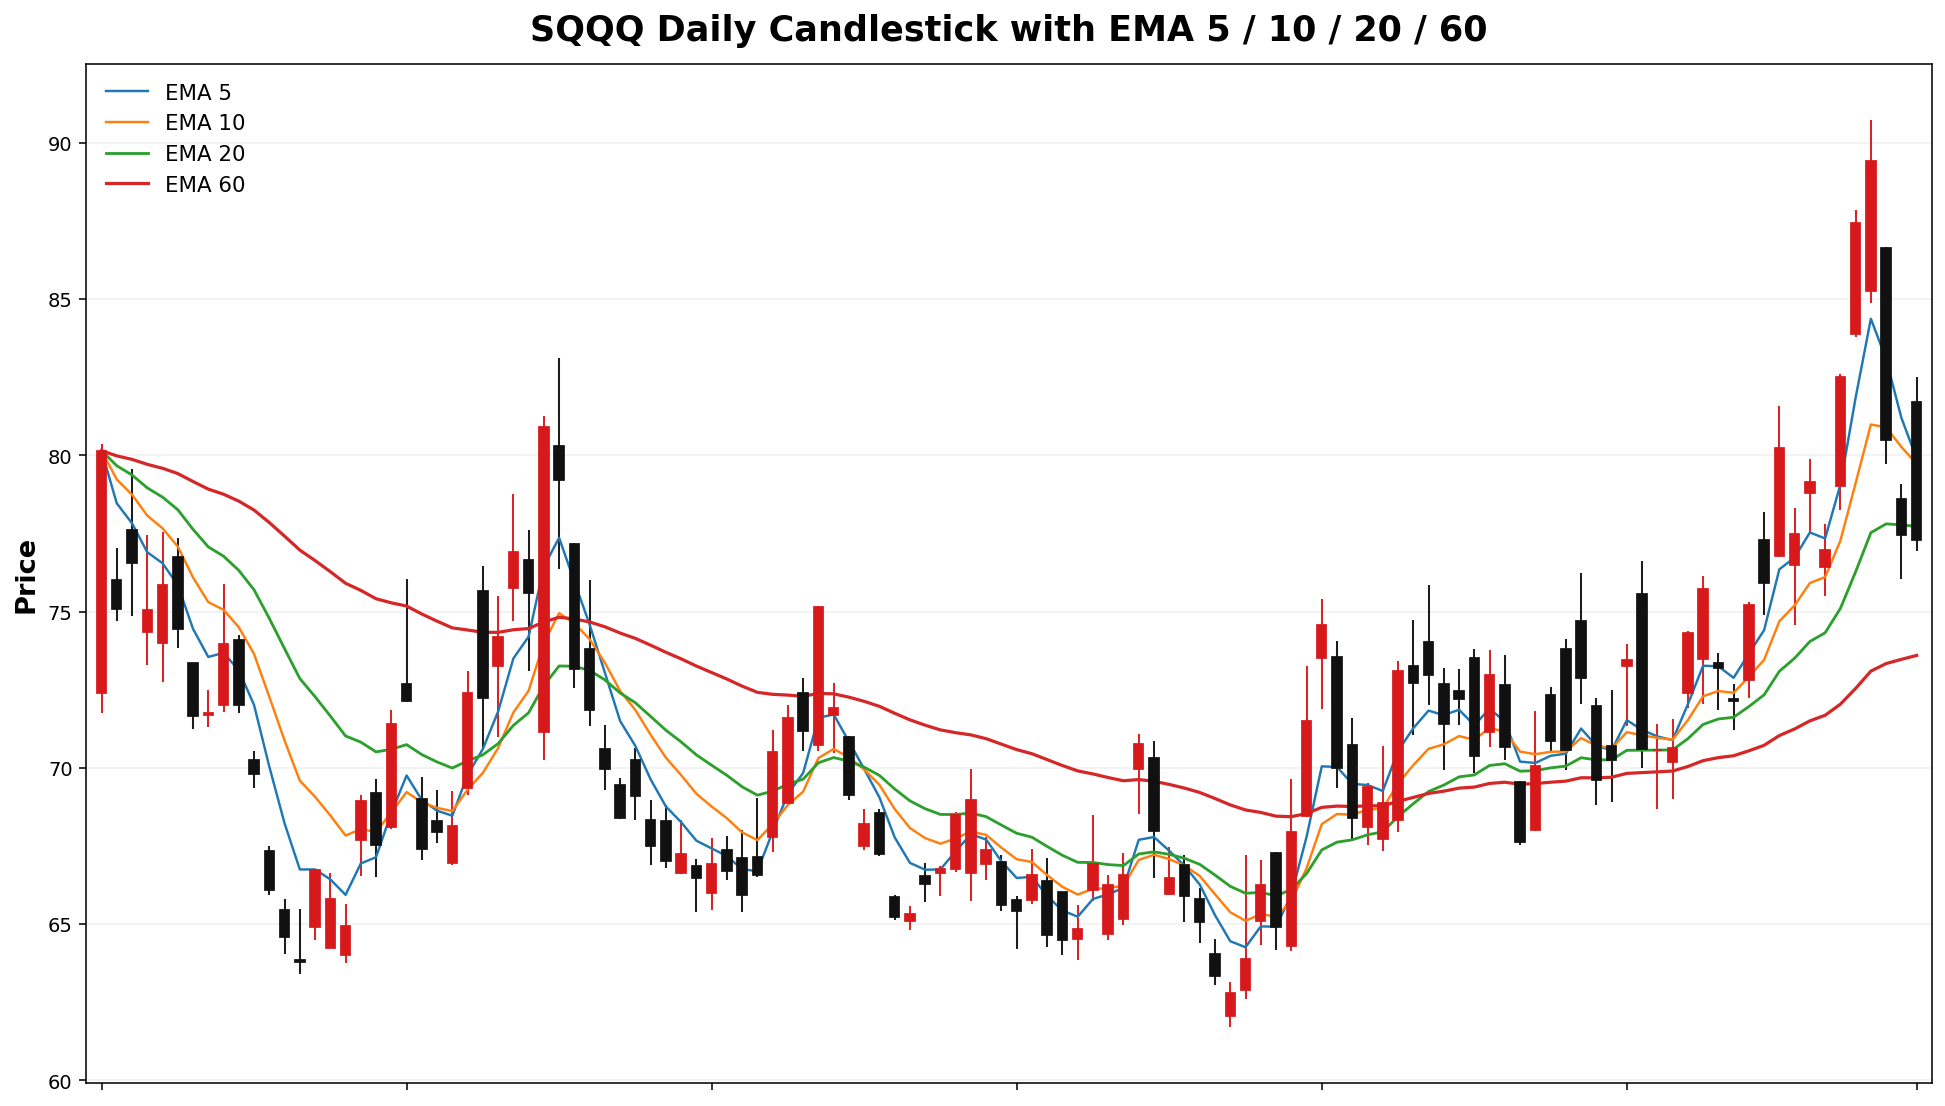
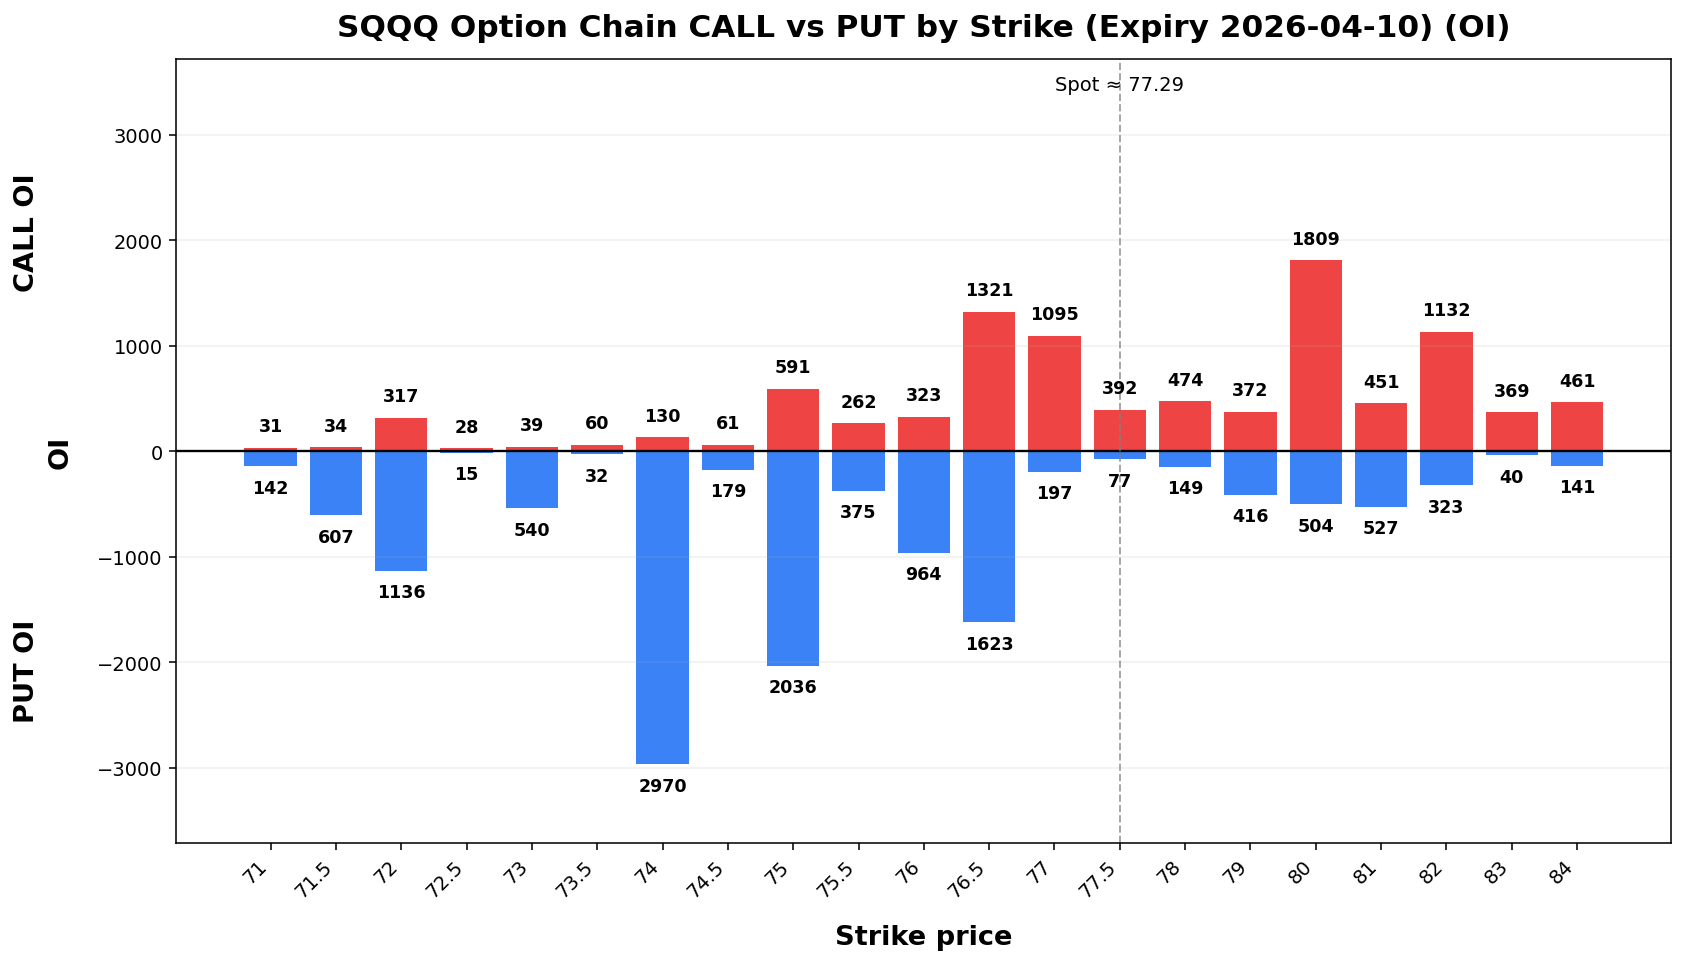
Term Structure
Expiry |
DTE |
Forward |
ATM IV |
ATM Straddle |
|---|
2026-04-10 |
6 |
77.52 |
66.35% |
6.22 |
2026-04-17 |
13 |
77.67 |
62.19% |
8.85 |
Weekly Range
Confidence |
Low |
High |
Width |
|---|
68% |
70.27 |
84.31 |
14.04 |
80% |
68.29 |
86.29 |
18.00 |
90% |
65.74 |
88.84 |
23.10 |
95% |
63.53 |
91.05 |
27.52 |
Structure & Probabilities
Support |
Resistance |
Gamma Flip |
Max Pain |
P>Res |
P<Sup |
|---|
77.00 |
80.00 |
78.00 |
76.50 |
34.3% |
39.7% |
Flow & Skew
Call Vol |
Put Vol |
Vol P/C |
Call OI |
Put OI |
OI P/C |
Skew |
Skew Bias |
|---|
24,335 |
5,717 |
0.23 |
20,798 |
16,816 |
0.81 |
-24.07 vol pts |
CALL_SKEW |
Tail Risk
Q10 |
Q50 |
Q90 |
Down Tail |
Up Tail |
Down/Up |
|---|
69.54 |
75.04 |
85.65 |
7.75 |
8.36 |
0.93 |
Daily Technicals
EMA20 |
EMA50 |
VWAP20 |
BB Lower |
BB Mid |
BB Upper |
BB Width |
Vol Ratio |
Path |
|---|
77.73 |
74.18 |
77.04 |
66.68 |
77.01 |
87.34 |
26.83% |
1.18 |
Sideways / Range |
Day Plan
77.00-80.00 range: fade extremes
> 80.00: chase only if hold + vol
< 77.00: risk expand; reduce size
Regime: PIN
Tech: Sideways / Range
Swing Plan
Accumulate: 77.00-77.00
Trim: 80.00-80.00
Add: close > 80.00
Cut: close < 77.00
Best for: pin regime
Raw Text Summary
📌 SQQQ @ 77.29 (2026-04-05 06:50 PM MYT)

• Current price is **77.29**. Key support is around **77.00**, and resistance is around **80.00**.
• For the next week, the model’s **68% expected range** is roughly **70.27 to 84.31**.
• A wider **90% range** is about **65.74 to 88.84**.
• Dealer positioning looks **LONG gamma**, so the market behavior is classified as **PIN**.
• The estimated **gamma flip** is near **78.00**. Crossing and holding beyond this area can change the trading behavior.
• Approximate breakout odds: **above resistance 34.3%**, **below support 39.7%** by the target horizon.
• Options skew is tilted toward **calls**, which suggests upside speculation is relatively stronger.
• Near-term implied volatility is higher than the next expiry (**IV1 66.35% vs IV2 62.19%**), which suggests **near-term event stress / backwardation**.
• On the daily chart, the stock currently looks like **Sideways / Range**.
• The implied distribution is **fairly balanced** between upside and downside tails.
BE
Spot: 135.63
Report Time: 2026-04-05 06:50 PM MYT
Regime: TREND
Dealer Gamma: SHORT
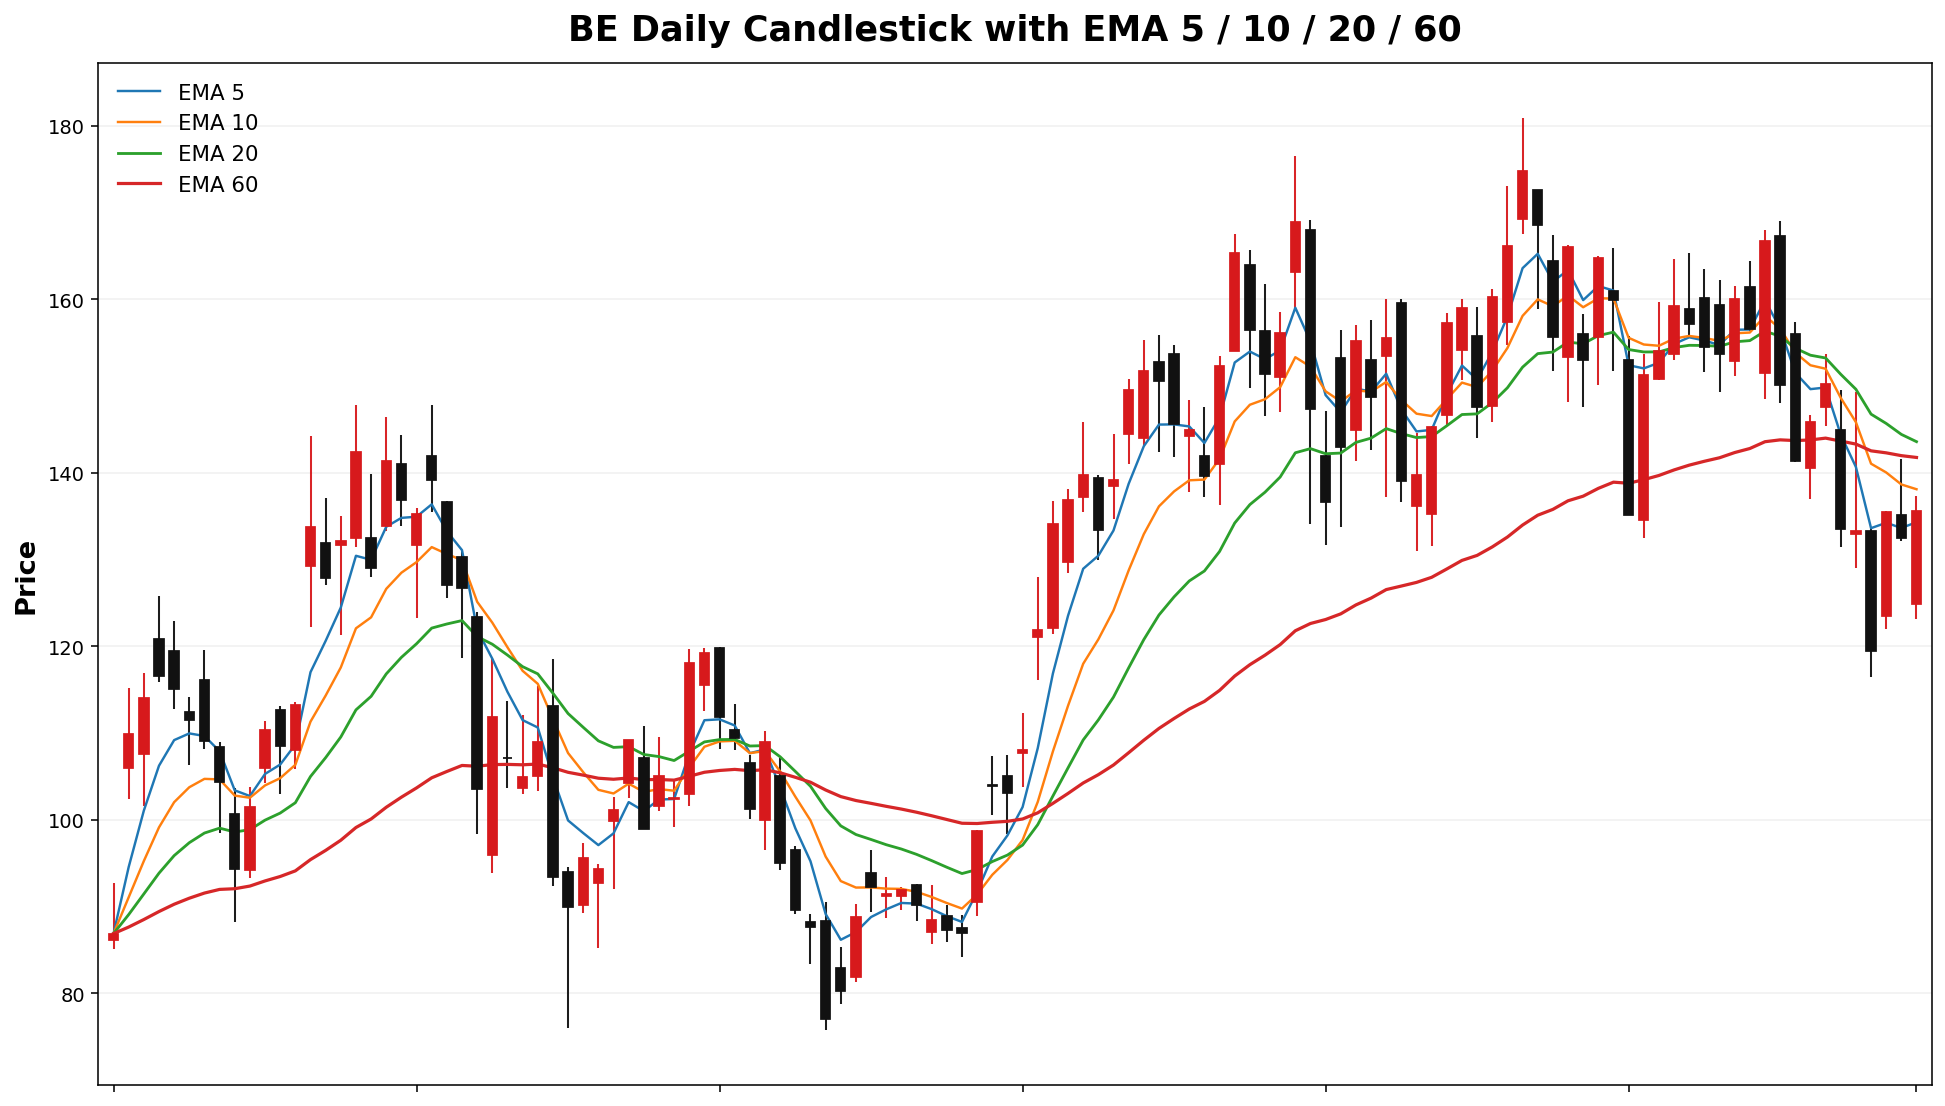
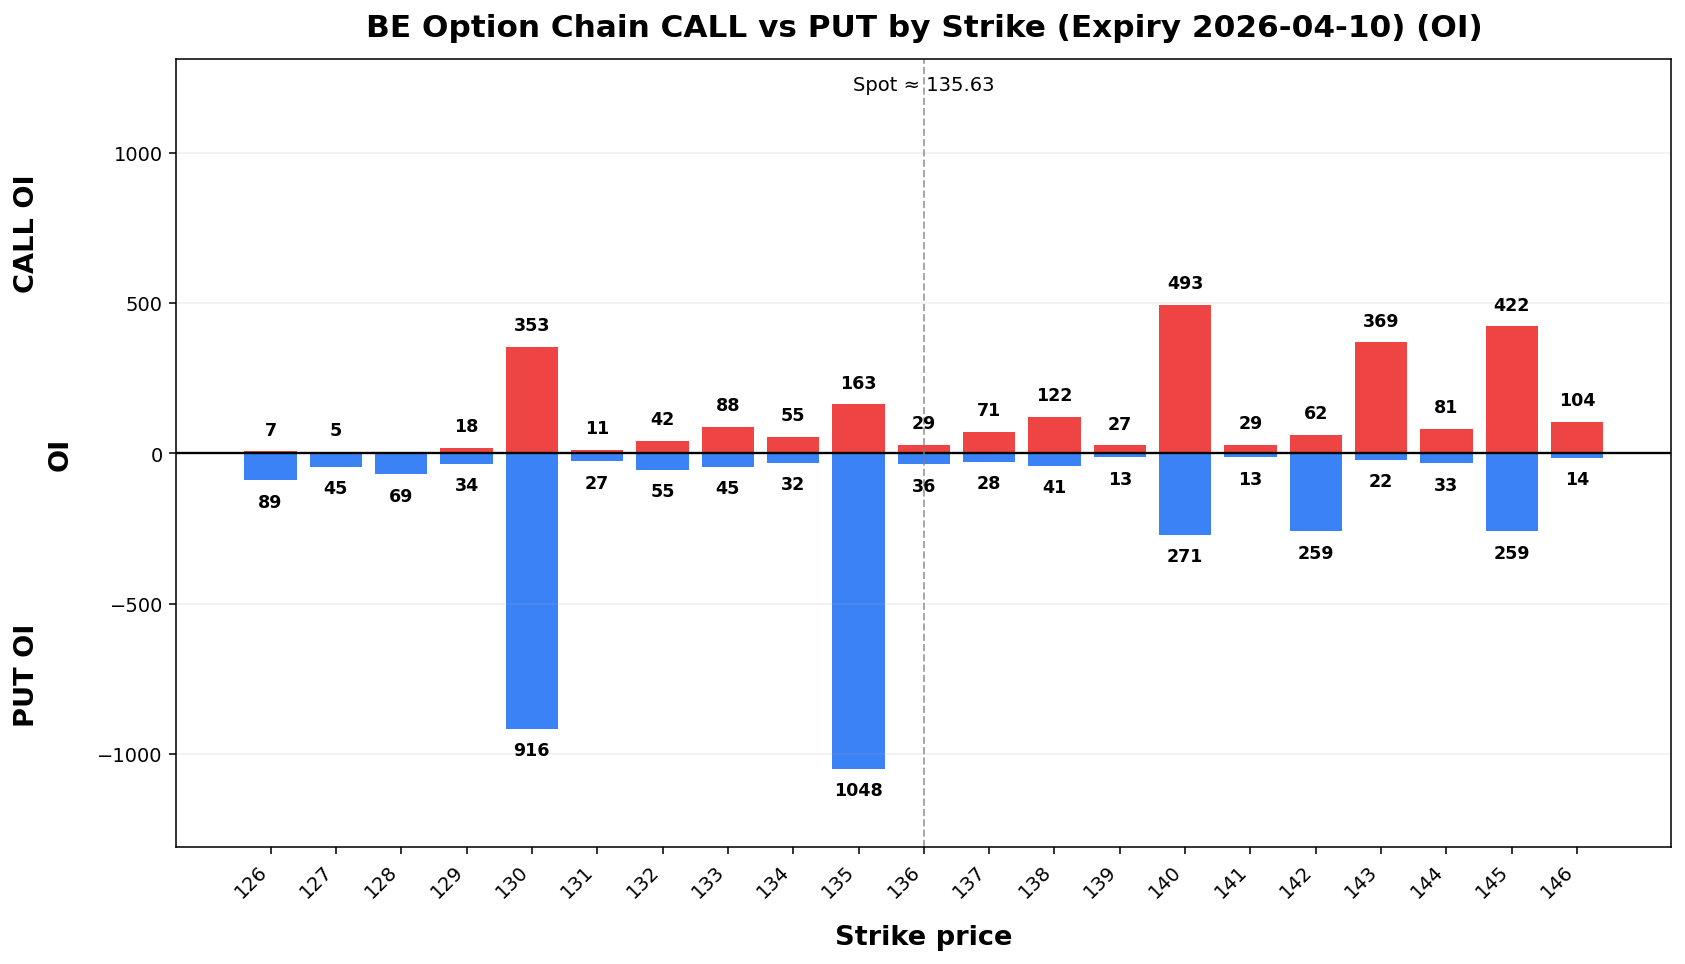
Term Structure
Expiry |
DTE |
Forward |
ATM IV |
ATM Straddle |
|---|
2026-04-10 |
6 |
135.27 |
89.60% |
14.75 |
2026-04-17 |
13 |
135.45 |
88.40% |
22.07 |
Weekly Range
Confidence |
Low |
High |
Width |
|---|
68% |
118.62 |
152.64 |
34.03 |
80% |
113.83 |
157.43 |
43.61 |
90% |
107.65 |
163.61 |
55.97 |
95% |
102.28 |
168.98 |
66.69 |
Structure & Probabilities
Support |
Resistance |
Gamma Flip |
Max Pain |
P>Res |
P<Sup |
|---|
135.00 |
150.00 |
141.98 |
140.00 |
20.6% |
59.21.9% |
Flow & Skew
| Call Vol |
Put Vol |
Vol P/C |
Call OI |
Put OI |
OI P/C |
Skew |
Skew Bias |
6,463910 |
4,8793,308 |
0.7548 |
9,44416,007 |
13,38346,025 |
1.422.88 |
12.453.59 vol pts |
PUT_SKEW |
Tail Risk
| Q10 |
Q50 |
Q90 |
Down Tail |
Up Tail |
Down/Up |
112.2961.94 |
136.2669.70 |
160.35133.16 |
23.3457.65 |
24.7213.57 |
0.944.25 |
Daily Technicals
| EMA20 |
EMA50 |
VWAP20 |
BB Lower |
BB Mid |
BB Upper |
BB Width |
Vol Ratio |
Path |
143.106.02 |
113.58 |
105.01 |
87.60 |
143.45103.89 |
146.49120.18 |
121.7831.36% |
146.29 |
170.80 |
33.51% |
0.541.31 |
Sideways / Range |
Day Plan
135.110.00-150.120.00 range: fade extremes- >
150.120.00: chase only if hold + vol
- <
135.110.00: risk expand; reduce size
- Regime:
TRENDTRANSITION
- Tech: Sideways / Range
Swing Plan
- Accumulate:
135.110.00-135.110.00
- Trim:
150.120.00-150.120.00
- Add: close >
150.120.00
- Cut: close <
135.110.00
- Best for:
trendtransition regime
Raw Text Summary
📌 BECRDO @ 135.63119.59 (2026-04-0512 06:5008:48 PMAM MYT)

• Current price is **135.63*119.59**. Key support is around **135.110.00**, and resistance is around **150.120.00**.
• For the next week, the model’s **68% expected range** is roughly **118.62106.99 to 152.64*132.19**.
• A wider **90% range** is about **107.6598.86 to 163.61*140.32**.
• Dealer positioning looks **SHORTLONG gamma**, so the market behavior is classified as **TREND*TRANSITION**.
• The estimated **gamma flip** is near **141.98*111.58**. Crossing and holding beyond this area can change the trading behavior.
• Approximate breakout odds: **above resistance 20.6%40.0%**, **below support 59.21.9%** by the target horizon.
• Options skew is tilted toward **puts**, which suggests traders are paying more for downside protection.
• Near-term implied volatility is higher than the next expiry (**IV1 89.60%76.31% vs IV2 88.40%**), which suggests **near-term event stress / backwardation**.
• Recent volume is only **0.54x** the 20-day average, so breakouts may be less reliable unless volume improves.
• On the daily chart, the stock currently looks like **Sideways / Range**.
• The implied distribution is **fairly balanced** between upside and downside tails.
ASTS
Spot: 92.62
Report Time: 2026-04-05 06:50 PM MYT
Regime: TRANSITION
Dealer Gamma: LONG
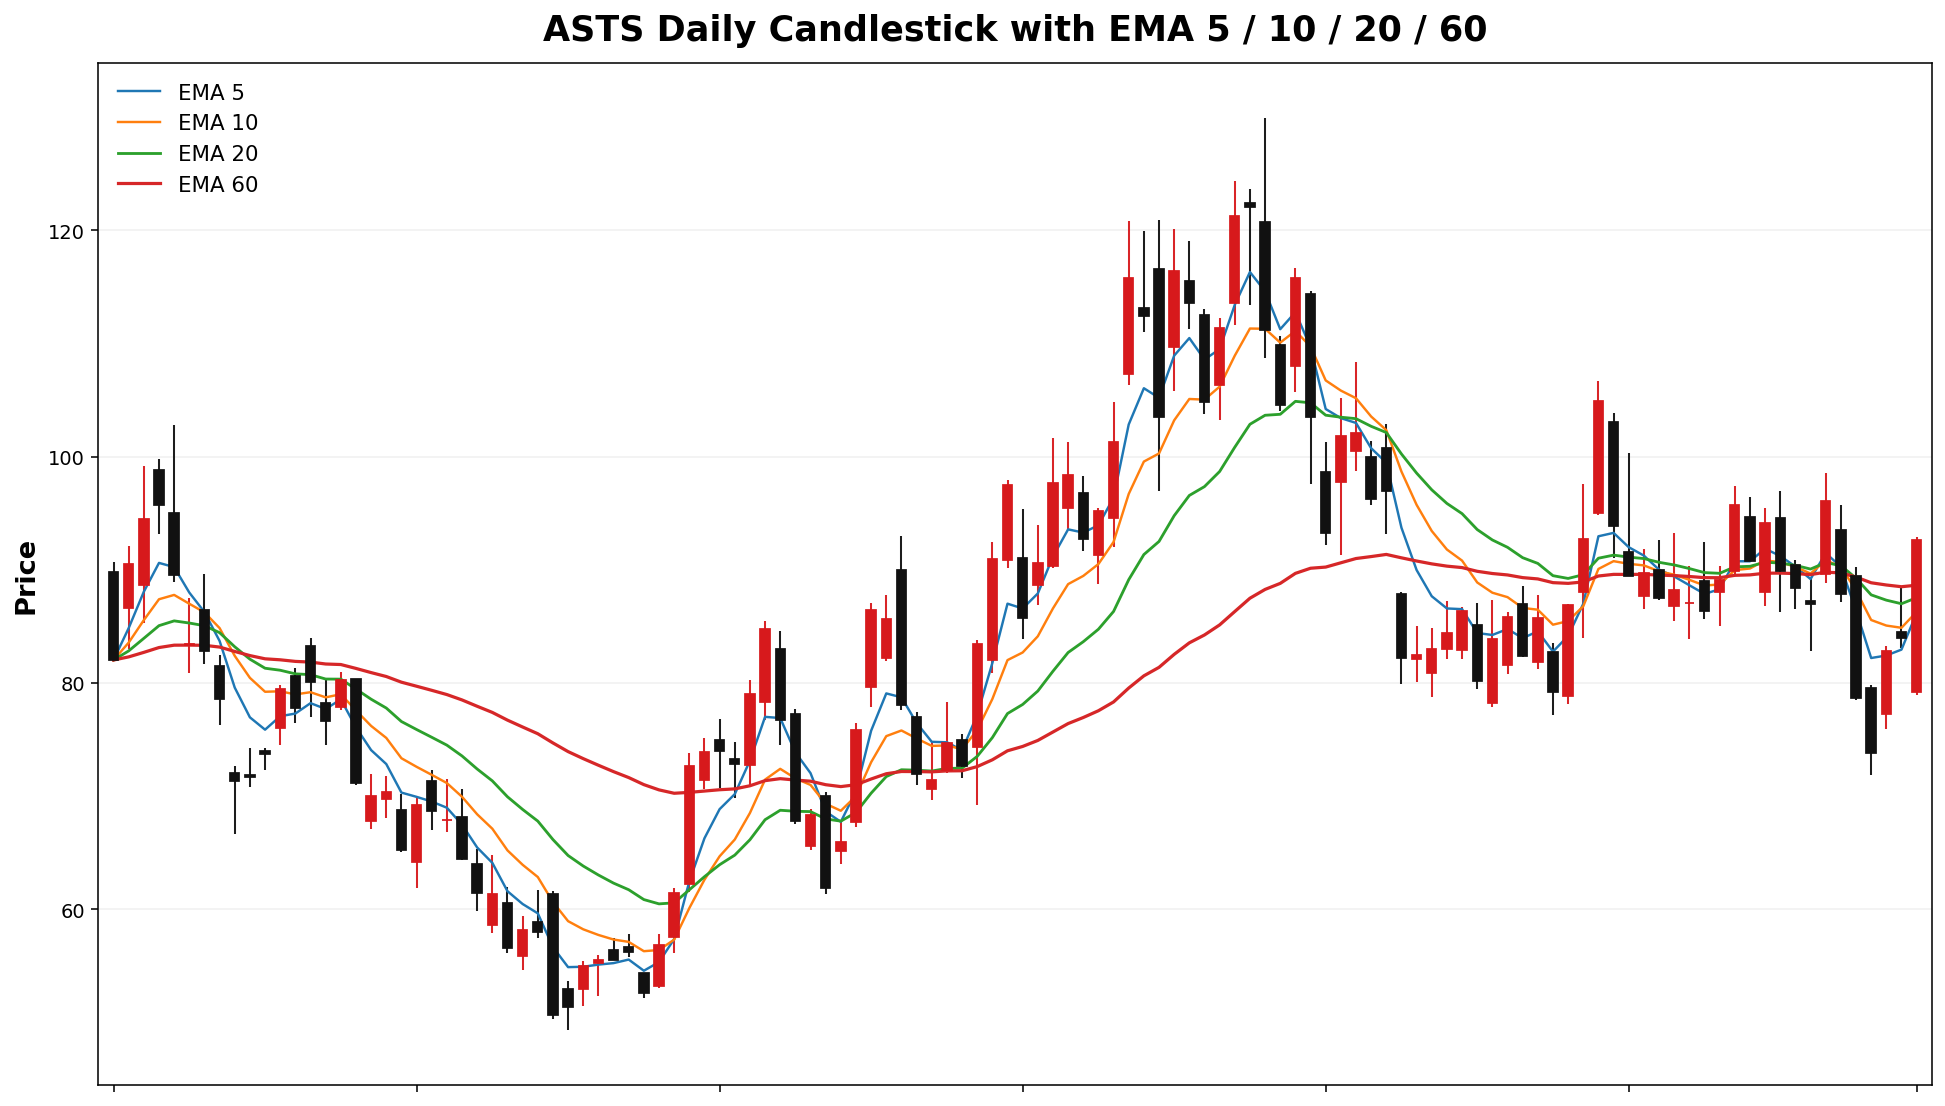
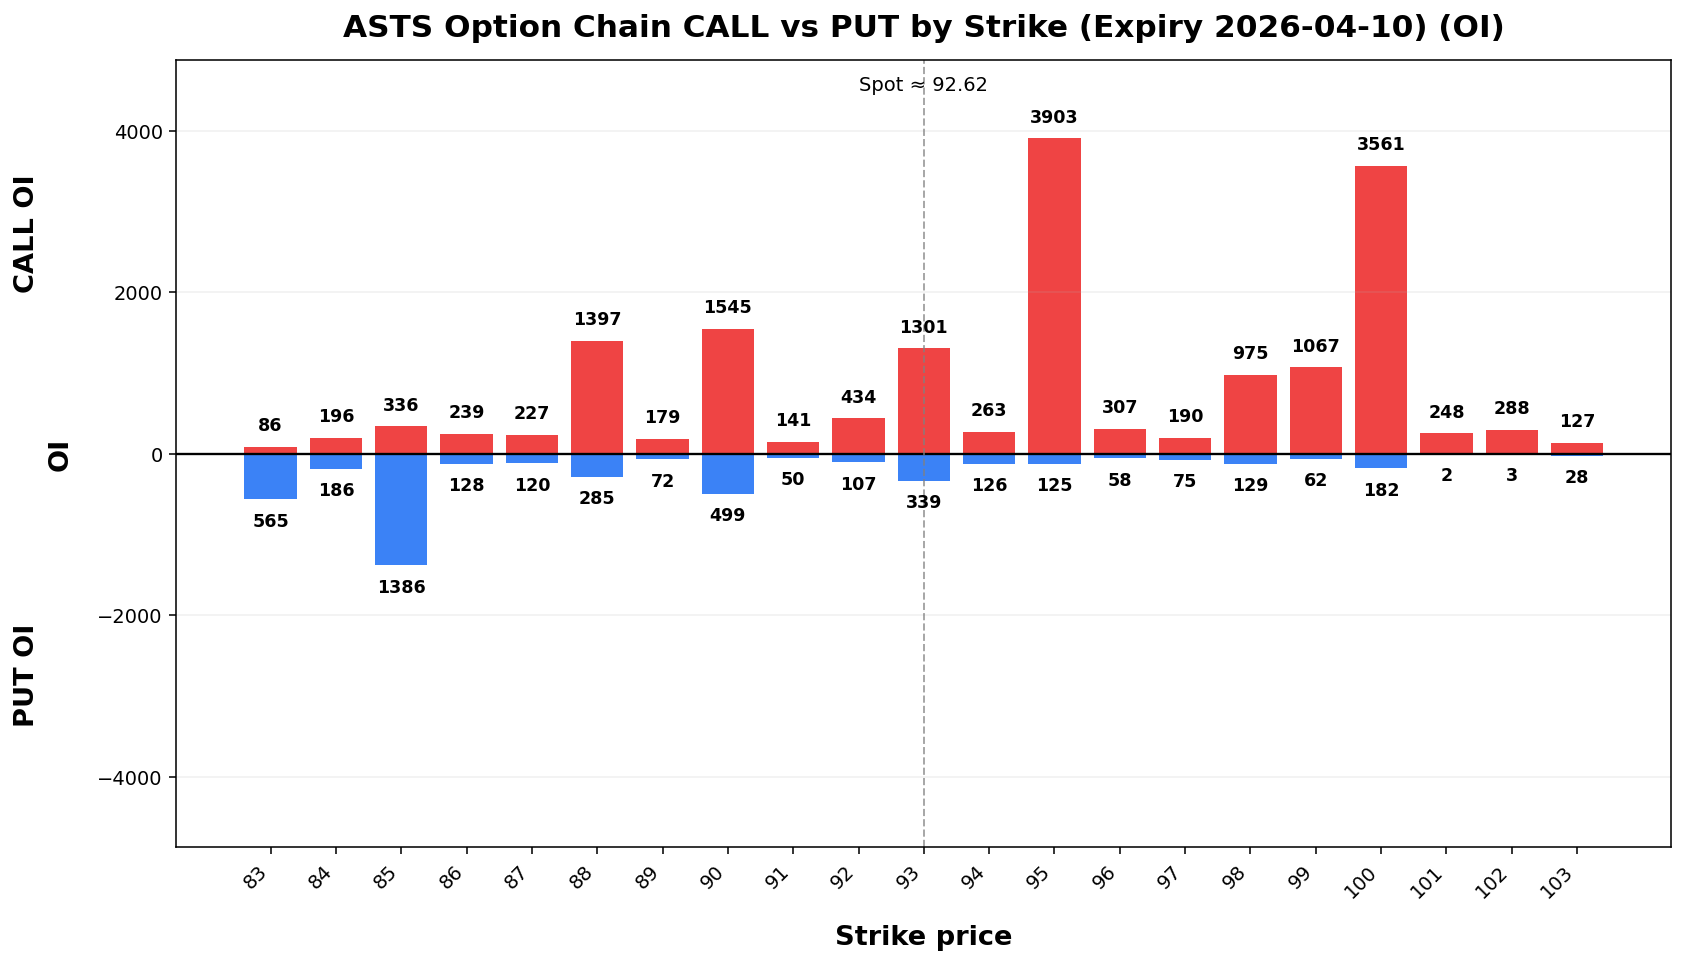
Term Structure
Expiry |
DTE |
Forward |
ATM IV |
ATM Straddle |
|---|
2026-04-10 |
6 |
92.61 |
94.07% |
10.57 |
2026-04-17 |
13 |
92.72 |
87.52% |
14.92 |
Weekly Range
Confidence |
Low |
High |
Width |
|---|
68% |
80.73 |
104.51 |
23.78 |
80% |
77.38 |
107.86 |
30.48 |
90% |
73.06 |
112.18 |
39.12 |
95% |
69.31 |
115.93 |
46.61 |
Structure & Probabilities
Support |
Resistance |
Gamma Flip |
Max Pain |
P>Res |
P<Sup |
|---|
90.00 |
93.00 |
78.42 |
88.00 |
40.0% |
40.5% |
Flow & Skew
Call Vol |
Put Vol |
Vol P/C |
Call OI |
Put OI |
OI P/C |
Skew |
Skew Bias |
|---|
21,065 |
11,496 |
0.55 |
25,103 |
14,550 |
0.58 |
4.20 vol pts |
PUT_SKEW |
Tail Risk
Q10 |
Q50 |
Q90 |
Down Tail |
Up Tail |
Down/Up |
|---|
78.27 |
92.12 |
110.86 |
14.35 |
18.24 |
0.79 |
Daily Technicals
EMA20 |
EMA50 |
VWAP20 |
BB Lower |
BB Mid |
BB Upper |
BB Width |
Vol Ratio |
Path |
|---|
87.54 |
88.64 |
88.26 |
77.34 |
87.96 |
98.59 |
24.15% |
1.36 |
Sideways / Range |
Day Plan
90.00-93.00 range: fade extremes
> 93.00: chase only if hold + vol
< 90.00: risk expand; reduce size
Regime: TRANSITION
Tech: Sideways / Range
Swing Plan
Accumulate: 90.00-90.00
Trim: 93.00-93.00
Add: close > 93.00
Cut: close < 90.00
Best for: transition regime
Raw Text Summary
📌 ASTS @ 92.62 (2026-04-05 06:50 PM MYT)

• Current price is **92.62**. Key support is around **90.00**, and resistance is around **93.00**.
• For the next week, the model’s **68% expected range** is roughly **80.73 to 104.51**.
• A wider **90% range** is about **73.06 to 112.18**.
• Dealer positioning looks **LONG gamma**, so the market behavior is classified as **TRANSITION**.
• The estimated **gamma flip** is near **78.42**. Crossing and holding beyond this area can change the trading behavior.
• Approximate breakout odds: **above resistance 40.0%**, **below support 40.5%** by the target horizon.
• Options skew is tilted toward **puts**, which suggests traders are paying more for downside protection.
• Near-term implied volatility is higher than the next expiry (**IV1 94.07% vs IV2 87.52%**), which suggests **near-term event stress / backwardation**.
• On the daily chart, the stock currently looks like **Sideways / Range**.
• The implied distribution shows **more upside tail potential** than downside tail risk.
SATS
Spot: 128.68
Report Time: 2026-04-05 06:51 PM MYT
Regime: TRANSITION
Dealer Gamma: LONG
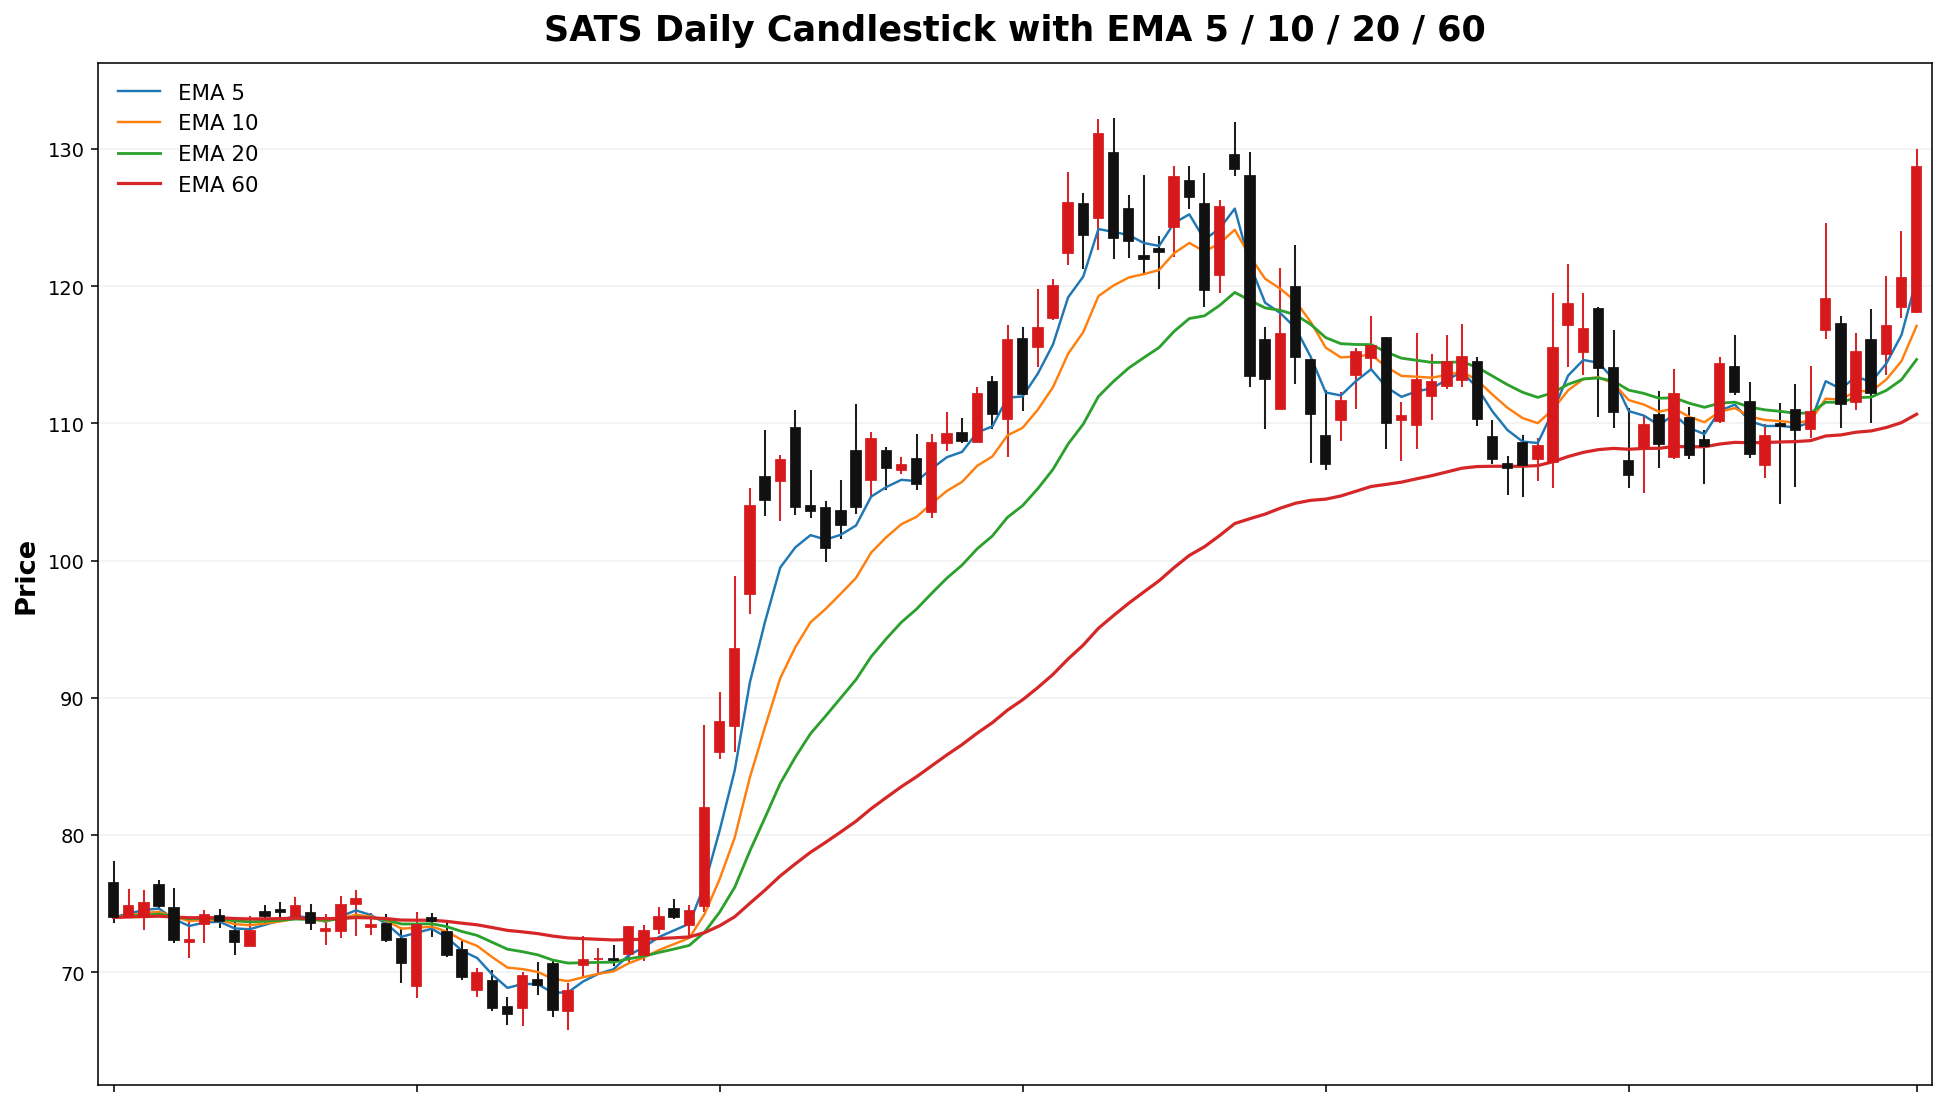
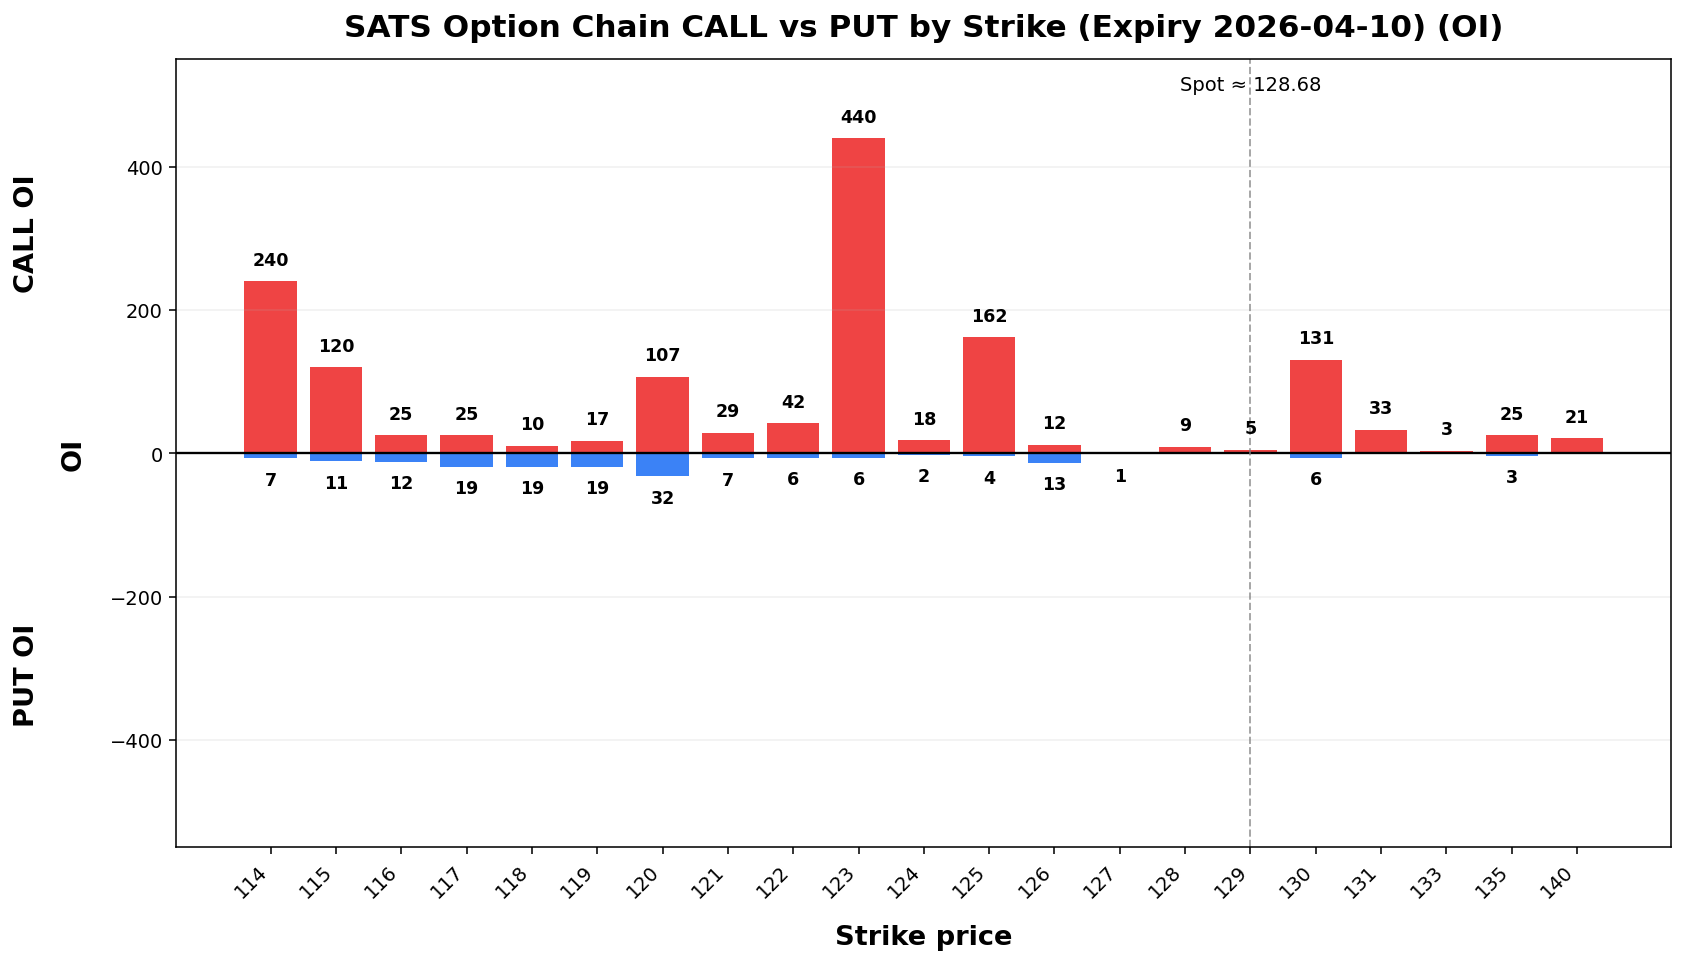
Term Structure
Expiry |
DTE |
Forward |
ATM IV |
ATM Straddle |
|---|
2026-04-10 |
6 |
129.06 |
66.91% |
10.45 |
2026-04-17 |
13 |
127.98 |
59.51% |
14.10 |
Weekly Range
Confidence |
Low |
High |
Width |
|---|
68% |
117.14 |
140.22 |
23.07 |
80% |
113.90 |
143.46 |
29.57 |
90% |
109.70 |
147.66 |
37.95 |
95% |
106.07 |
151.29 |
45.22 |
Structure & Probabilities
Support |
Resistance |
Gamma Flip |
Max Pain |
P>Res |
P<Sup |
|---|
125.00 |
130.00 |
107.33 |
111.00 |
40.6% |
33.5% |
Flow & Skew
Call Vol |
Put Vol |
Vol P/C |
Call OI |
Put OI |
OI P/C |
Skew |
Skew Bias |
|---|
5,317 |
839 |
0.16 |
1,963 |
2,116 |
1.08 |
-0.46 vol pts |
FLAT |
Tail Risk
Q10 |
Q50 |
Q90 |
Down Tail |
Up Tail |
Down/Up |
|---|
113.43 |
124.81 |
150.38 |
15.25 |
21.70 |
0.70 |
Daily Technicals
EMA20 |
EMA50 |
VWAP20 |
BB Lower |
BB Mid |
BB Upper |
BB Width |
Vol Ratio |
Path |
|---|
114.66 |
111.80 |
112.62 |
101.69 |
112.54 |
123.38 |
19.27% |
1.22 |
UP trend (expanding) |
Day Plan
125.00-130.00 range: fade extremes
> 130.00: chase only if hold + vol
< 125.00: risk expand; reduce size
Regime: TRANSITION
Tech: UP trend (expanding)
Swing Plan
Accumulate: 125.00-125.00
Trim: 130.00-130.00
Add: close > 130.00
Cut: close < 125.00
Best for: transition regime
Raw Text Summary
📌 SATS @ 128.68 (2026-04-05 06:51 PM MYT)

• Current price is **128.68**. Key support is around **125.00**, and resistance is around **130.00**.
• For the next week, the model’s **68% expected range** is roughly **117.14 to 140.22**.
• A wider **90% range** is about **109.70 to 147.66**.
• Dealer positioning looks **LONG gamma**, so the market behavior is classified as **TRANSITION**.
• The estimated **gamma flip** is near **107.33**. Crossing and holding beyond this area can change the trading behavior.
• Approximate breakout odds: **above resistance 40.6%**, **below support 33.5%** by the target horizon.
• Options skew is fairly balanced, so there is **no strong directional bias** from skew alone.
• Near-term implied volatility is higher than the next expiry (**IV1 66.91% vs IV2 59.51%**), which suggests **near-term event stress / backwardation**.
• On the daily chart, the stock currently looks like **UP trend (expanding)**.
• The implied distribution shows **more upside tail potential** than downside tail risk.
BKSY
Spot: 30.81
Report Time: 2026-04-05 06:51 PM MYT
Regime: TRANSITION
Dealer Gamma: LONG
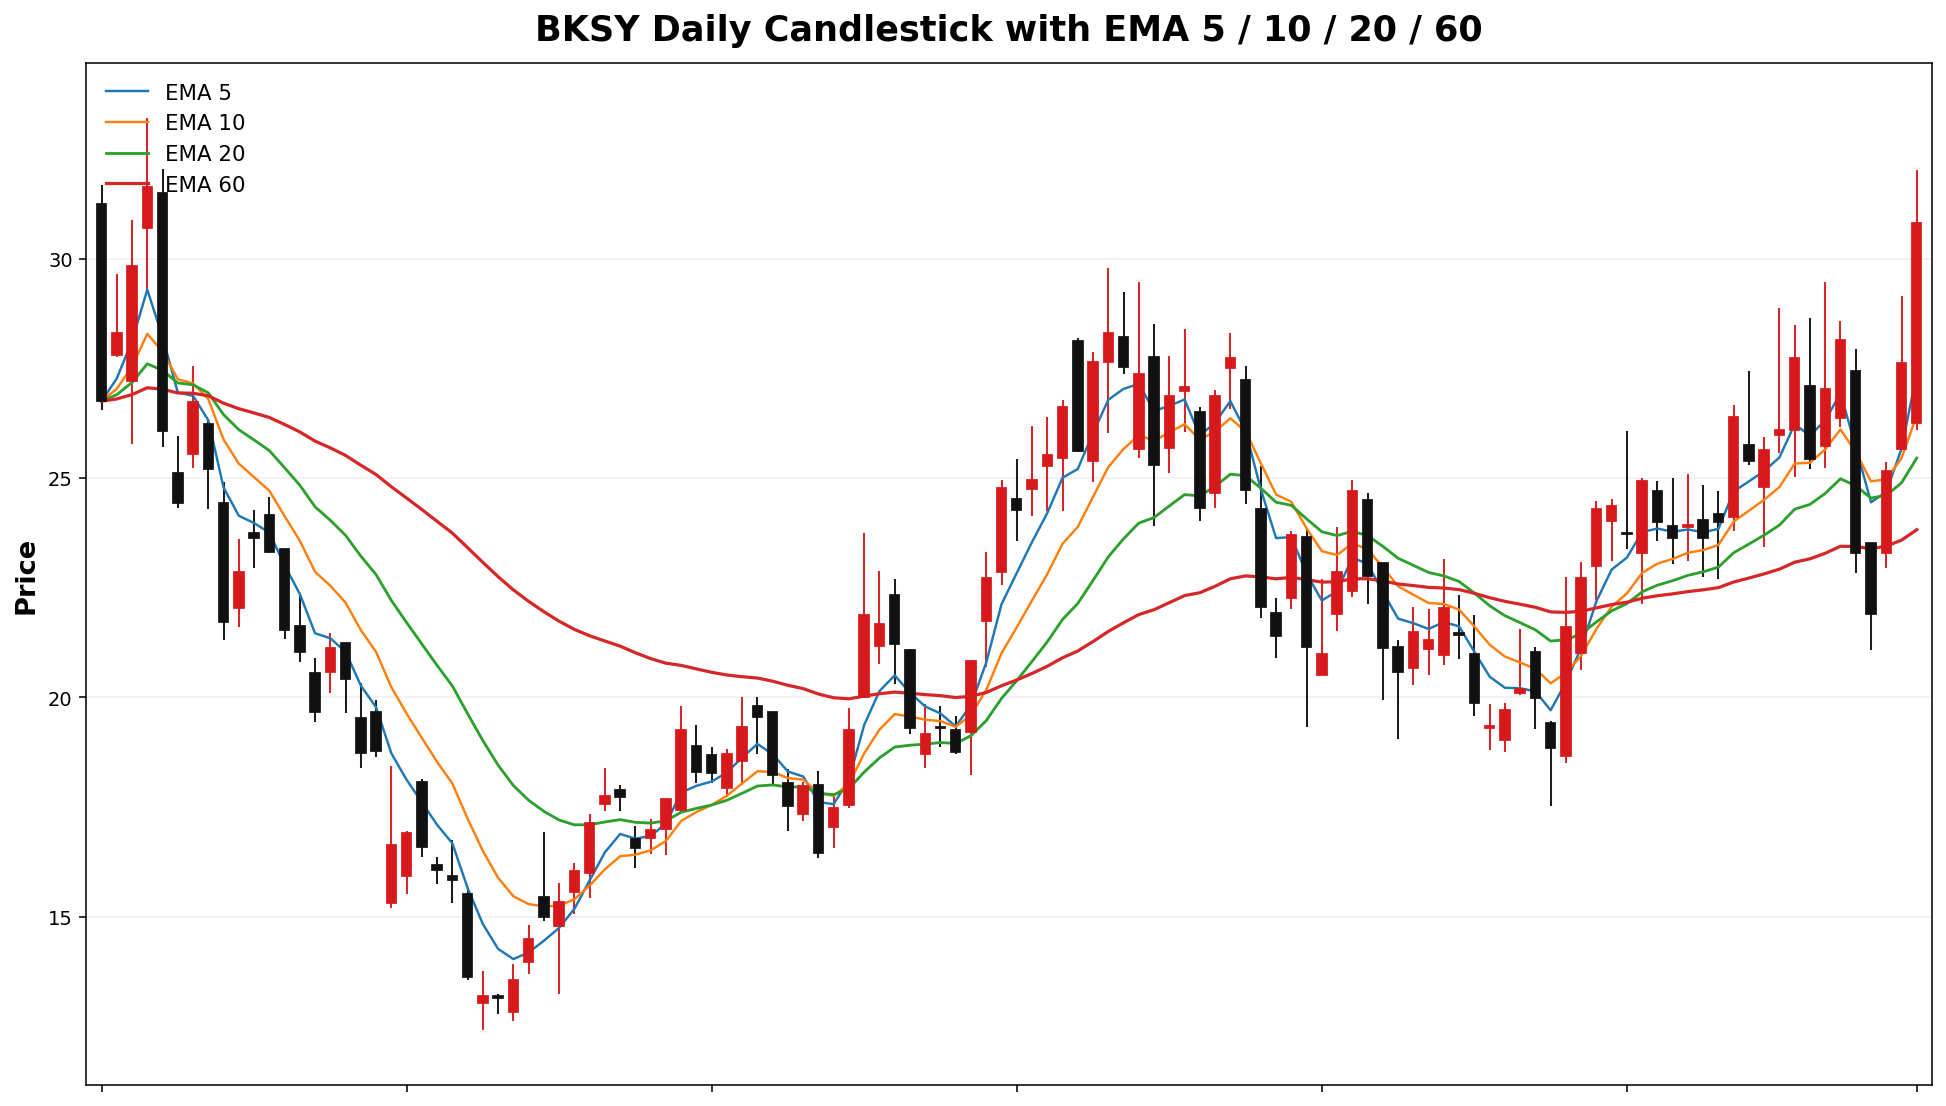
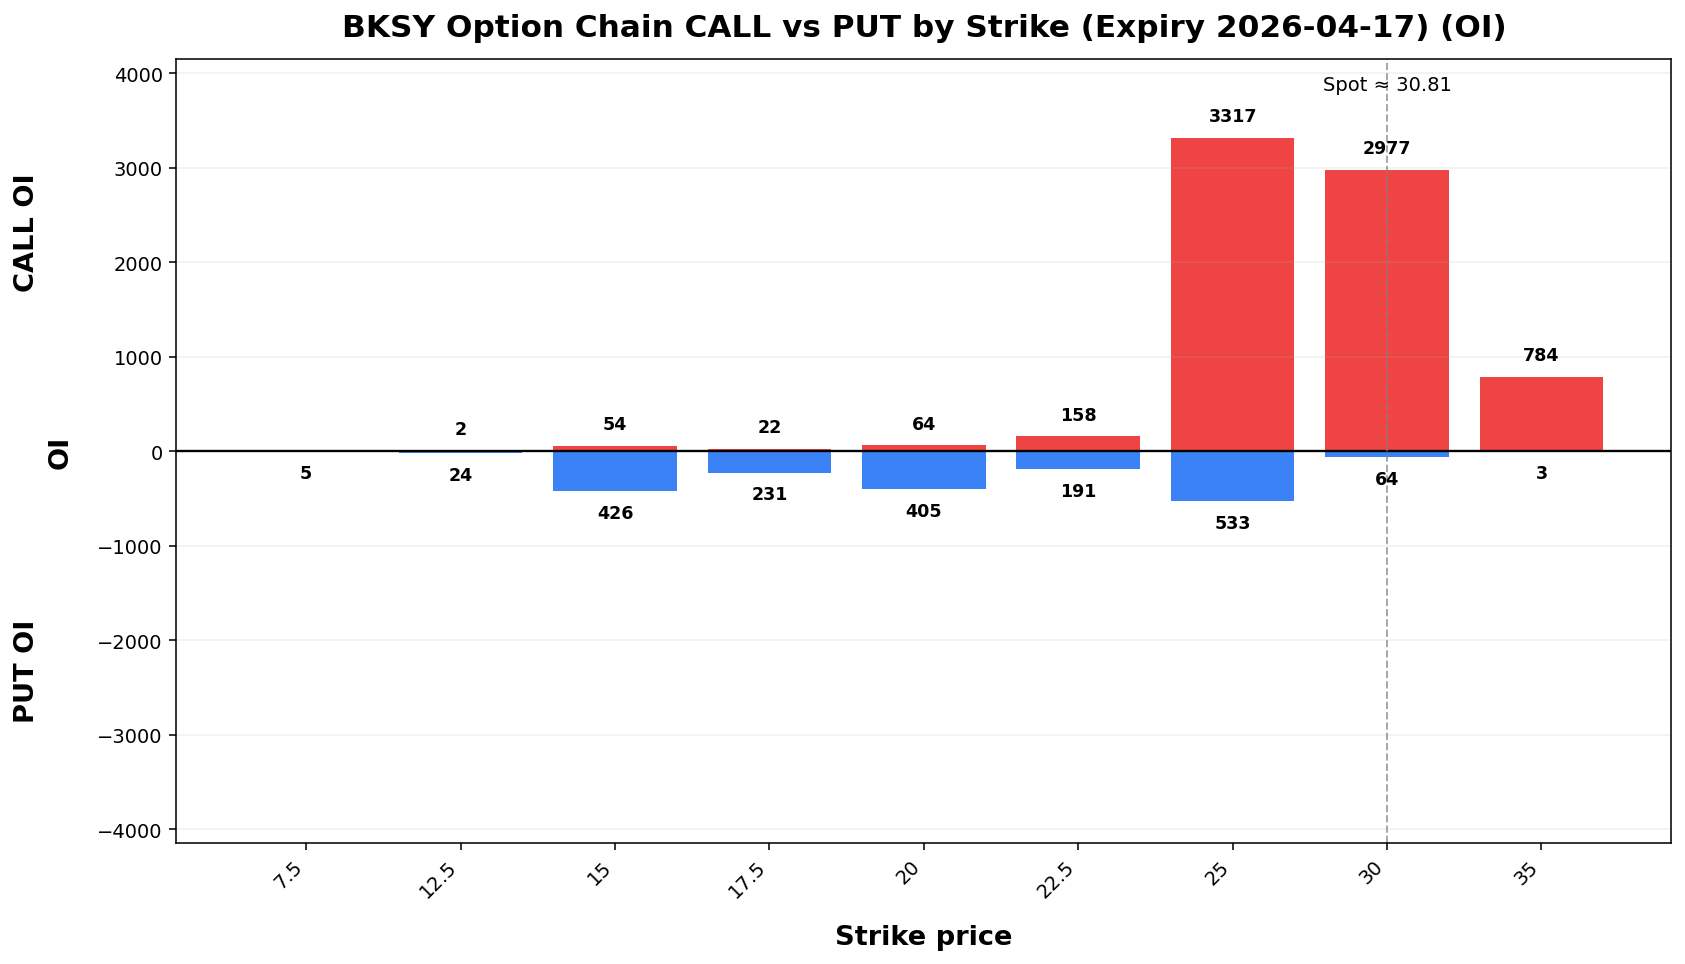
Term Structure
Expiry |
DTE |
Forward |
ATM IV |
ATM Straddle |
|---|
2026-04-17 |
13 |
30.52 |
104.01% |
5.90 |
2026-05-15 |
41 |
30.02 |
101.03% |
10.35 |
Weekly Range
Confidence |
Low |
High |
Width |
|---|
68% |
26.17 |
35.45 |
9.28 |
80% |
24.86 |
36.76 |
11.90 |
90% |
23.17 |
38.45 |
15.27 |
95% |
21.71 |
39.91 |
18.20 |
Structure & Probabilities
Support |
Resistance |
Gamma Flip |
Max Pain |
P>Res |
P<Sup |
|---|
30.00 |
35.00 |
16.56 |
25.00 |
16.9% |
47.4% |
Flow & Skew
Call Vol |
Put Vol |
Vol P/C |
Call OI |
Put OI |
OI P/C |
Skew |
Skew Bias |
|---|
1,020 |
502 |
0.49 |
7,378 |
1,882 |
0.26 |
5.27 vol pts |
PUT_SKEW |
Tail Risk
Q10 |
Q50 |
Q90 |
Down Tail |
Up Tail |
Down/Up |
|---|
15.84 |
23.80 |
32.36 |
14.97 |
1.55 |
9.68 |
Daily Technicals
EMA20 |
EMA50 |
VWAP20 |
BB Lower |
BB Mid |
BB Upper |
BB Width |
Vol Ratio |
Path |
|---|
25.45 |
24.01 |
26.01 |
21.23 |
25.42 |
29.61 |
32.96% |
2.44 |
UP trend (expanding) |
Day Plan
30.00-35.00 range: fade extremes
> 35.00: chase only if hold + vol
< 30.00: risk expand; reduce size
Regime: TRANSITION
Tech: UP trend (expanding)
Swing Plan
Accumulate: 30.00-30.00
Trim: 35.00-35.00
Add: close > 35.00
Cut: close < 30.00
Best for: transition regime
Raw Text Summary
📌 BKSY @ 30.81 (2026-04-05 06:51 PM MYT)

• Current price is **30.81**. Key support is around **30.00**, and resistance is around **35.00**.
• For the next week, the model’s **68% expected range** is roughly **26.17 to 35.45**.
• A wider **90% range** is about **23.17 to 38.45**.
• Dealer positioning looks **LONG gamma**, so the market behavior is classified as **TRANSITION**.
• The estimated **gamma flip** is near **16.56**. Crossing and holding beyond this area can change the trading behavior.
• Approximate breakout odds: **above resistance 16.9%**, **below support 47.4%** by the target horizon.
• Options skew is tilted toward **puts**, which suggests traders are paying more for downside protection.
• Near-term implied volatility is higher than the next expiry (**IV1 104.01% vs IV2 101.03%**), which suggests **near-term event stress / backwardation**.
• Recent volume is **2.44x** the 20-day average, which supports stronger continuation or breakout follow-through.
• On the daily chart, the stock currently looks like **UP trend (expanding)**.
• The implied distribution shows **heavier downside tail risk** than upside tail potential.
SOXL
Spot: 52.75
Report Time: 2026-04-05 06:51 PM MYT
Regime: TRANSITION
Dealer Gamma: LONG
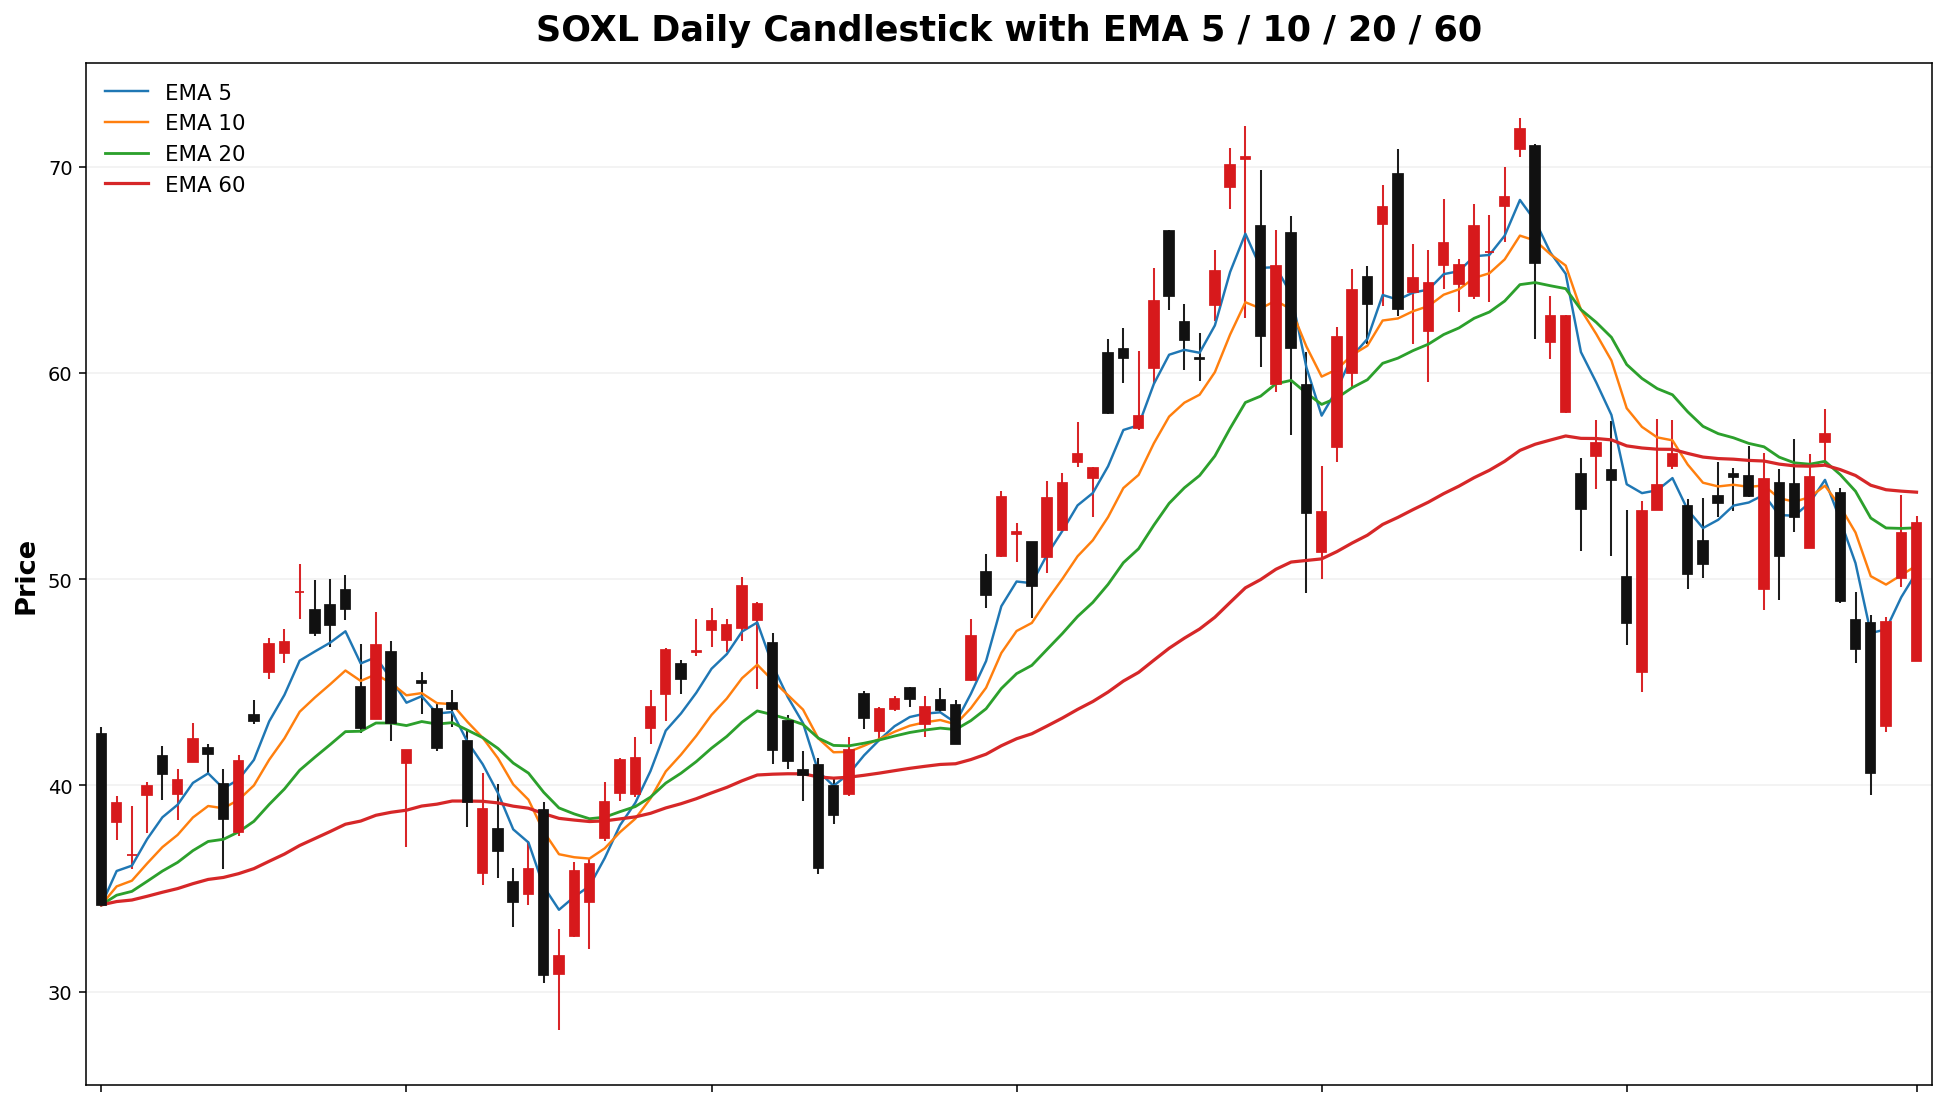
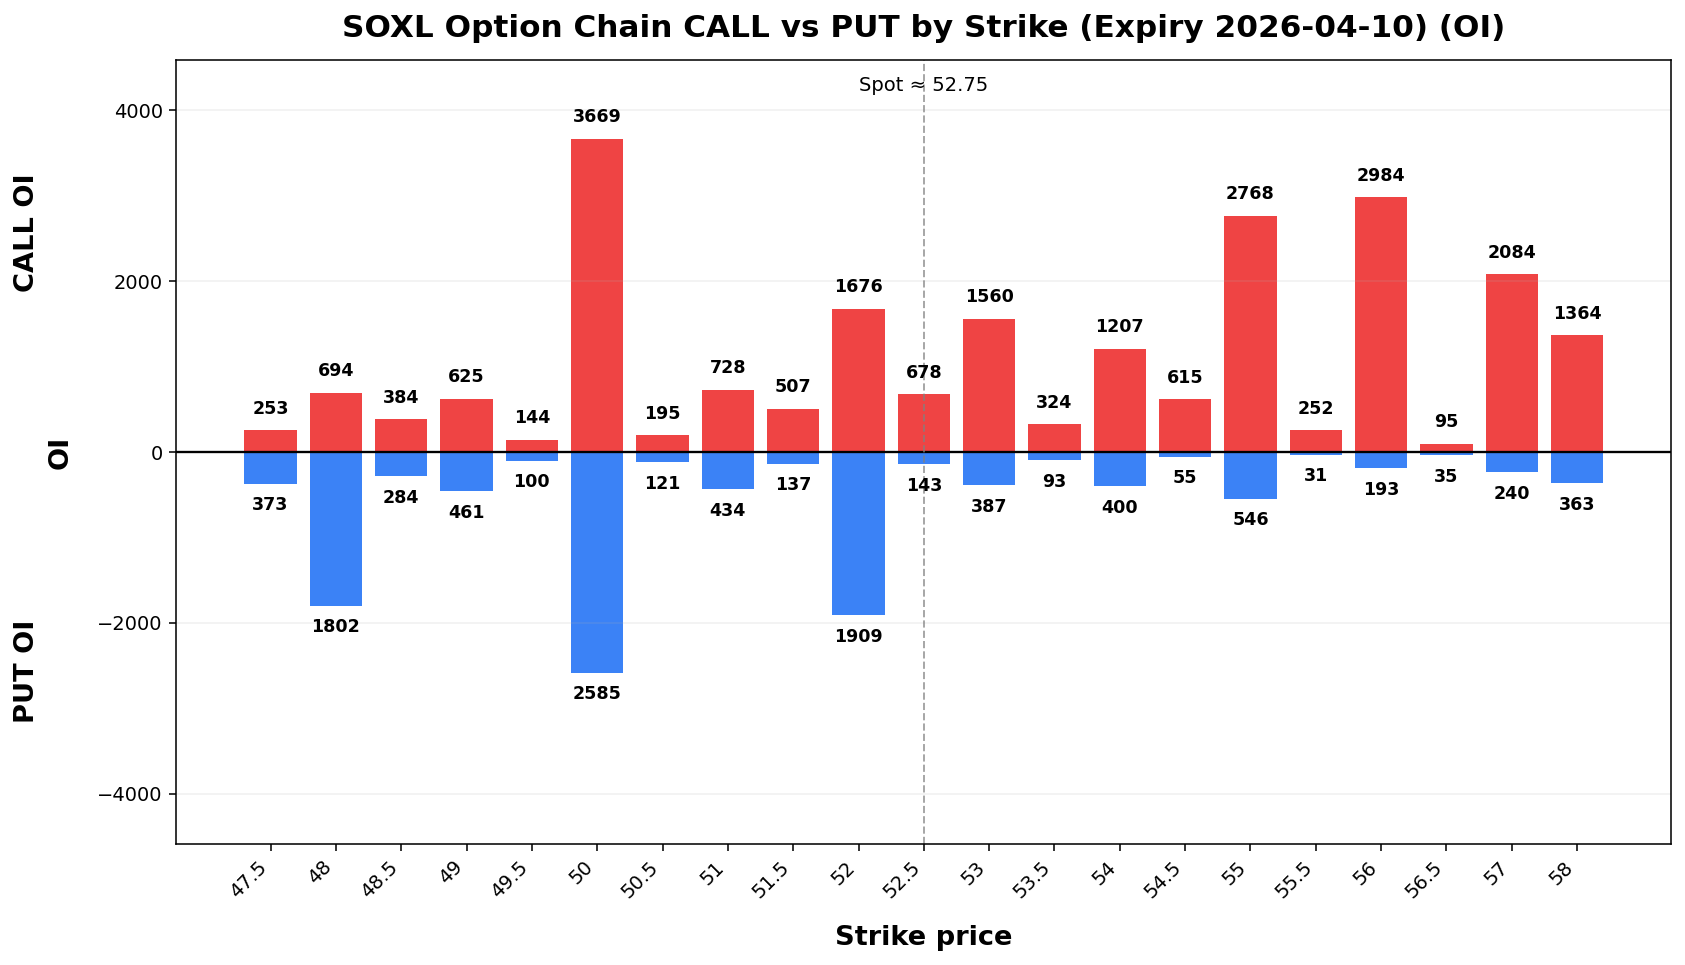
Term Structure
Expiry |
DTE |
Forward |
ATM IV |
ATM Straddle |
|---|
2026-04-10 |
6 |
52.65 |
108.47% |
6.95 |
2026-04-17 |
13 |
52.61 |
103.48% |
10.05 |
Weekly Range
Confidence |
Low |
High |
Width |
|---|
68% |
44.86 |
60.64 |
15.79 |
80% |
42.63 |
62.87 |
20.23 |
90% |
39.77 |
65.73 |
25.97 |
95% |
37.28 |
68.22 |
30.94 |
Structure & Probabilities
Support |
Resistance |
Gamma Flip |
Max Pain |
P>Res |
P<Sup |
|---|
50.00 |
56.00 |
48.12 |
50.00 |
27.9% |
35.7% |
Flow & Skew
Call Vol |
Put Vol |
Vol P/C |
Call OI |
Put OI |
OI P/C |
Skew |
Skew Bias |
|---|
37,013 |
42,119 |
1.14 |
47,945 |
61,806 |
1.29 |
34.18 vol pts |
PUT_SKEW |
Tail Risk
Q10 |
Q50 |
Q90 |
Down Tail |
Up Tail |
Down/Up |
|---|
30.47 |
51.89 |
63.00 |
22.28 |
10.25 |
2.17 |
Daily Technicals
EMA20 |
EMA50 |
VWAP20 |
BB Lower |
BB Mid |
BB Upper |
BB Width |
Vol Ratio |
Path |
|---|
52.49 |
54.47 |
51.38 |
43.96 |
51.78 |
59.61 |
30.21% |
1.02 |
Sideways / Range |
Day Plan
50.00-56.00 range: fade extremes
> 56.00: chase only if hold + vol
< 50.00: risk expand; reduce size
Regime: TRANSITION
Tech: Sideways / Range
Swing Plan
Accumulate: 50.00-50.00
Trim: 56.00-56.00
Add: close > 56.00
Cut: close < 50.00
Best for: transition regime
Raw Text Summary
📌 SOXL @ 52.75 (2026-04-05 06:51 PM MYT)

• Current price is **52.75**. Key support is around **50.00**, and resistance is around **56.00**.
• For the next week, the model’s **68% expected range** is roughly **44.86 to 60.64**.
• A wider **90% range** is about **39.77 to 65.73**.
• Dealer positioning looks **LONG gamma**, so the market behavior is classified as **TRANSITION**.
• The estimated **gamma flip** is near **48.12**. Crossing and holding beyond this area can change the trading behavior.
• Approximate breakout odds: **above resistance 27.9%**, **below support 35.7%** by the target horizon.
• Options skew is tilted toward **puts**, which suggests traders are paying more for downside protection.
• Near-term implied volatility is higher than the next expiry (**IV1 108.47% vs IV2 103.48%72.14%**), which suggests **near-term event stress / backwardation**.
• On the daily chart, the stock currently looks like **Sideways / Range**.
• The implied distribution shows **heavier downside tail risk** than upside tail potential.
VIAVRKLB
Spot: 36.8968.05
Report Time: 2026-04-0512 06:5108:48 PMAM MYT
Regime: TRANSITION
Dealer Gamma: LONG
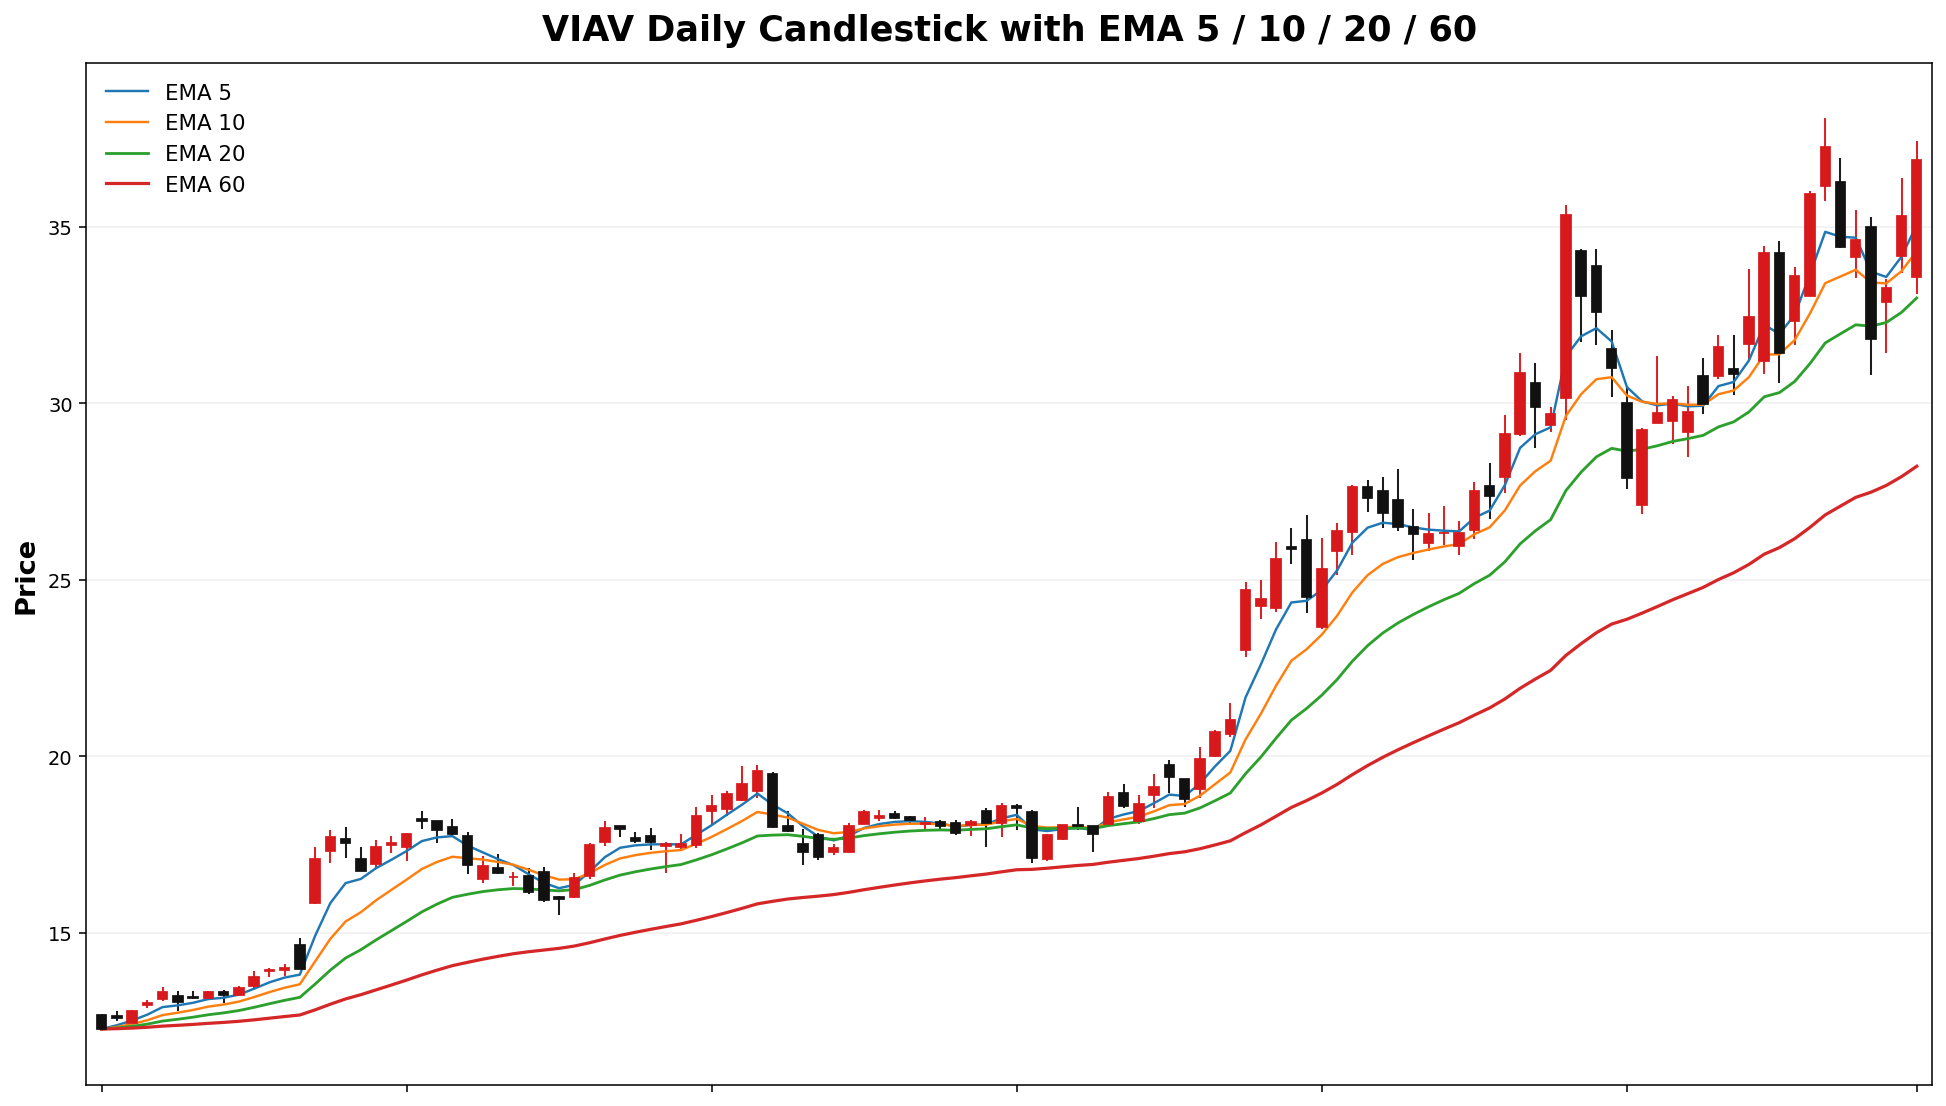
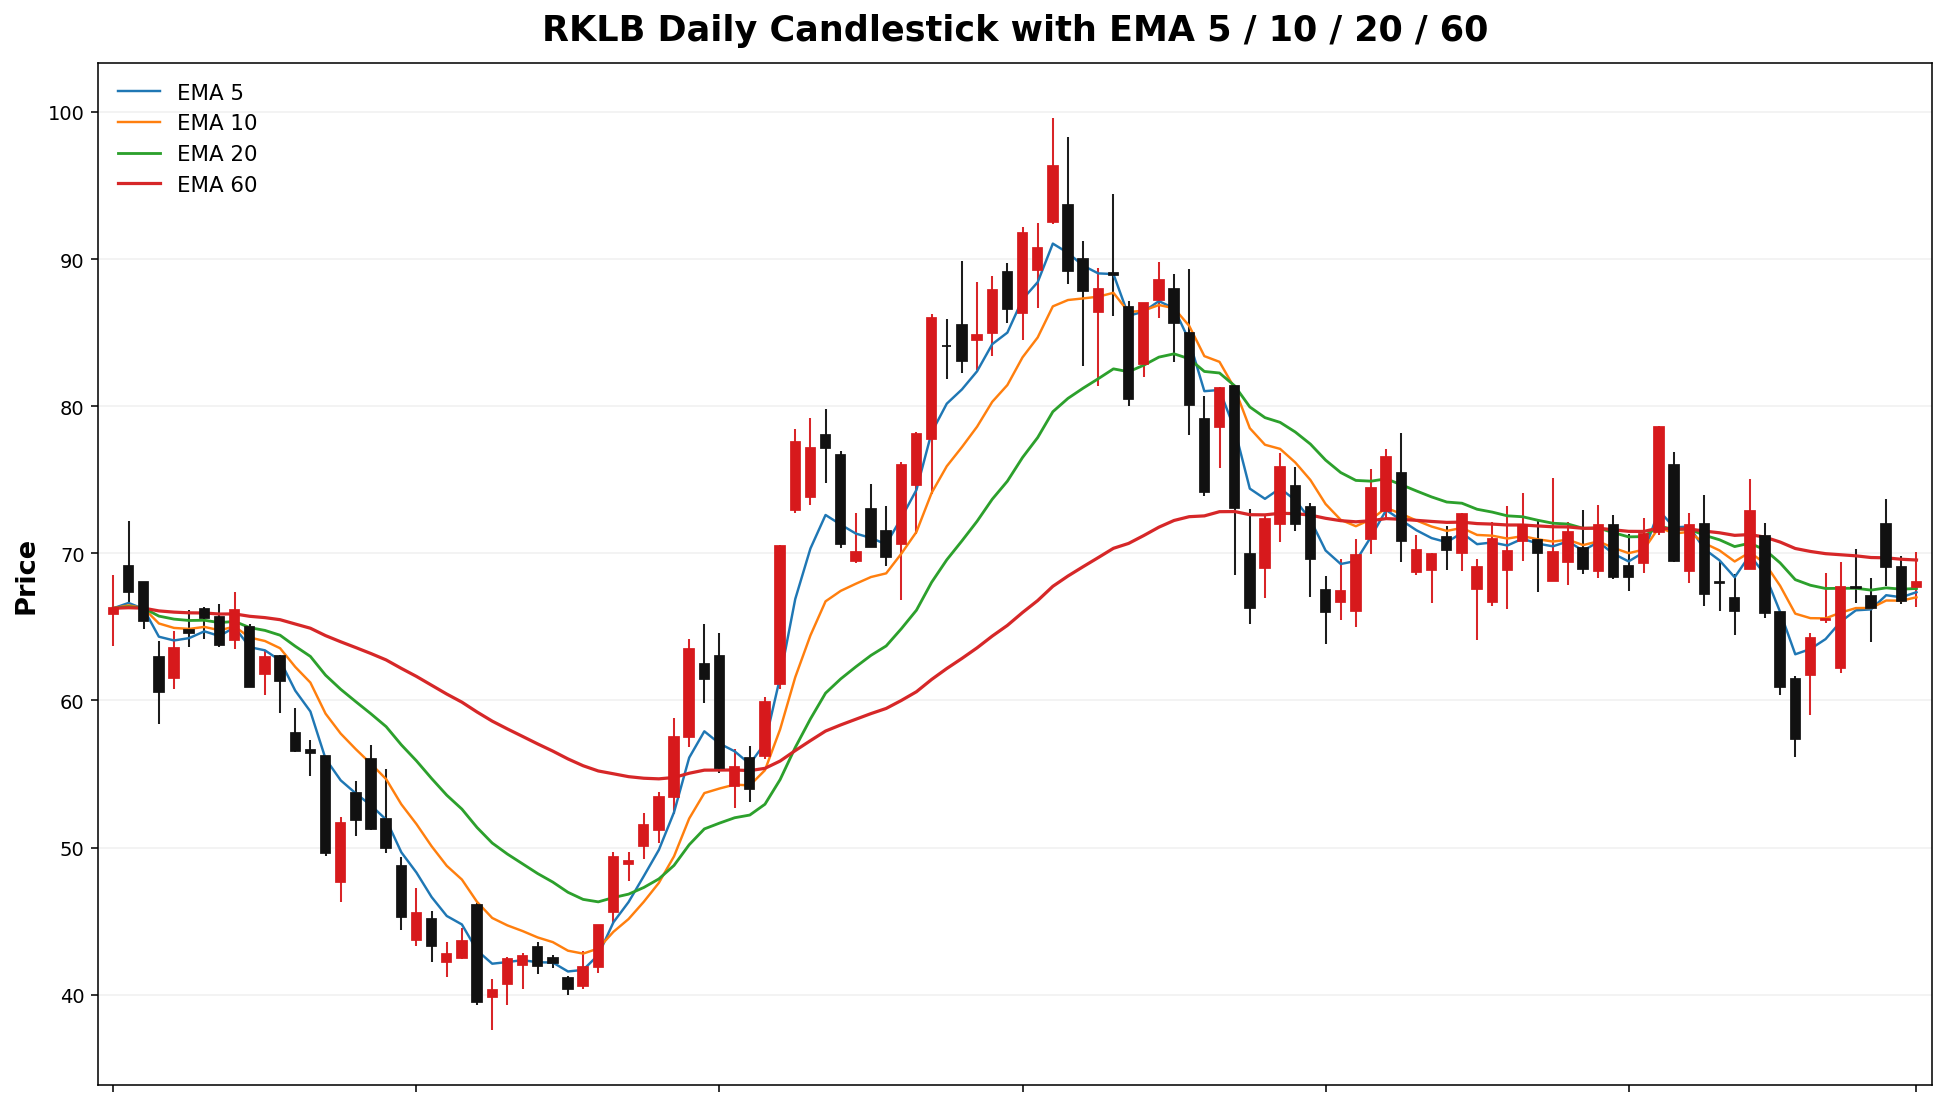
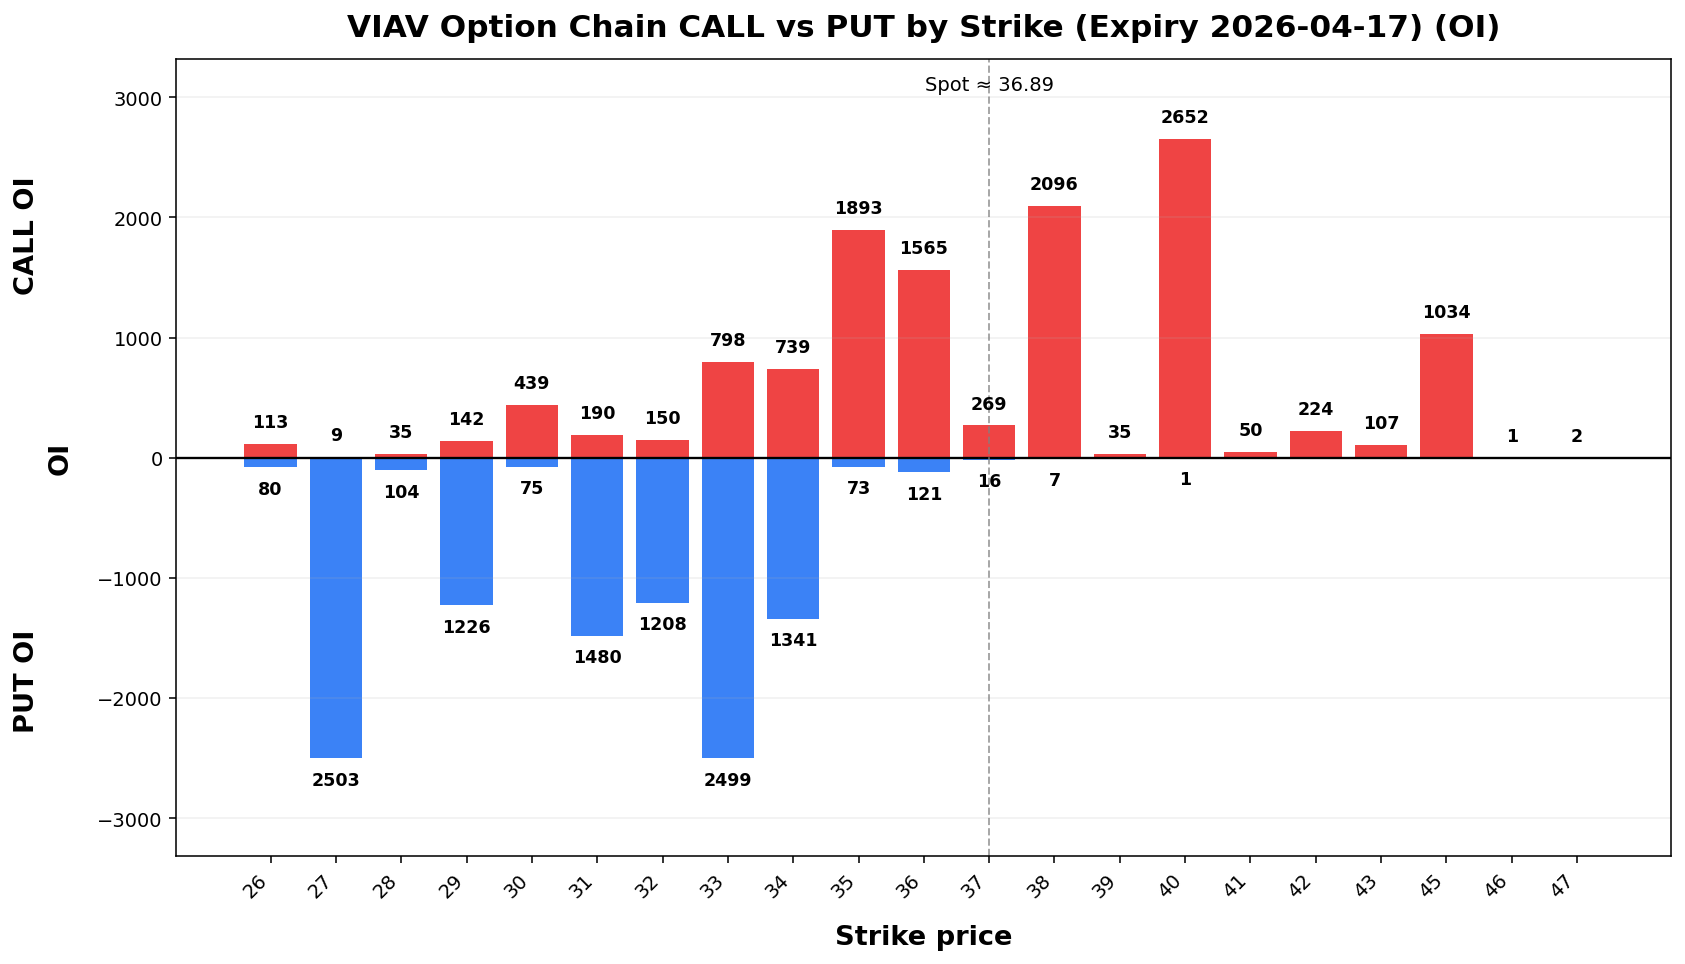
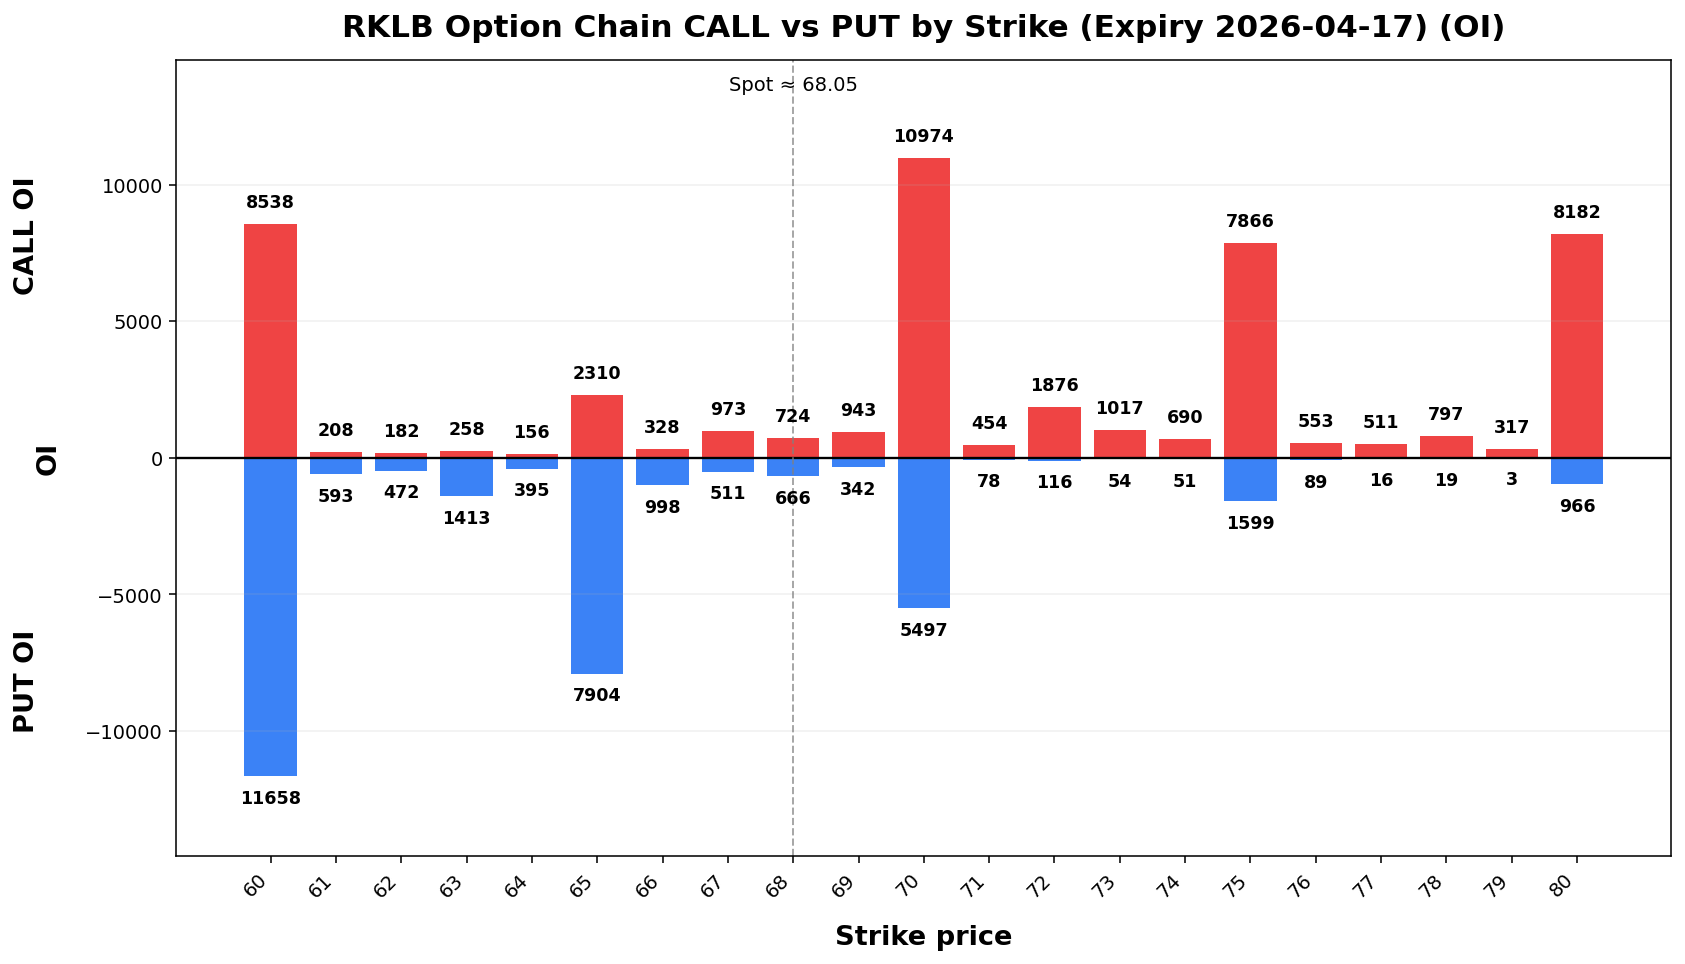
Term Structure
| Expiry |
DTE |
Forward |
ATM IV |
ATM Straddle |
| 2026-04-17 |
136 |
36.7268.07 |
77.67%73.18% |
5.286.27 |
2026-05-1504-24 |
4113 |
36.8368.21 |
73.37%71.24% |
9.0008 |
Weekly Range
| Confidence |
Low |
High |
Width |
| 68% |
32.6461.10 |
41.1475.00 |
8.5013.89 |
| 80% |
31.4459.15 |
42.3476.95 |
10.9017.81 |
| 90% |
29.9056.62 |
43.8879.48 |
13.9922.85 |
| 95% |
28.5654.43 |
45.2281.67 |
16.6727.23 |
Structure & Probabilities
| Support |
Resistance |
Gamma Flip |
Max Pain |
P>Res |
P<Sup |
36.65.00 |
38.70.00 |
32.7664.71 |
33.63.00 |
33.0%29.7% |
34.6%30.2% |
Flow & Skew
| Call Vol |
Put Vol |
Vol P/C |
Call OI |
Put OI |
OI P/C |
Skew |
Skew Bias |
81118,236 |
27217,571 |
0.3496 |
13,020108,862 |
12,71289,299 |
0.98 |
-0.98 vol pts |
FLAT |
Tail Risk
Q10 |
Q50 |
Q90 |
Down Tail |
Up Tail |
Down/Up |
|---|
30.63 |
37.16 |
43.11 |
6.26 |
6.22 |
1.01 |
Daily Technicals
EMA20 |
EMA50 |
VWAP20 |
BB Lower |
BB Mid |
BB Upper |
BB Width |
Vol Ratio |
Path |
|---|
32.99 |
29.26 |
32.74 |
27.10 |
32.52 |
37.94 |
33.33% |
0.78 |
UP trend (expanding) |
Day Plan
36.00-38.00 range: fade extremes
> 38.00: chase only if hold + vol
< 36.00: risk expand; reduce size
Regime: TRANSITION
Tech: UP trend (expanding)
Swing Plan
Accumulate: 36.00-36.00
Trim: 38.00-38.00
Add: close > 38.00
Cut: close < 36.00
Best for: transition regime
Raw Text Summary
📌 VIAV @ 36.89 (2026-04-05 06:51 PM MYT)

• Current price is **36.89**. Key support is around **36.00**, and resistance is around **38.00**.
• For the next week, the model’s **68% expected range** is roughly **32.64 to 41.14**.
• A wider **90% range** is about **29.90 to 43.88**.
• Dealer positioning looks **LONG gamma**, so the market behavior is classified as **TRANSITION**.
• The estimated **gamma flip** is near **32.76**. Crossing and holding beyond this area can change the trading behavior.
• Approximate breakout odds: **above resistance 33.0%**, **below support 34.6%** by the target horizon.
• Options skew is fairly balanced, so there is **no strong directional bias** from skew alone.
• Near-term implied volatility is higher than the next expiry (**IV1 77.67% vs IV2 73.37%**), which suggests **near-term event stress / backwardation**.
• Recent volume is only **0.78x** the 20-day average, so breakouts may be less reliable unless volume improves.
• On the daily chart, the stock currently looks like **UP trend (expanding)**.
• The implied distribution is **fairly balanced** between upside and downside tails.
RKLB
Spot: 67.73
Report Time: 2026-04-05 06:51 PM MYT
Regime: TRANSITION
Dealer Gamma: LONG
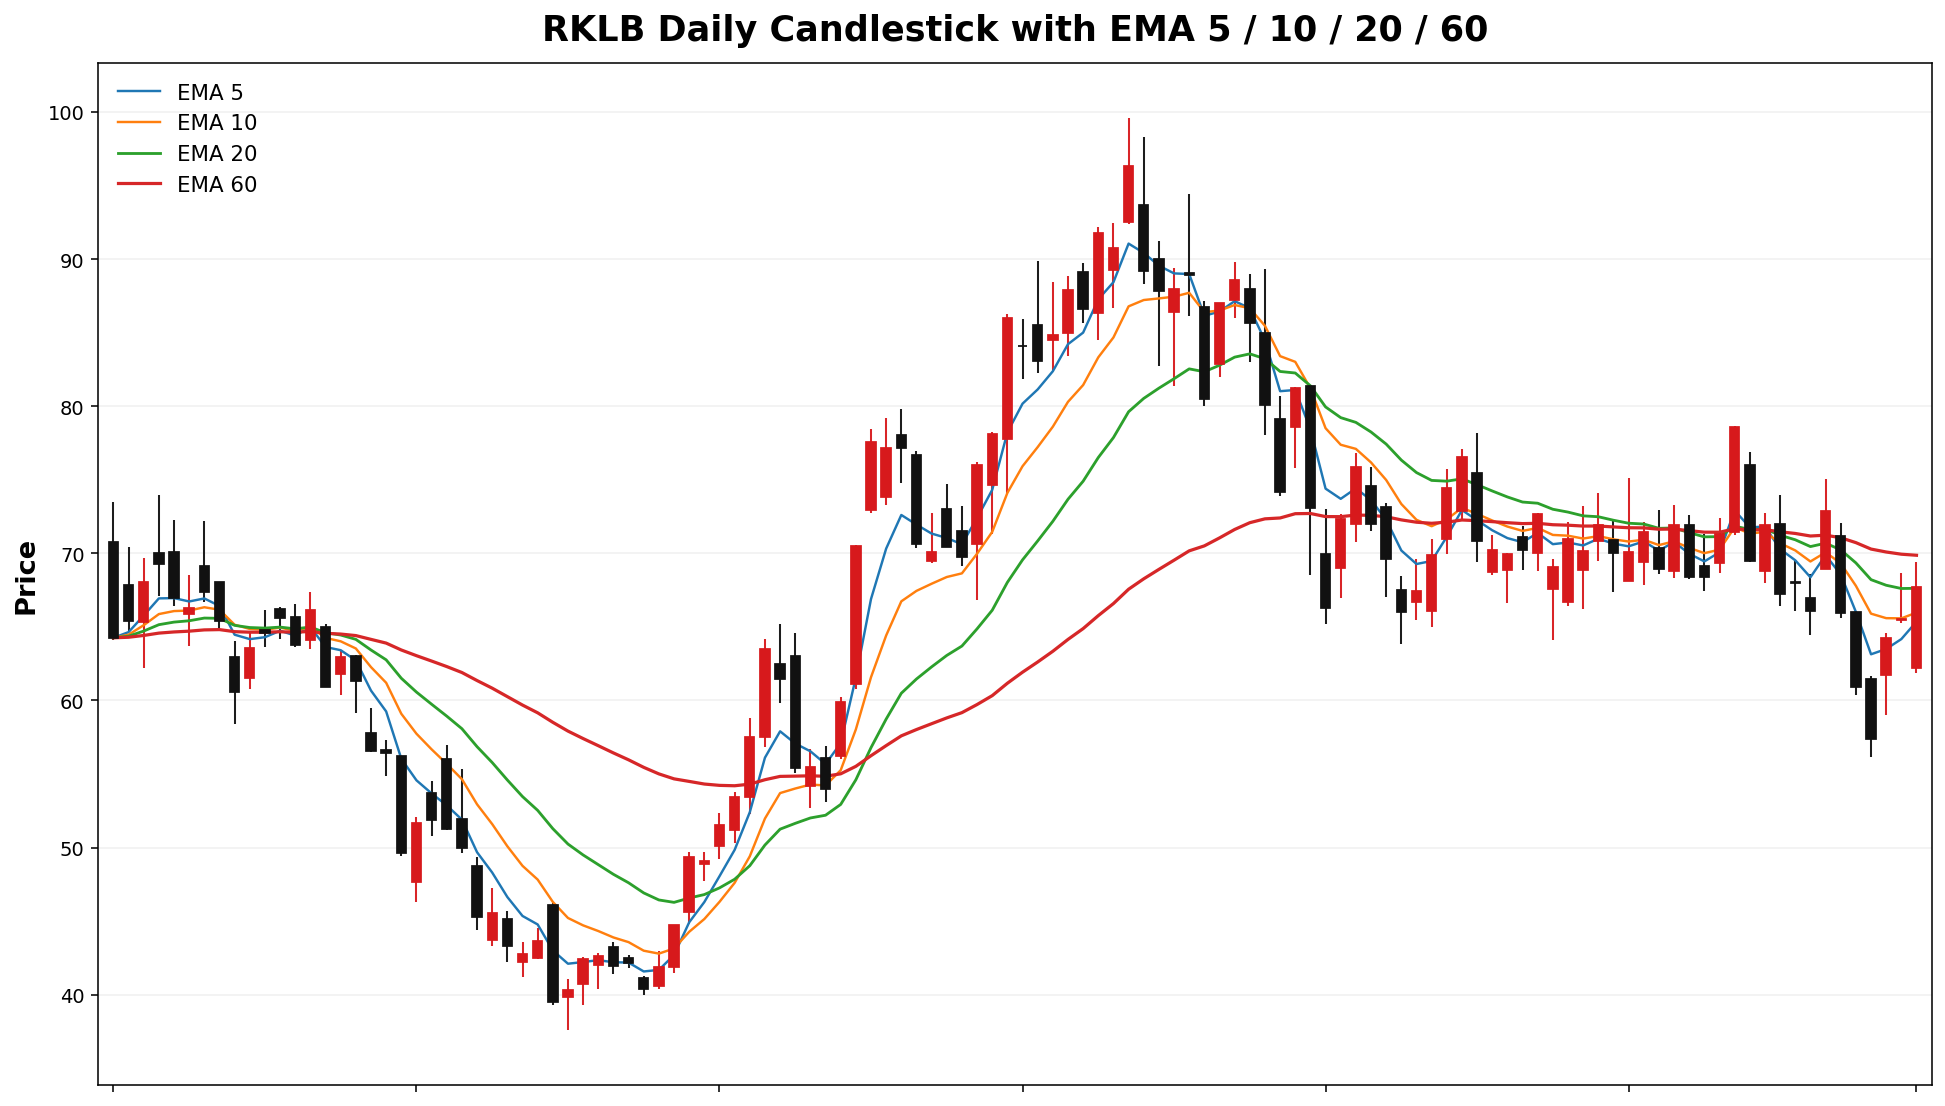
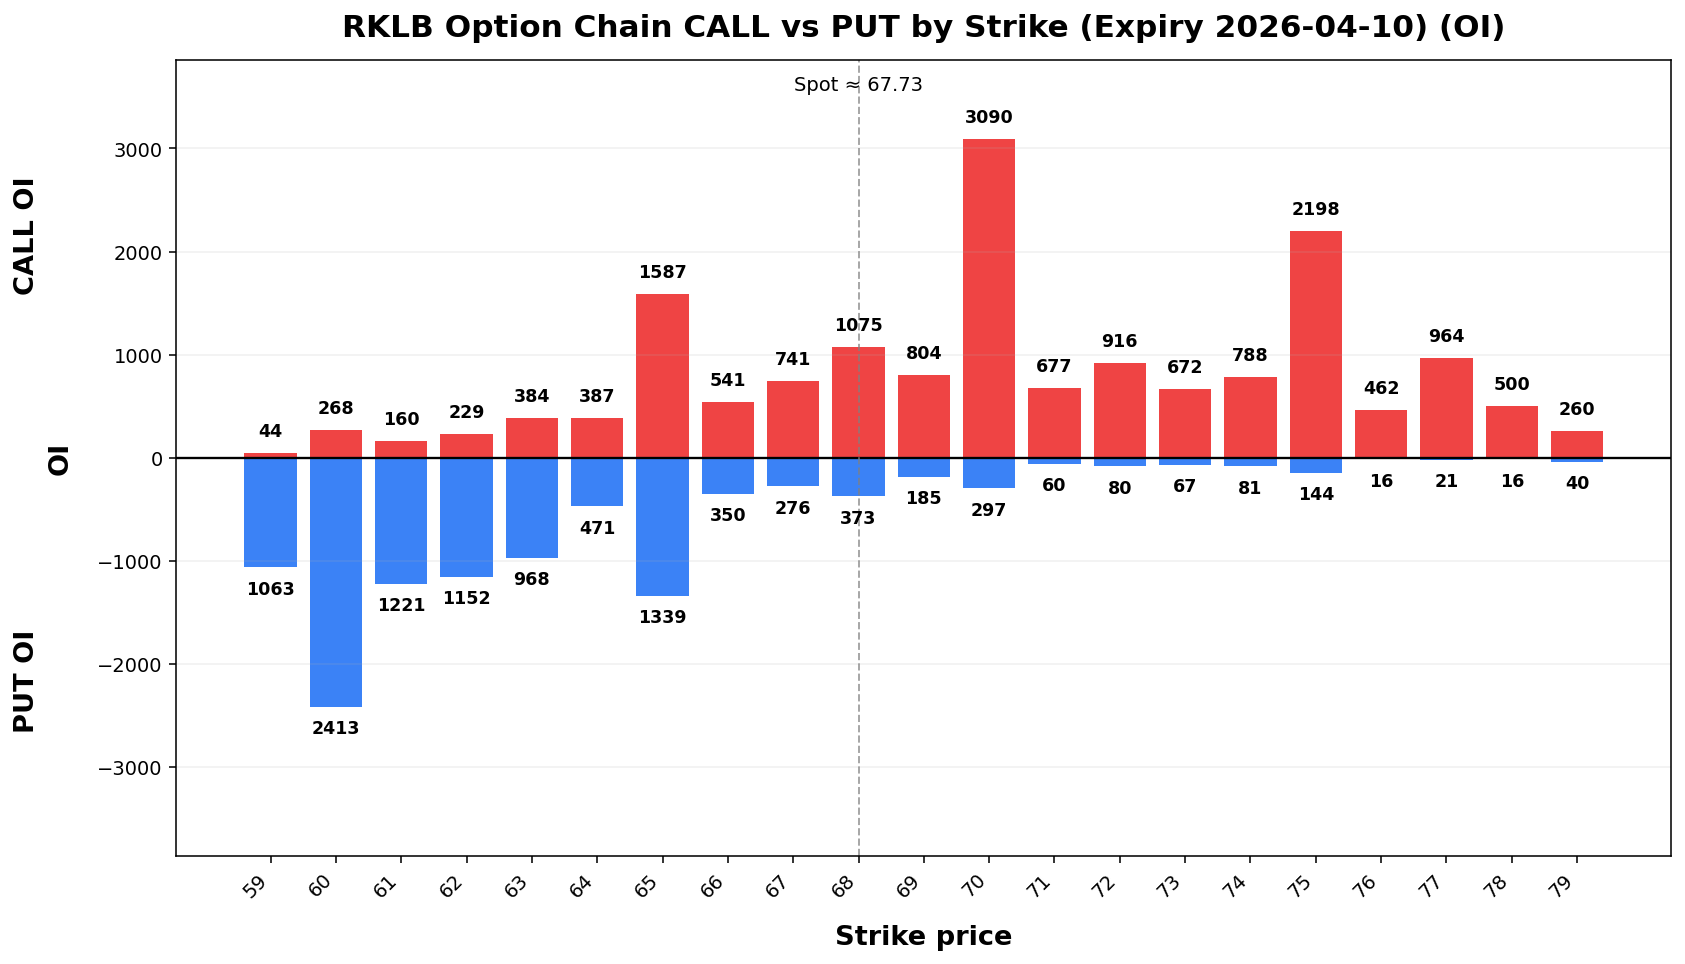
Term Structure
Expiry |
DTE |
Forward |
ATM IV |
ATM Straddle |
|---|
2026-04-10 |
6 |
67.71 |
83.63% |
6.88 |
2026-04-17 |
13 |
67.61 |
78.79% |
9.82 |
Weekly Range
Confidence |
Low |
High |
Width |
|---|
68% |
59.96 |
75.50 |
15.54 |
80% |
57.77 |
77.69 |
19.92 |
90% |
54.95 |
80.51 |
25.57 |
95% |
52.50 |
82.96 |
30.46 |
Structure & Probabilities
Support |
Resistance |
Gamma Flip |
Max Pain |
P>Res |
P<Sup |
|---|
65.00 |
70.00 |
62.19 |
65.00 |
31.6% |
35.6% |
Flow & Skew
Call Vol |
Put Vol |
Vol P/C |
Call OI |
Put OI |
OI P/C |
Skew |
Skew Bias |
|---|
20,932 |
10,817 |
0.52 |
26,055 |
14,381 |
0.55 |
2.9354 vol pts |
PUT_SKEW |
Tail Risk
| Q10 |
Q50 |
Q90 |
Down Tail |
Up Tail |
Down/Up |
52.7848.41 |
63.6067.23 |
78.8377.91 |
14.9519.64 |
11.109.86 |
1.3599 |
Daily Technicals
| EMA20 |
EMA50 |
VWAP20 |
BB Lower |
BB Mid |
BB Upper |
BB Width |
Vol Ratio |
Path |
67.6261 |
69.7233 |
68.7225 |
59.2958.97 |
68.3267.67 |
77.3676.38 |
26.45%25.73% |
1.340.74 |
DOWN trend (expanding) |
Day Plan
- 65.00-70.00 range: fade extremes
- > 70.00: chase only if hold + vol
- < 65.00: risk expand; reduce size
- Regime: TRANSITION
- Tech: DOWN trend (expanding)
Swing Plan
- Accumulate: 65.00-65.00
- Trim: 70.00-70.00
- Add: close > 70.00
- Cut: close < 65.00
- Best for: transition regime
Raw Text Summary
📌 RKLB @ 67.7368.05 (2026-04-0512 06:5108:48 PMAM MYT)

• Current price is **67.73*68.05**. Key support is around **65.00**, and resistance is around **70.00**.
• For the next week, the model’s **68% expected range** is roughly **59.9661.10 to 75.50*00**.
• A wider **90% range** is about **54.9556.62 to 80.51*79.48**.
• Dealer positioning looks **LONG gamma**, so the market behavior is classified as **TRANSITION**.
• The estimated **gamma flip** is near **62.19*64.71**. Crossing and holding beyond this area can change the trading behavior.
• Approximate breakout odds: **above resistance 31.6%29.7%**, **below support 35.6%30.2%** by the target horizon.
• Options skew is tilted toward **puts**, which suggests traders are paying more for downside protection.
• Near-term implied volatility is higher than the next expiry (**IV1 83.63%73.18% vs IV2 78.79%71.24%**), which suggests **near-term event stress / backwardation**.
• Recent volume is only **0.74x** the 20-day average, so breakouts may be less reliable unless volume improves.
• On the daily chart, the stock currently looks like **DOWN trend (expanding)**.
• The implied distribution shows **heavier downside tail risk** than upside tail potential.
ALBAGQ
Spot: 178.09122.21
Report Time: 2026-04-0512 06:5108:48 PMAM MYT
Regime: TRANSITION
Dealer Gamma: LONG
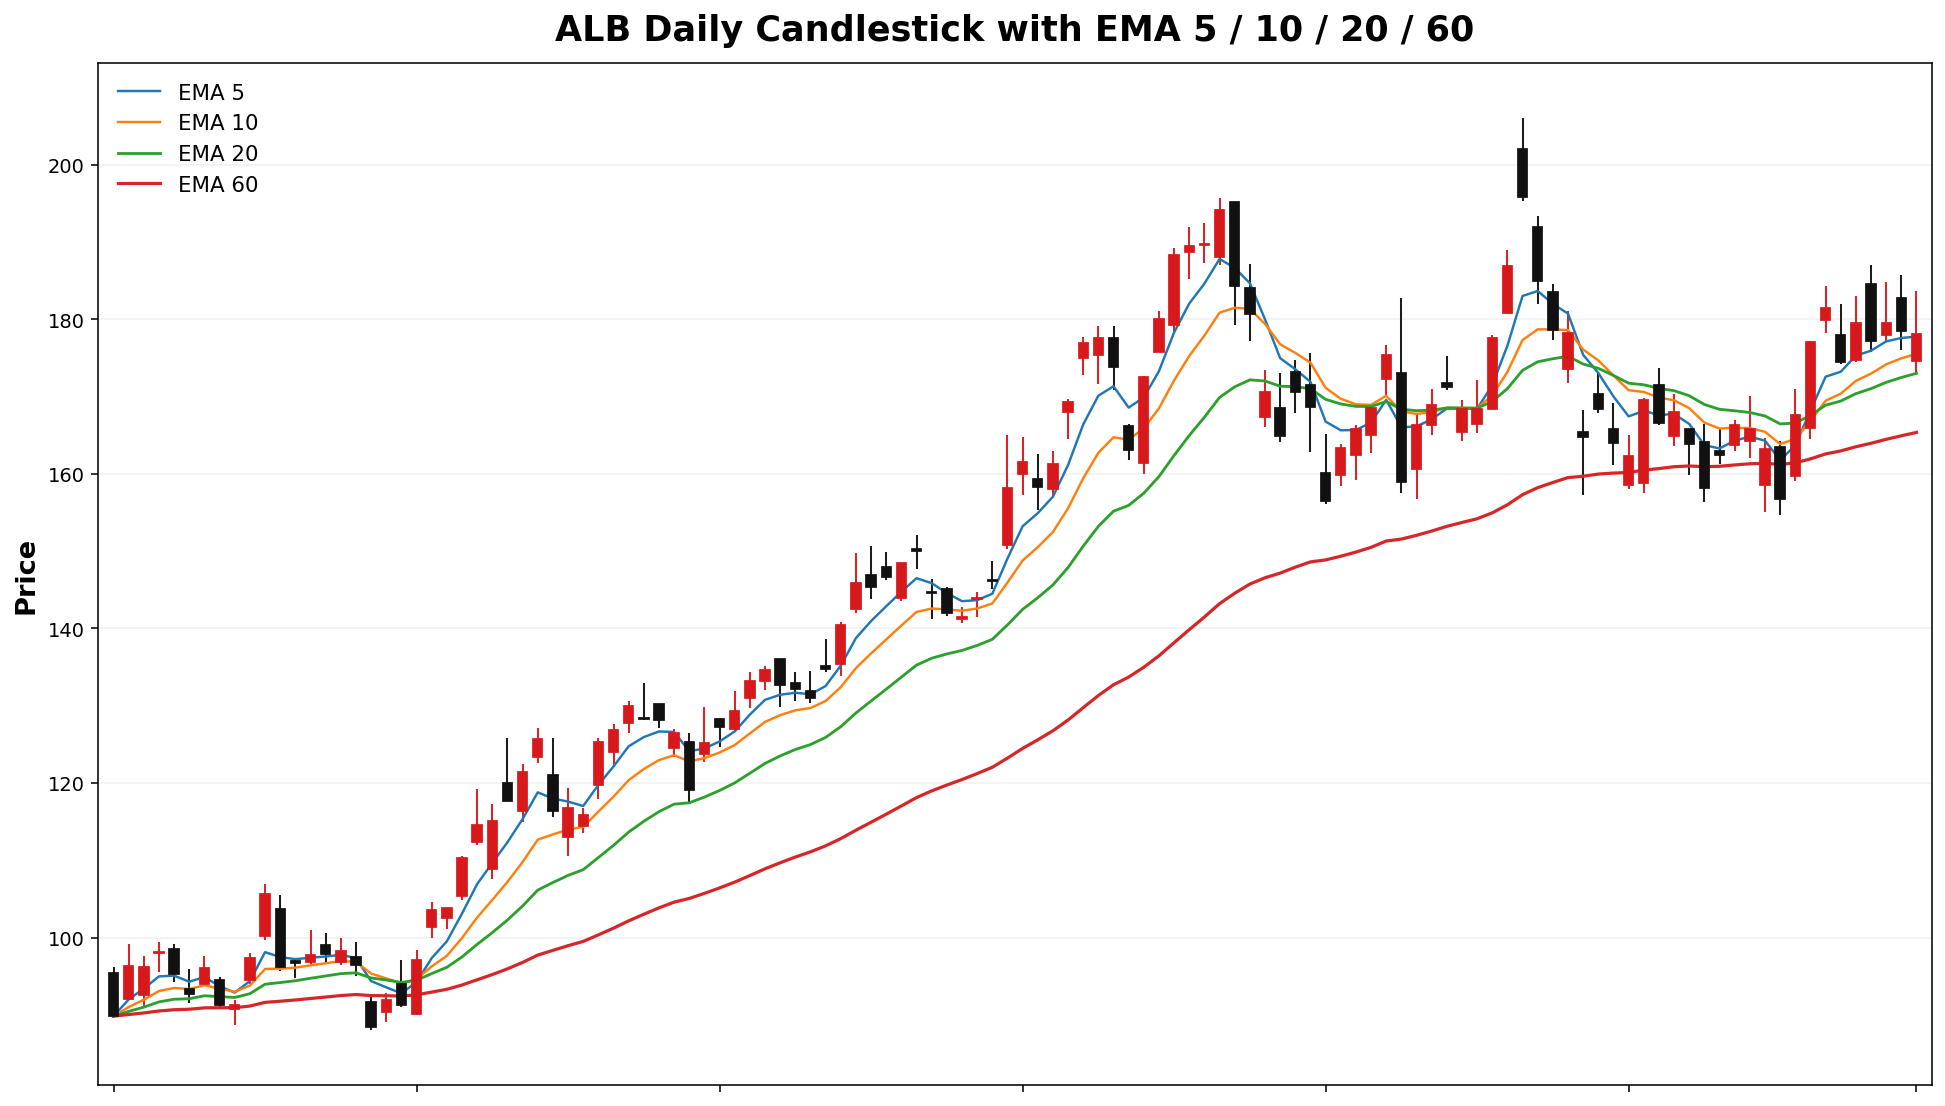
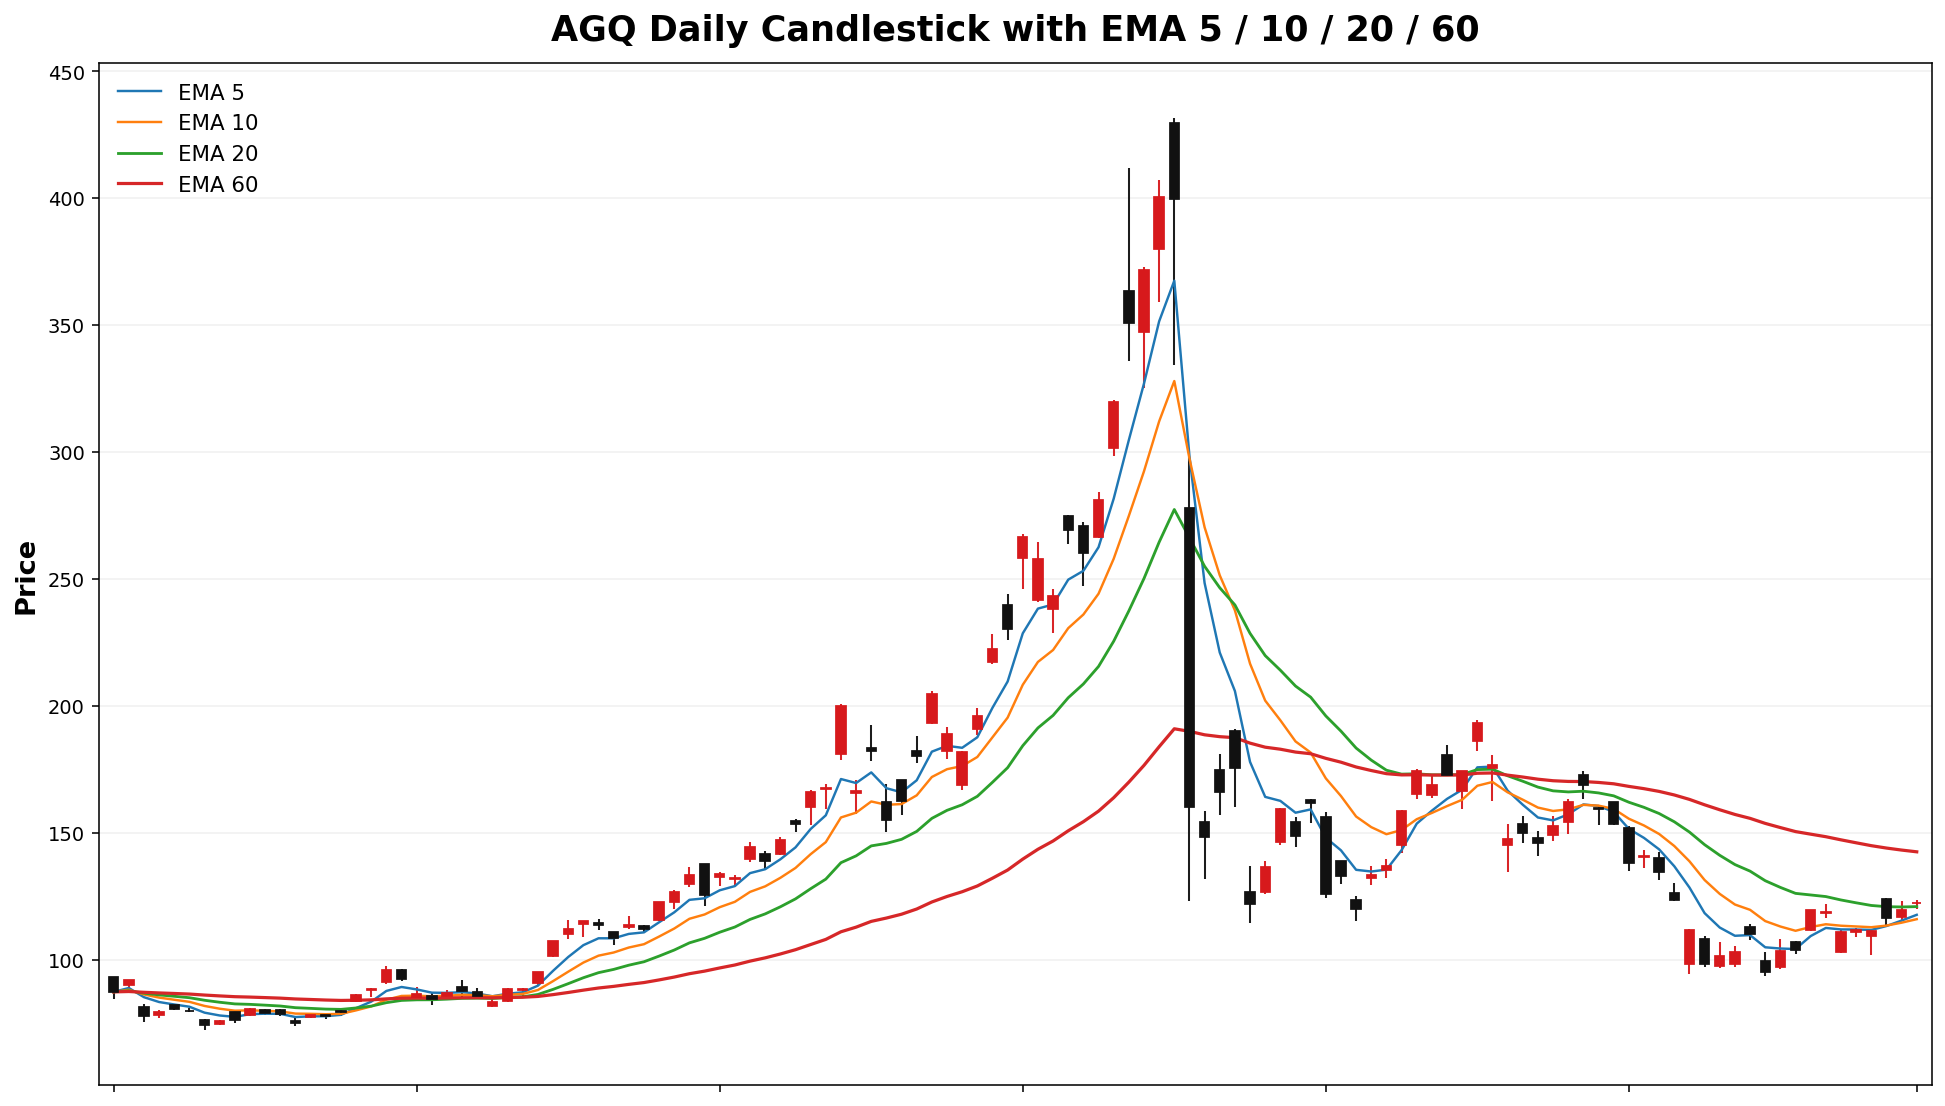
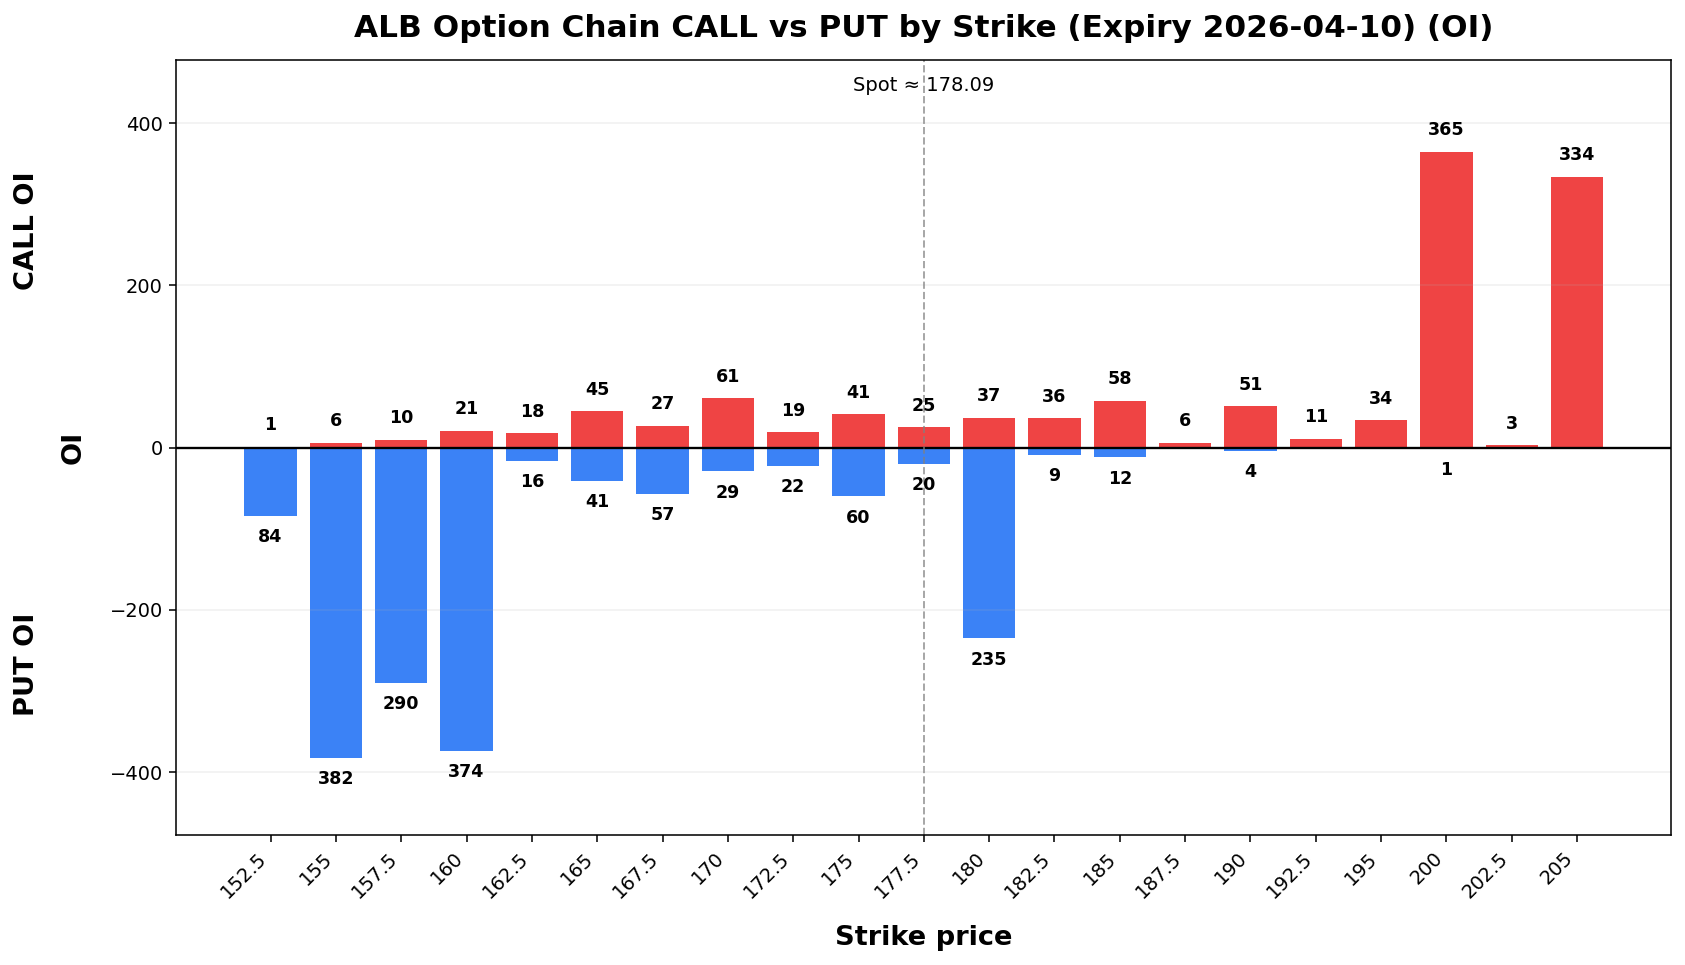
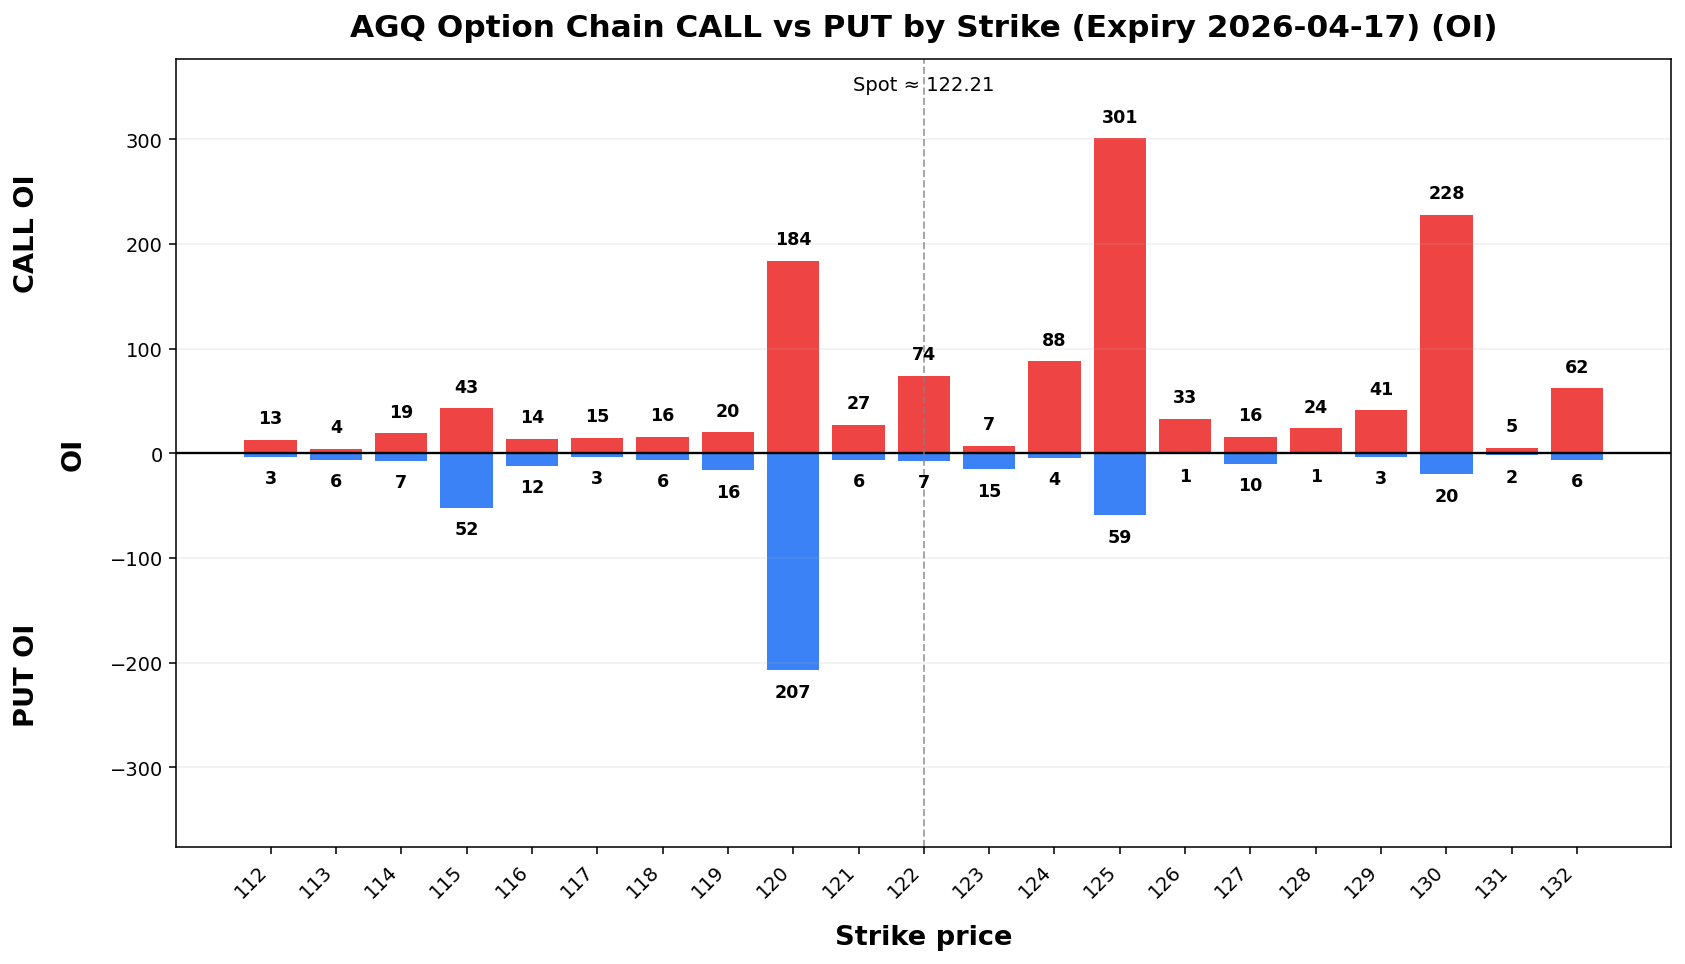
Term Structure
| Expiry |
DTE |
Forward |
ATM IV |
ATM Straddle |
2026-04-1017 |
6 |
178.55122.20 |
60.14%94.48% |
13.0014.55 |
2026-04-1724 |
13 |
178.57122.36 |
56.12%87.86% |
18.4020.10 |
Weekly Range
| Confidence |
Low |
High |
Width |
| 68% |
163.45106.35 |
192.73138.07 |
29.2731.72 |
| 80% |
159.33101.89 |
196.85142.53 |
37.5140.65 |
| 90% |
154.0296.13 |
202.16148.29 |
48.1552.17 |
| 95% |
149.4091.13 |
206.78153.29 |
57.3762.16 |
Structure & Probabilities
| Support |
Resistance |
Gamma Flip |
Max Pain |
P>Res |
P<Sup |
160.100.00 |
180.125.00 |
182.68106.64 |
175.120.00 |
34.2%32.8% |
9.9%7.4% |
Flow & Skew
| Call Vol |
Put Vol |
Vol P/C |
Call OI |
Put OI |
OI P/C |
Skew |
Skew Bias |
399 |
451 |
1.131,895 |
1,281296 |
2,4120.68 |
1.885,198 |
5.003,808 |
0.73 |
8.54 vol pts |
PUT_SKEW |
Tail Risk
| Q10 |
Q50 |
Q90 |
Down Tail |
Up Tail |
Down/Up |
159.0291.31 |
178.63122.52 |
196.58138.97 |
19.0730.90 |
18.4916.76 |
1.0384 |
Daily Technicals
| EMA20 |
EMA50 |
VWAP20 |
BB Lower |
BB Mid |
BB Upper |
BB Width |
Vol Ratio |
Path |
173.00120.91 |
167.80139.70 |
169.111.96 |
89.17 |
114.72 |
140.28 |
44.55% |
0.44 |
154.35 | Sideways 169.82 | / 185.29 |
18.22% |
0.59 |
UP trend (expanding)Range |
Day Plan
160.100.00-180.125.00 range: fade extremes- >
180.125.00: chase only if hold + vol
- <
160.100.00: risk expand; reduce size
- Regime: TRANSITION
- Tech:
UPSideways trend/ (expanding)Range
Swing Plan
- Accumulate:
160.100.00-160.100.00
- Trim:
180.125.00-180.125.00
- Add: close >
180.125.00
- Cut: close <
160.100.00
- Best for: transition regime
Raw Text Summary
📌 ALBAGQ @ 178.09122.21 (2026-04-0512 06:5108:48 PMAM MYT)

• Current price is **178.09*122.21**. Key support is around **160.100.00**, and resistance is around **180.125.00**.
• For the next week, the model’s **68% expected range** is roughly **163.45106.35 to 192.73*138.07**.
• A wider **90% range** is about **154.0296.13 to 202.16*148.29**.
• Dealer positioning looks **LONG gamma**, so the market behavior is classified as **TRANSITION**.
• The estimated **gamma flip** is near **182.68*106.64**. Crossing and holding beyond this area can change the trading behavior.
• Approximate breakout odds: **above resistance 34.2%32.8%**, **below support 9.9%7.4%** by the target horizon.
• Options skew is tilted toward **puts**, which suggests traders are paying more for downside protection.
• Near-term implied volatility is higher than the next expiry (**IV1 60.14%94.48% vs IV2 56.12%87.86%**), which suggests **near-term event stress / backwardation**.
• Recent volume is only **0.59x** the 20-day average, so breakouts may be less reliable unless volume improves.
• On the daily chart, the stock currently looks like **UP trend (expanding)**.
• The implied distribution is **fairly balanced** between upside and downside tails.
AU
Spot: 101.22
Report Time: 2026-04-05 06:51 PM MYT
Regime: TRANSITION
Dealer Gamma: LONG
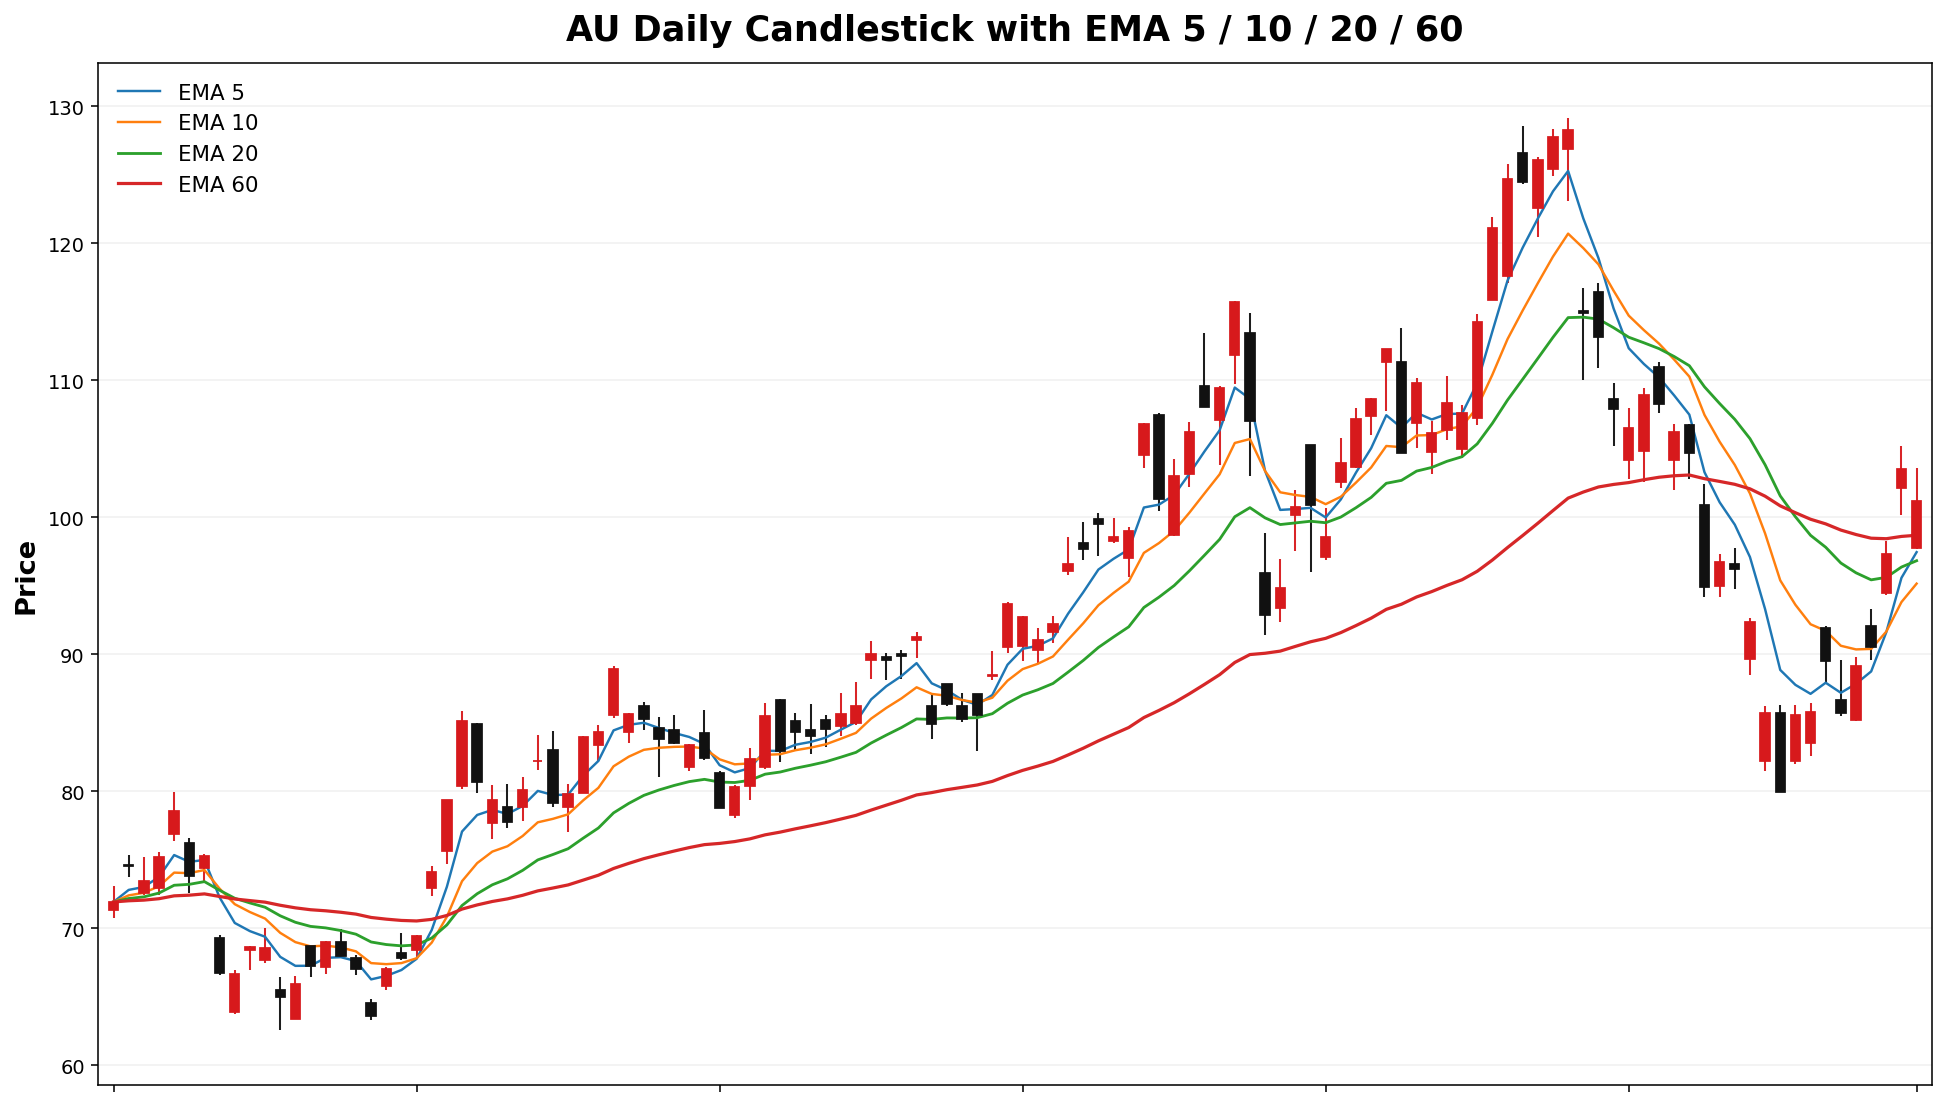
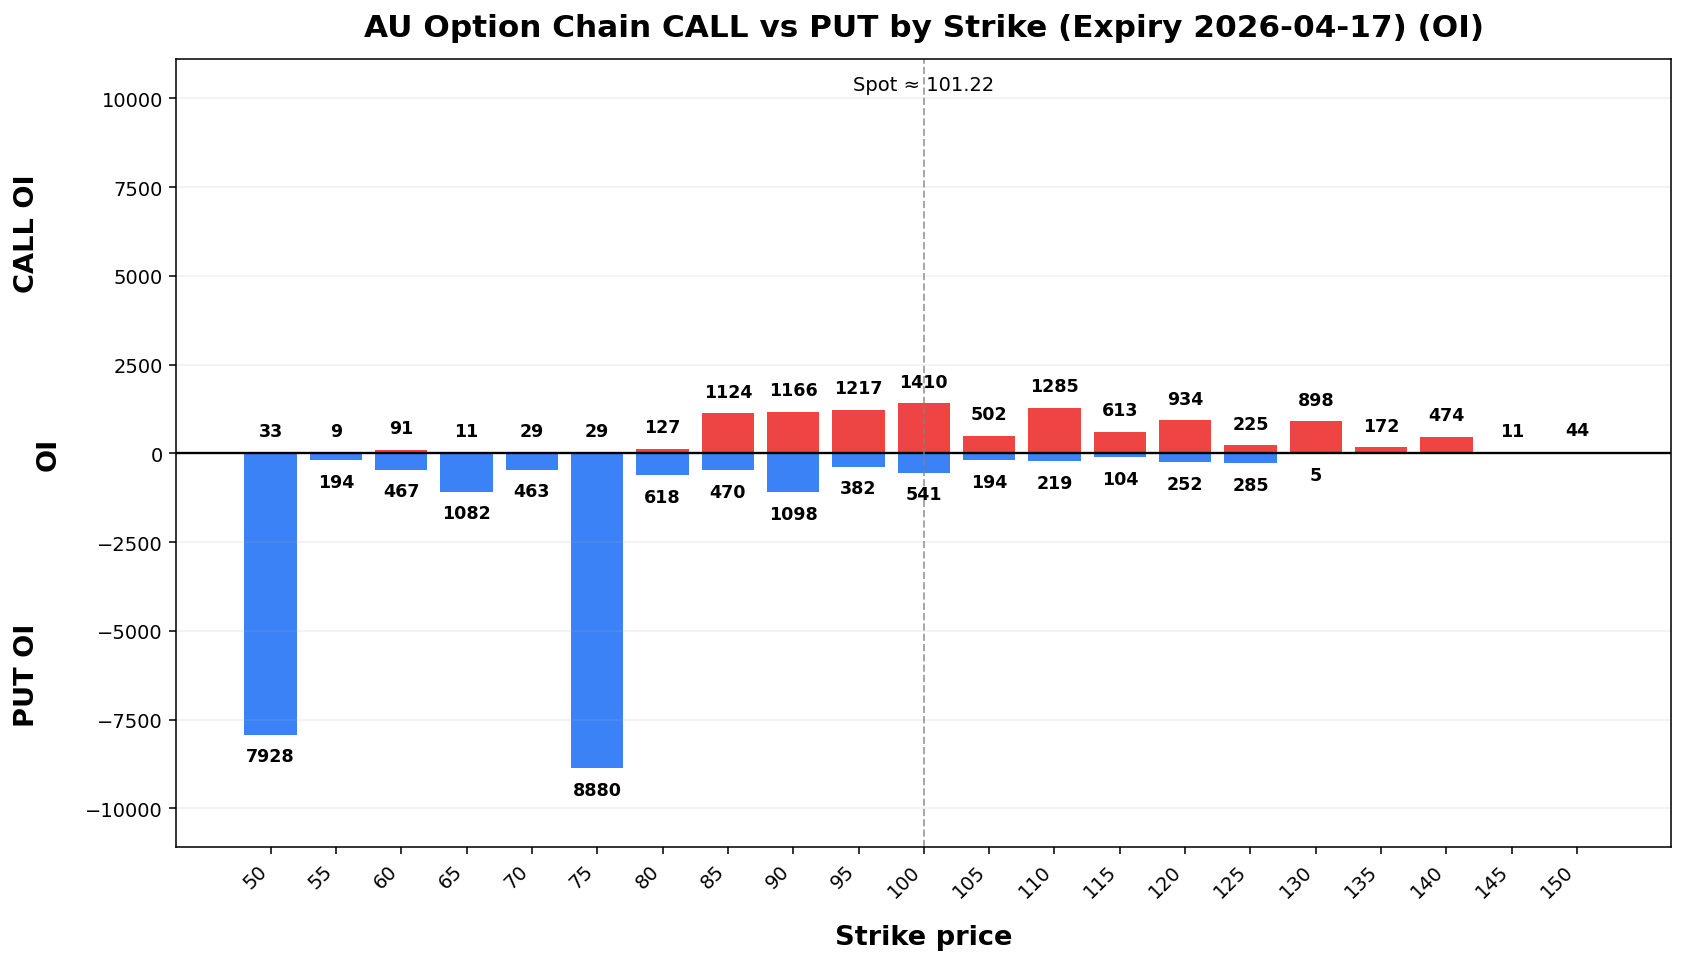
Term Structure
Expiry |
DTE |
Forward |
ATM IV |
ATM Straddle |
|---|
2026-04-17 |
13 |
101.49 |
57.42% |
10.70 |
2026-05-15 |
41 |
101.91 |
53.93% |
18.15 |
Weekly Range
Confidence |
Low |
High |
Width |
|---|
68% |
92.55 |
109.89 |
17.33 |
80% |
90.12 |
112.32 |
22.21 |
90% |
86.97 |
115.47 |
28.51 |
95% |
84.24 |
118.20 |
33.97 |
Structure & Probabilities
Support |
Resistance |
Gamma Flip |
Max Pain |
P>Res |
P<Sup |
|---|
100.00 |
110.00 |
95.76 |
90.00 |
11.9% |
40.5% |
Flow & Skew
Call Vol |
Put Vol |
Vol P/C |
Call OI |
Put OI |
OI P/C |
Skew |
Skew Bias |
|---|
472 |
341 |
0.72 |
10,499 |
24,786 |
2.36 |
9.35 vol pts |
PUT_SKEW |
Tail Risk
Q10 |
Q50 |
Q90 |
Down Tail |
Up Tail |
Down/Up |
|---|
36.98 |
44.89 |
113.09 |
64.24 |
11.87 |
5.41 |
Daily Technicals
EMA20 |
EMA50 |
VWAP20 |
BB Lower |
BB Mid |
BB Upper |
BB Width |
Vol Ratio |
Path |
|---|
96.84 |
99.17 |
93.26 |
77.67 |
95.45 |
113.23 |
37.25% |
0.62 |
Sideways / Range |
Day Plan
100.00-110.00 range: fade extremes
> 110.00: chase only if hold + vol
< 100.00: risk expand; reduce size
Regime: TRANSITION
Tech: Sideways / Range
Swing Plan
Accumulate: 100.00-100.00
Trim: 110.00-110.00
Add: close > 110.00
Cut: close < 100.00
Best for: transition regime
Raw Text Summary
📌 AU @ 101.22 (2026-04-05 06:51 PM MYT)

• Current price is **101.22**. Key support is around **100.00**, and resistance is around **110.00**.
• For the next week, the model’s **68% expected range** is roughly **92.55 to 109.89**.
• A wider **90% range** is about **86.97 to 115.47**.
• Dealer positioning looks **LONG gamma**, so the market behavior is classified as **TRANSITION**.
• The estimated **gamma flip** is near **95.76**. Crossing and holding beyond this area can change the trading behavior.
• Approximate breakout odds: **above resistance 11.9%**, **below support 40.5%** by the target horizon.
• Options skew is tilted toward **puts**, which suggests traders are paying more for downside protection.
• Near-term implied volatility is higher than the next expiry (**IV1 57.42% vs IV2 53.93%**), which suggests **near-term event stress / backwardation**.
• Recent volume is only **0.62x*44x** the 20-day average, so breakouts may be less reliable unless volume improves.
• On the daily chart, the stock currently looks like **Sideways / Range**.
• The implied distribution shows **heavier downside tail risk** than upside tail potential.
NUGTAPLD
Spot: 199.3726.26
Report Time: 2026-04-0512 06:5108:49 PMAM MYT
Regime: TRANSITION
Dealer Gamma: LONG
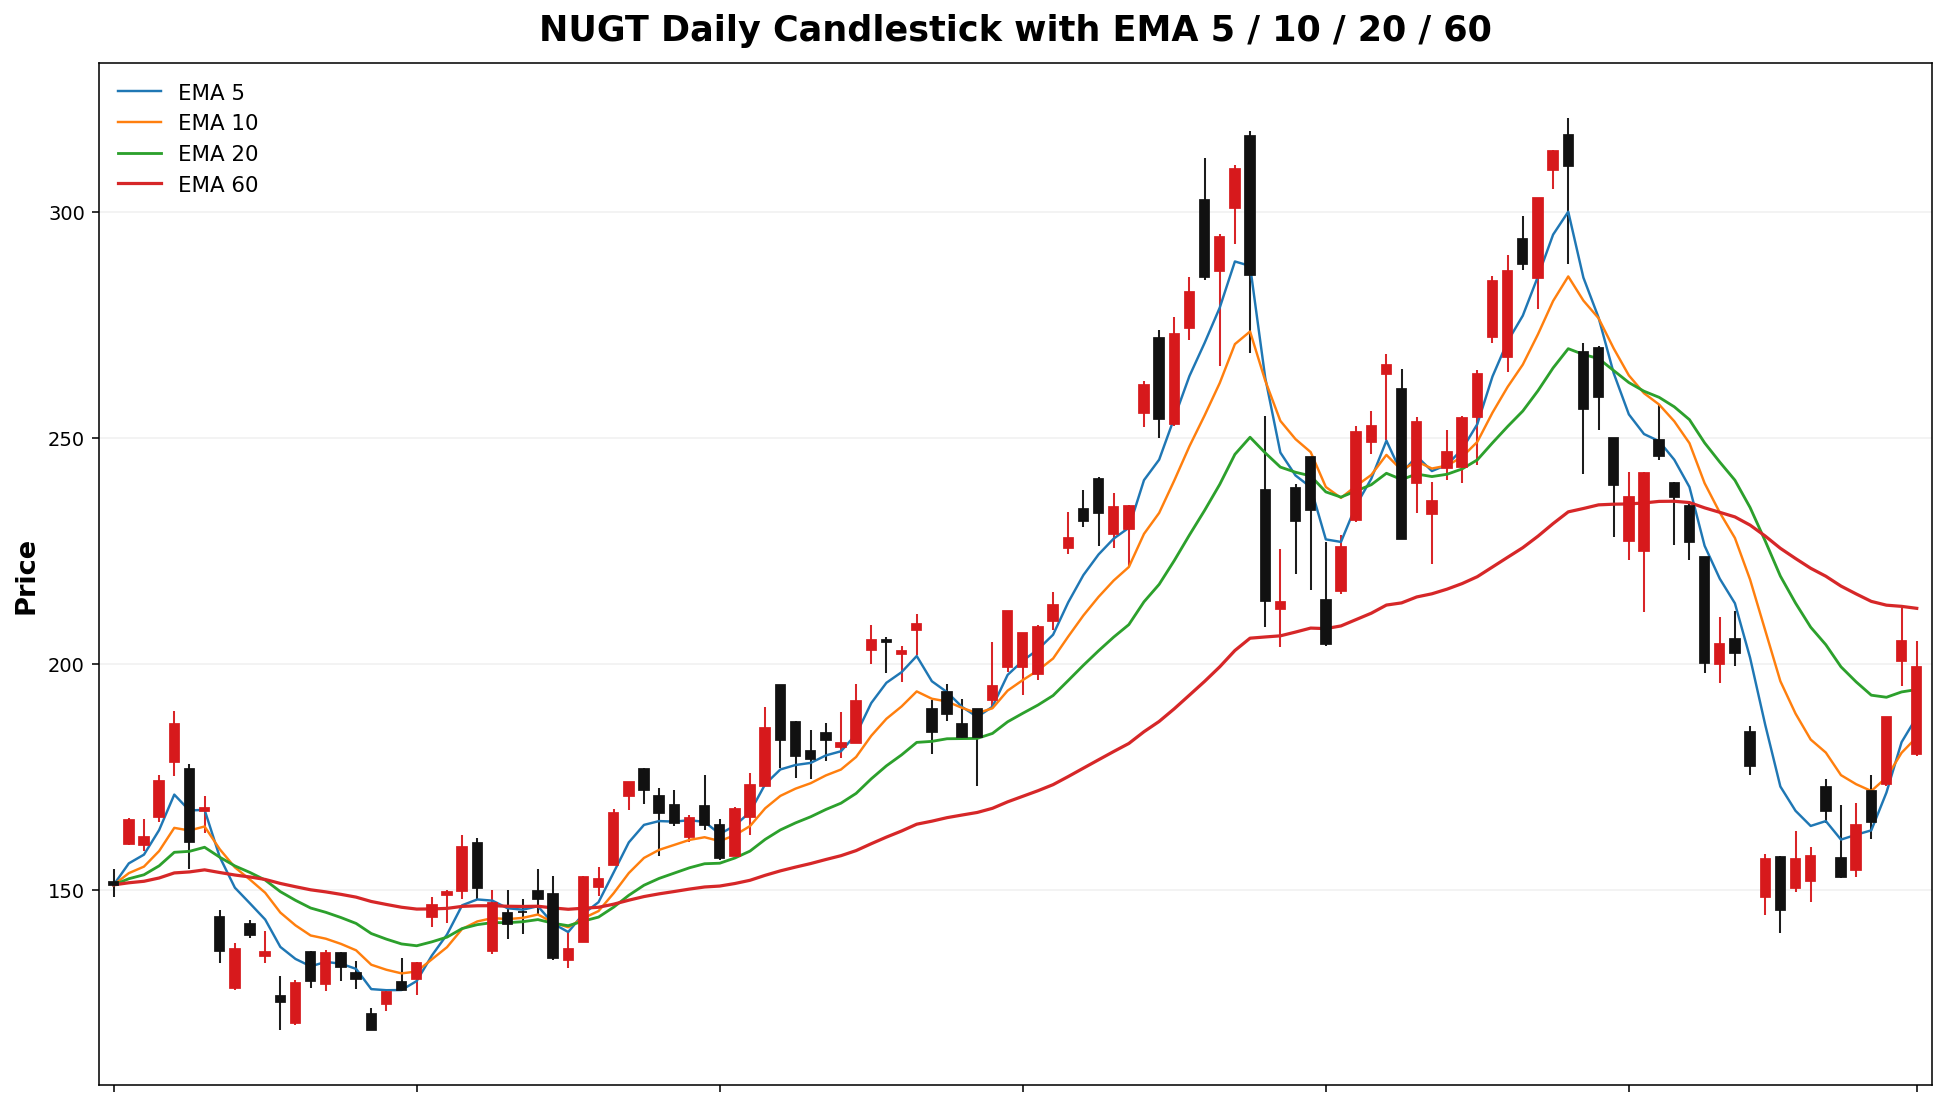
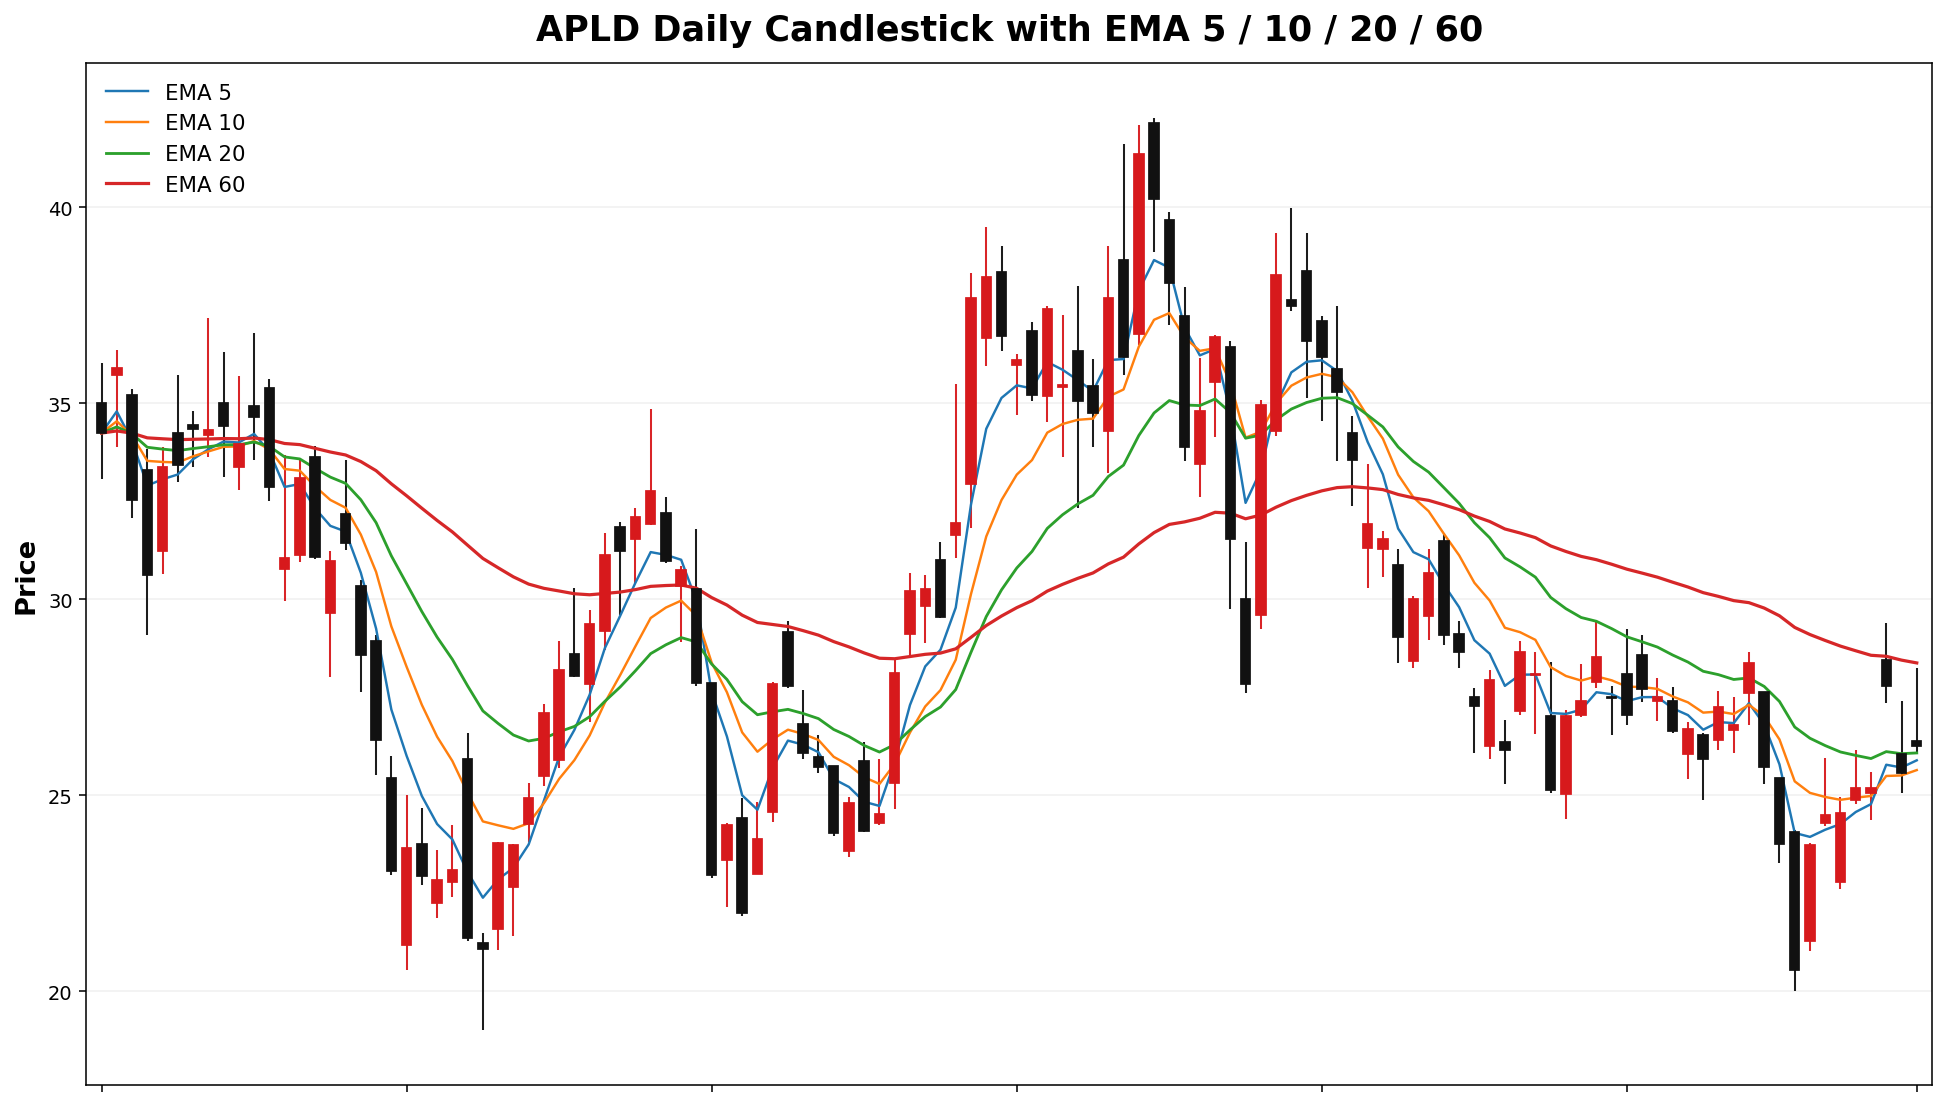
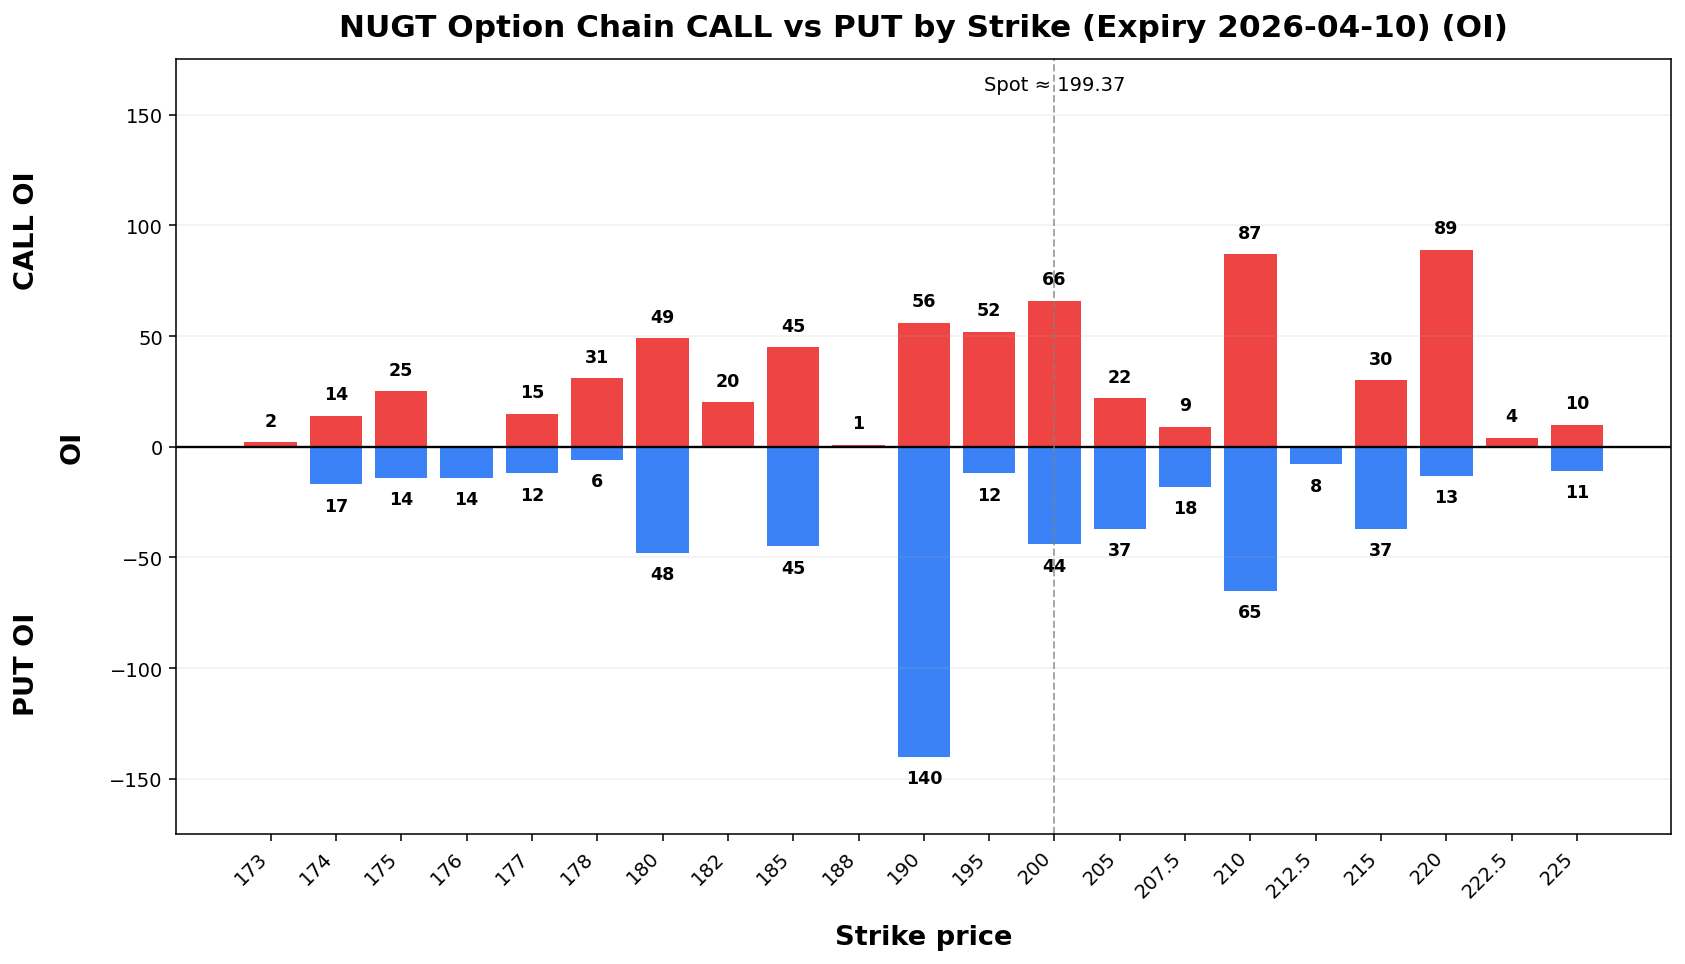
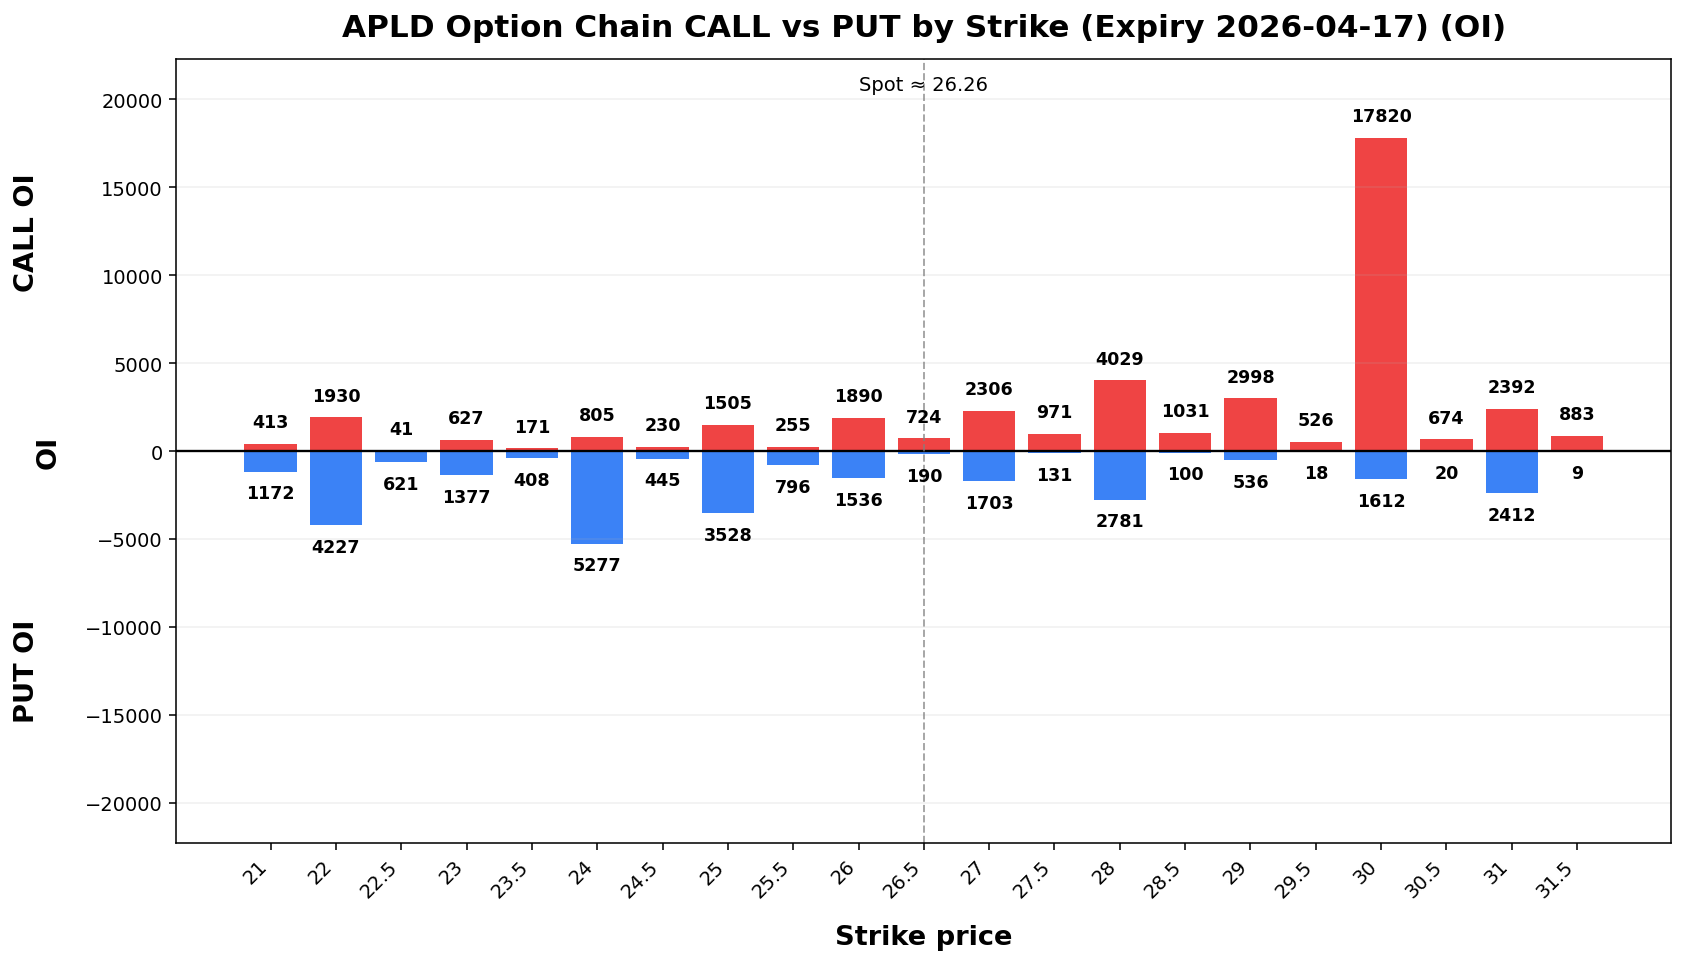
Term Structure
| Expiry |
DTE |
Forward |
ATM IV |
ATM Straddle |
2026-04-1017 |
6 |
199.9726.26 |
101.87%86.58% |
24.652.87 |
2026-04-1724 |
13 |
200.0326.27 |
98.21%81.78% |
36.054.02 |
Weekly Range
| Confidence |
Low |
High |
Width |
| 68% |
171.2323.12 |
227.5129.40 |
56.296.28 |
| 80% |
163.3022.24 |
235.4430.28 |
72.148.05 |
| 90% |
153.0821.10 |
245.6631.42 |
92.5910.33 |
| 95% |
144.2120.11 |
254.5332.41 |
110.3212.30 |
Structure & Probabilities
| Support |
Resistance |
Gamma Flip |
Max Pain |
P>Res |
P<Sup |
190.25.00 |
200.28.00 |
191.6924.34 |
185.27.00 |
40.3%23.8% |
36.3%33.8% |
Flow & Skew
| Call Vol |
Put Vol |
Vol P/C |
Call OI |
Put OI |
OI P/C |
Skew |
Skew Bias |
51633,265 |
60113,821 |
1.160.42 |
1,31991,645 |
1,50644,189 |
1.140.48 |
19.415.76 vol pts |
PUT_SKEW |
Tail Risk
| Q10 |
Q50 |
Q90 |
Down Tail |
Up Tail |
Down/Up |
158.7322.43 |
199.68 |
236.31 |
40.26.64 |
36.9430.93 |
1.103.83 |
4.67 |
0.82 |
Daily Technicals
| EMA20 |
EMA50 |
VWAP20 |
BB Lower |
BB Mid |
BB Upper |
BB Width |
Vol Ratio |
Path |
194.3326.08 |
211.7627.88 |
184.9425.84 |
125.1922.18 |
191.6325.84 |
258.0629.50 |
69.28.33% |
0.931.31 |
SidewaysDOWN /trend Range(expanding) |
Day Plan
190.25.00-200.28.00 range: fade extremes- >
200.28.00: chase only if hold + vol
- <
190.25.00: risk expand; reduce size
- Regime: TRANSITION
- Tech:
SidewaysDOWN /trend Range(expanding)
Swing Plan
- Accumulate:
190.25.00-190.25.00
- Trim:
200.28.00-200.28.00
- Add: close >
200.28.00
- Cut: close <
190.25.00
- Best for: transition regime
Raw Text Summary
📌 NUGTAPLD @ 199.3726.26 (2026-04-0512 06:5108:49 PMAM MYT)

• Current price is **199.37*26.26**. Key support is around **190.25.00**, and resistance is around **200.28.00**.
• For the next week, the model’s **68% expected range** is roughly **171.2323.12 to 227.51*29.40**.
• A wider **90% range** is about **153.0821.10 to 245.66*31.42**.
• Dealer positioning looks **LONG gamma**, so the market behavior is classified as **TRANSITION**.
• The estimated **gamma flip** is near **191.69*24.34**. Crossing and holding beyond this area can change the trading behavior.
• Approximate breakout odds: **above resistance 40.3%23.8%**, **below support 36.3%33.8%** by the target horizon.
• Options skew is tilted toward **puts**, which suggests traders are paying more for downside protection.
• Near-term implied volatility is higher than the next expiry (**IV1 101.87%86.58% vs IV2 98.21%81.78%**), which suggests **near-term event stress / backwardation**.
• On the daily chart, the stock currently looks like **SidewaysDOWN /trend Range*(expanding)**.
• The implied distribution shows **heaviermore upside tail potential** than downside tail risk** than upside tail potential.risk.
LABUBNO
Spot: 171.6447.25
Report Time: 2026-04-0512 06:5108:49 PMAM MYT
Regime: TRANSITION
Dealer Gamma: LONG
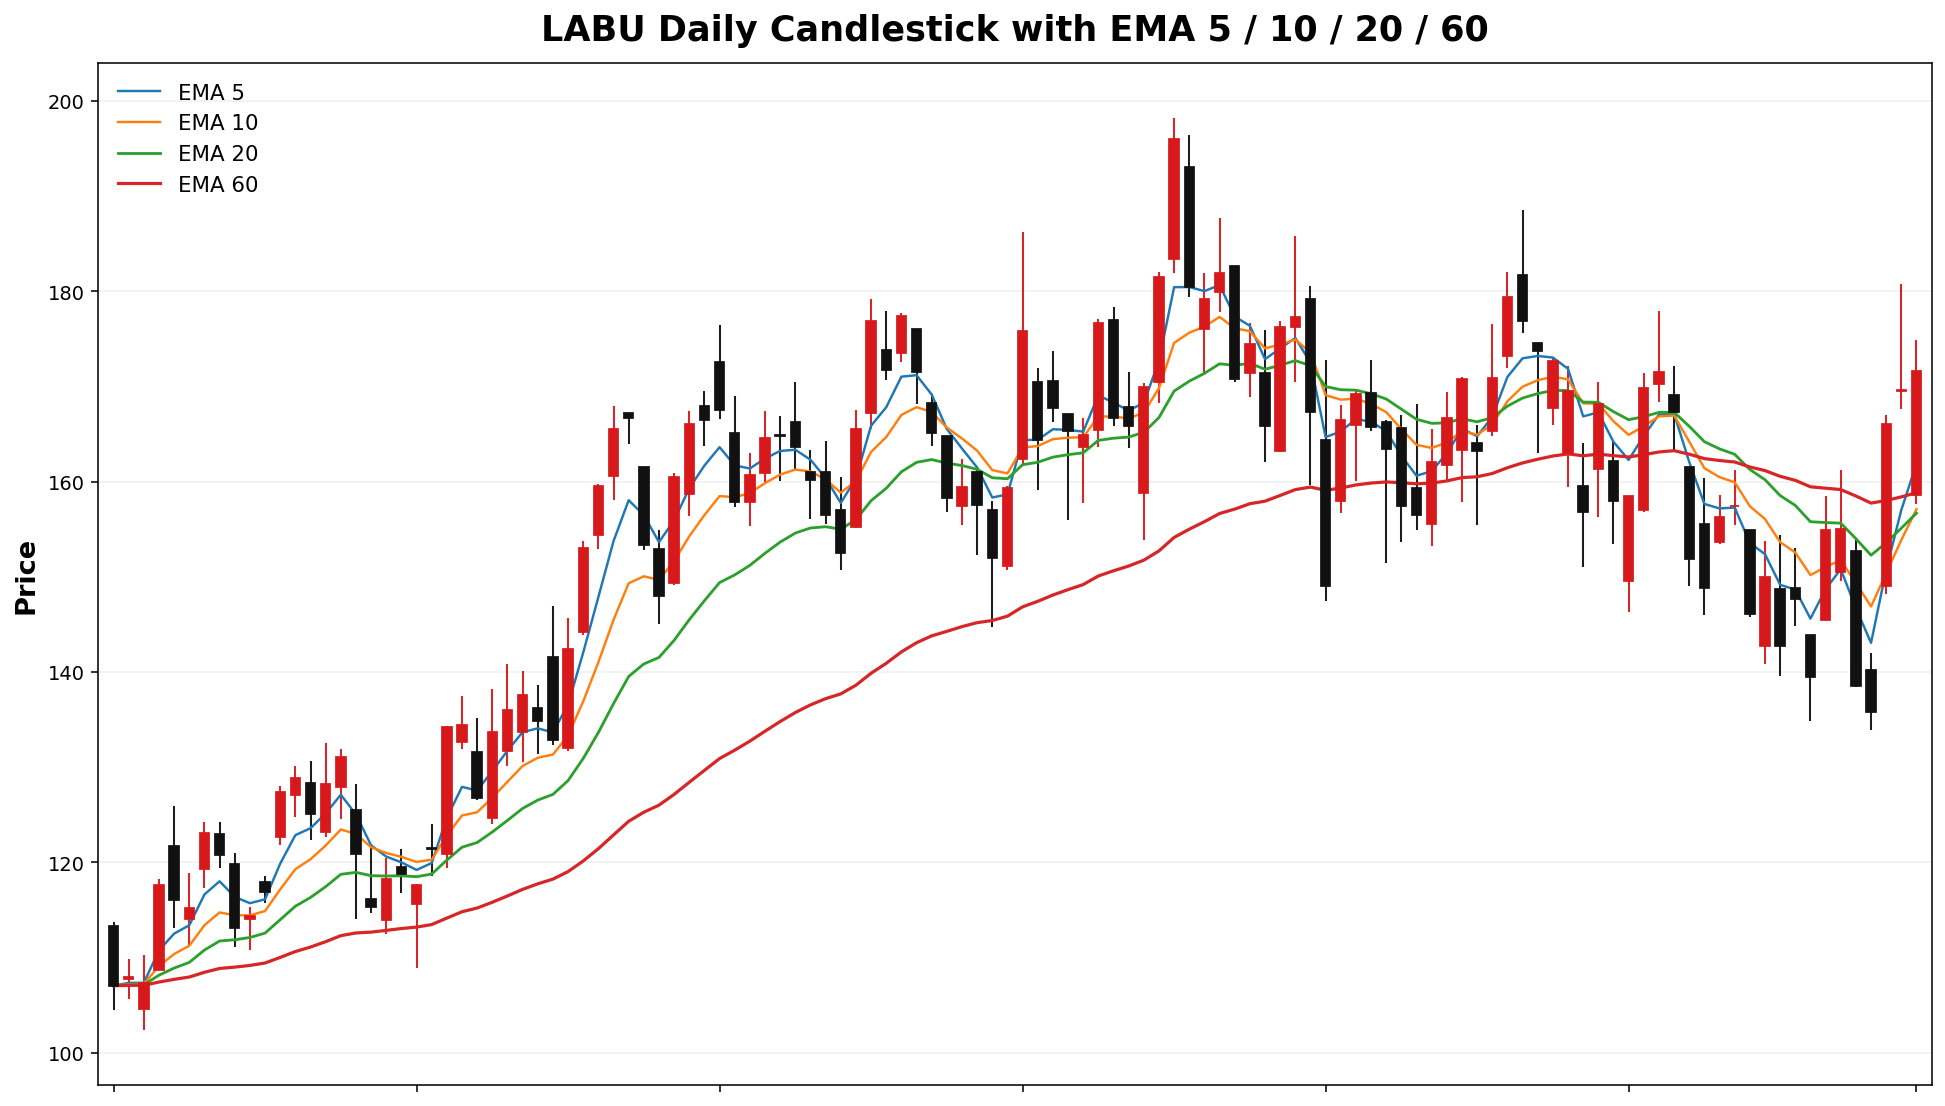
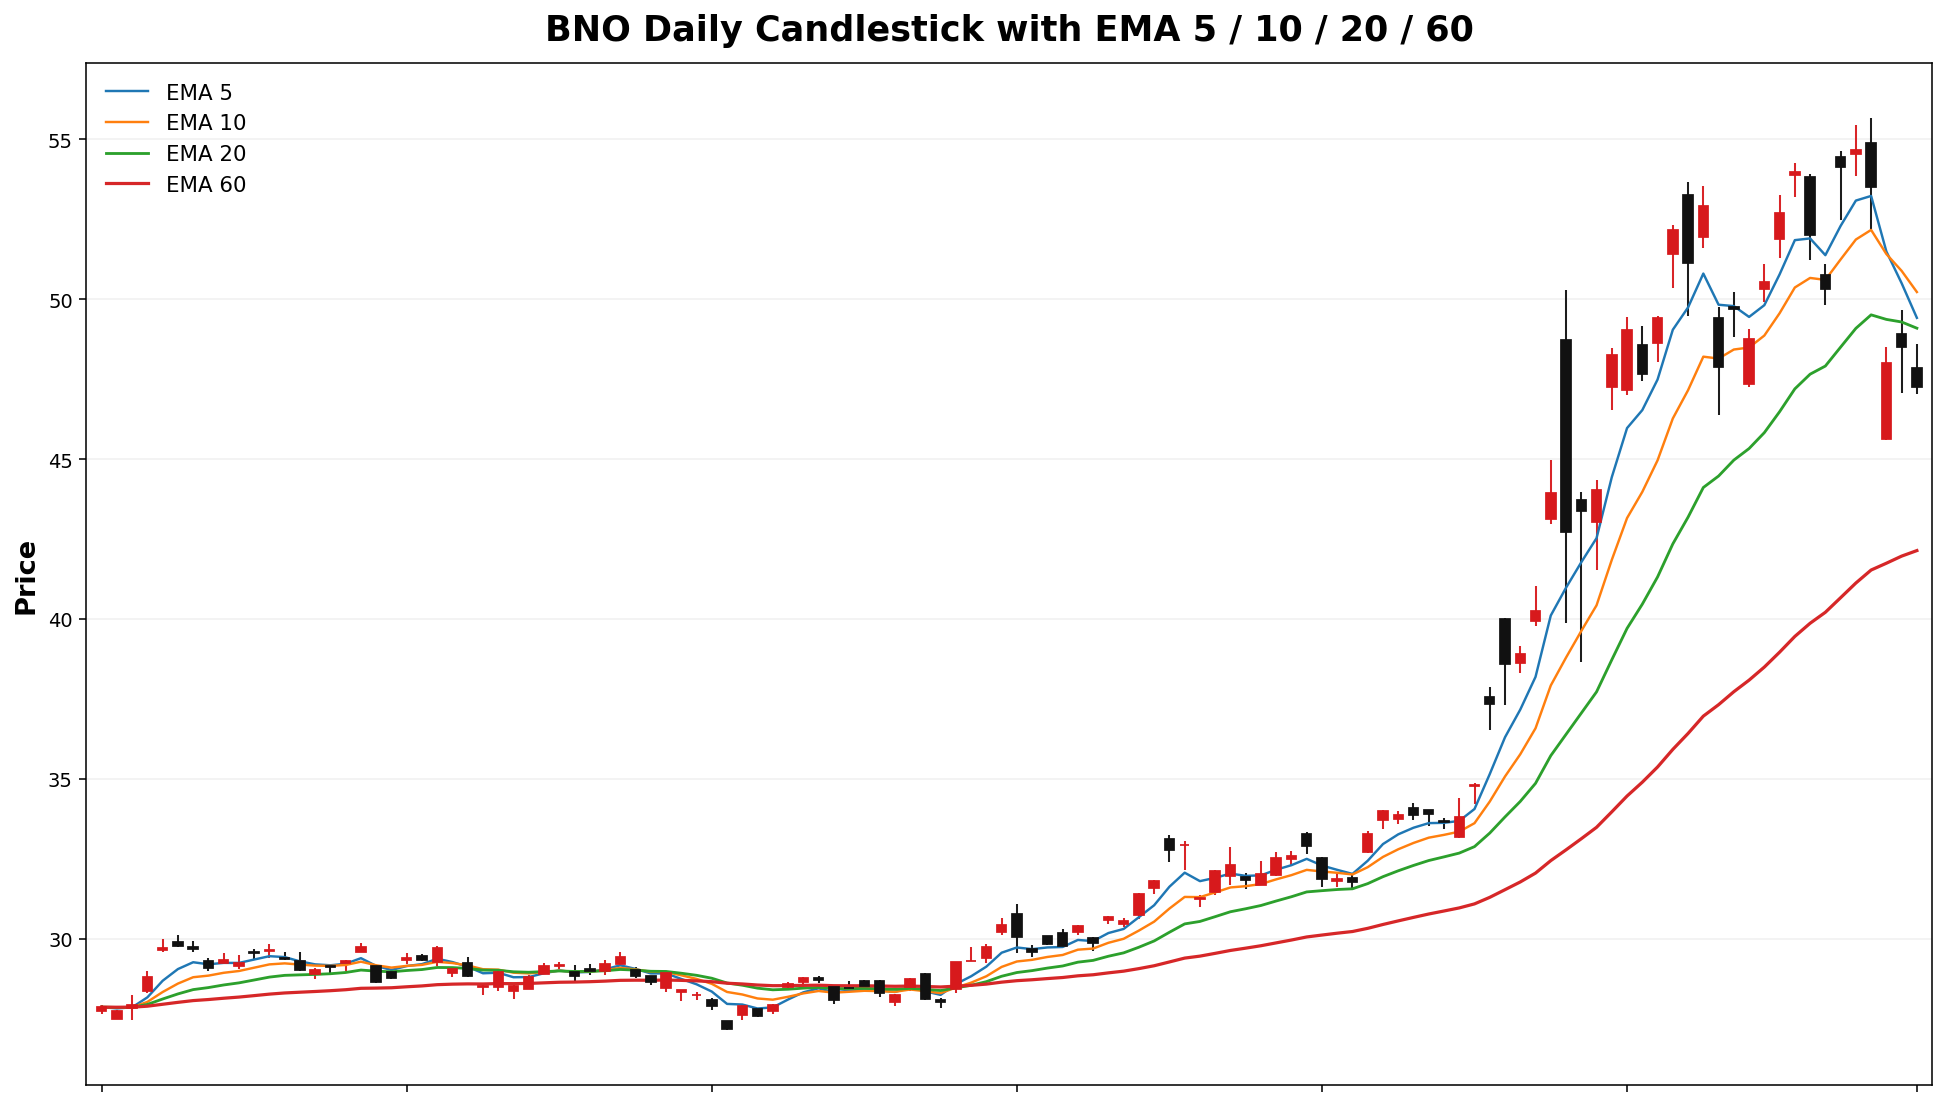
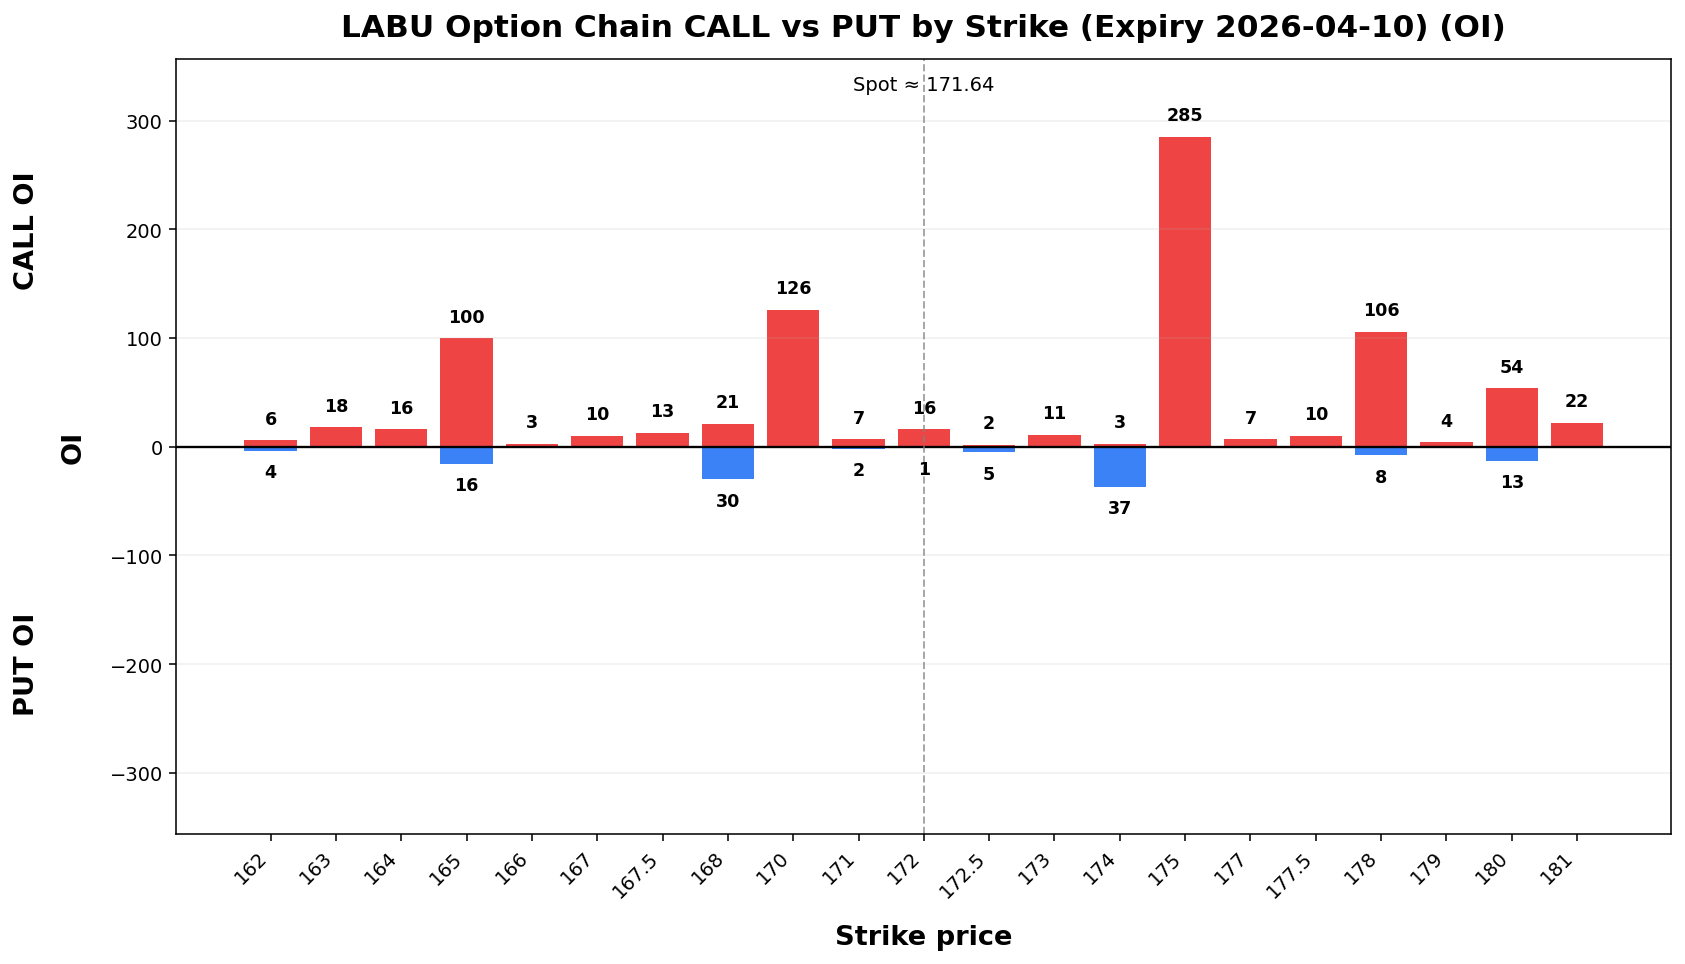
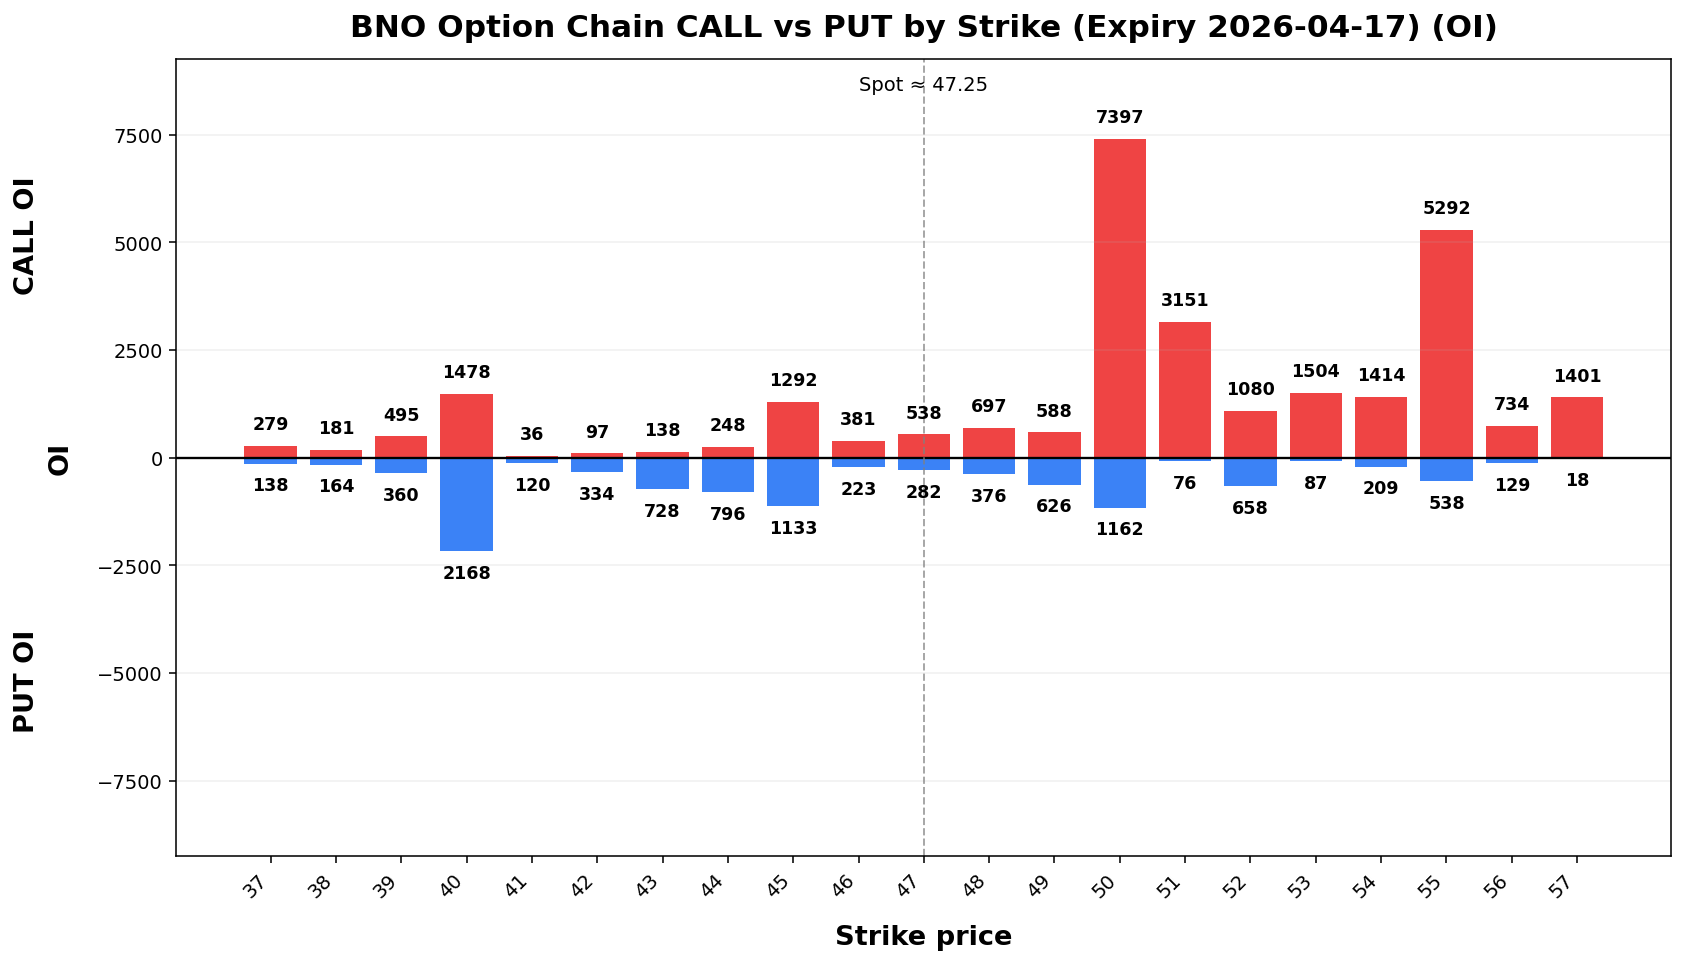
Term Structure
| Expiry |
DTE |
Forward |
ATM IV |
ATM Straddle |
2026-04-1017 |
6 |
170.8147.32 |
93.84%75.58% |
19.554.50 |
2026-04-1705-15 |
1334 |
170.47.50 |
92.25%65.75% |
29.159.45 |
Weekly Range
| Confidence |
Low |
High |
Width |
| 68% |
149.42.37 |
52.13 |
194.15 |
45.039.76 |
| 80% |
142.7941.00 |
200.4953.50 |
57.7012.51 |
| 90% |
134.6139.22 |
208.6755.28 |
74.16.06 |
| 95% |
127.5137.68 |
215.7756.82 |
88.2519.13 |
Structure & Probabilities
| Support |
Resistance |
Gamma Flip |
Max Pain |
P>Res |
P<Sup |
170.40.00 |
175.50.00 |
137.78 |
151.39.00 |
36.45.00 |
26.2% |
46.5.2% |
Flow & Skew
| Call Vol |
Put Vol |
Vol P/C |
Call OI |
Put OI |
OI P/C |
Skew |
Skew Bias |
5904,144 |
1,029 |
1.74 |
2,345 |
1,835119 |
0.7827 |
23.1746,656 |
14,125 |
0.30 |
-12.60 vol pts |
PUT_SKEWCALL_SKEW |
Tail Risk
| Q10 |
Q50 |
Q90 |
Down Tail |
Up Tail |
Down/Up |
140.8715.96 |
170.19.79 |
196.9450.26 |
30.7731.29 |
25.303.01 |
1.2210.41 |
Daily Technicals
| EMA20 |
EMA50 |
VWAP20 |
BB Lower |
BB Mid |
BB Upper |
BB Width |
Vol Ratio |
Path |
156.6949.09 |
159.0043.56 |
155.1750.83 |
131.9545.91 |
154.9750.72 |
177.9855.52 |
29.70%18.94% |
0.98 |
Sideways / Range |
Day Plan
170.00-175.00 range: fade extremes
> 175.00: chase only if hold + vol
< 170.00: risk expand; reduce size
Regime: TRANSITION
Tech: Sideways / Range
Swing Plan
Accumulate: 170.00-170.00
Trim: 175.00-175.00
Add: close > 175.00
Cut: close < 170.00
Best for: transition regime
Raw Text Summary
📌 LABU @ 171.64 (2026-04-05 06:51 PM MYT)

• Current price is **171.64**. Key support is around **170.00**, and resistance is around **175.00**.
• For the next week, the model’s **68% expected range** is roughly **149.13 to 194.15**.
• A wider **90% range** is about **134.61 to 208.67**.
• Dealer positioning looks **LONG gamma**, so the market behavior is classified as **TRANSITION**.
• The estimated **gamma flip** is near **137.78**. Crossing and holding beyond this area can change the trading behavior.
• Approximate breakout odds: **above resistance 36.2%**, **below support 46.2%** by the target horizon.
• Options skew is tilted toward **puts**, which suggests traders are paying more for downside protection.
• Near-term implied volatility is higher than the next expiry (**IV1 93.84% vs IV2 92.25%**), which suggests **near-term event stress / backwardation**.
• On the daily chart, the stock currently looks like **Sideways / Range**.
• The implied distribution shows **heavier downside tail risk** than upside tail potential.
EWY
Spot: 122.87
Report Time: 2026-04-05 06:51 PM MYT
Regime: TREND
Dealer Gamma: SHORT
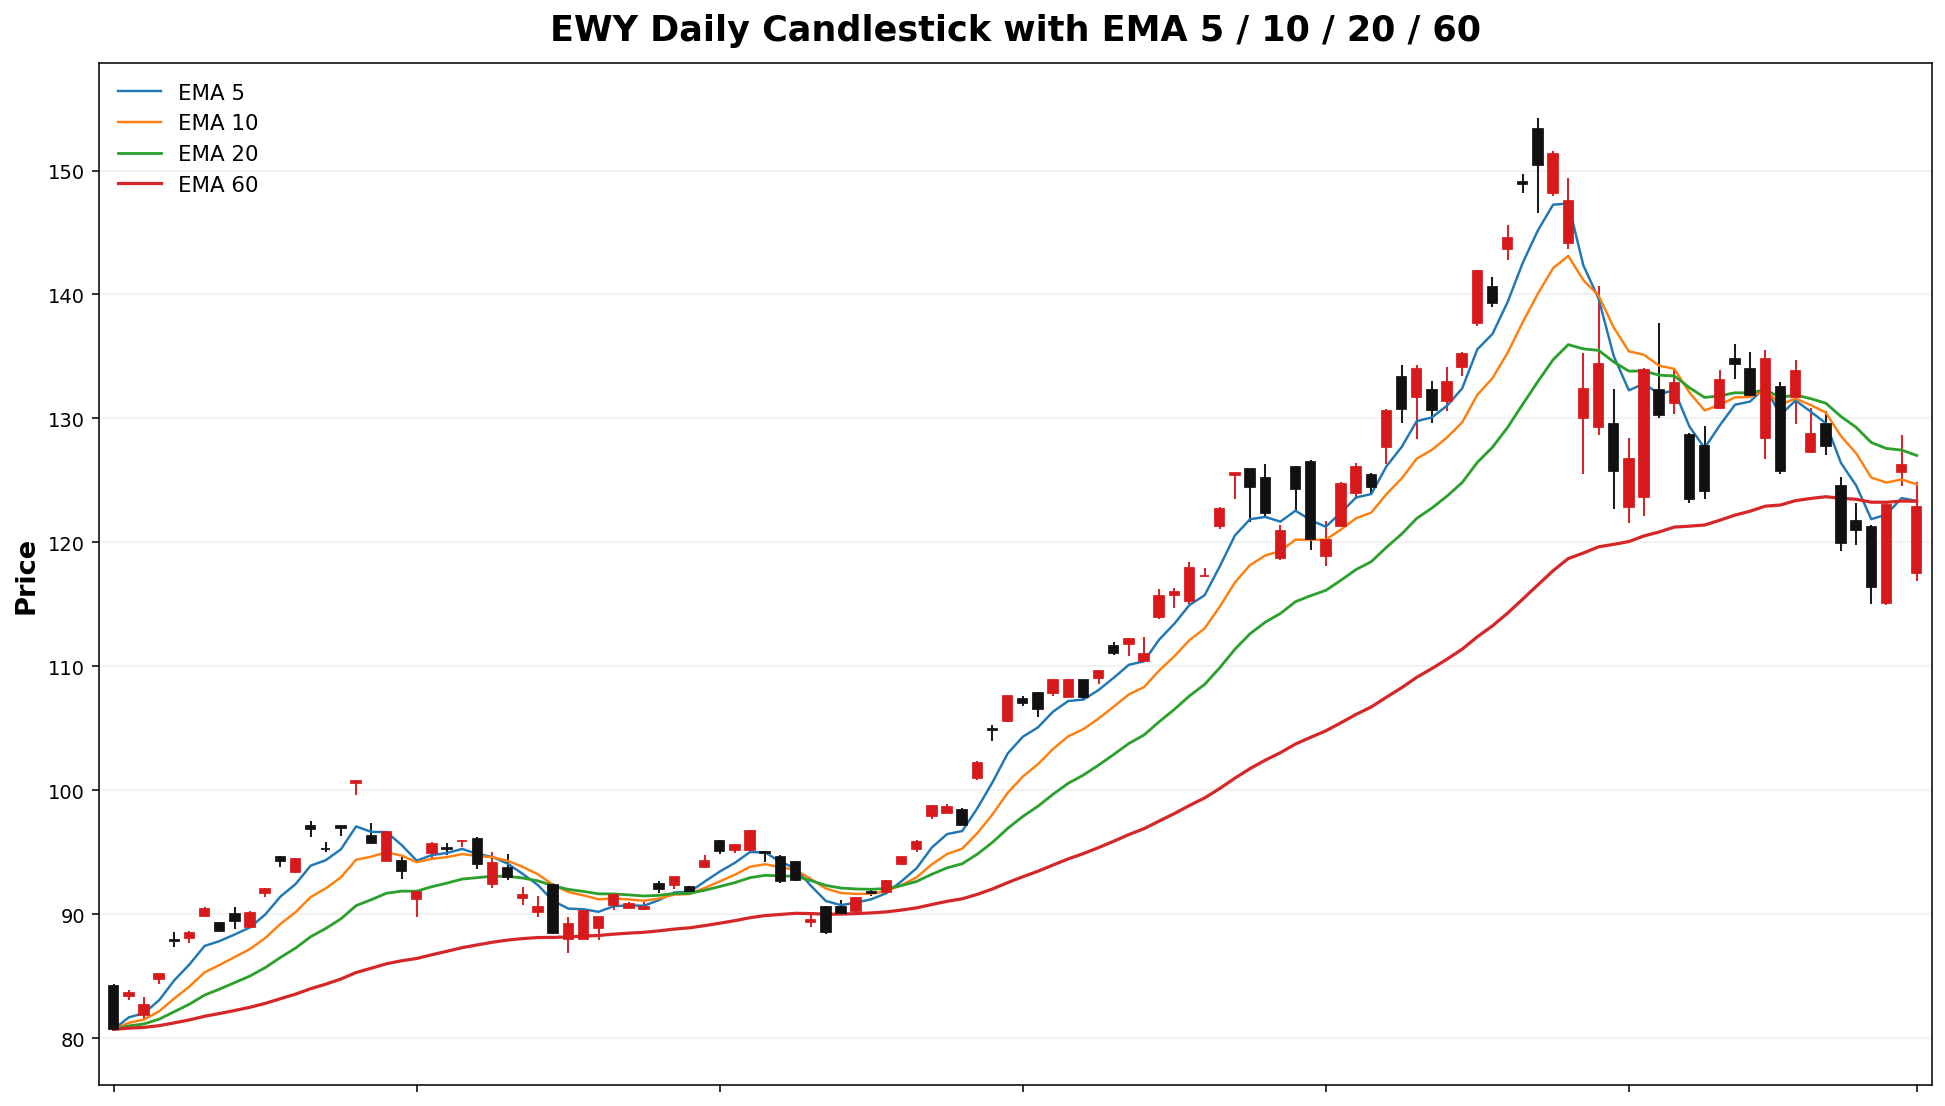
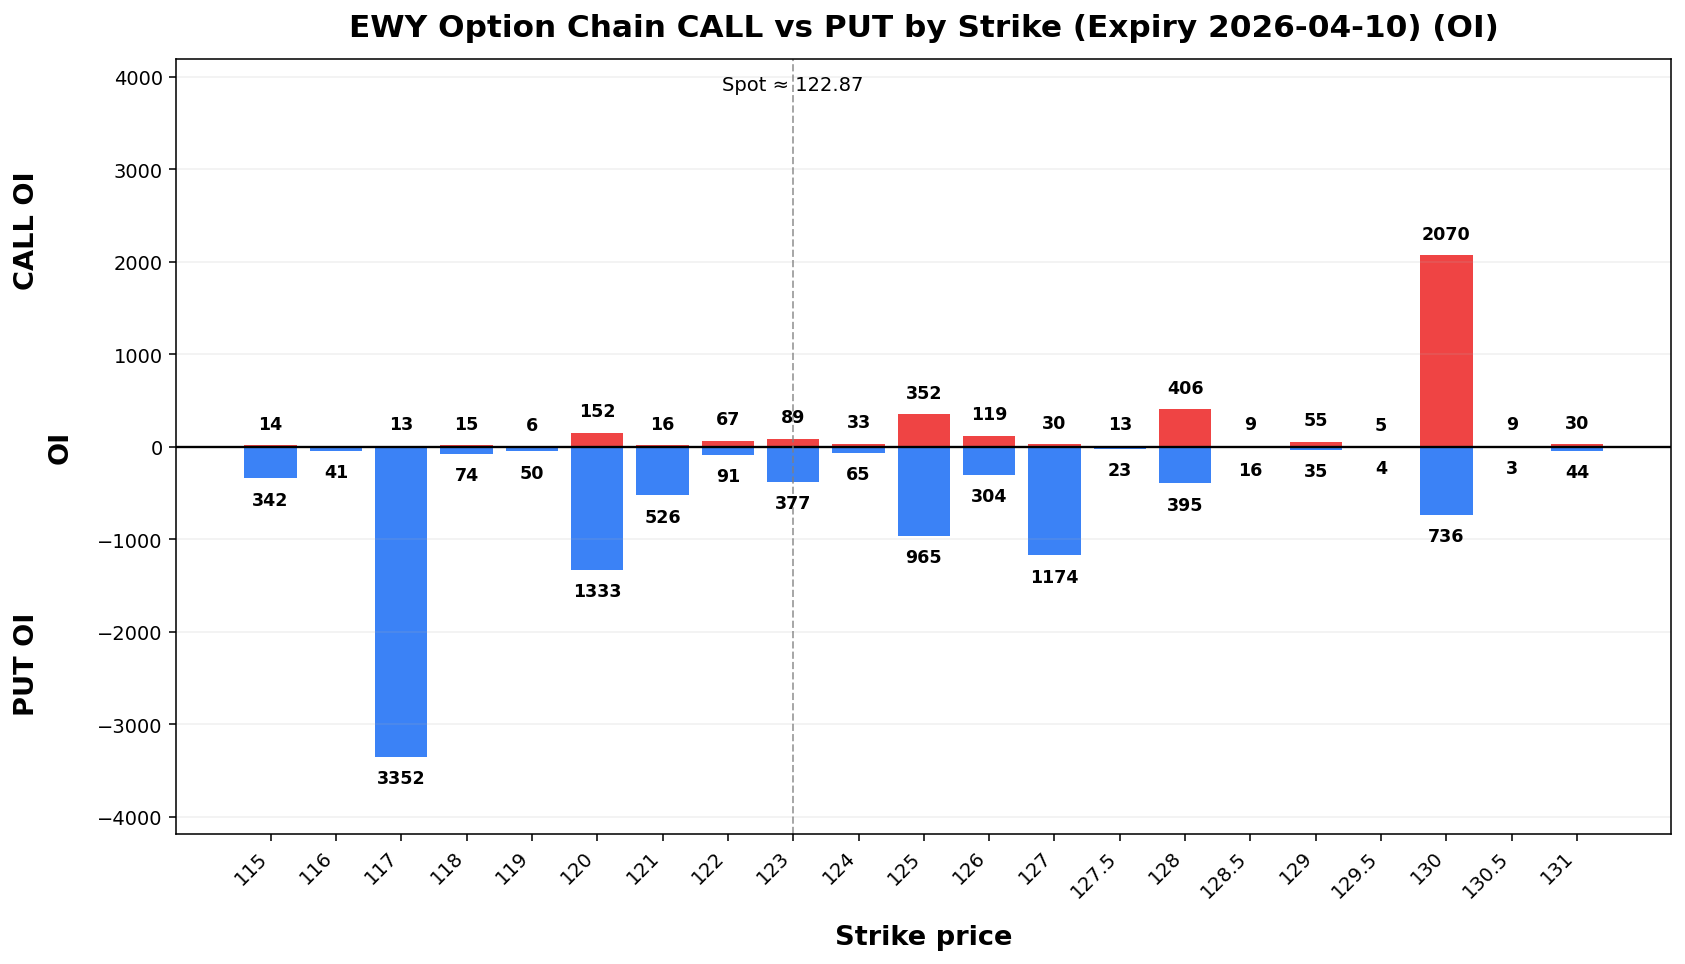
Term Structure
Expiry |
DTE |
Forward |
ATM IV |
ATM Straddle |
|---|
2026-04-10 |
6 |
122.92 |
60.69% |
9.05 |
2026-04-17 |
13 |
122.89 |
53.93% |
12.20 |
Weekly Range
Confidence |
Low |
High |
Width |
|---|
68% |
112.88 |
132.86 |
19.98 |
80% |
110.07 |
135.67 |
25.60 |
90% |
106.44 |
139.30 |
32.86 |
95% |
103.29 |
142.45 |
39.15 |
Structure & Probabilities
Support |
Resistance |
Gamma Flip |
Max Pain |
P>Res |
P<Sup |
|---|
120.00 |
125.00 |
135.02 |
130.00 |
42.9% |
47.8% |
Flow & Skew
Call Vol |
Put Vol |
Vol P/C |
Call OI |
Put OI |
OI P/C |
Skew |
Skew Bias |
|---|
3,235 |
3,208 |
0.99 |
7,541 |
22,558 |
2.99 |
8.20 vol pts |
PUT_SKEW |
Tail Risk
Q10 |
Q50 |
Q90 |
Down Tail |
Up Tail |
Down/Up |
|---|
109.05 |
124.41 |
135.69 |
13.82 |
12.82 |
1.08 |
Daily Technicals
EMA20 |
EMA50 |
VWAP20 |
BB Lower |
BB Mid |
BB Upper |
BB Width |
Vol Ratio |
Path |
|---|
127.01 |
125.06 |
127.49 |
116.64 |
127.56 |
138.48 |
17.12% |
0.64 |
Sideways / Range |
Day Plan
120.00-125.00 range: fade extremes
> 125.00: chase only if hold + vol
< 120.00: risk expand; reduce size
Regime: TREND
Tech: Sideways / Range
Swing Plan
Accumulate: 120.00-120.00
Trim: 125.00-125.00
Add: close > 125.00
Cut: close < 120.00
Best for: trend regime
Raw Text Summary
📌 EWY @ 122.87 (2026-04-05 06:51 PM MYT)

• Current price is **122.87**. Key support is around **120.00**, and resistance is around **125.00**.
• For the next week, the model’s **68% expected range** is roughly **112.88 to 132.86**.
• A wider **90% range** is about **106.44 to 139.30**.
• Dealer positioning looks **SHORT gamma**, so the market behavior is classified as **TREND**.
• The estimated **gamma flip** is near **135.02**. Crossing and holding beyond this area can change the trading behavior.
• Approximate breakout odds: **above resistance 42.9%**, **below support 47.8%** by the target horizon.
• Options skew is tilted toward **puts**, which suggests traders are paying more for downside protection.
• Near-term implied volatility is higher than the next expiry (**IV1 60.69% vs IV2 53.93%**), which suggests **near-term event stress / backwardation**.
• Recent volume is only **0.64x** the 20-day average, so breakouts may be less reliable unless volume improves.
• On the daily chart, the stock currently looks like **Sideways / Range**.
• The implied distribution is **fairly balanced** between upside and downside tails.
PBF
Spot: 45.39
Report Time: 2026-04-05 06:52 PM MYT
Regime: TRANSITION
Dealer Gamma: LONG
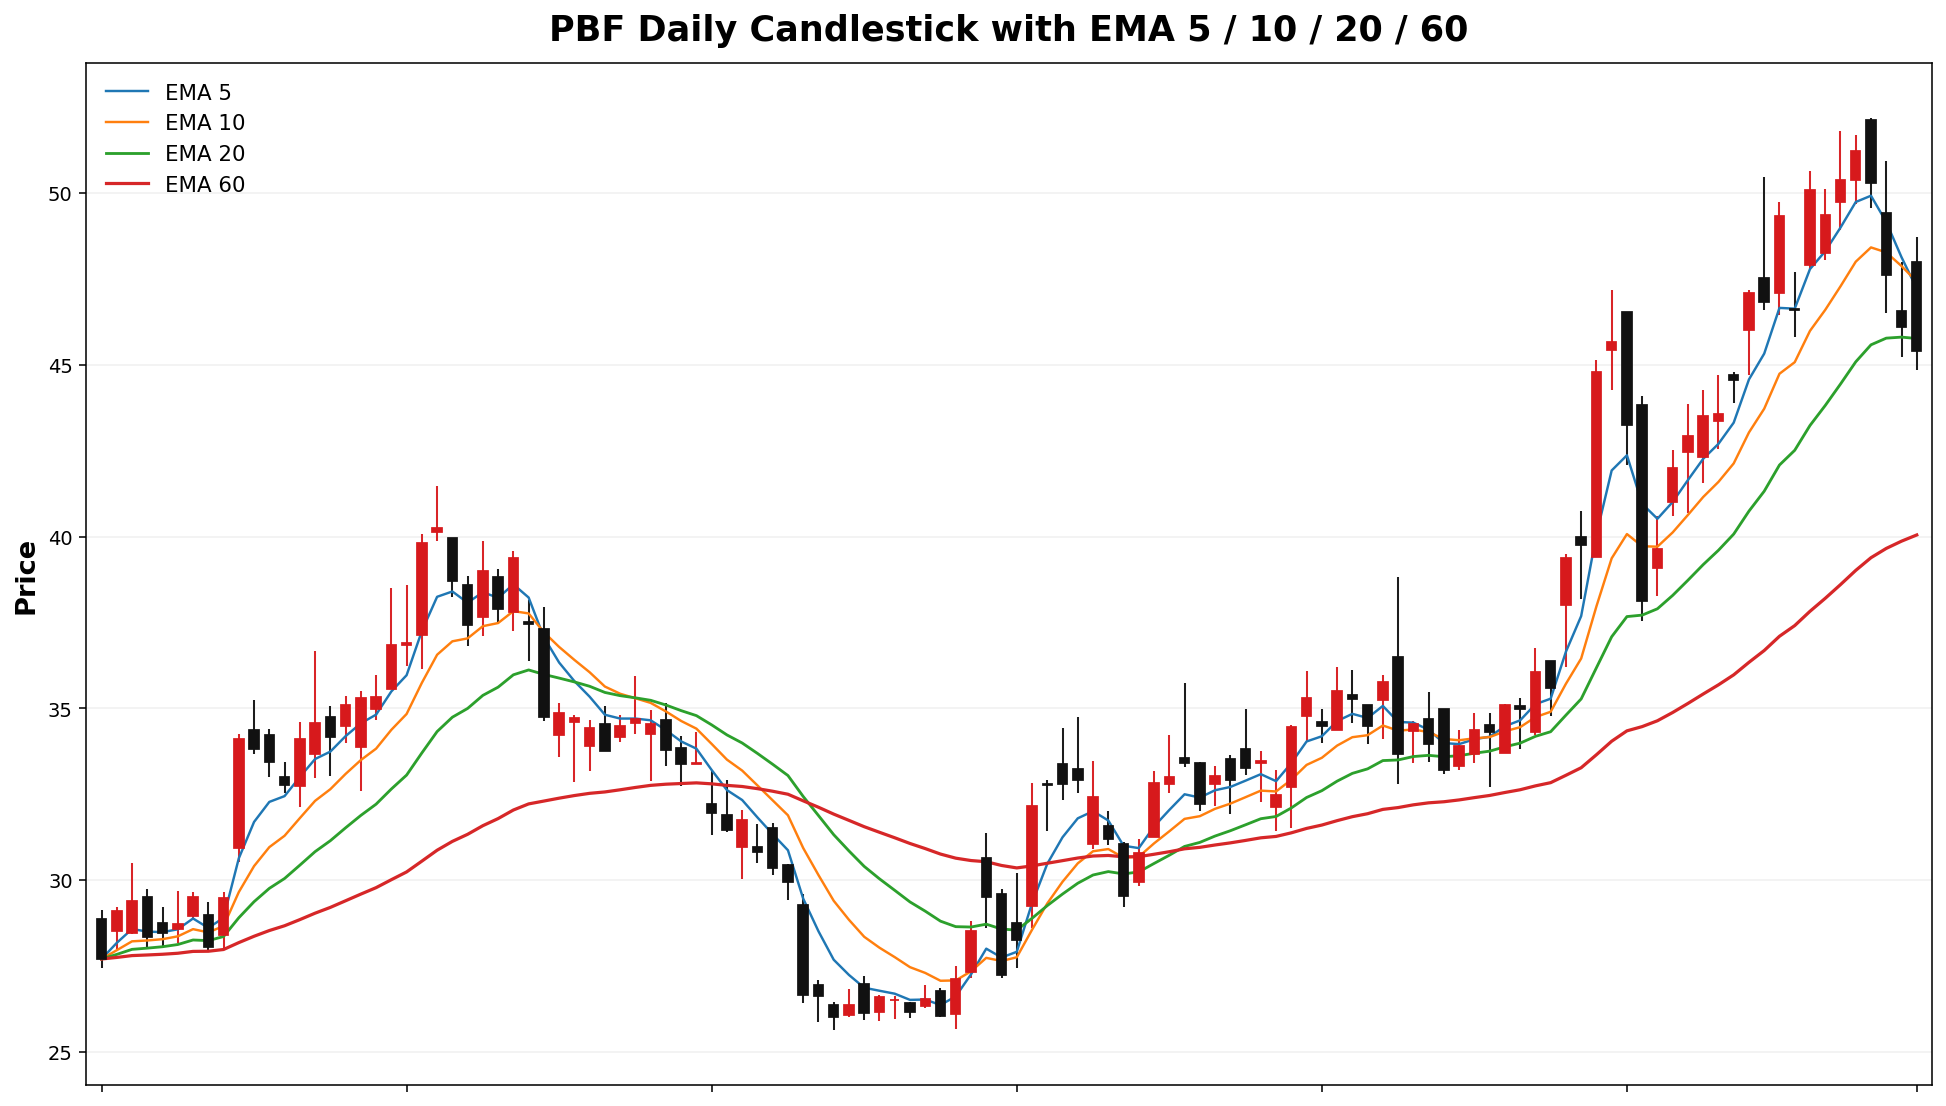
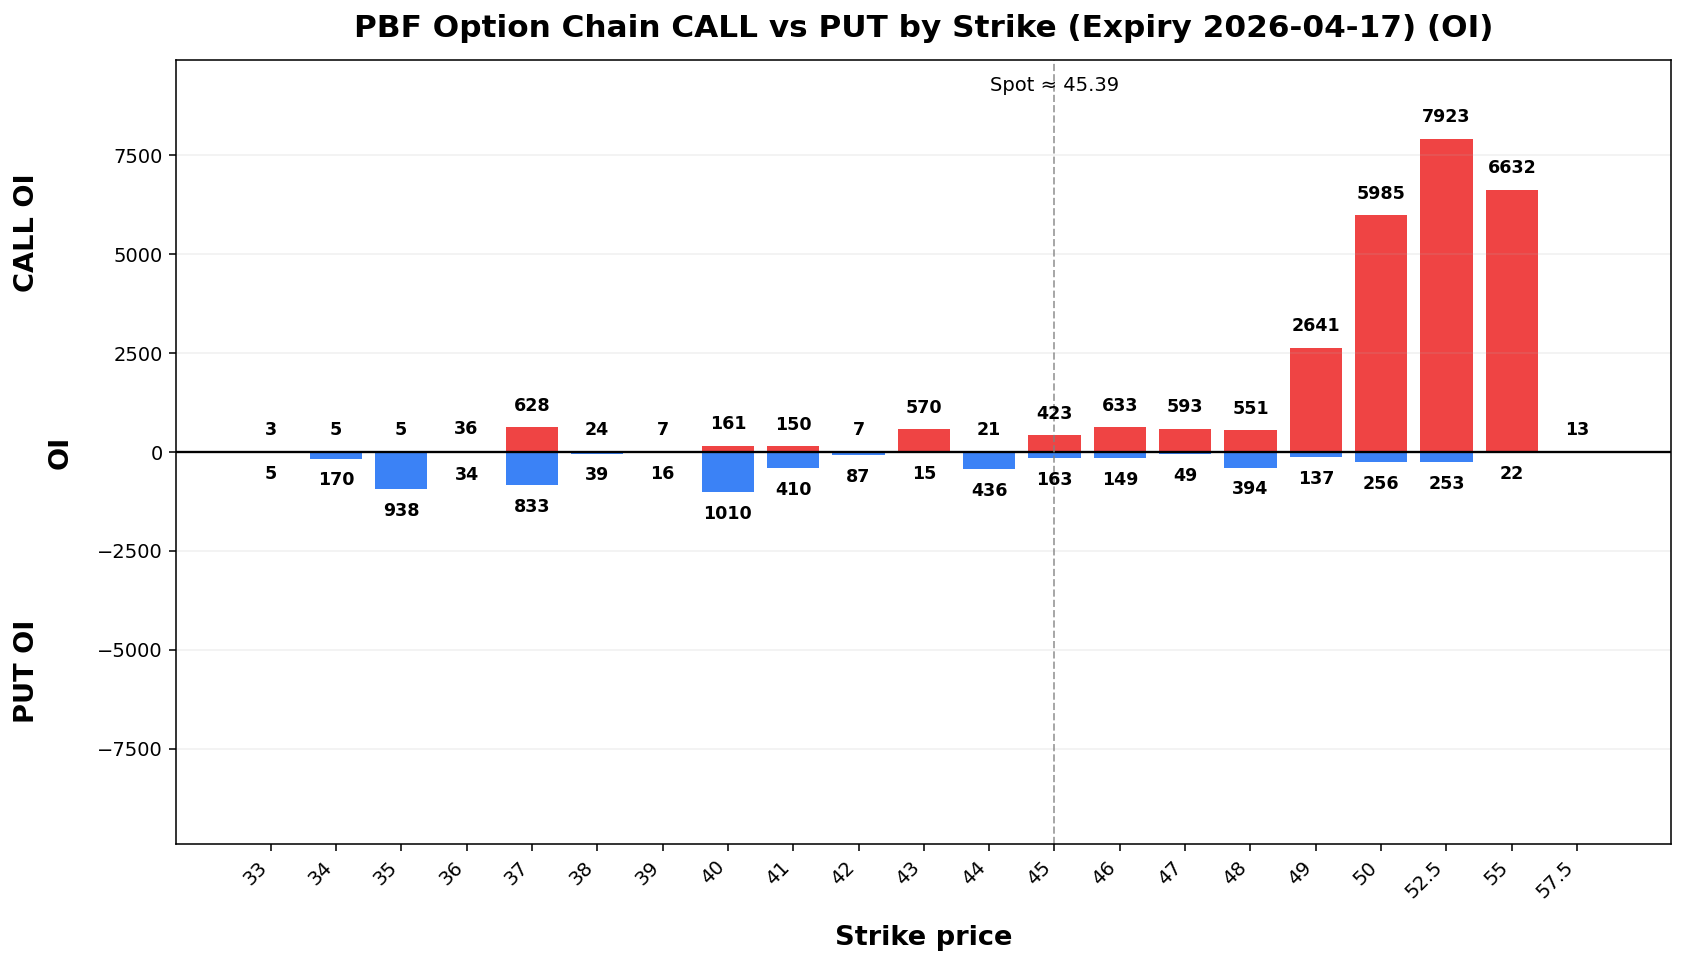
Term Structure
Expiry |
DTE |
Forward |
ATM IV |
ATM Straddle |
|---|
2026-04-17 |
13 |
45.21 |
65.82% |
5.50 |
2026-05-15 |
41 |
45.41 |
63.61% |
9.60 |
Weekly Range
Confidence |
Low |
High |
Width |
|---|
68% |
41.04 |
49.74 |
8.69 |
80% |
39.82 |
50.96 |
11.14 |
90% |
38.24 |
52.54 |
14.30 |
95% |
36.87 |
53.91 |
17.04 |
Structure & Probabilities
Support |
Resistance |
Gamma Flip |
Max Pain |
P>Res |
P<Sup |
|---|
40.00 |
49.00 |
38.31 |
44.00 |
16.9% |
8.9% |
Flow & Skew
Call Vol |
Put Vol |
Vol P/C |
Call OI |
Put OI |
OI P/C |
Skew |
Skew Bias |
|---|
660 |
486 |
0.74 |
29,374 |
16,114 |
0.55 |
-1.27 vol pts |
CALL_SKEW |
Tail Risk
Q10 |
Q50 |
Q90 |
Down Tail |
Up Tail |
Down/Up |
|---|
35.44 |
44.82 |
53.98 |
9.95 |
8.59 |
1.16 |
Daily Technicals
EMA20 |
EMA50 |
VWAP20 |
BB Lower |
BB Mid |
BB Upper |
BB Width |
Vol Ratio |
Path |
|---|
45.77 |
41.09 |
45.77 |
38.51 |
45.89 |
53.27 |
32.16% |
0.6257 |
Sideways / Range |
Day Plan
- 40.00-
49.50.00 range: fade extremes
- >
49.50.00: chase only if hold + vol
- < 40.00: risk expand; reduce size
- Regime: TRANSITION
- Tech: Sideways / Range
Swing Plan
- Accumulate: 40.00-40.00
- Trim:
49.50.00-49.50.00
- Add: close >
49.50.00
- Cut: close < 40.00
- Best for: transition regime
Raw Text Summary
📌 PBFBNO @ 45.3947.25 (2026-04-0512 06:5208:49 PMAM MYT)

• Current price is **45.39*47.25**. Key support is around **40.00**, and resistance is around **49.50.00**.
• For the next week, the model’s **68% expected range** is roughly **41.0442.37 to 49.74*52.13**.
• A wider **90% range** is about **38.2439.22 to 52.54*55.28**.
• Dealer positioning looks **LONG gamma**, so the market behavior is classified as **TRANSITION**.
• The estimated **gamma flip** is near **38.31*39.00**. Crossing and holding beyond this area can change the trading behavior.
• Approximate breakout odds: **above resistance 16.9%26.2%**, **below support 8.9%5.2%** by the target horizon.
• Options skew is fairlytilted balanced,toward so**calls**, therewhich suggests upside speculation is **norelatively strong directional bias** from skew alone.stronger.
• Near-term implied volatility is higher than the next expiry (**IV1 65.82%75.58% vs IV2 63.61%65.75%**), which suggests **near-term event stress / backwardation**.
• Recent volume is only **0.62x*57x** the 20-day average, so breakouts may be less reliable unless volume improves.
• On the daily chart, the stock currently looks like **Sideways / Range**.
• The implied distribution shows **heavier downside tail risk** than upside tail potential.
CRDOOKLO
Spot: 101.4550.25
Report Time: 2026-04-0512 06:5208:49 PMAM MYT
Regime: TRANSITIONTREND
Dealer Gamma: LONGSHORT
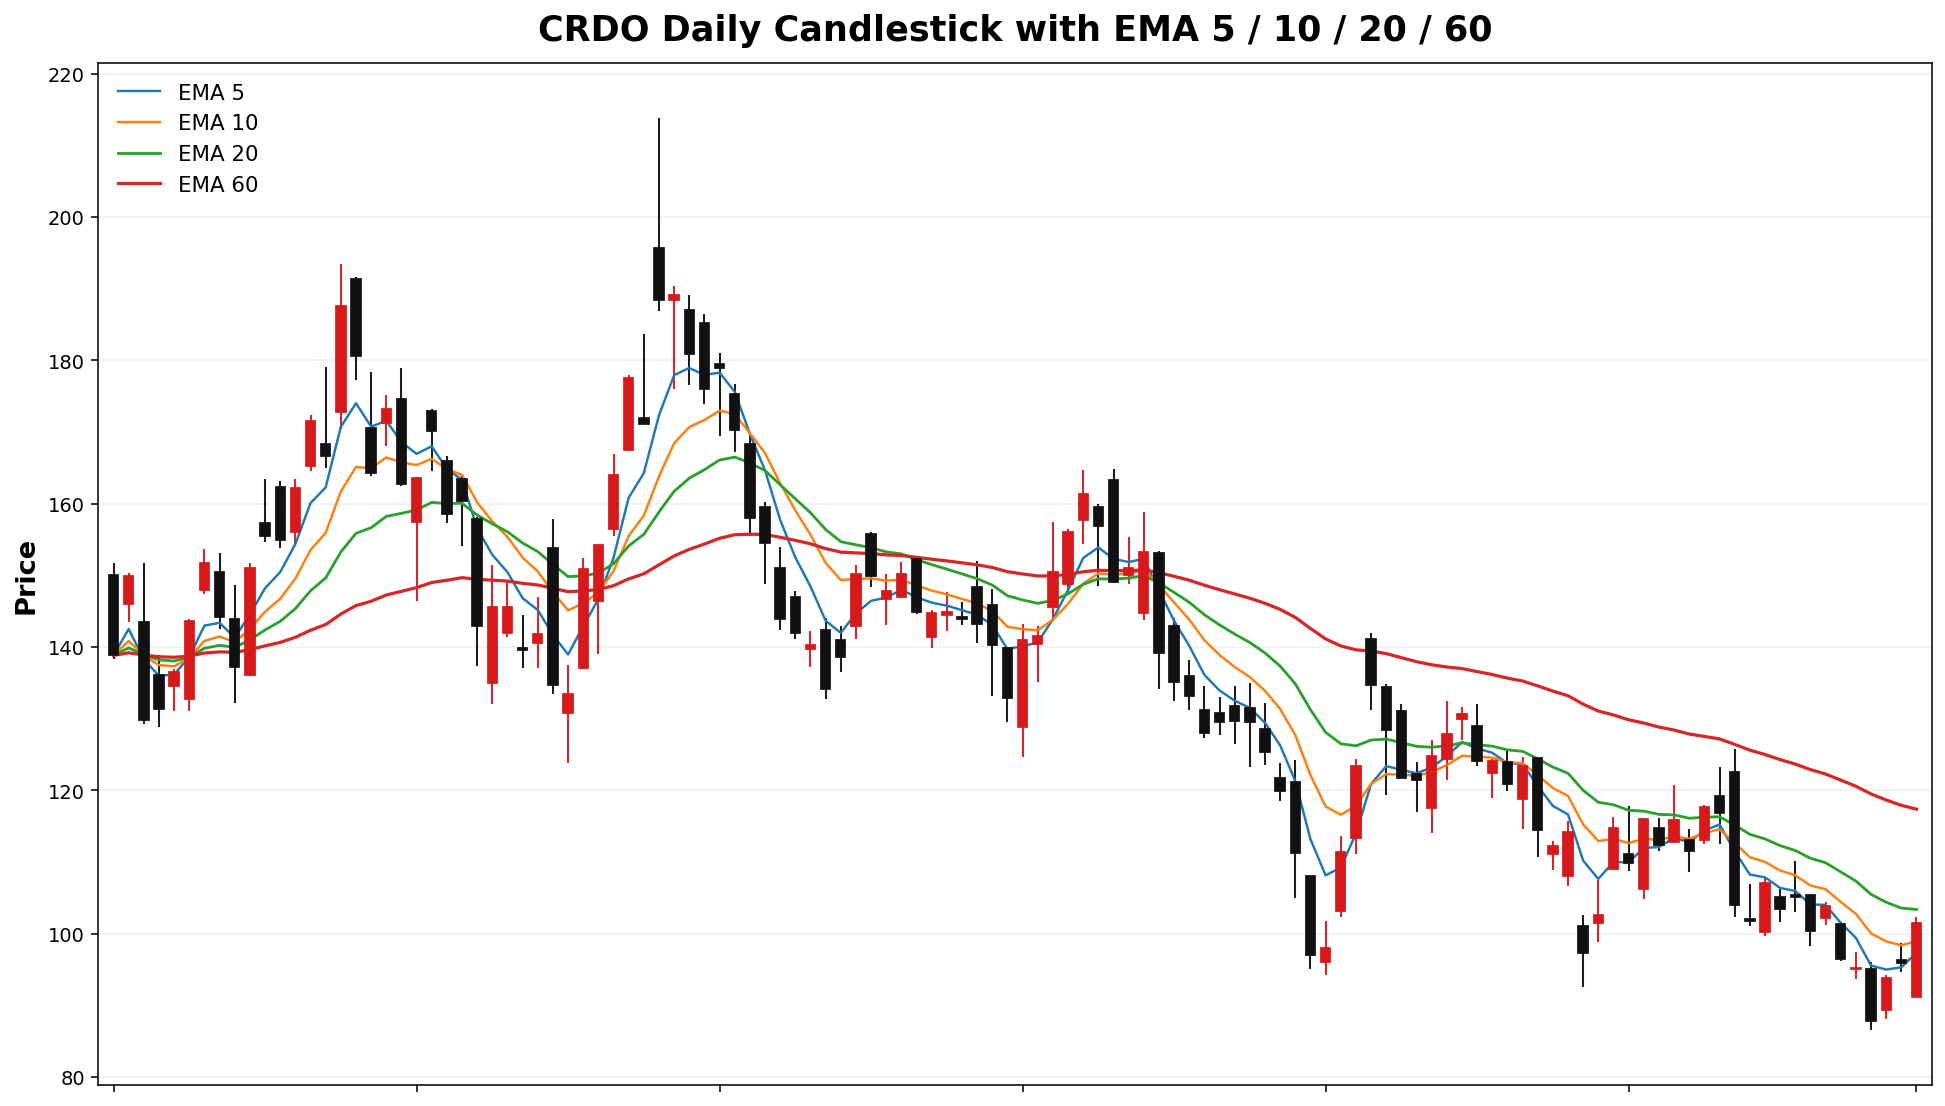
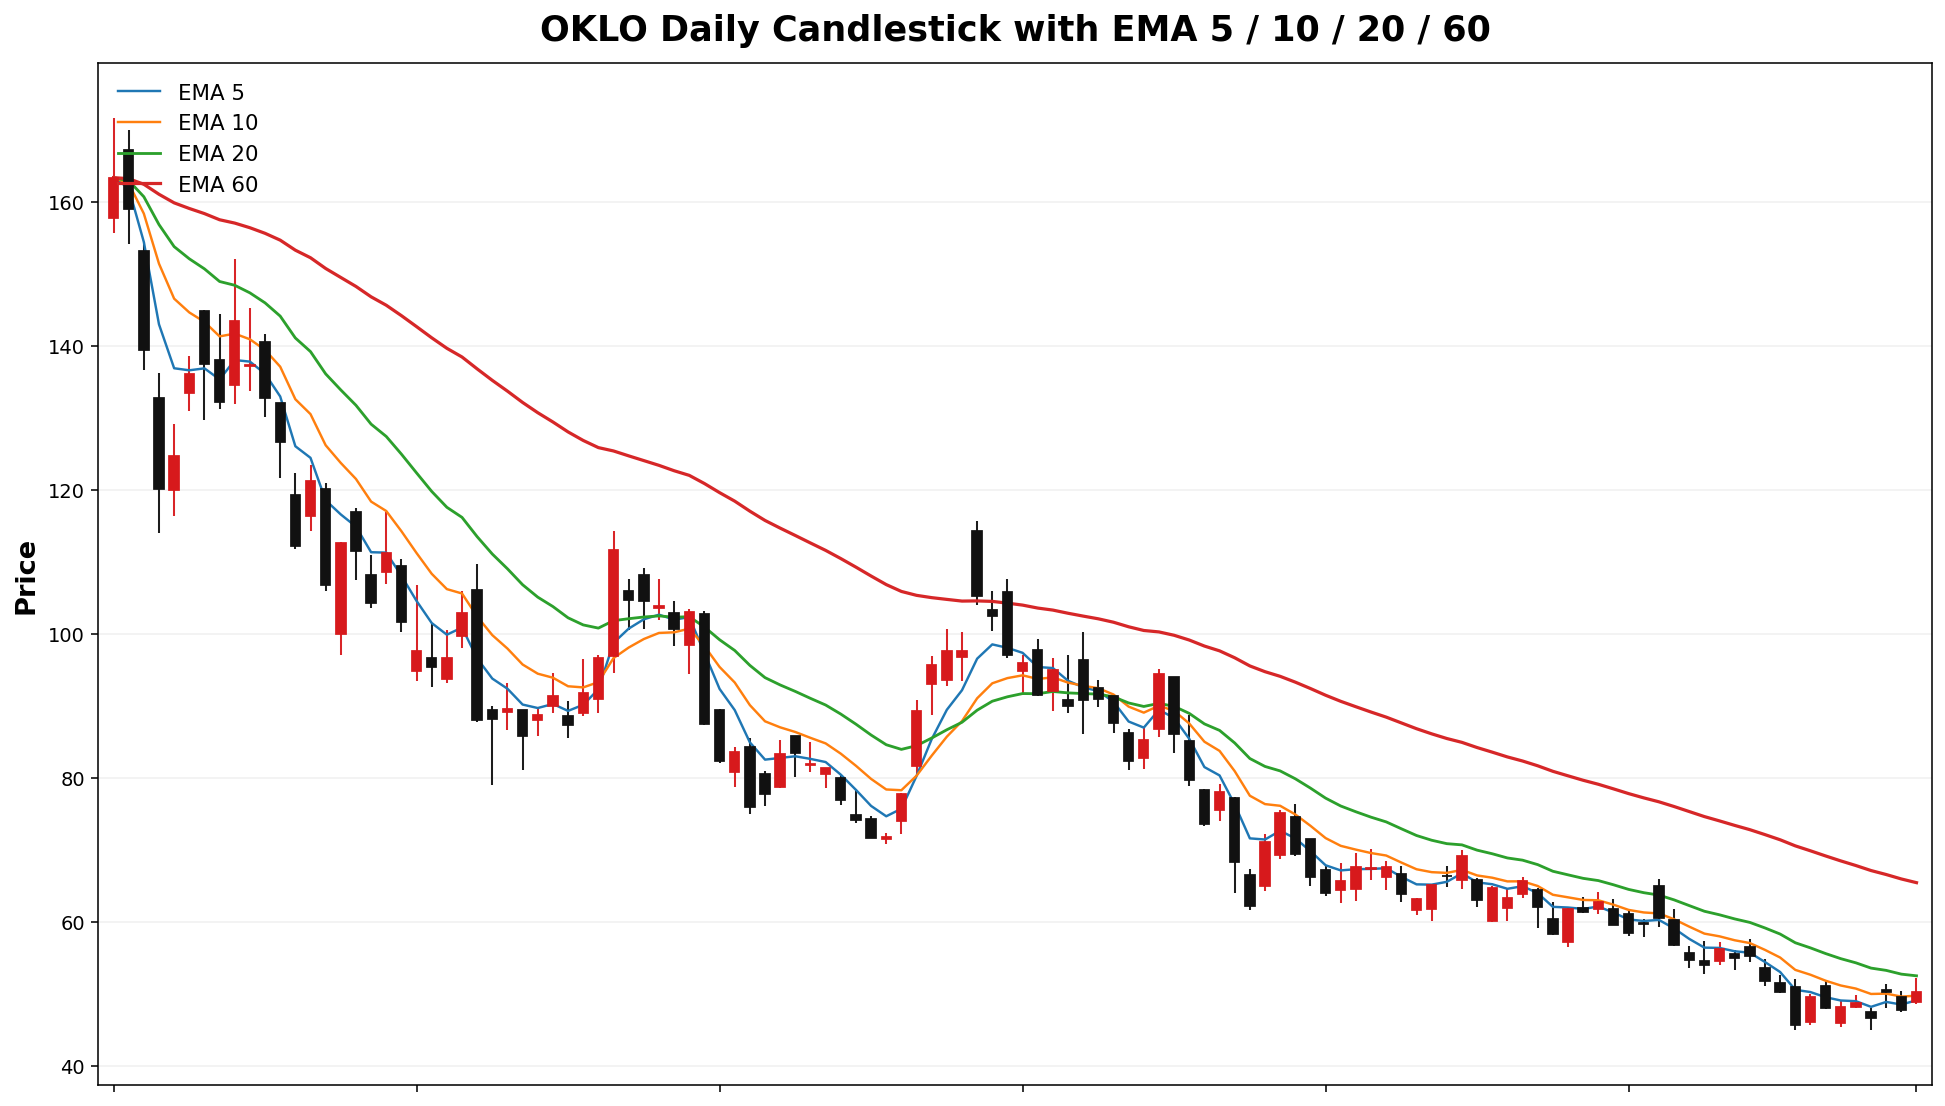
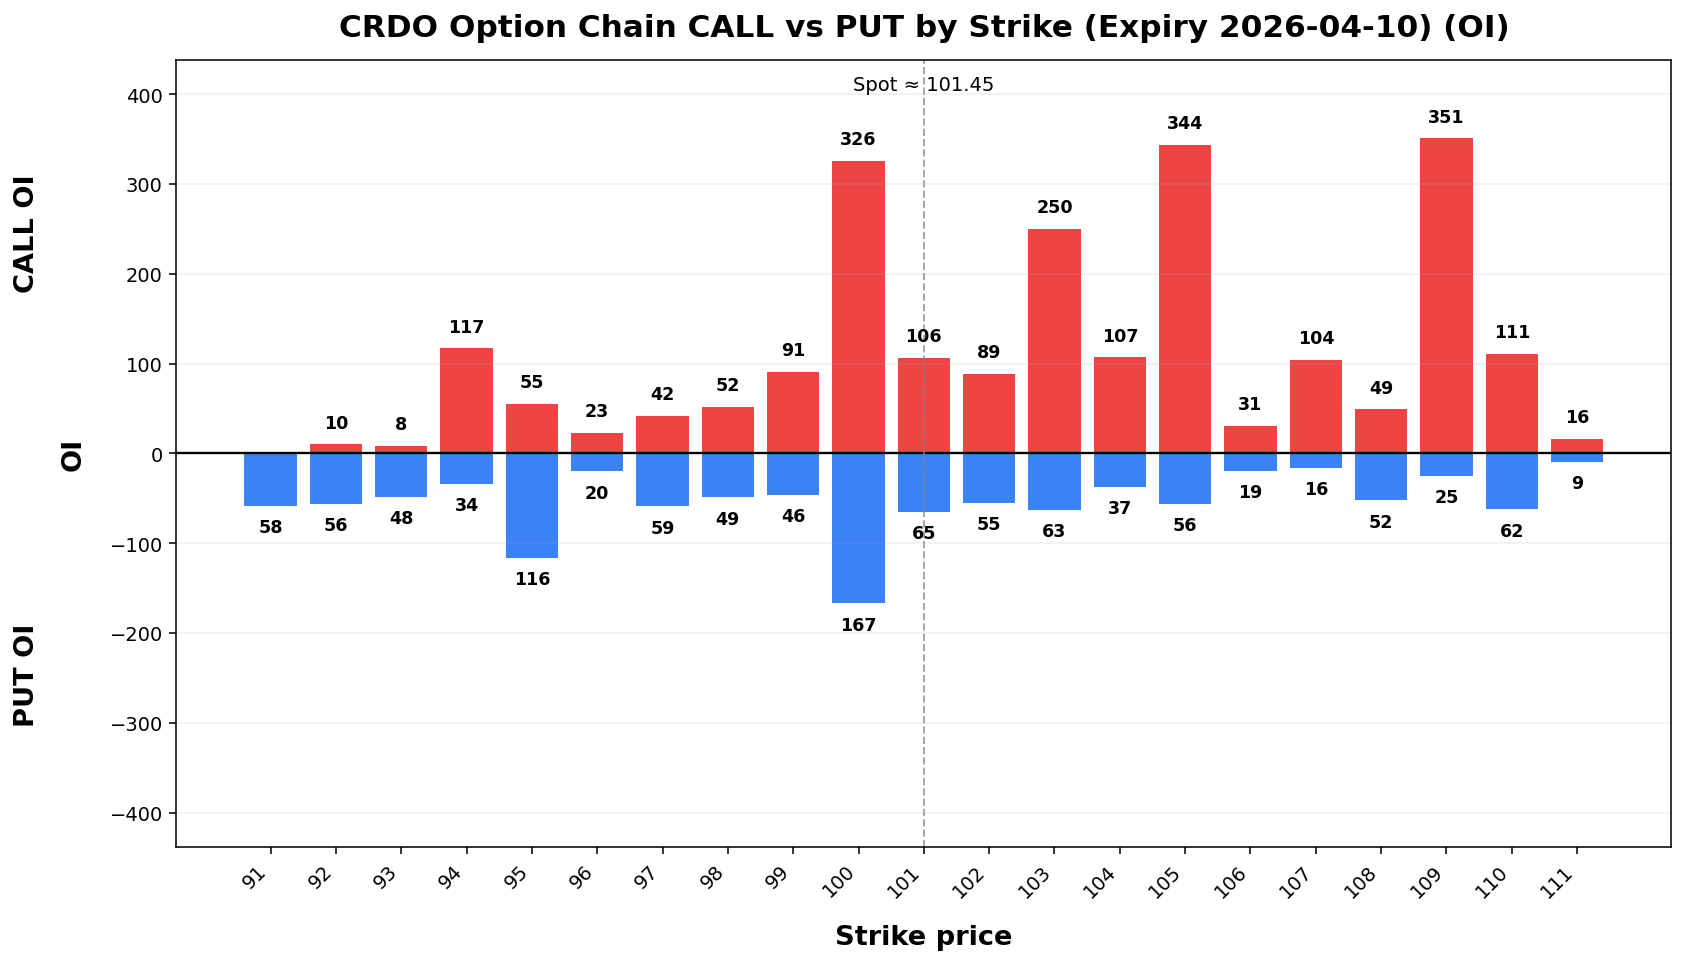
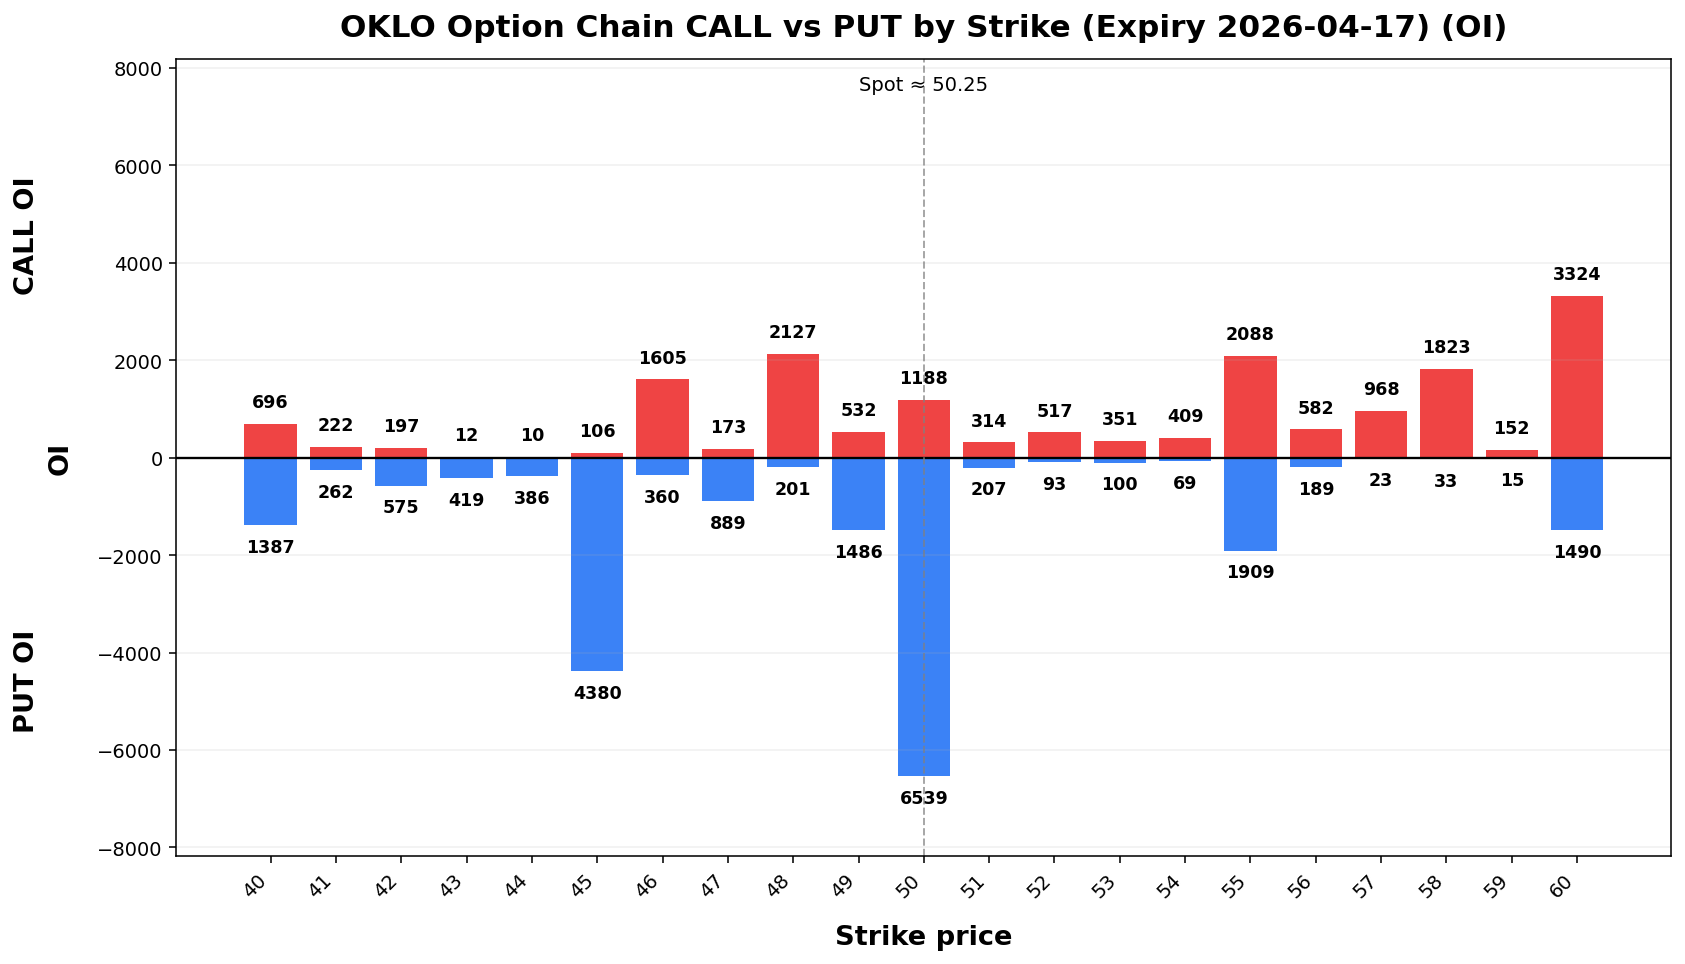
Term Structure
| Expiry |
DTE |
Forward |
ATM IV |
ATM Straddle |
2026-04-1017 |
6 |
101.8750.32 |
75.12%77.15% |
9.254.88 |
2026-04-1724 |
13 |
101.7750.30 |
71.74%73.62% |
13.406.92 |
Weekly Range
| Confidence |
Low |
High |
Width |
| 68% |
90.9344.88 |
111.9755.62 |
21.0410.74 |
| 80% |
87.9743.37 |
114.9357.13 |
26.9613.77 |
| 90% |
84.1541.42 |
118.7559.08 |
34.6017.67 |
| 95% |
80.8439.72 |
122.0660.78 |
41.2321.05 |
Structure & Probabilities
| Support |
Resistance |
Gamma Flip |
Max Pain |
P>Res |
P<Sup |
100.50.00 |
103.60.00 |
92.52.35 |
53.00 |
4.2% |
58.1% |
Flow & Skew
| Call Vol |
Put Vol |
Vol P/C |
Call OI |
Put OI |
OI P/C |
Skew |
Skew Bias |
| 13,388 |
8,041 |
0.60 |
102.42,107 |
42,487 |
1.01 |
1.86 vol pts |
PUT_SKEW |
Tail Risk
| Q10 |
Q50 |
Q90 |
Down Tail |
Up Tail |
Down/Up |
| 40.77 |
48.85 |
57.38 |
9.48 |
7.13 |
1.33 |
Daily Technicals
| EMA20 |
EMA50 |
VWAP20 |
BB Lower |
BB Mid |
BB Upper |
BB Width |
Vol Ratio |
Path |
| 52.47 |
61.63 |
53.53 |
43.36 |
52.37 |
61.38 |
34.39% |
0.85 |
DOWN trend (expanding) |
Day Plan
- 50.00-60.00 range: fade extremes
- > 60.00: chase only if hold + vol
- < 50.00: risk expand; reduce size
- Regime: TREND
- Tech: DOWN trend (expanding)
Swing Plan
- Accumulate: 50.00-50.00
- Trim: 60.00-60.00
- Add: close > 60.00
- Cut: close < 50.00
- Best for: trend regime
Raw Text Summary
📌 OKLO @ 50.25 (2026-04-12 08:49 AM MYT)

• Current price is **50.25**. Key support is around **50.00**, and resistance is around **60.00**.
• For the next week, the model’s **68% expected range** is roughly **44.88 to 55.62**.
• A wider **90% range** is about **41.42 to 59.08**.
• Dealer positioning looks **SHORT gamma**, so the market behavior is classified as **TREND**.
• The estimated **gamma flip** is near **52.35**. Crossing and holding beyond this area can change the trading behavior.
• Approximate breakout odds: **above resistance 4.2%**, **below support 58.1%** by the target horizon.
• Options skew is fairly balanced, so there is **no strong directional bias** from skew alone.
• Near-term implied volatility is higher than the next expiry (**IV1 77.15% vs IV2 73.62%**), which suggests **near-term event stress / backwardation**.
• On the daily chart, the stock currently looks like **DOWN trend (expanding)**.
• The implied distribution shows **heavier downside tail risk** than upside tail potential.
IREN
Spot: 39.32
Report Time: 2026-04-12 08:49 AM MYT
Regime: TRANSITION
Dealer Gamma: LONG
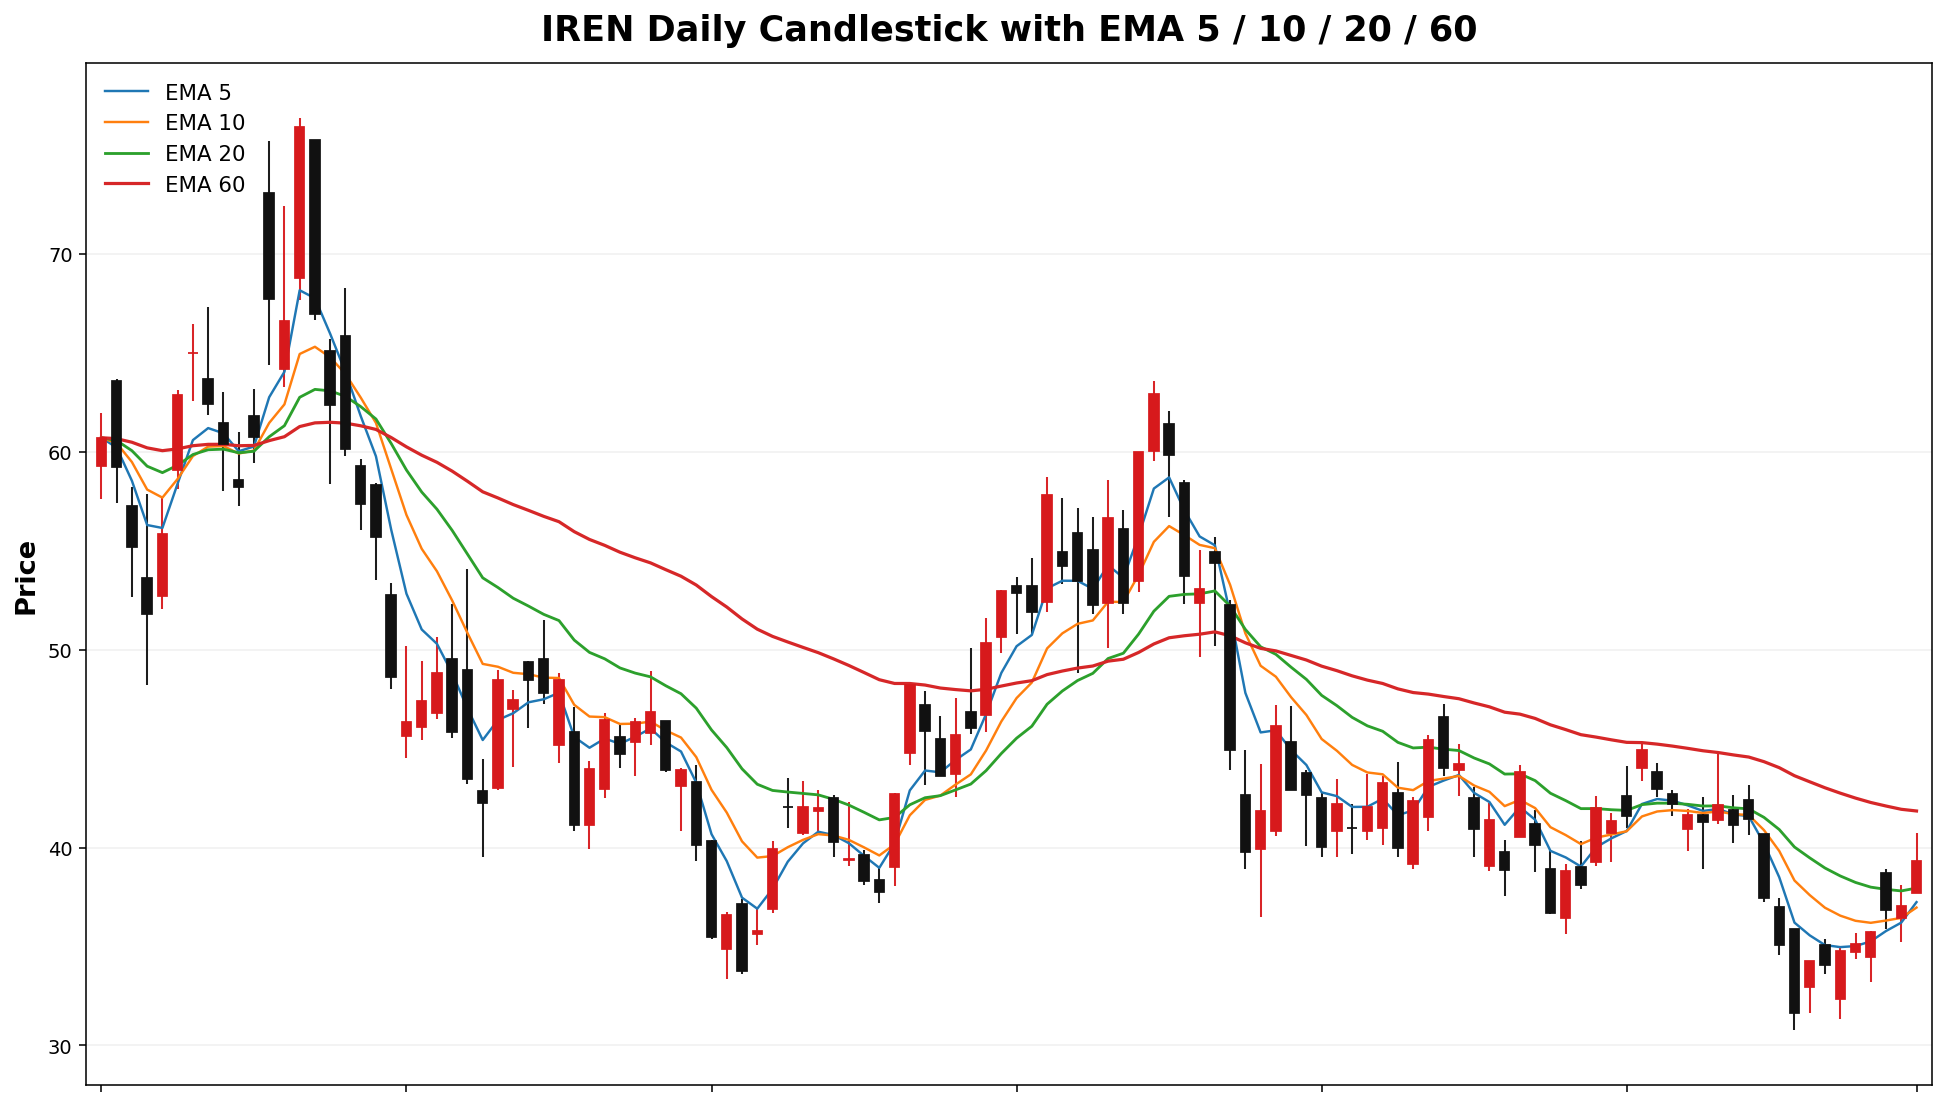
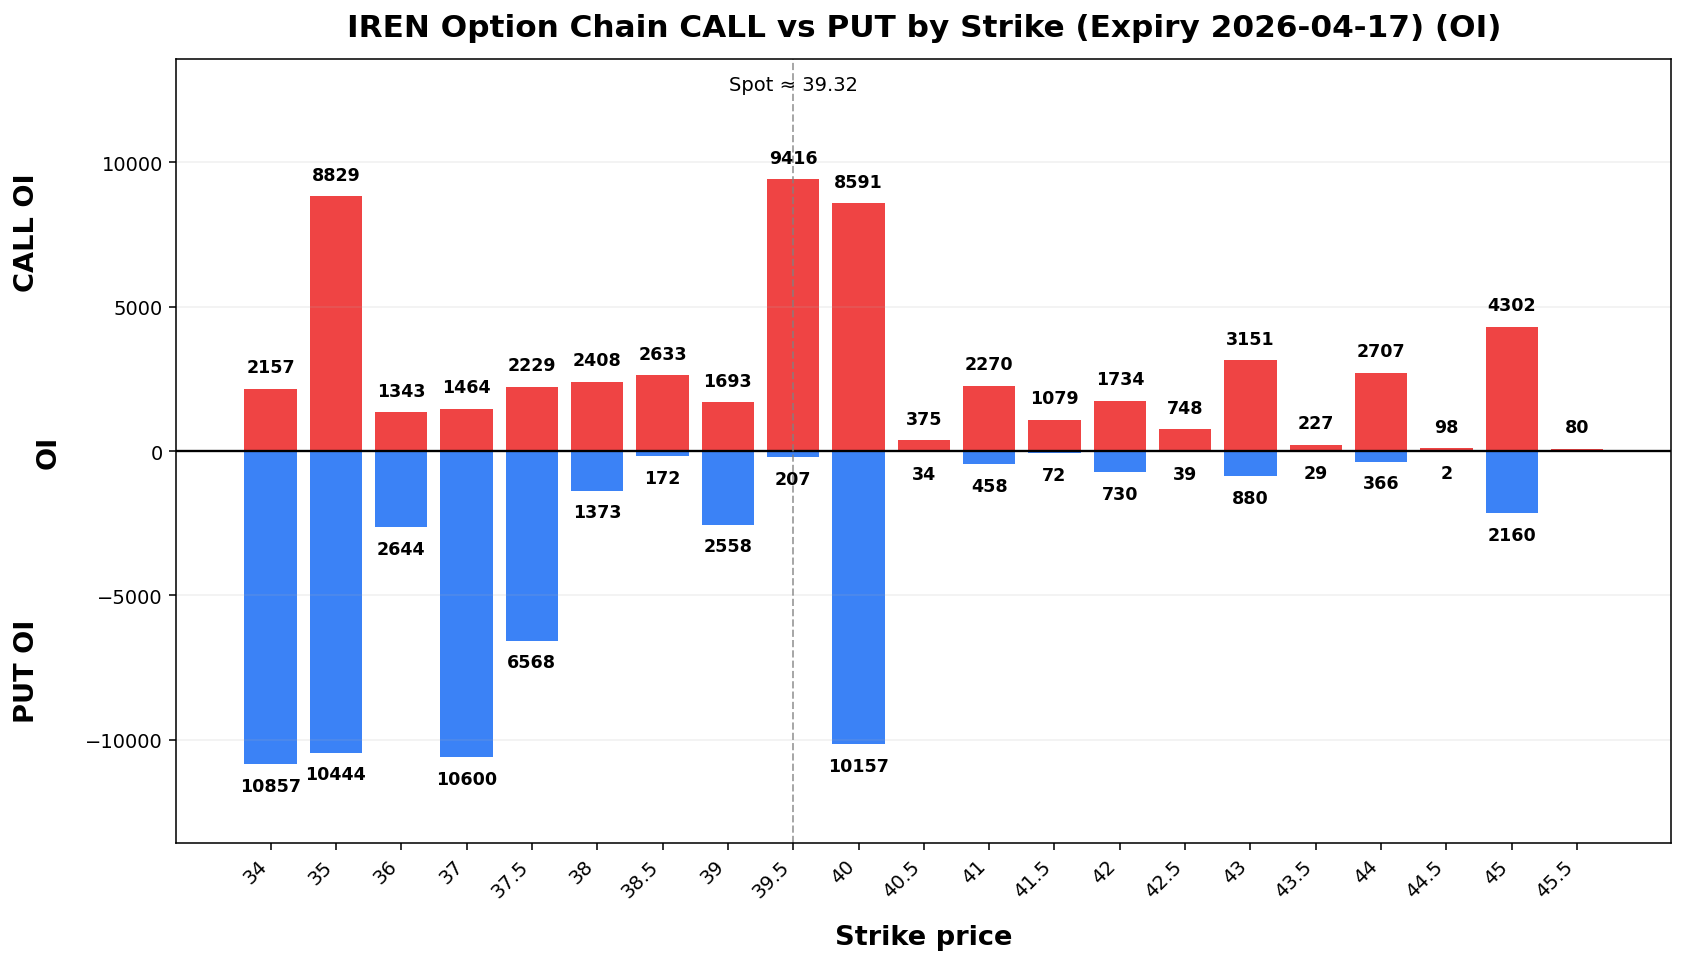
Term Structure
| Expiry |
DTE |
Forward |
ATM IV |
ATM Straddle |
| 2026-04-17 |
6 |
39.38 |
80.43% |
3.99 |
| 2026-04-24 |
13 |
39.45 |
79.95% |
5.88 |
Weekly Range
| Confidence |
Low |
High |
Width |
| 68% |
34.87 |
43.77 |
8.89 |
| 80% |
33.62 |
45.02 |
11.39 |
| 90% |
32.01 |
46.63 |
14.62 |
| 95% |
30.61 |
48.03 |
17.42 |
Structure & Probabilities
| Support |
Resistance |
Gamma Flip |
Max Pain |
P>Res |
P<Sup |
| 37.50 |
39.50 |
38.04 |
37.50 |
39.7% |
33.5% |
Flow & Skew
| Call Vol |
Put Vol |
Vol P/C |
Call OI |
Put OI |
OI P/C |
Skew |
Skew Bias |
| 53,934 |
31,105 |
0.58 |
108,296 |
101,040 |
0.93 |
7.91 vol pts |
PUT_SKEW |
Tail Risk
| Q10 |
Q50 |
Q90 |
Down Tail |
Up Tail |
Down/Up |
| 31.40 |
39.45 |
46.14 |
7.92 |
6.82 |
1.16 |
Daily Technicals
| EMA20 |
EMA50 |
VWAP20 |
BB Lower |
BB Mid |
BB Upper |
BB Width |
Vol Ratio |
Path |
| 37.96 |
40.84 |
38.69 |
31.04 |
38.54 |
46.03 |
38.91% |
1.12 |
Sideways / Range |
Day Plan
- 37.50-39.50 range: fade extremes
- > 39.50: chase only if hold + vol
- < 37.50: risk expand; reduce size
- Regime: TRANSITION
- Tech: Sideways / Range
Swing Plan
- Accumulate: 37.50-37.50
- Trim: 39.50-39.50
- Add: close > 39.50
- Cut: close < 37.50
- Best for: transition regime
Raw Text Summary
📌 IREN @ 39.32 (2026-04-12 08:49 AM MYT)

• Current price is **39.32**. Key support is around **37.50**, and resistance is around **39.50**.
• For the next week, the model’s **68% expected range** is roughly **34.87 to 43.77**.
• A wider **90% range** is about **32.01 to 46.63**.
• Dealer positioning looks **LONG gamma**, so the market behavior is classified as **TRANSITION**.
• The estimated **gamma flip** is near **38.04**. Crossing and holding beyond this area can change the trading behavior.
• Approximate breakout odds: **above resistance 39.7%**, **below support 33.5%** by the target horizon.
• Options skew is tilted toward **puts**, which suggests traders are paying more for downside protection.
• Near-term implied volatility is higher than the next expiry (**IV1 80.43% vs IV2 79.95%**), which suggests **near-term event stress / backwardation**.
• On the daily chart, the stock currently looks like **Sideways / Range**.
• The implied distribution shows **heavier downside tail risk** than upside tail potential.
ETHU
Spot: 25.66
Report Time: 2026-04-12 08:49 AM MYT
Regime: TRANSITION
Dealer Gamma: LONG
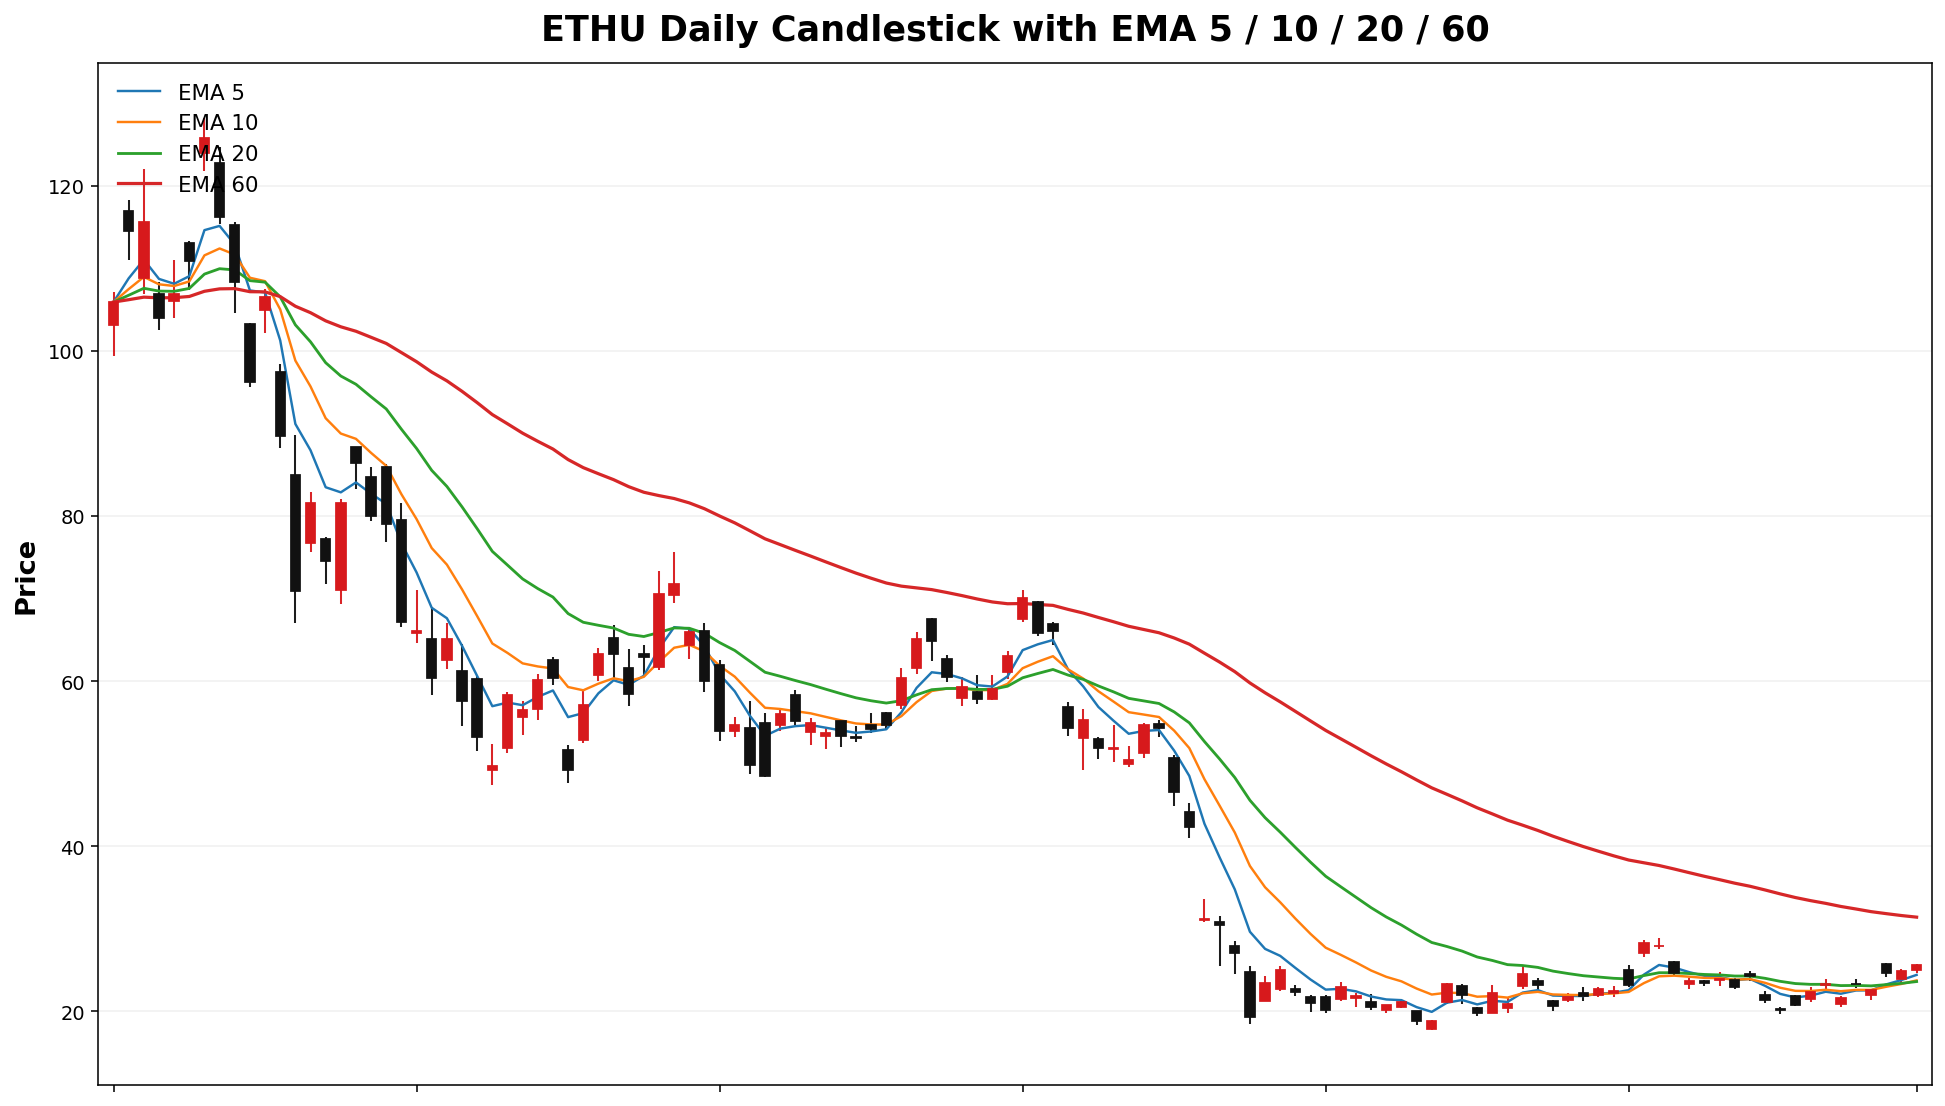
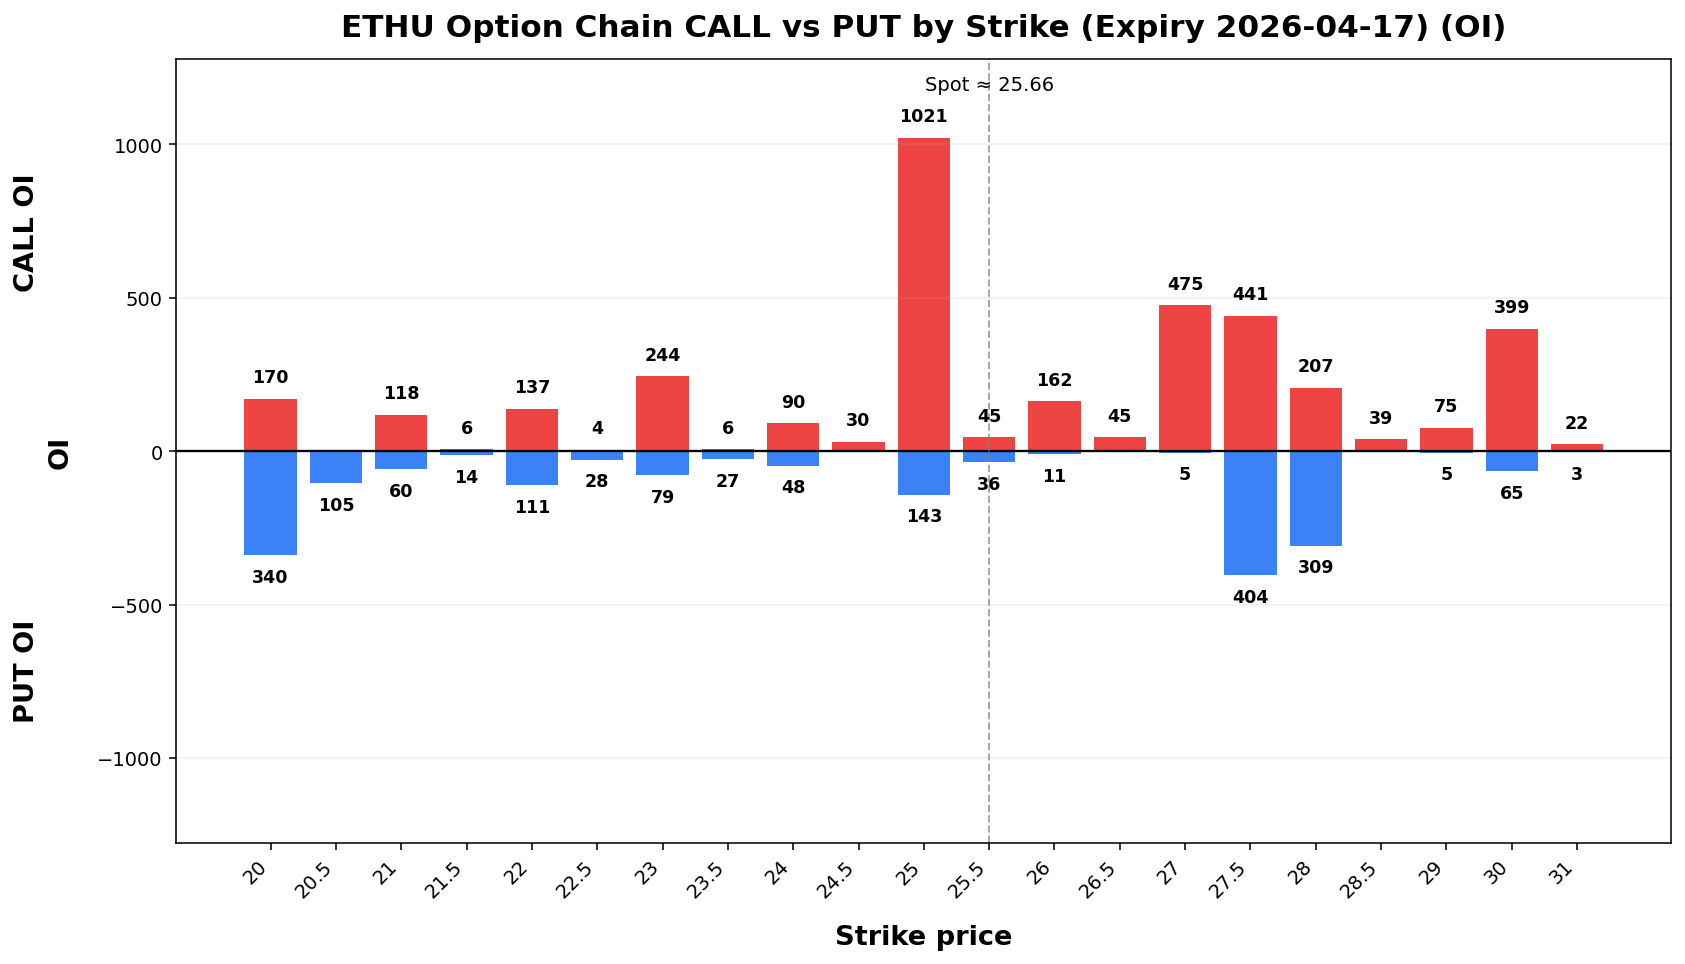
Term Structure
| Expiry |
DTE |
Forward |
ATM IV |
ATM Straddle |
| 2026-04-17 |
6 |
25.50 |
97.43% |
3.15 |
| 2026-04-24 |
13 |
25.46 |
97.33% |
4.67 |
Weekly Range
| Confidence |
Low |
High |
Width |
| 68% |
22.14 |
29.18 |
7.04 |
| 80% |
21.15 |
30.17 |
9.02 |
| 90% |
19.87 |
31.45 |
11.58 |
| 95% |
18.76 |
32.56 |
13.80 |
Structure & Probabilities
| Support |
Resistance |
Gamma Flip |
Max Pain |
P>Res |
P<Sup |
| 25.00 |
33.7%27.00 |
40.6%21.42 |
25.00 |
29.9% |
36.2% |
Flow & Skew
| Call Vol |
Put Vol |
Vol P/C |
Call OI |
Put OI |
OI P/C |
Skew |
Skew Bias |
2,517210 |
1,185780 |
0.4735 |
5,306 |
4,679 |
2,899525 |
0.6285 |
6.691.76 vol pts |
PUT_SKEW |
Tail Risk
| Q10 |
Q50 |
Q90 |
Down Tail |
Up Tail |
Down/Up |
87.337.65 |
103.1824.73 |
115.3729.68 |
14.1218.01 |
13.924.02 |
1.014.48 |
Daily Technicals
| EMA20 |
EMA50 |
VWAP20 |
BB Lower |
BB Mid |
BB Upper |
BB Width |
Vol Ratio |
Path |
103.3723.60 |
114.4528.99 |
105.86 |
87.74 |
104.83 |
121.23.91 |
32.59%19.53 |
23.65 |
27.76 |
34.81% |
0.7685 |
DOWNSideways trend/ (expanding)Range |
Day Plan
100.25.00-103.27.00 range: fade extremes- >
103.27.00: chase only if hold + vol
- <
100.25.00: risk expand; reduce size
- Regime: TRANSITION
- Tech:
DOWNSideways trend/ (expanding)Range
Swing Plan
- Accumulate:
100.25.00-100.25.00
- Trim:
103.27.00-103.27.00
- Add: close >
103.27.00
- Cut: close <
100.25.00
- Best for: transition regime
Raw Text Summary
📌 CRDOETHU @ 101.4525.66 (2026-04-0512 06:5208:49 PMAM MYT)

• Current price is **101.45*25.66**. Key support is around **100.25.00**, and resistance is around **103.27.00**.
• For the next week, the model’s **68% expected range** is roughly **90.9322.14 to 111.97*29.18**.
• A wider **90% range** is about **84.1519.87 to 118.75*31.45**.
• Dealer positioning looks **LONG gamma**, so the market behavior is classified as **TRANSITION**.
• The estimated **gamma flip** is near **92.60*21.42**. Crossing and holding beyond this area can change the trading behavior.
• Approximate breakout odds: **above resistance 33.7%29.9%**, **below support 36.2%** by the target horizon.
• Options skew is fairly balanced, so there is **no strong directional bias** from skew alone.
• Near-term implied volatility is higher than the next expiry (**IV1 97.43% vs IV2 97.33%**), which suggests **near-term event stress / backwardation**.
• On the daily chart, the stock currently looks like **Sideways / Range**.
• The implied distribution shows **heavier downside tail risk** than upside tail potential.
DPST
Spot: 114.01
Report Time: 2026-04-12 08:49 AM MYT
Regime: TRANSITION
Dealer Gamma: LONG
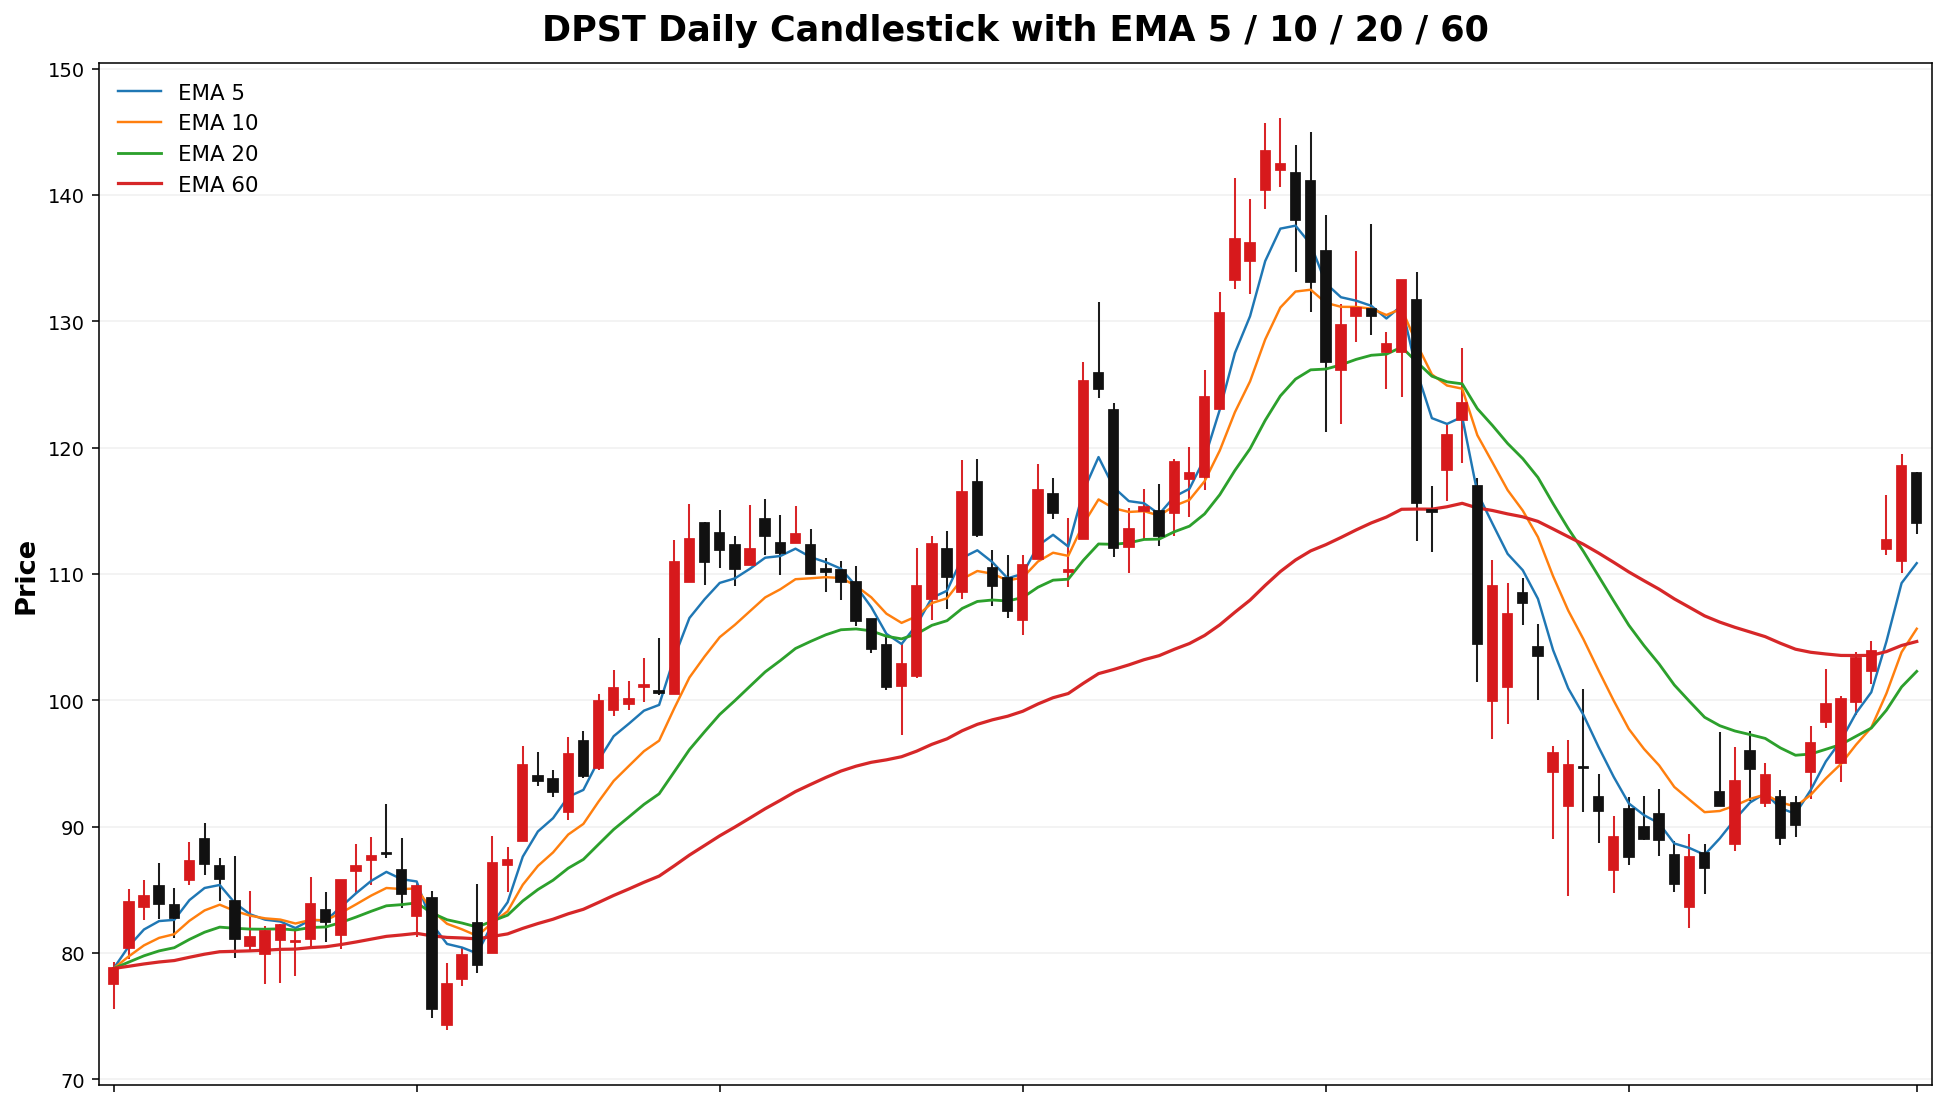
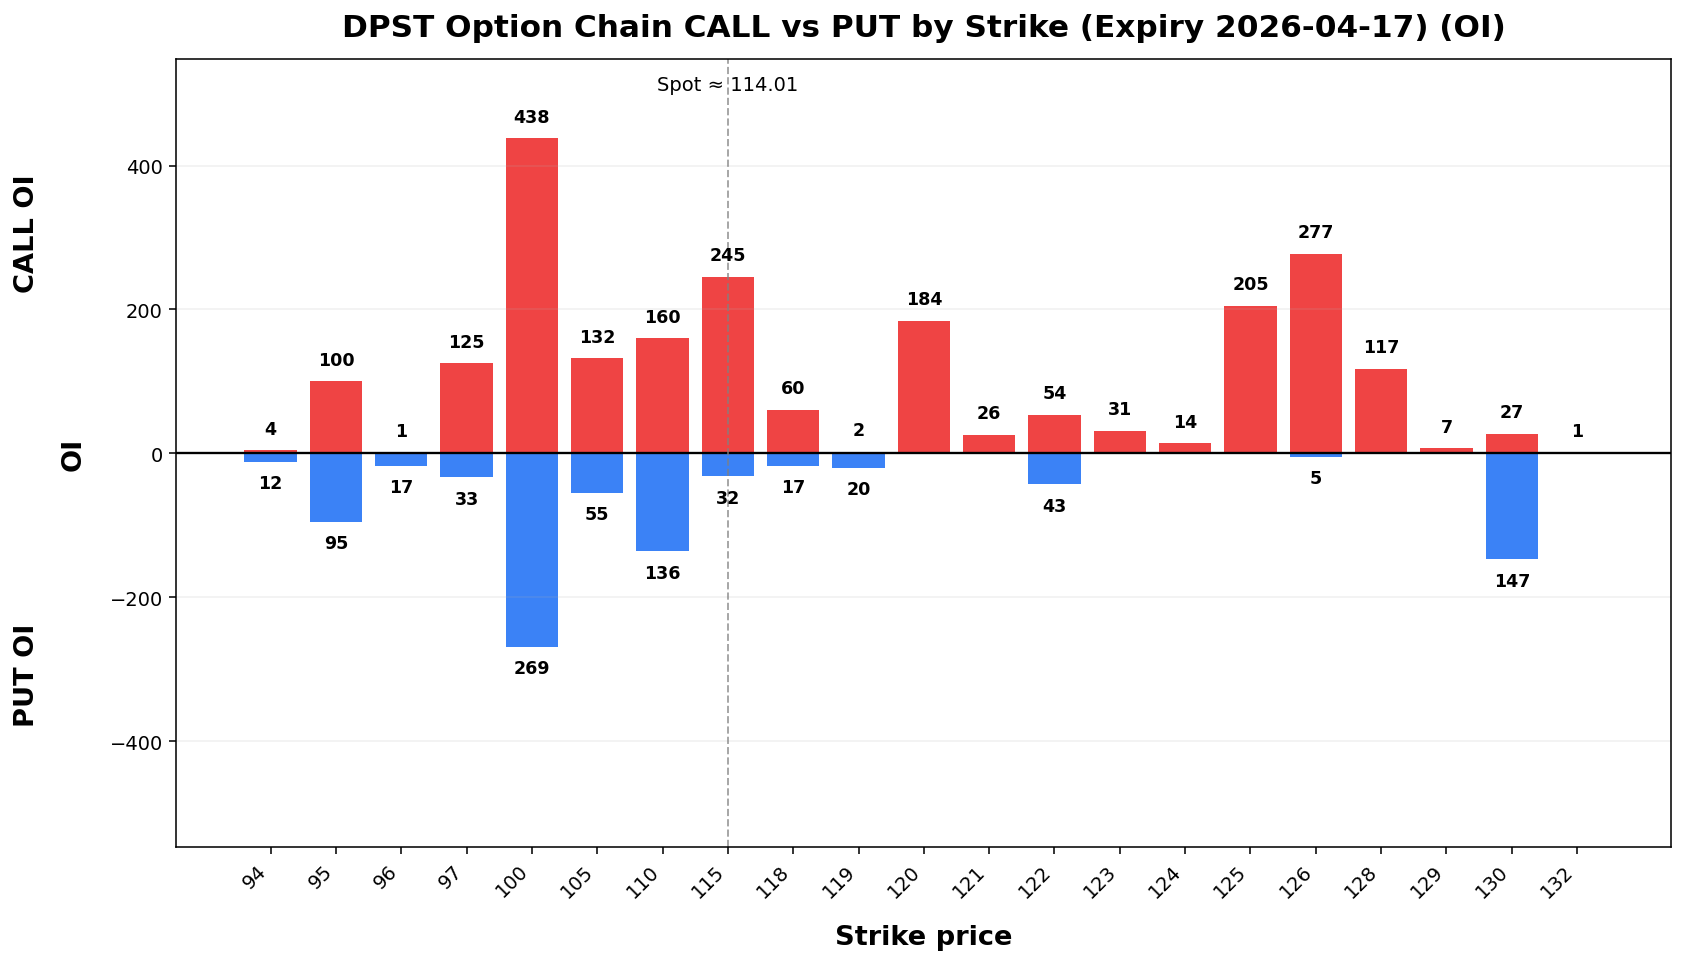
Term Structure
| Expiry |
DTE |
Forward |
ATM IV |
ATM Straddle |
| 2026-04-17 |
6 |
114.14 |
62.30% |
8.95 |
| 2026-04-24 |
13 |
114.42 |
64.43% |
13.75 |
Weekly Range
| Confidence |
Low |
High |
Width |
| 68% |
103.88 |
124.14 |
20.26 |
| 80% |
101.03 |
126.99 |
25.97 |
| 90% |
97.35 |
130.67 |
33.33 |
| 95% |
94.15 |
133.87 |
39.71 |
Structure & Probabilities
| Support |
Resistance |
Gamma Flip |
Max Pain |
P>Res |
P<Sup |
| 100.00 |
115.00 |
99.23 |
100.00 |
34.6% |
7.5% |
Flow & Skew
| Call Vol |
Put Vol |
Vol P/C |
Call OI |
Put OI |
OI P/C |
Skew |
Skew Bias |
| 551 |
688 |
1.25 |
2,418 |
3,436 |
1.42 |
7.76 vol pts |
PUT_SKEW |
Tail Risk
| Q10 |
Q50 |
Q90 |
Down Tail |
Up Tail |
Down/Up |
| 95.53 |
113.85 |
127.69 |
18.48 |
13.68 |
1.35 |
Daily Technicals
| EMA20 |
EMA50 |
VWAP20 |
BB Lower |
BB Mid |
BB Upper |
BB Width |
Vol Ratio |
Path |
| 102.29 |
104.56 |
96.42 |
76.89 |
96.38 |
115.87 |
40.44% |
1.02 |
Sideways / Range |
Day Plan
- 100.00-115.00 range: fade extremes
- > 115.00: chase only if hold + vol
- < 100.00: risk expand; reduce size
- Regime: TRANSITION
- Tech: Sideways / Range
Swing Plan
- Accumulate: 100.00-100.00
- Trim: 115.00-115.00
- Add: close > 115.00
- Cut: close < 100.00
- Best for: transition regime
Raw Text Summary
📌 DPST @ 114.01 (2026-04-12 08:49 AM MYT)

• Current price is **114.01**. Key support is around **100.00**, and resistance is around **115.00**.
• For the next week, the model’s **68% expected range** is roughly **103.88 to 124.14**.
• A wider **90% range** is about **97.35 to 130.67**.
• Dealer positioning looks **LONG gamma**, so the market behavior is classified as **TRANSITION**.
• The estimated **gamma flip** is near **99.23**. Crossing and holding beyond this area can change the trading behavior.
• Approximate breakout odds: **above resistance 34.6%**, **below support 7.5%** by the target horizon.
• Options skew is tilted toward **puts**, which suggests traders are paying more for downside protection.
• Near-term implied volatility is lower than the next expiry (**IV1 62.30% vs IV2 64.43%**), which suggests a **contango / calmer front expiry** setup.
• On the daily chart, the stock currently looks like **Sideways / Range**.
• The implied distribution shows **heavier downside tail risk** than upside tail potential.
USD
Spot: 61.89
Report Time: 2026-04-12 08:49 AM MYT
Regime: TRANSITION
Dealer Gamma: LONG
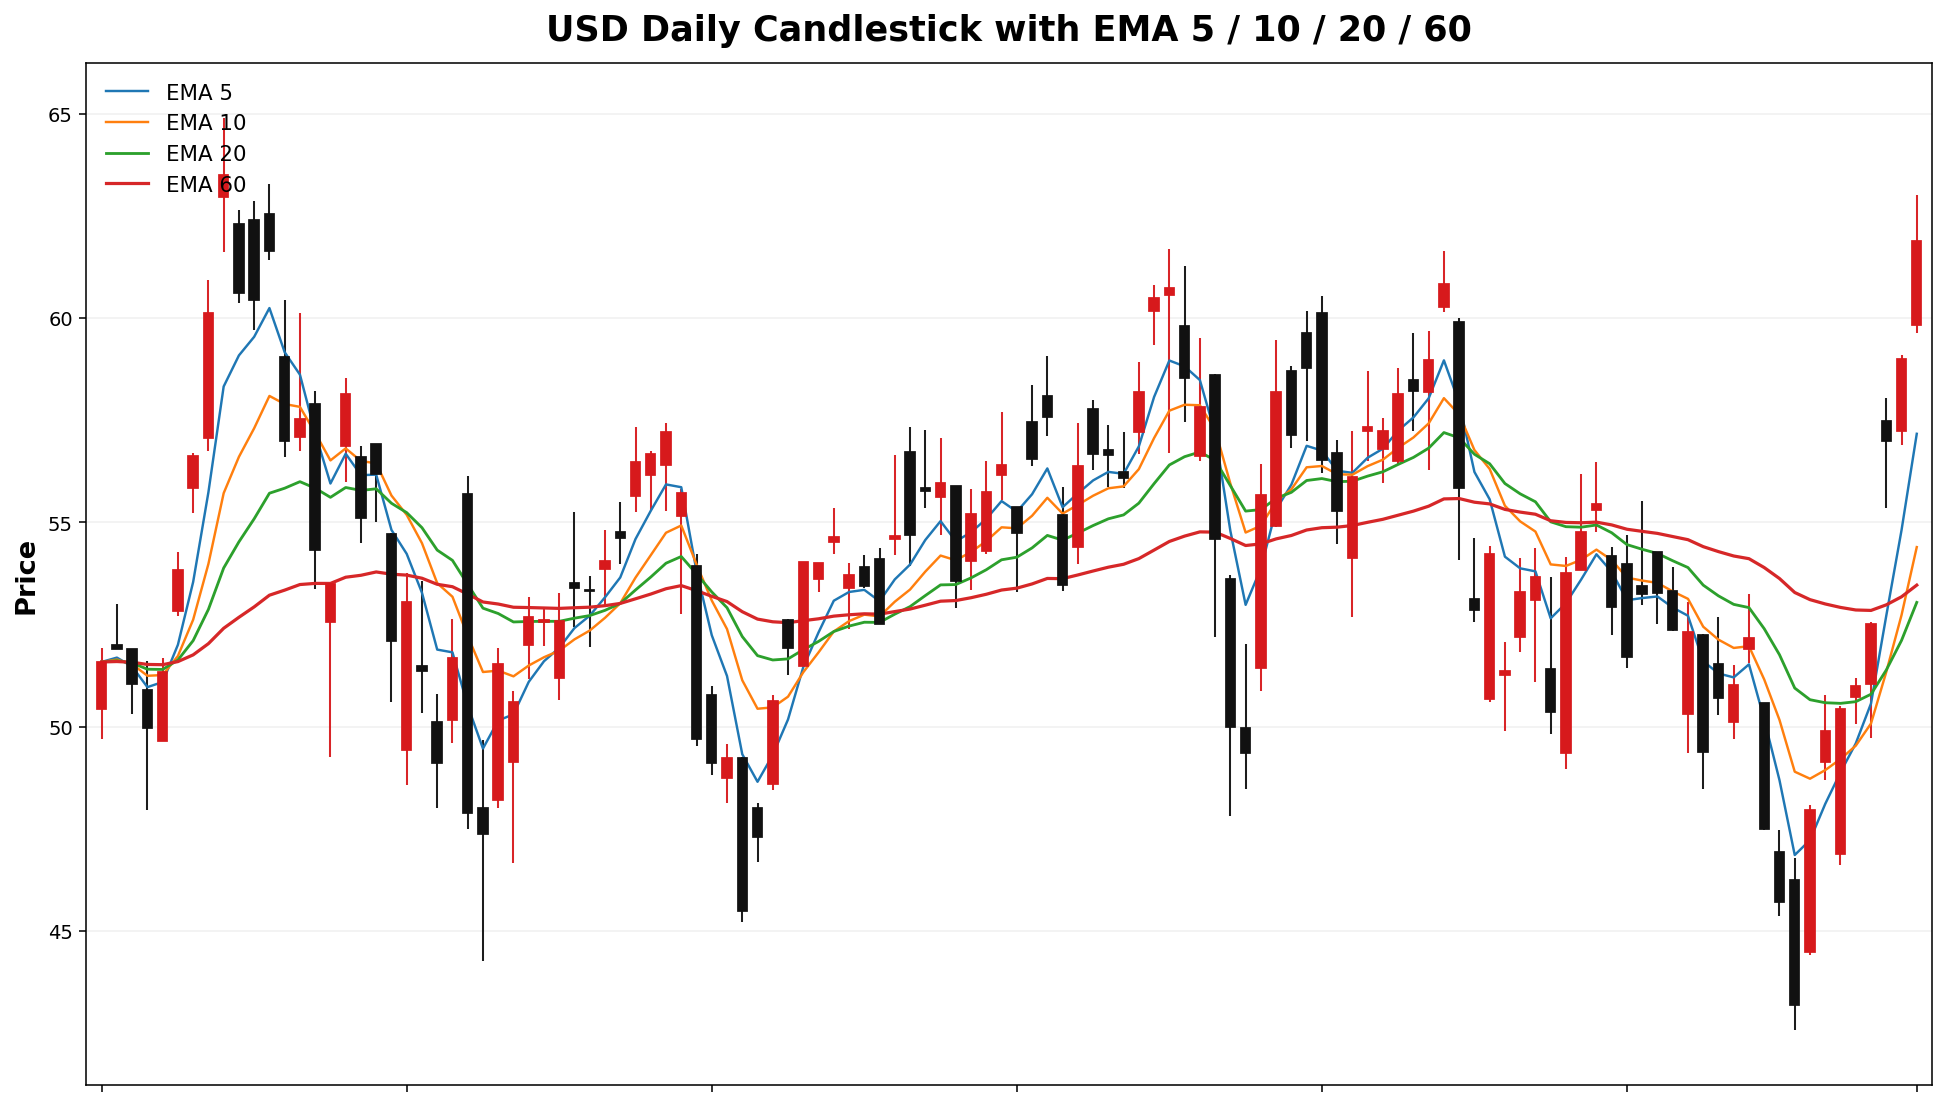
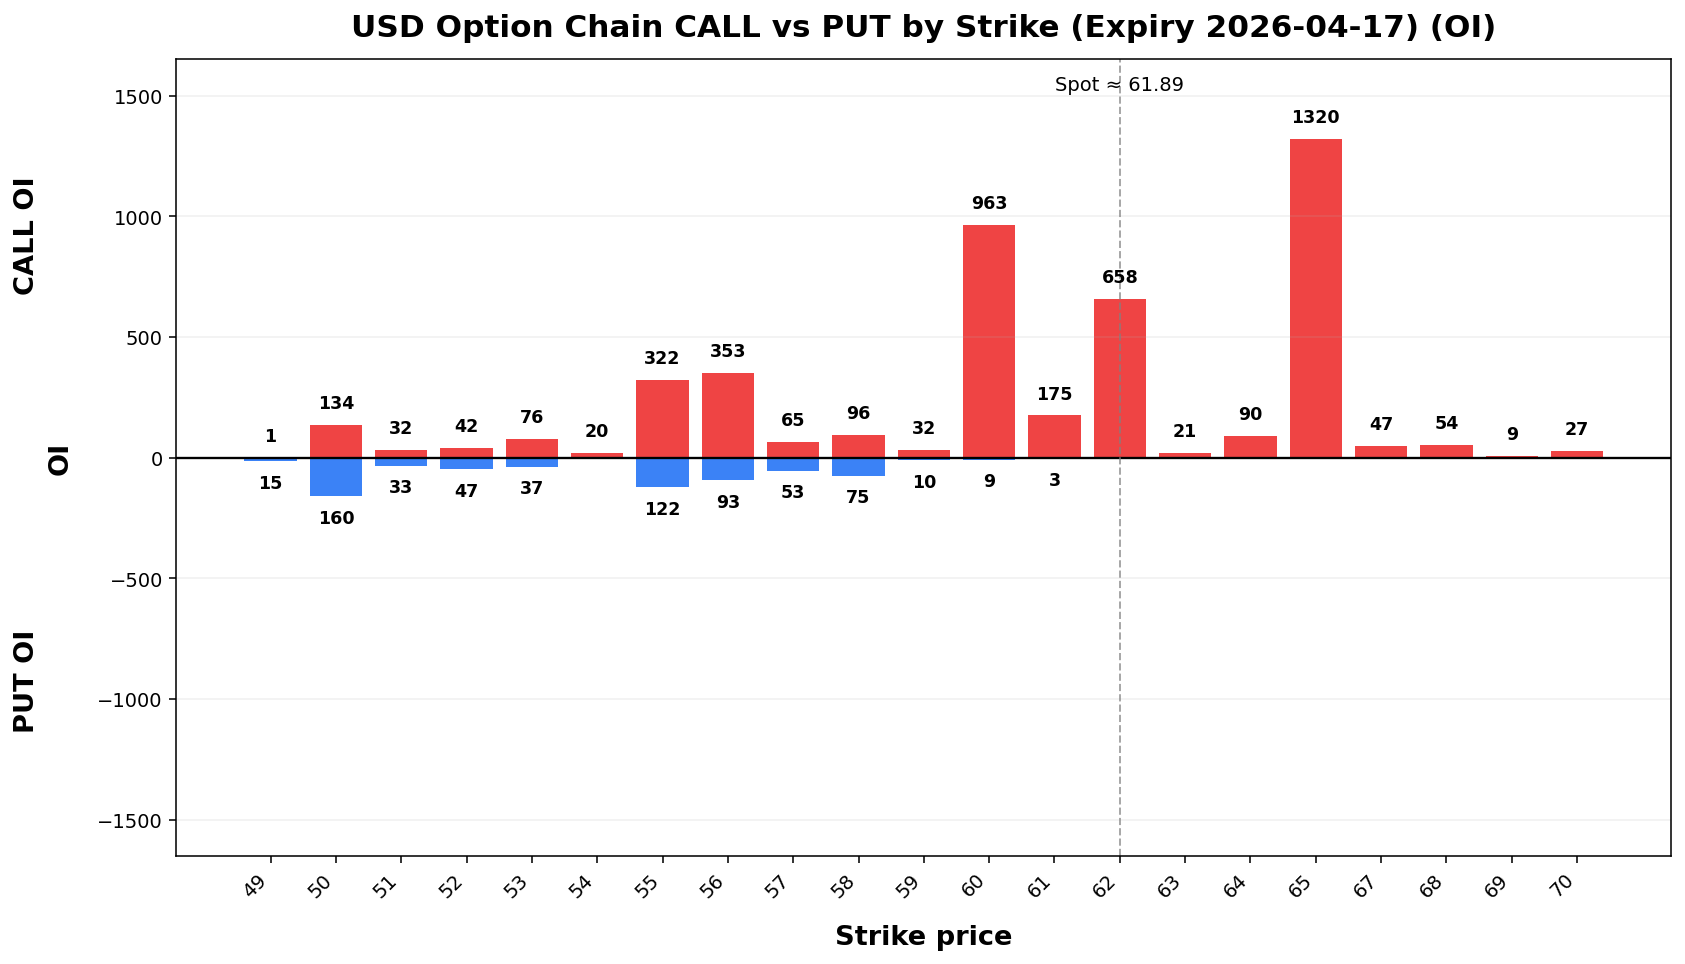
Term Structure
| Expiry |
DTE |
Forward |
ATM IV |
ATM Straddle |
| 2026-04-17 |
6 |
62.05 |
71.81% |
5.60 |
| 2026-05-15 |
34 |
61.96 |
64.00% |
12.05 |
Weekly Range
| Confidence |
Low |
High |
Width |
| 68% |
55.79 |
67.99 |
12.21 |
| 80% |
54.07 |
69.71 |
15.64 |
| 90% |
51.85 |
71.93 |
20.08 |
| 95% |
49.93 |
73.85 |
23.92 |
Structure & Probabilities
| Support |
Resistance |
Gamma Flip |
Max Pain |
P>Res |
P<Sup |
| 61.00 |
62.00 |
48.57 |
53.00 |
40.5% |
43.4% |
Flow & Skew
| Call Vol |
Put Vol |
Vol P/C |
Call OI |
Put OI |
OI P/C |
Skew |
Skew Bias |
| 480 |
870 |
1.81 |
4,730 |
2,236 |
0.47 |
39.16 vol pts |
PUT_SKEW |
Tail Risk
| Q10 |
Q50 |
Q90 |
Down Tail |
Up Tail |
Down/Up |
| 53.91 |
64.47 |
68.77 |
7.98 |
6.88 |
1.16 |
Daily Technicals
| EMA20 |
EMA50 |
VWAP20 |
BB Lower |
BB Mid |
BB Upper |
BB Width |
Vol Ratio |
Path |
| 53.04 |
53.31 |
51.70 |
43.10 |
51.61 |
60.12 |
32.98% |
1.14 |
Sideways / Range |
Day Plan
- 61.00-62.00 range: fade extremes
- > 62.00: chase only if hold + vol
- < 61.00: risk expand; reduce size
- Regime: TRANSITION
- Tech: Sideways / Range
Swing Plan
- Accumulate: 61.00-61.00
- Trim: 62.00-62.00
- Add: close > 62.00
- Cut: close < 61.00
- Best for: transition regime
Raw Text Summary
📌 USD @ 61.89 (2026-04-12 08:49 AM MYT)

• Current price is **61.89**. Key support is around **61.00**, and resistance is around **62.00**.
• For the next week, the model’s **68% expected range** is roughly **55.79 to 67.99**.
• A wider **90% range** is about **51.85 to 71.93**.
• Dealer positioning looks **LONG gamma**, so the market behavior is classified as **TRANSITION**.
• The estimated **gamma flip** is near **48.57**. Crossing and holding beyond this area can change the trading behavior.
• Approximate breakout odds: **above resistance 40.5%**, **below support 43.4%** by the target horizon.
• Options skew is tilted toward **puts**, which suggests traders are paying more for downside protection.
• Near-term implied volatility is higher than the next expiry (**IV1 75.12%71.81% vs IV2 71.74%64.00%**), which suggests **near-term event stress / backwardation**.
• On the daily chart, the stock currently looks like **Sideways / Range**.
• The implied distribution shows **heavier downside tail risk** than upside tail potential.
LEU
Spot: 187.22
Report Time: 2026-04-12 08:49 AM MYT
Regime: TREND
Dealer Gamma: SHORT
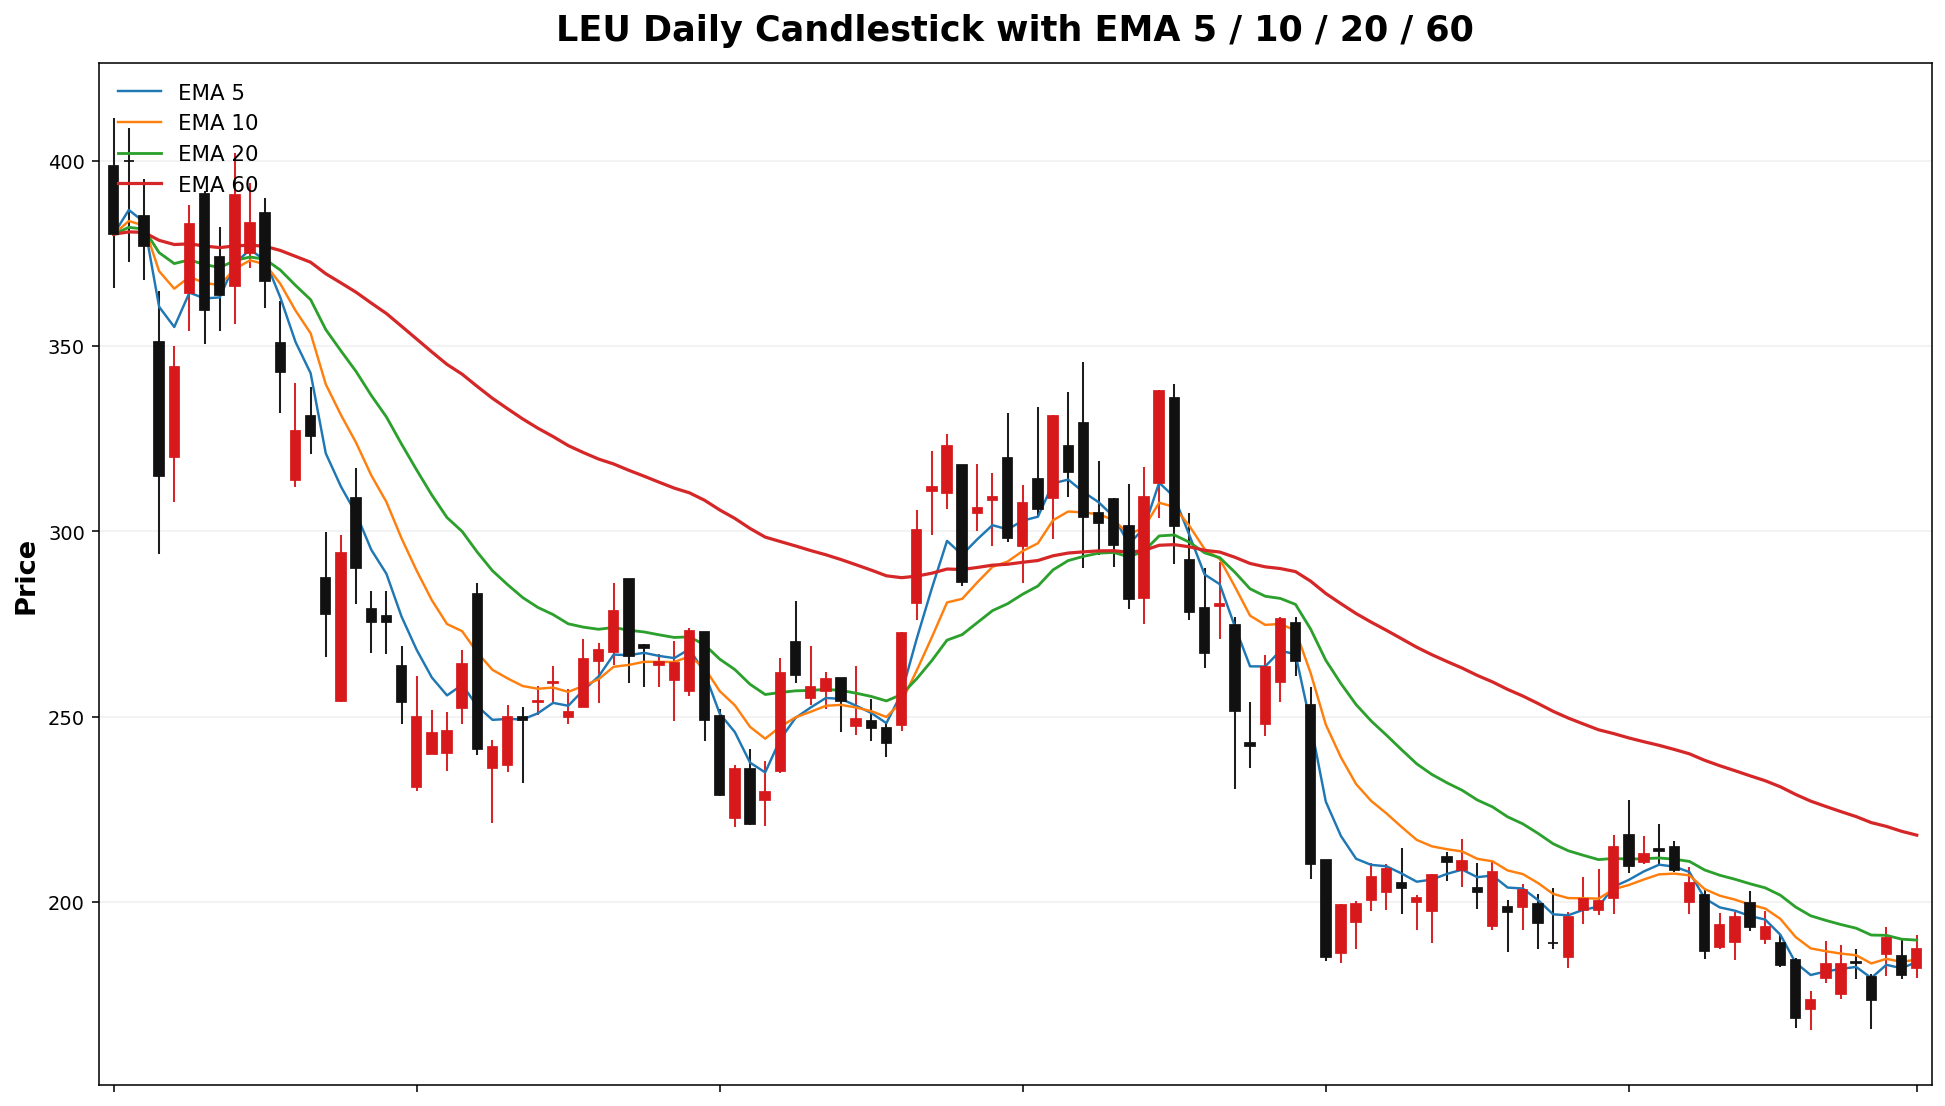
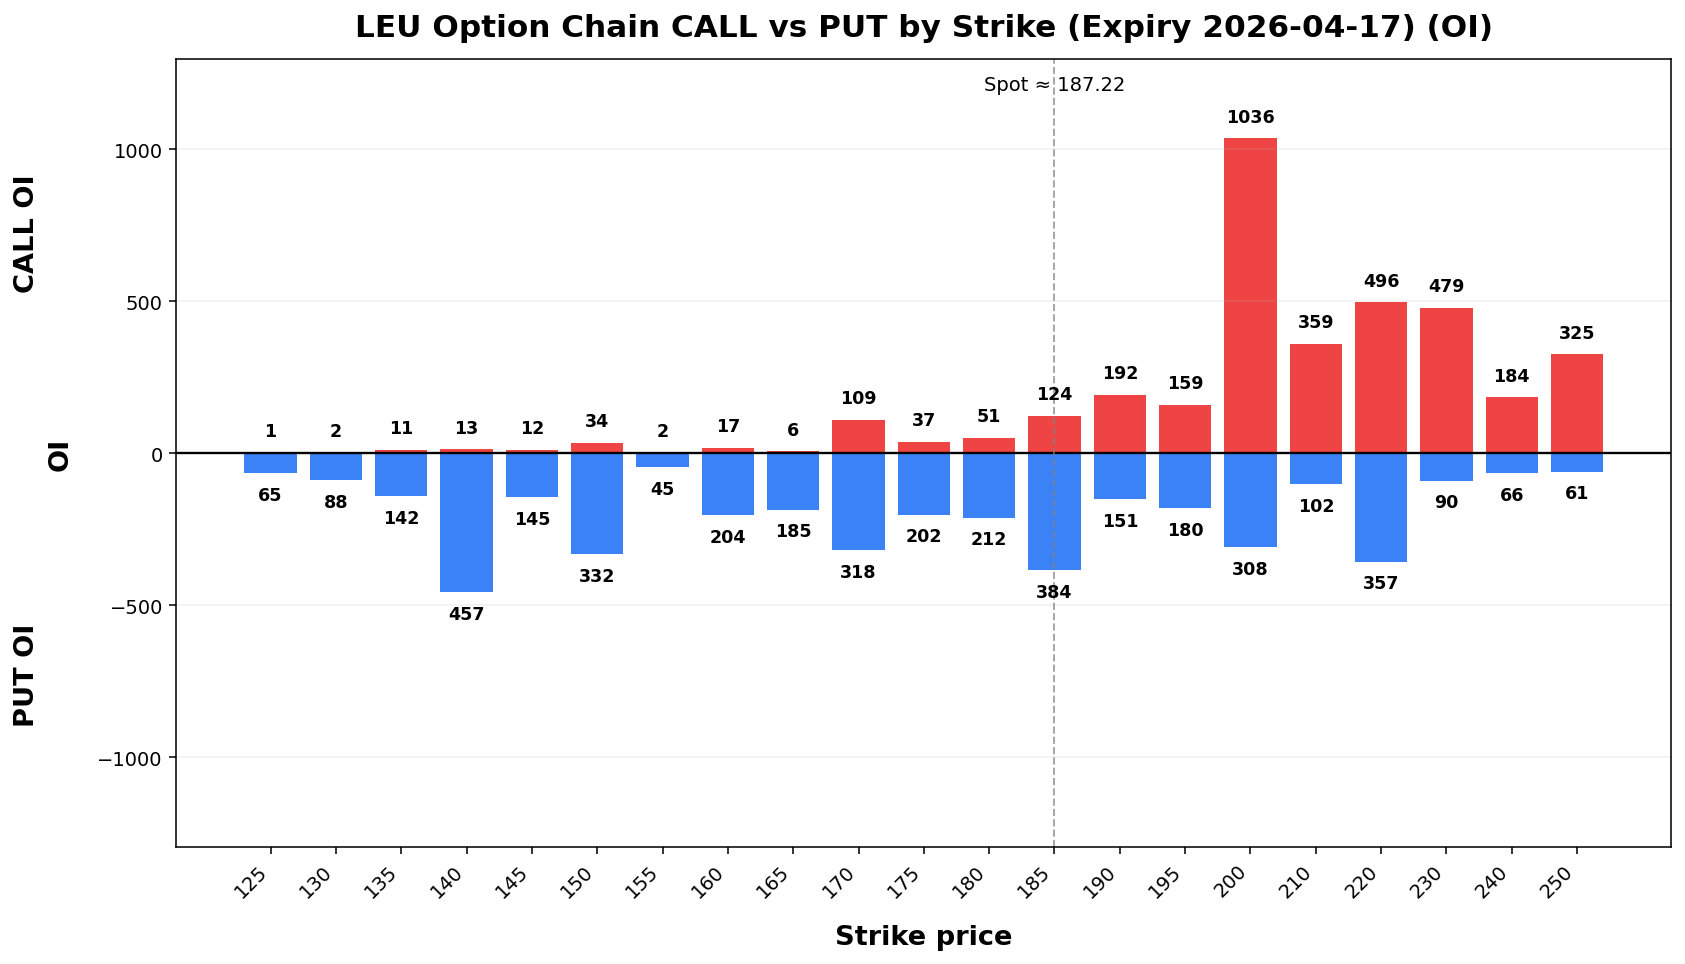
Term Structure
| Expiry |
DTE |
Forward |
ATM IV |
ATM Straddle |
| 2026-04-17 |
6 |
187.24 |
69.31% |
16.35 |
| 2026-05-15 |
34 |
187.76 |
73.57% |
41.90 |
Weekly Range
| Confidence |
Low |
High |
Width |
| 68% |
168.66 |
205.78 |
37.11 |
| 80% |
163.44 |
211.00 |
47.56 |
| 90% |
156.70 |
217.74 |
61.04 |
| 95% |
150.85 |
223.59 |
72.74 |
Structure & Probabilities
| Support |
Resistance |
Gamma Flip |
Max Pain |
P>Res |
P<Sup |
| 185.00 |
200.00 |
186.07 |
200.00 |
23.2% |
51.1% |
Flow & Skew
| Call Vol |
Put Vol |
Vol P/C |
Call OI |
Put OI |
OI P/C |
Skew |
Skew Bias |
| 1,017 |
359 |
0.35 |
6,337 |
4,318 |
0.68 |
2.56 vol pts |
PUT_SKEW |
Tail Risk
| Q10 |
Q50 |
Q90 |
Down Tail |
Up Tail |
Down/Up |
| 161.04 |
186.77 |
212.41 |
26.18 |
25.19 |
1.04 |
Daily Technicals
| EMA20 |
EMA50 |
VWAP20 |
BB Lower |
BB Mid |
BB Upper |
BB Width |
Vol Ratio |
Path |
| 189.66 |
210.30 |
189.81 |
164.21 |
190.92 |
217.63 |
27.98% |
0.65 |
DOWN trend (expanding) |
Day Plan
- 185.00-200.00 range: fade extremes
- > 200.00: chase only if hold + vol
- < 185.00: risk expand; reduce size
- Regime: TREND
- Tech: DOWN trend (expanding)
Swing Plan
- Accumulate: 185.00-185.00
- Trim: 200.00-200.00
- Add: close > 200.00
- Cut: close < 185.00
- Best for: trend regime
Raw Text Summary
📌 LEU @ 187.22 (2026-04-12 08:49 AM MYT)

• Current price is **187.22**. Key support is around **185.00**, and resistance is around **200.00**.
• For the next week, the model’s **68% expected range** is roughly **168.66 to 205.78**.
• A wider **90% range** is about **156.70 to 217.74**.
• Dealer positioning looks **SHORT gamma**, so the market behavior is classified as **TREND**.
• The estimated **gamma flip** is near **186.07**. Crossing and holding beyond this area can change the trading behavior.
• Approximate breakout odds: **above resistance 23.2%**, **below support 51.1%** by the target horizon.
• Options skew is tilted toward **puts**, which suggests traders are paying more for downside protection.
• Near-term implied volatility is lower than the next expiry (**IV1 69.31% vs IV2 73.57%**), which suggests a **contango / calmer front expiry** setup.
• Recent volume is only **0.76x*65x** the 20-day average, so breakouts may be less reliable unless volume improves.
• On the daily chart, the stock currently looks like **DOWN trend (expanding)**.
• The implied distribution is **fairly balanced** between upside and downside tails.
NAIL
Spot: 42.16
Report Time: 2026-04-12 08:49 AM MYT
Regime: TRANSITION
Dealer Gamma: LONG
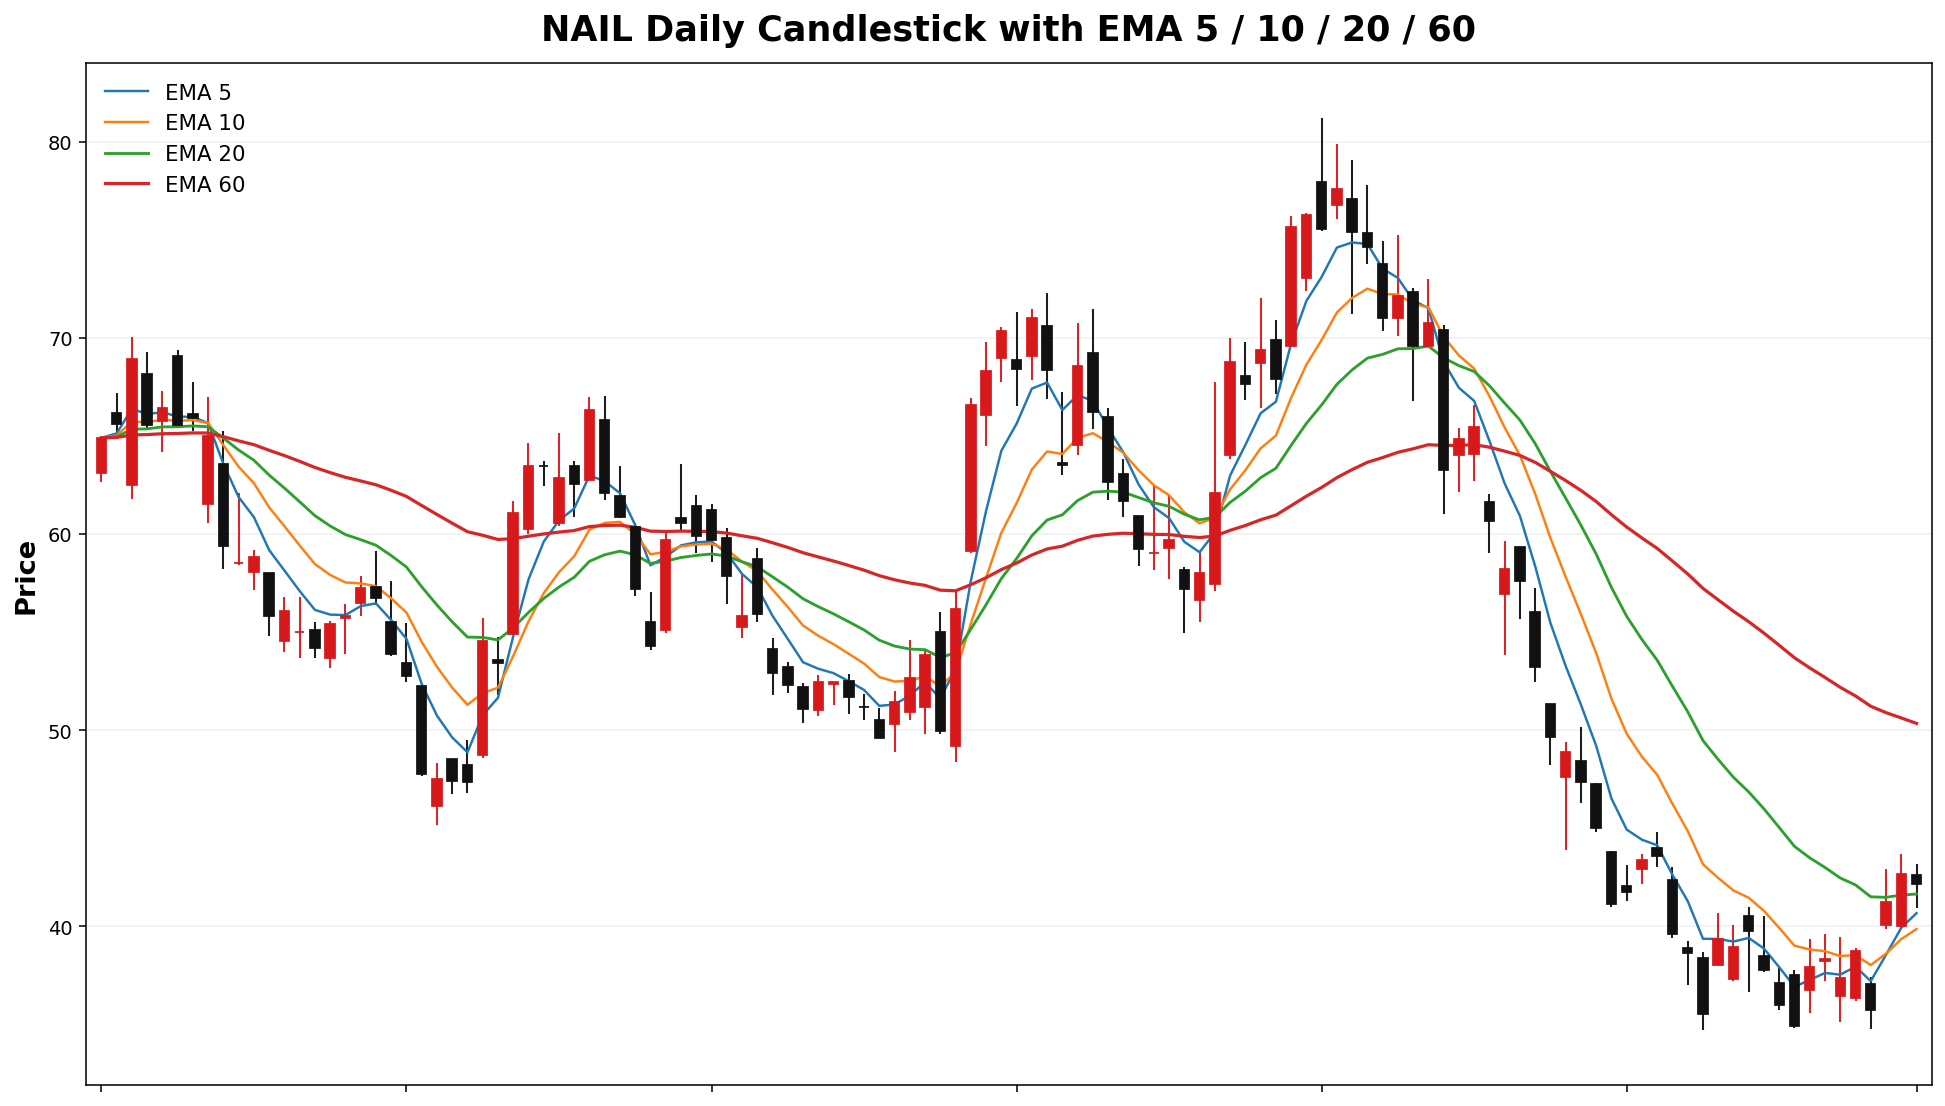
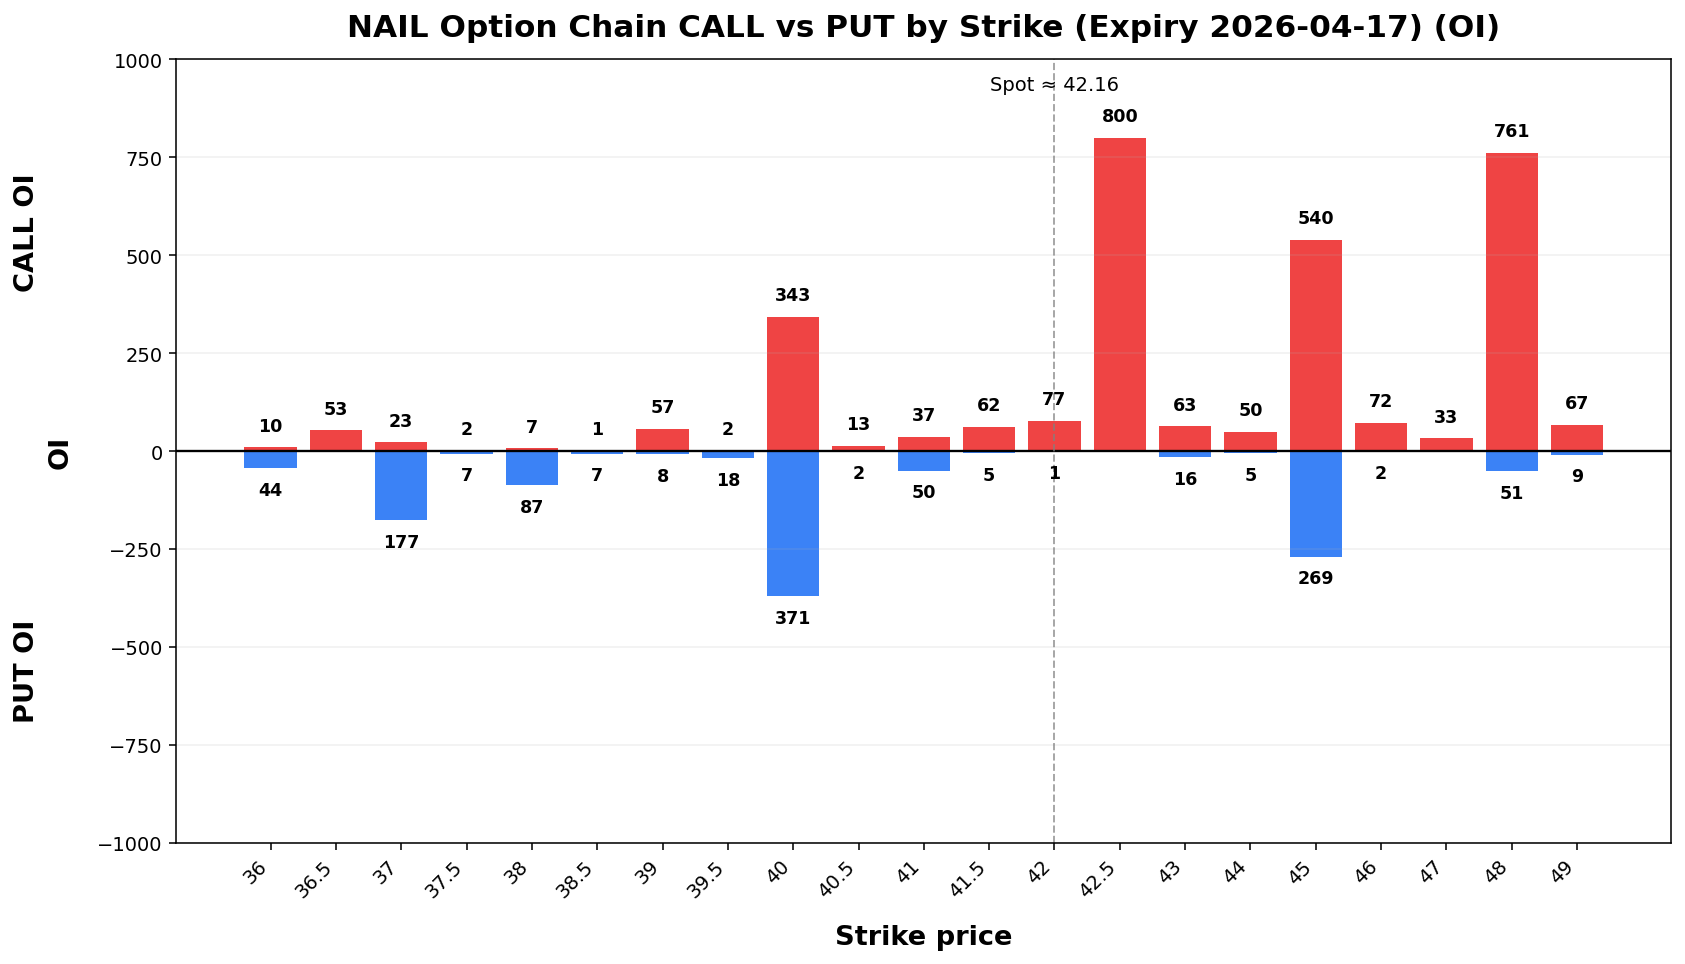
Term Structure
| Expiry |
DTE |
Forward |
ATM IV |
ATM Straddle |
| 2026-04-17 |
6 |
42.18 |
80.48% |
4.28 |
| 2026-04-24 |
13 |
41.96 |
75.71% |
5.97 |
Weekly Range
| Confidence |
Low |
High |
Width |
| 68% |
37.48 |
46.84 |
9.36 |
| 80% |
36.17 |
48.15 |
11.99 |
| 90% |
34.47 |
49.85 |
15.39 |
| 95% |
32.99 |
51.33 |
18.34 |
Structure & Probabilities
| Support |
Resistance |
Gamma Flip |
Max Pain |
P>Res |
P<Sup |
| 40.00 |
42.50 |
36.23 |
41.50 |
36.0% |
29.4% |
Flow & Skew
| Call Vol |
Put Vol |
Vol P/C |
Call OI |
Put OI |
OI P/C |
Skew |
Skew Bias |
| 710 |
561 |
0.79 |
5,509 |
2,306 |
0.42 |
17.09 vol pts |
PUT_SKEW |
Tail Risk
| Q10 |
Q50 |
Q90 |
Down Tail |
Up Tail |
Down/Up |
| 32.85 |
41.05 |
43.69 |
9.31 |
1.53 |
6.08 |
Daily Technicals
| EMA20 |
EMA50 |
VWAP20 |
BB Lower |
BB Mid |
BB Upper |
BB Width |
Vol Ratio |
Path |
| 41.65 |
48.92 |
39.25 |
33.92 |
39.17 |
44.42 |
26.80% |
0.60 |
Sideways / Range |
Day Plan
- 40.00-42.50 range: fade extremes
- > 42.50: chase only if hold + vol
- < 40.00: risk expand; reduce size
- Regime: TRANSITION
- Tech: Sideways / Range
Swing Plan
- Accumulate: 40.00-40.00
- Trim: 42.50-42.50
- Add: close > 42.50
- Cut: close < 40.00
- Best for: transition regime
Raw Text Summary
📌 NAIL @ 42.16 (2026-04-12 08:49 AM MYT)

• Current price is **42.16**. Key support is around **40.00**, and resistance is around **42.50**.
• For the next week, the model’s **68% expected range** is roughly **37.48 to 46.84**.
• A wider **90% range** is about **34.47 to 49.85**.
• Dealer positioning looks **LONG gamma**, so the market behavior is classified as **TRANSITION**.
• The estimated **gamma flip** is near **36.23**. Crossing and holding beyond this area can change the trading behavior.
• Approximate breakout odds: **above resistance 36.0%**, **below support 29.4%** by the target horizon.
• Options skew is tilted toward **puts**, which suggests traders are paying more for downside protection.
• Near-term implied volatility is higher than the next expiry (**IV1 80.48% vs IV2 75.71%**), which suggests **near-term event stress / backwardation**.
• Recent volume is only **0.60x** the 20-day average, so breakouts may be less reliable unless volume improves.
• On the daily chart, the stock currently looks like **Sideways / Range**.
• The implied distribution shows **heavier downside tail risk** than upside tail potential.
RH
Spot: 125.58
Report Time: 2026-04-12 08:49 AM MYT
Regime: TRANSITION
Dealer Gamma: LONG
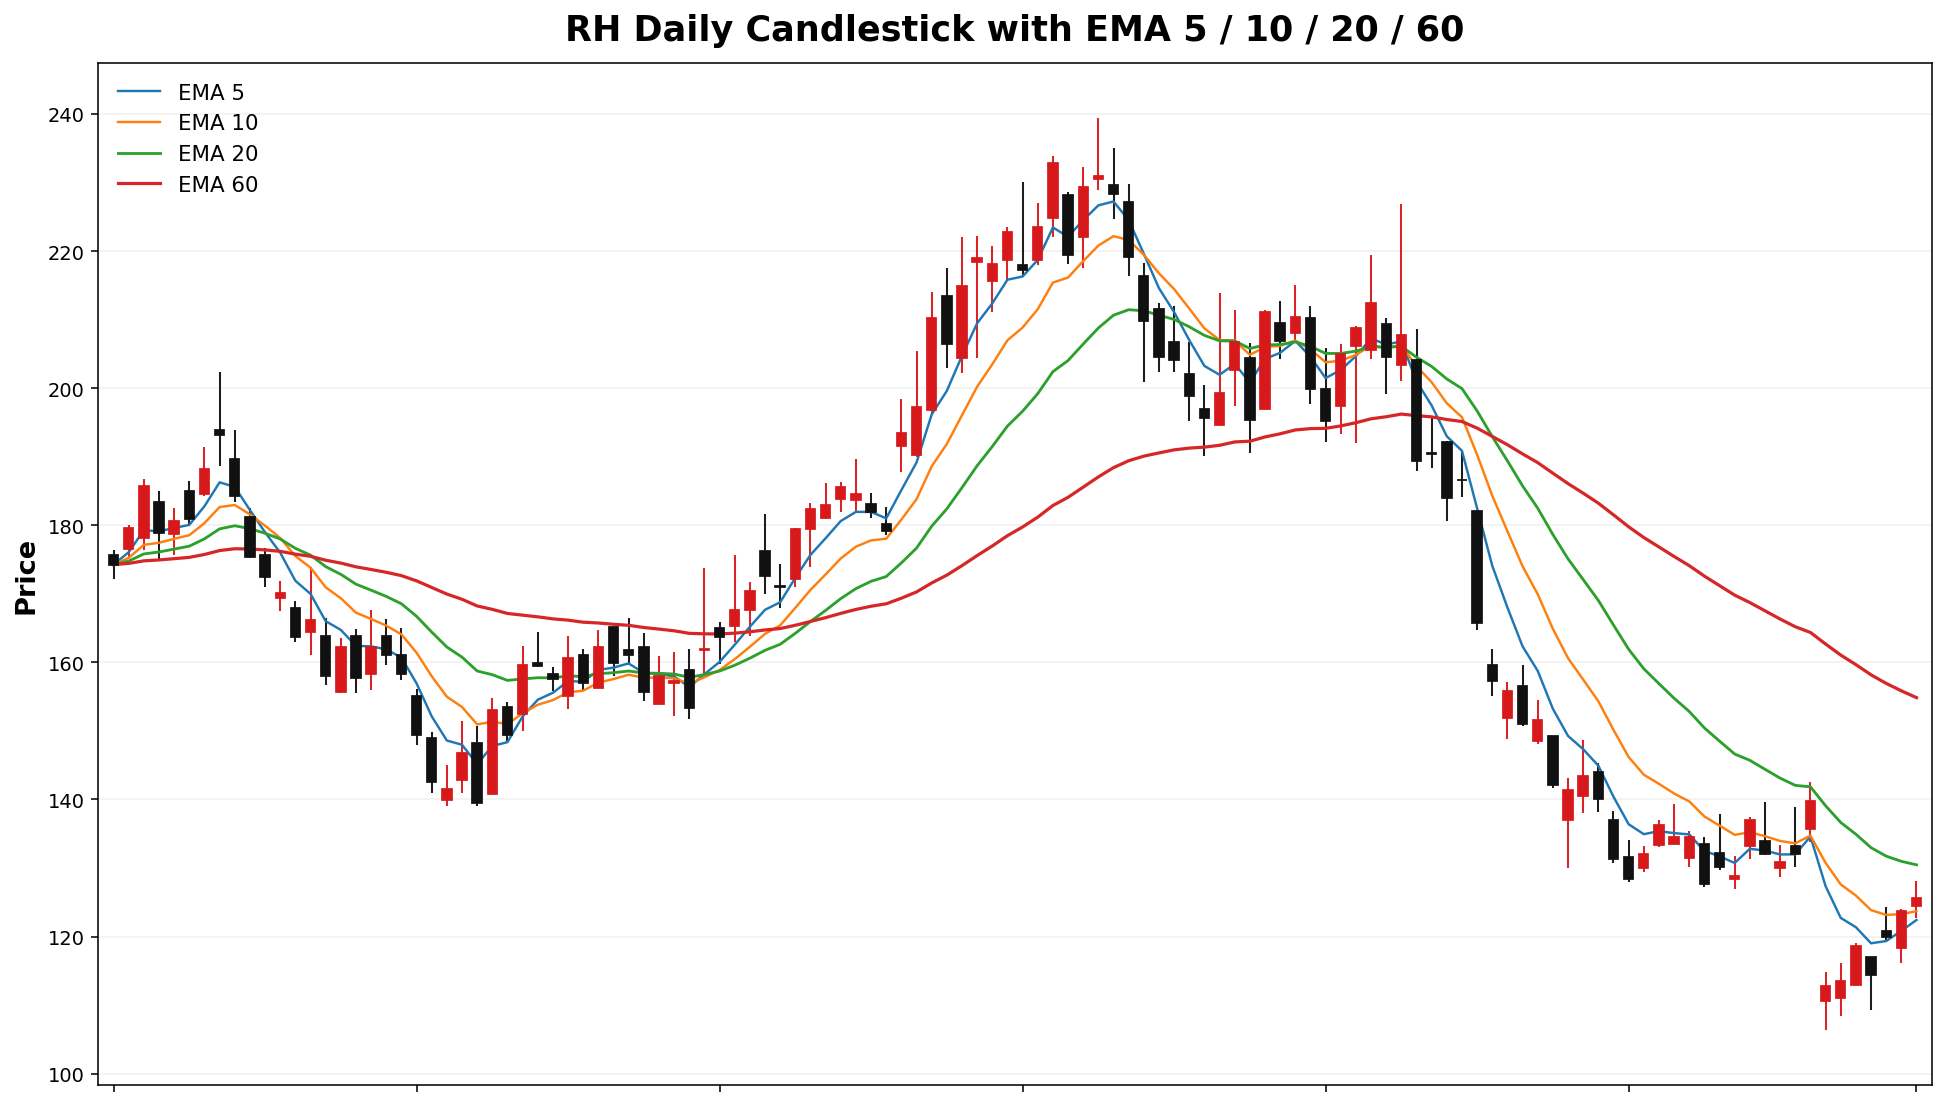
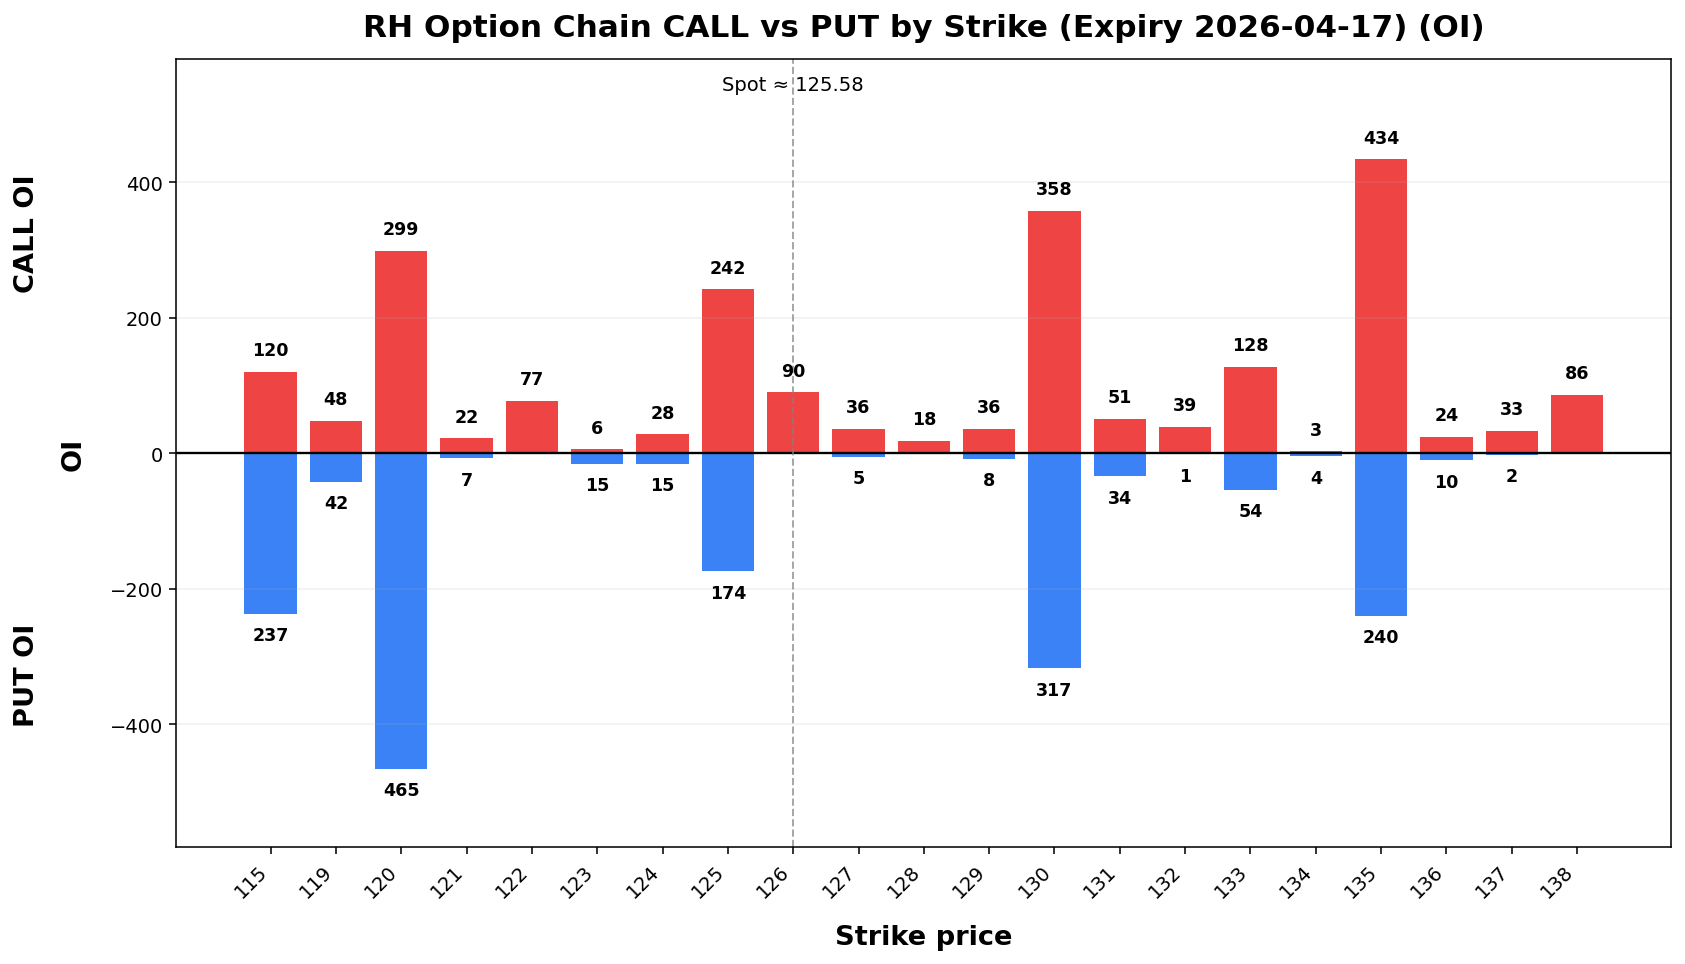
Term Structure
| Expiry |
DTE |
Forward |
ATM IV |
ATM Straddle |
| 2026-04-17 |
6 |
125.34 |
59.09% |
9.35 |
| 2026-04-24 |
13 |
125.63 |
56.36% |
13.25 |
Weekly Range
| Confidence |
Low |
High |
Width |
| 68% |
115.30 |
135.86 |
20.56 |
| 80% |
112.41 |
138.75 |
26.35 |
| 90% |
108.67 |
142.49 |
33.82 |
| 95% |
105.43 |
145.73 |
40.29 |
Structure & Probabilities
| Support |
Resistance |
Gamma Flip |
Max Pain |
P>Res |
P<Sup |
| 120.00 |
135.00 |
120.97 |
130.00 |
14.8% |
28.8% |
Flow & Skew
| Call Vol |
Put Vol |
Vol P/C |
Call OI |
Put OI |
OI P/C |
Skew |
Skew Bias |
| 1,121 |
2,952 |
2.63 |
7,431 |
6,523 |
0.88 |
10.47 vol pts |
PUT_SKEW |
Tail Risk
| Q10 |
Q50 |
Q90 |
Down Tail |
Up Tail |
Down/Up |
| 119.19 |
125.69 |
139.38 |
6.39 |
13.80 |
0.46 |
Daily Technicals
| EMA20 |
EMA50 |
VWAP20 |
BB Lower |
BB Mid |
BB Upper |
BB Width |
Vol Ratio |
Path |
| 130.46 |
151.06 |
123.40 |
111.51 |
127.63 |
143.76 |
25.27% |
1.02 |
DOWN trend (expanding) |
Day Plan
- 120.00-135.00 range: fade extremes
- > 135.00: chase only if hold + vol
- < 120.00: risk expand; reduce size
- Regime: TRANSITION
- Tech: DOWN trend (expanding)
Swing Plan
- Accumulate: 120.00-120.00
- Trim: 135.00-135.00
- Add: close > 135.00
- Cut: close < 120.00
- Best for: transition regime
Raw Text Summary
📌 RH @ 125.58 (2026-04-12 08:49 AM MYT)

• Current price is **125.58**. Key support is around **120.00**, and resistance is around **135.00**.
• For the next week, the model’s **68% expected range** is roughly **115.30 to 135.86**.
• A wider **90% range** is about **108.67 to 142.49**.
• Dealer positioning looks **LONG gamma**, so the market behavior is classified as **TRANSITION**.
• The estimated **gamma flip** is near **120.97**. Crossing and holding beyond this area can change the trading behavior.
• Approximate breakout odds: **above resistance 14.8%**, **below support 28.8%** by the target horizon.
• Options skew is tilted toward **puts**, which suggests traders are paying more for downside protection.
• Near-term implied volatility is higher than the next expiry (**IV1 59.09% vs IV2 56.36%**), which suggests **near-term event stress / backwardation**.
• On the daily chart, the stock currently looks like **DOWN trend (expanding)**.
• The implied distribution shows **more upside tail potential** than downside tail risk.