Analysis Report
Updated: 2026-04-1219 08:49:5616:13 MYT
Source File: combined-summary-20260412-084956.20260419-081612.md
Screening Source: screen-report-20260412-084653.20260419-081320.md
Extracted Symbols: USO,AAOI, NBIS, ASTS,CRWV, BE,RKLB, INTC, CRWV,DOCN, AXTI, UCO,HUT, FLY, HUT,CRDO, FORM,OKLO, DOCN,CRCL, AGQ, HOOD, USO, ASTS, IREN, RBLX, ALAB, SEI,APLD, HYMC,LMND, UAL, PL, RDDT,TEM, CRDO, RKLB, AGQ, APLD, BNO, OKLO, IREN,GLXY, ETHU, DPST, USD, LEU, NAIL, RHKTOS
Topline Summary
| Symbol |
Spot |
Support |
Resistance |
Flip |
Regime |
P>Res |
P<Sup |
68% Range |
90% Range |
USOAAOI |
124.82159.42 |
120.129.00 |
128.160.00 |
123.00144.22 |
PINTRANSITION |
36.6%40.7% |
26.8%8.7% |
112.18135.15 - 137.46183.69 |
104.03119.49 - 145.61199.35 |
| NBIS |
144.97157.14 |
140.155.00 |
150.00 |
108.71 |
TRANSITION |
30.5% |
36.6% |
129.64 - 160.30 |
119.76 - 170.18 |
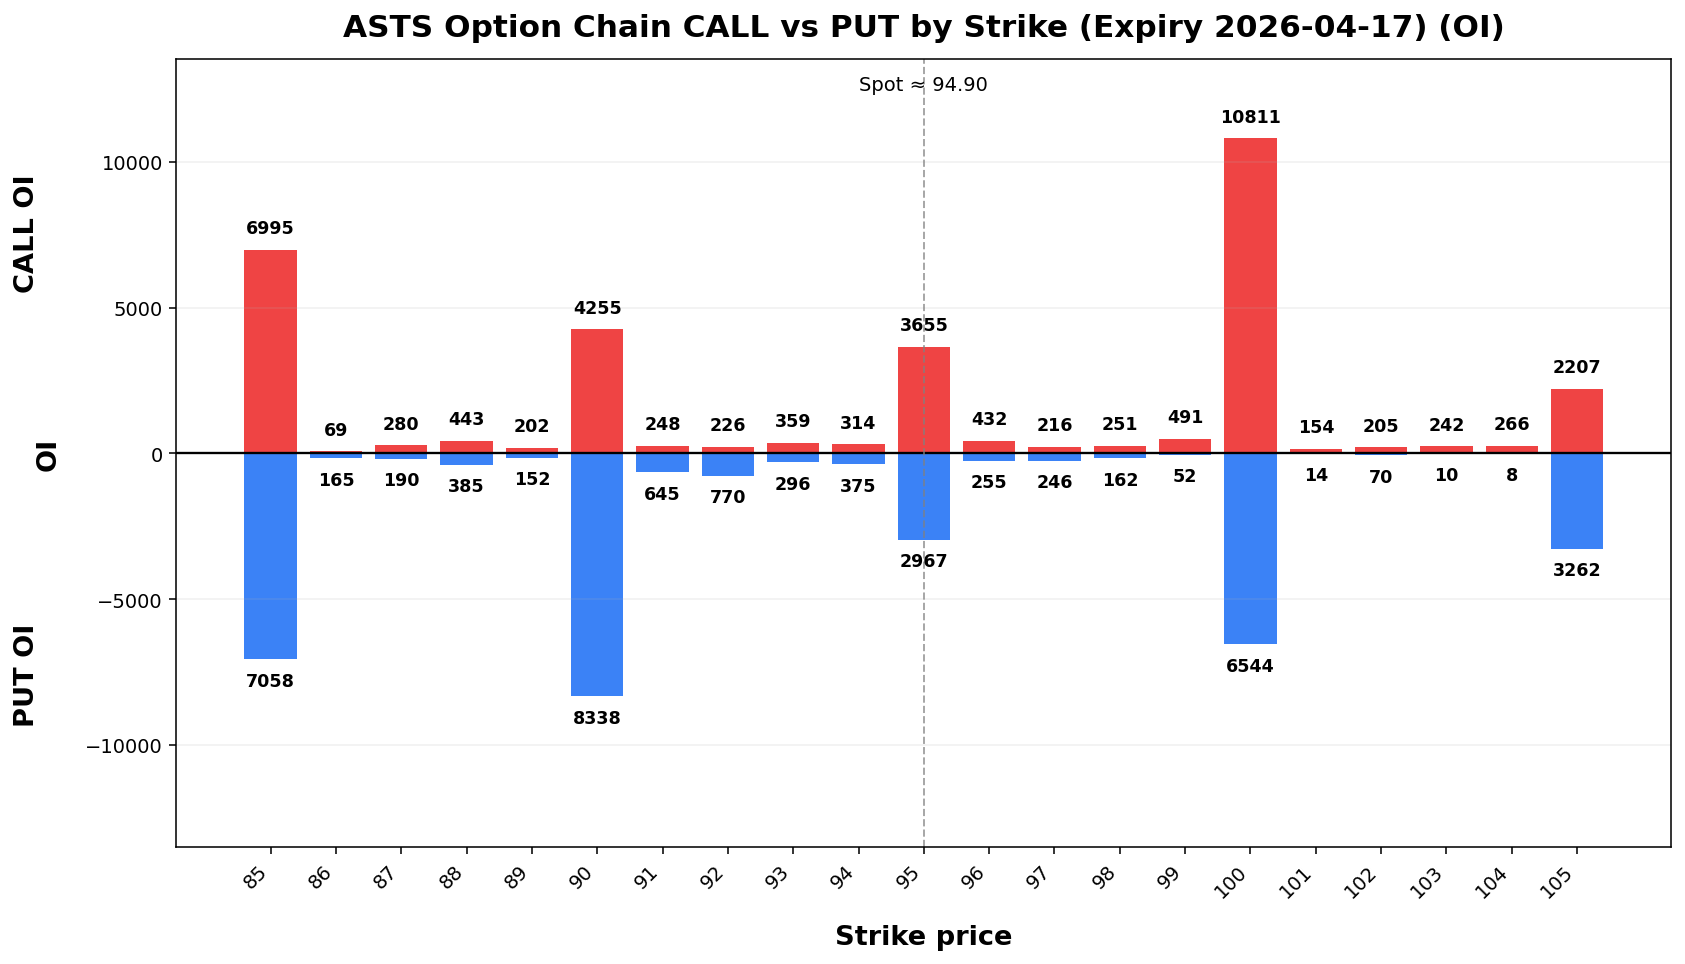
ASTS |
94.90 |
90.00 |
95.00 |
93.25 |
PIN |
40.8% |
33.1% |
83.26 - 106.54 |
75.76 - 114.04 |
BE |
166.70 |
160.00 |
175.147.21 |
TREND |
47.4% |
59.1% |
141.66 - 172.62 |
131.68 - 182.60 |
| CRWV |
116.85 |
115.00 |
133.61120.00 |
116.01 |
PIN |
29.9% |
39.8% |
105.46 - 128.24 |
98.12 - 135.58 |
| RKLB |
84.80 |
80.00 |
85.00 |
69.59 |
TRANSITION |
27.6%48.2% |
36.0%23.7% |
147.0476.21 - 186.3693.39 |
134.3670.67 - 199.0498.93 |
| INTC |
62.38 |
60.00 |
65.00 |
47.54 |
TRANSITION |
25.8% |
27.1% |
56.92 - 67.84 |
53.39 - 71.37 |
CRWV |
102.00 |
100.00 |
105.00 |
85.25 |
TRANSITION |
36.2% |
47.1% |
90.91 - 113.09 |
83.77 - 120.23 |
AXTI |
64.18 |
60.00 |
65.00 |
48.80 |
TRANSITION |
46.8% |
31.3% |
50.31 - 78.05 |
41.37 - 86.99 |
UCO |
40.06 |
40.00 |
45.00 |
34.52 |
PIN |
13.9% |
37.8% |
35.25 - 44.87 |
32.15 - 47.97 |
FLY |
37.54 |
37.00 |
40.00 |
NA |
TREND |
36.1% |
54.8% |
32.87 - 42.21 |
29.85 - 45.23 |
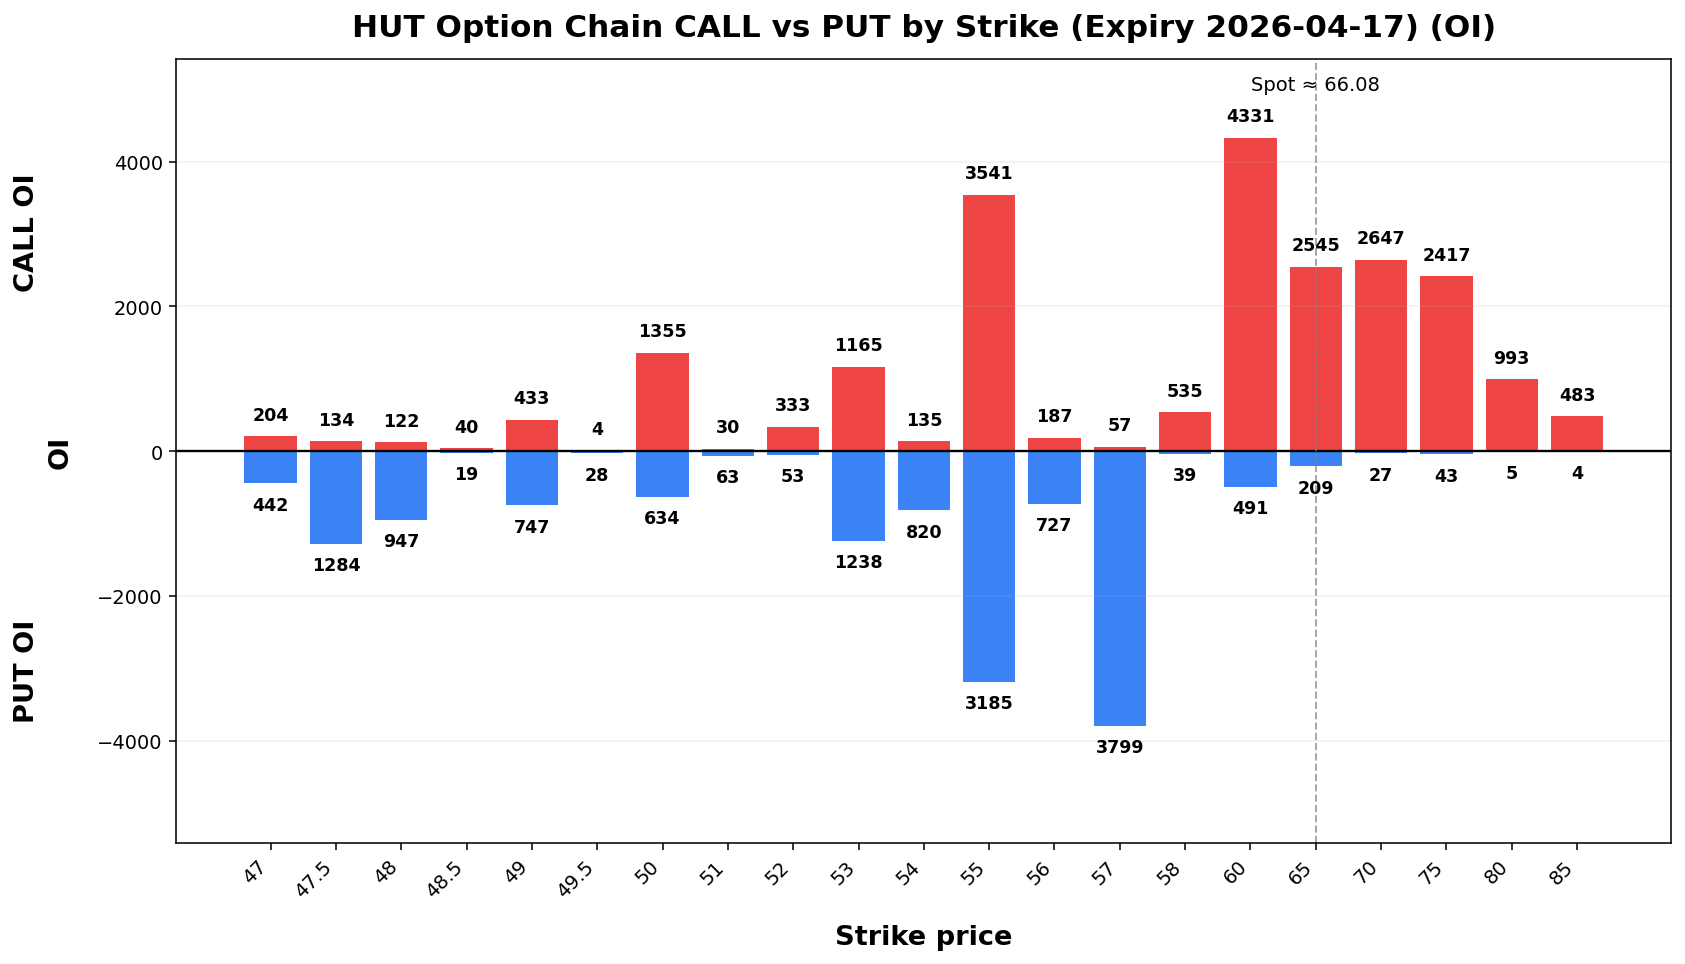
HUT |
66.0868.50 |
65.00 |
70.00 |
57.7859.58 |
TRANSITION |
25.3%41.8% |
43.7% |
58.25 - 73.92 |
53.20 - 78.97 |
FORM |
123.80 |
120.00 |
135.17 |
98.45 |
TRANSITION |
11.9% |
33.27.1% |
112.4360.53 - 135.1776.47 |
105.1155.40 - 142.4981.60 |
| DOCN |
75.5985.63 |
75.80.00 |
78.86.00 |
71.9298.09 |
TRENDTRANSITION |
49.0%44.2% |
20.9% |
76.29 - 94.97 |
70.5% |
66.6627 - 84.52 |
60.91 - 90.27100.99 |
ALABHUT |
149.0574.90 |
145.69.00 |
150.0083.26 |
124.4992.47 |
TRANSITION |
47.4%13.0% |
39.2%23.6% |
134.1966.54 - 163.9183.26 |
124.6161.14 - 173.4988.66 |
SEIFLY |
62.39 |
60.00 |
70.00 |
68.22 |
TREND |
14.4% |
42.2% |
54.97 - 69.81 |
50.19 - 74.59 |
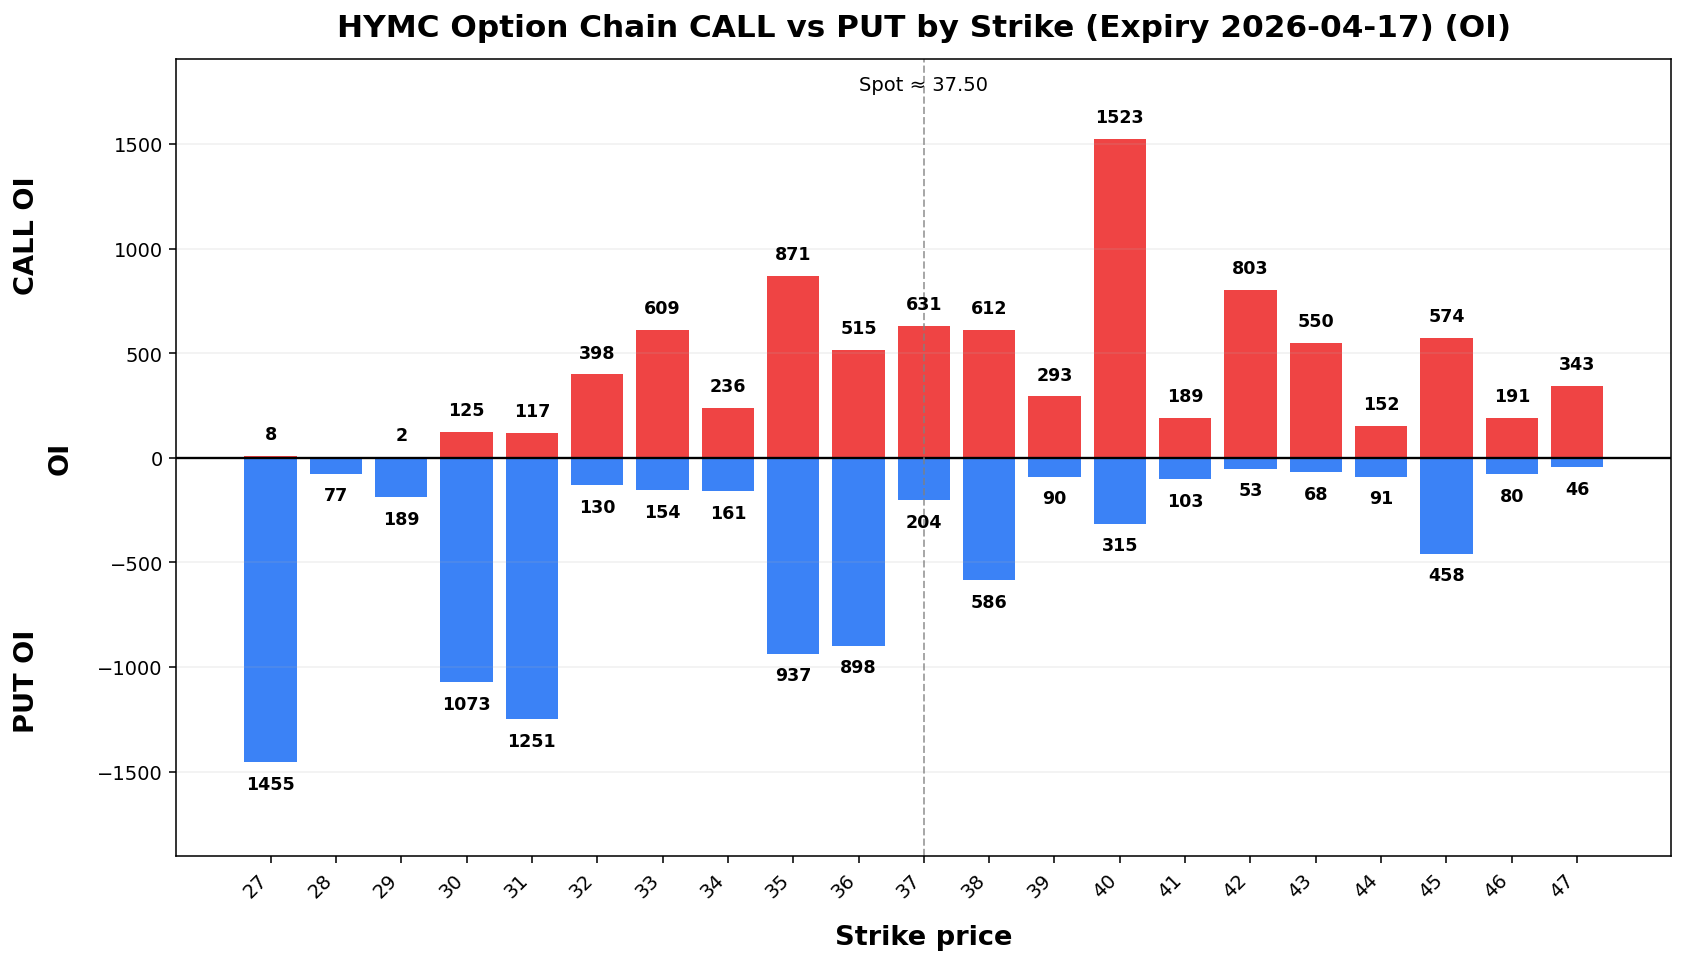
HYMC |
37.50 |
36.0043.72 |
40.00 |
34.1050.00 |
NA |
TRANSITION |
22.4% |
34.14.0% |
32.91 - 42.09 |
29.94 - 45.06 |
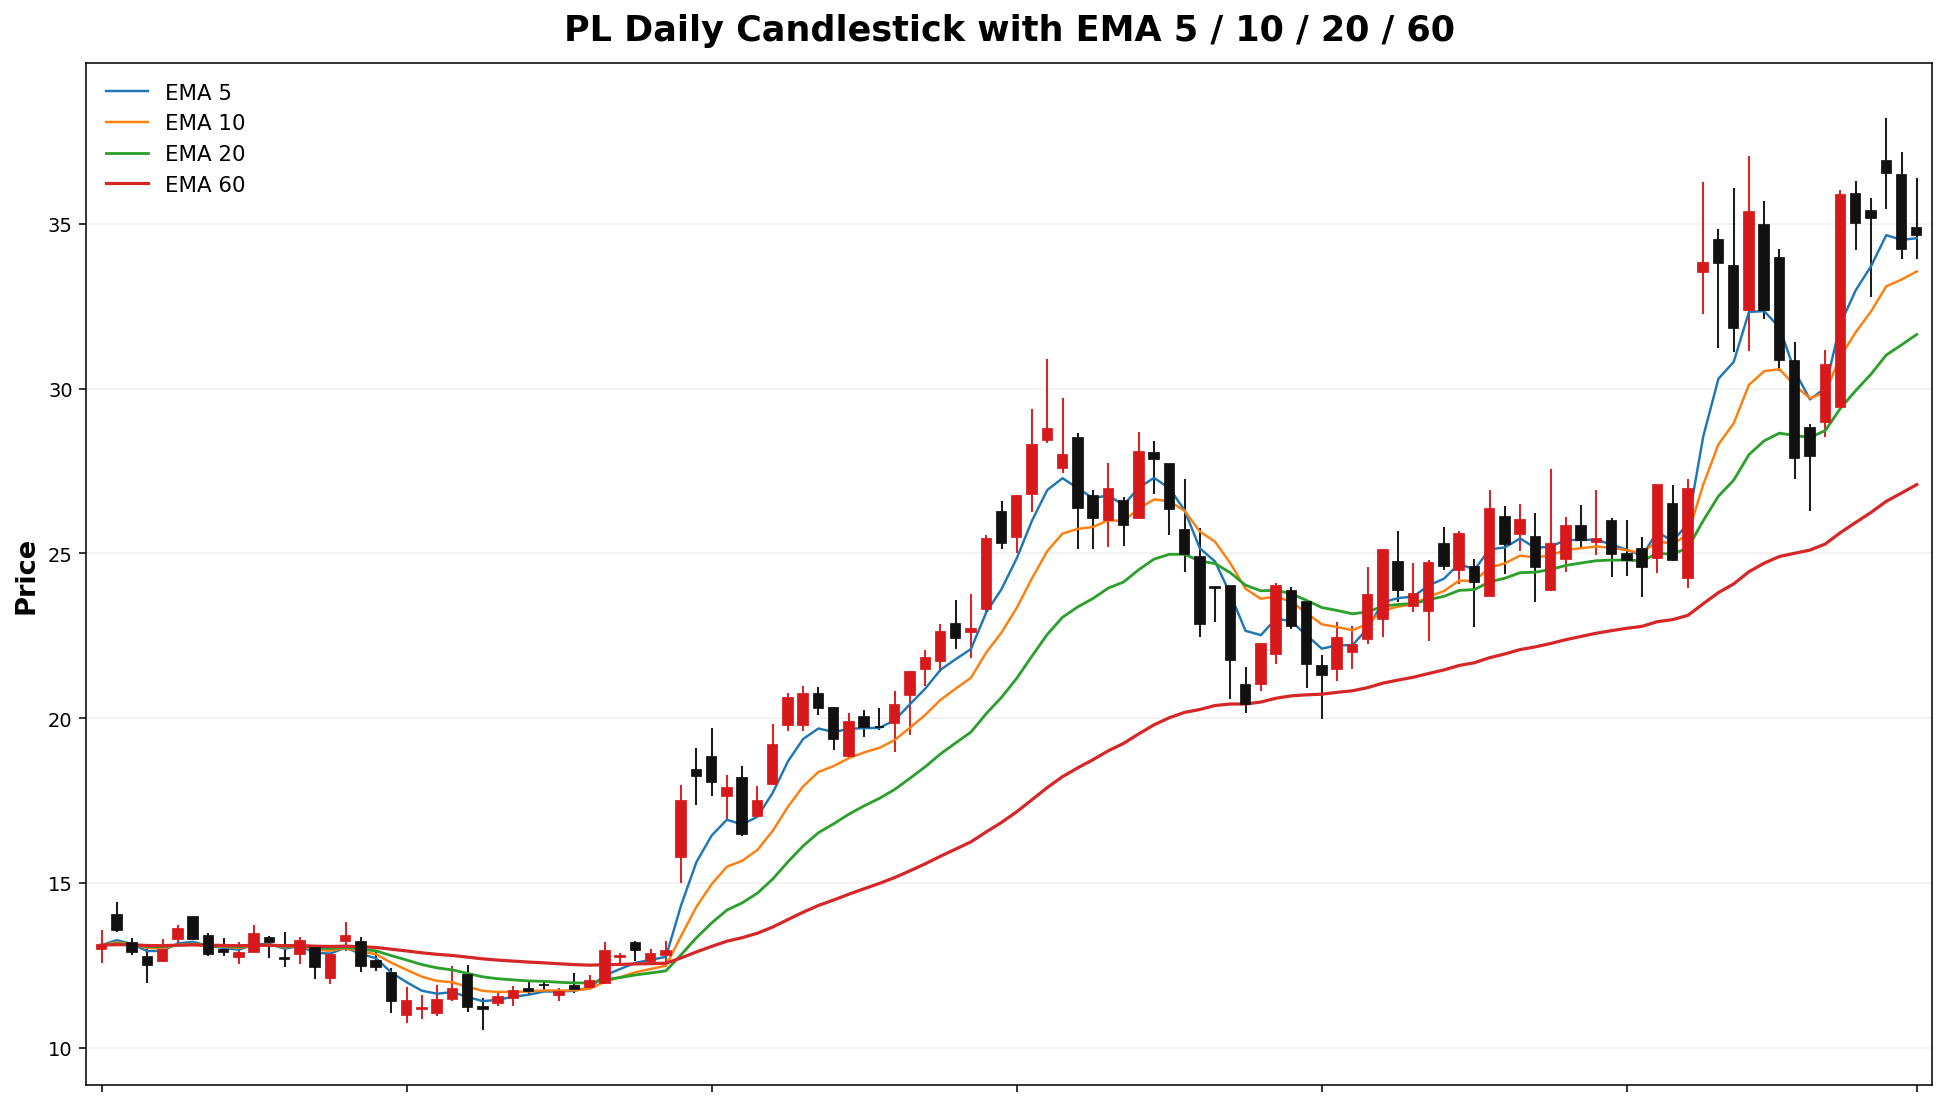
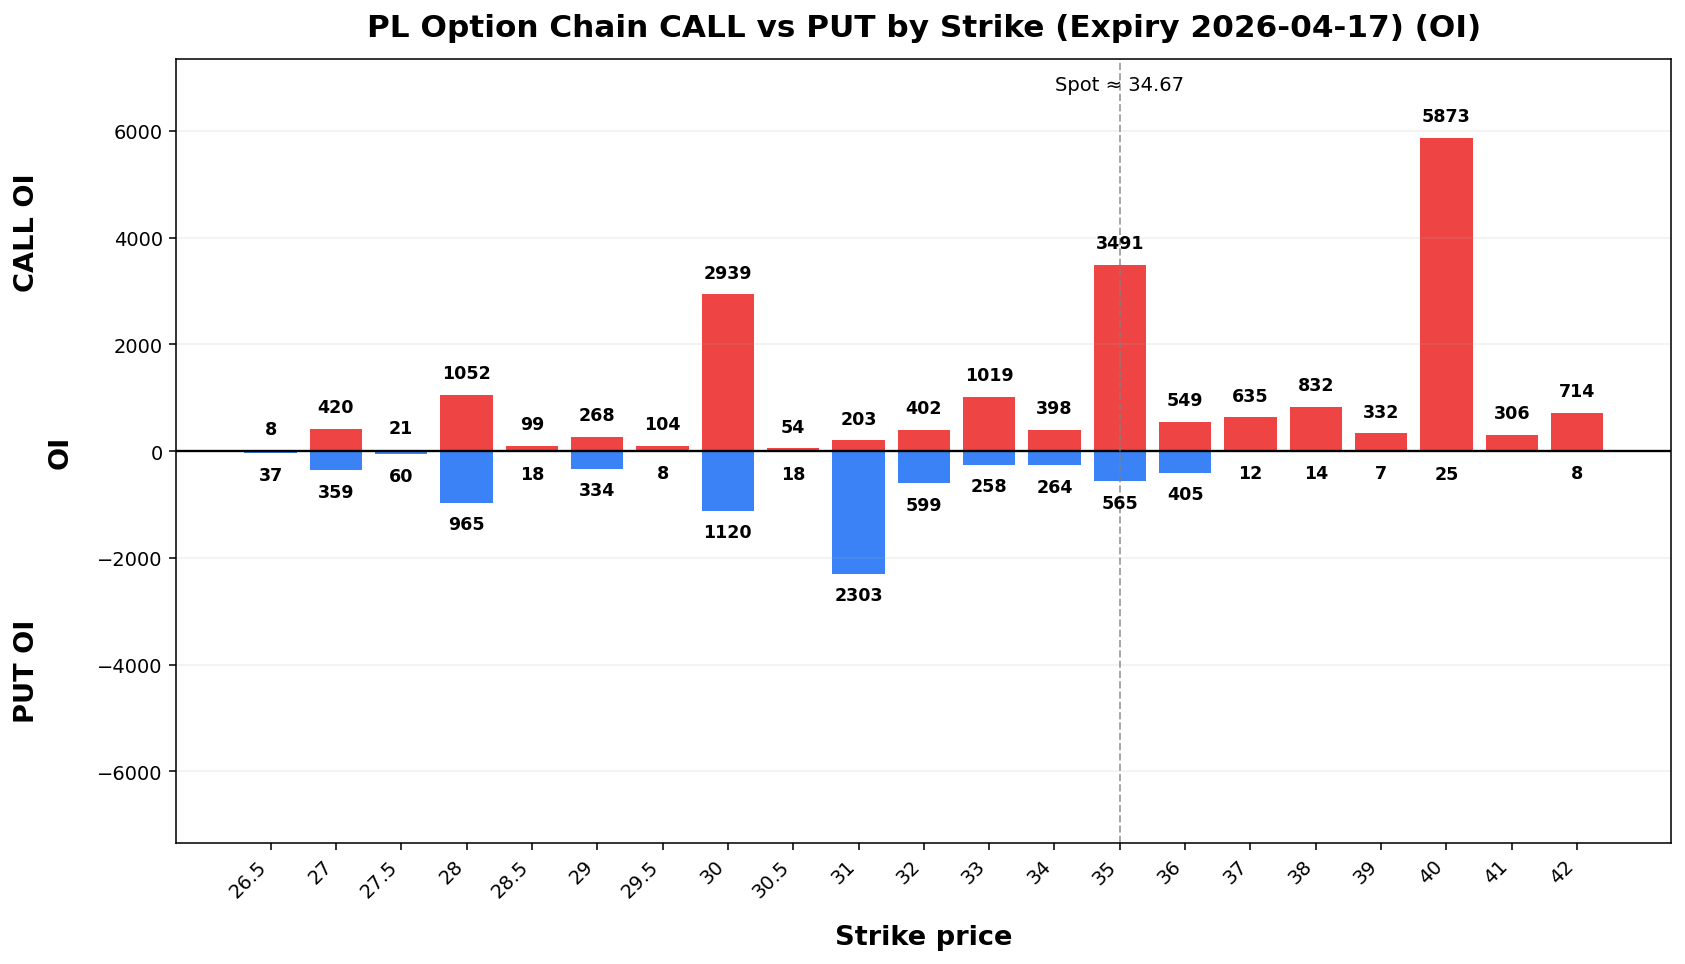
PL |
34.67 |
31.00 |
35.00 |
23.53 |
TRANSITION |
42.8% |
14.4% |
30.52 - 38.82 |
27.84 - 41.50 |
RDDT |
139.73 |
125.00 |
145.00 |
132.66 |
TRANSITION |
23.24.6% |
8.9%37.49 - 49.95 |
128.1433.48 - 151.32 |
120.67 - 158.7953.96 |
| CRDO |
119.59160.69 |
110.160.00 |
120.165.00 |
111.58132.78 |
TRANSITION |
40.0%30.7% |
21.9%43.6% |
106.99141.94 - 132.19179.44 |
98.86129.85 - 140.32191.53 |
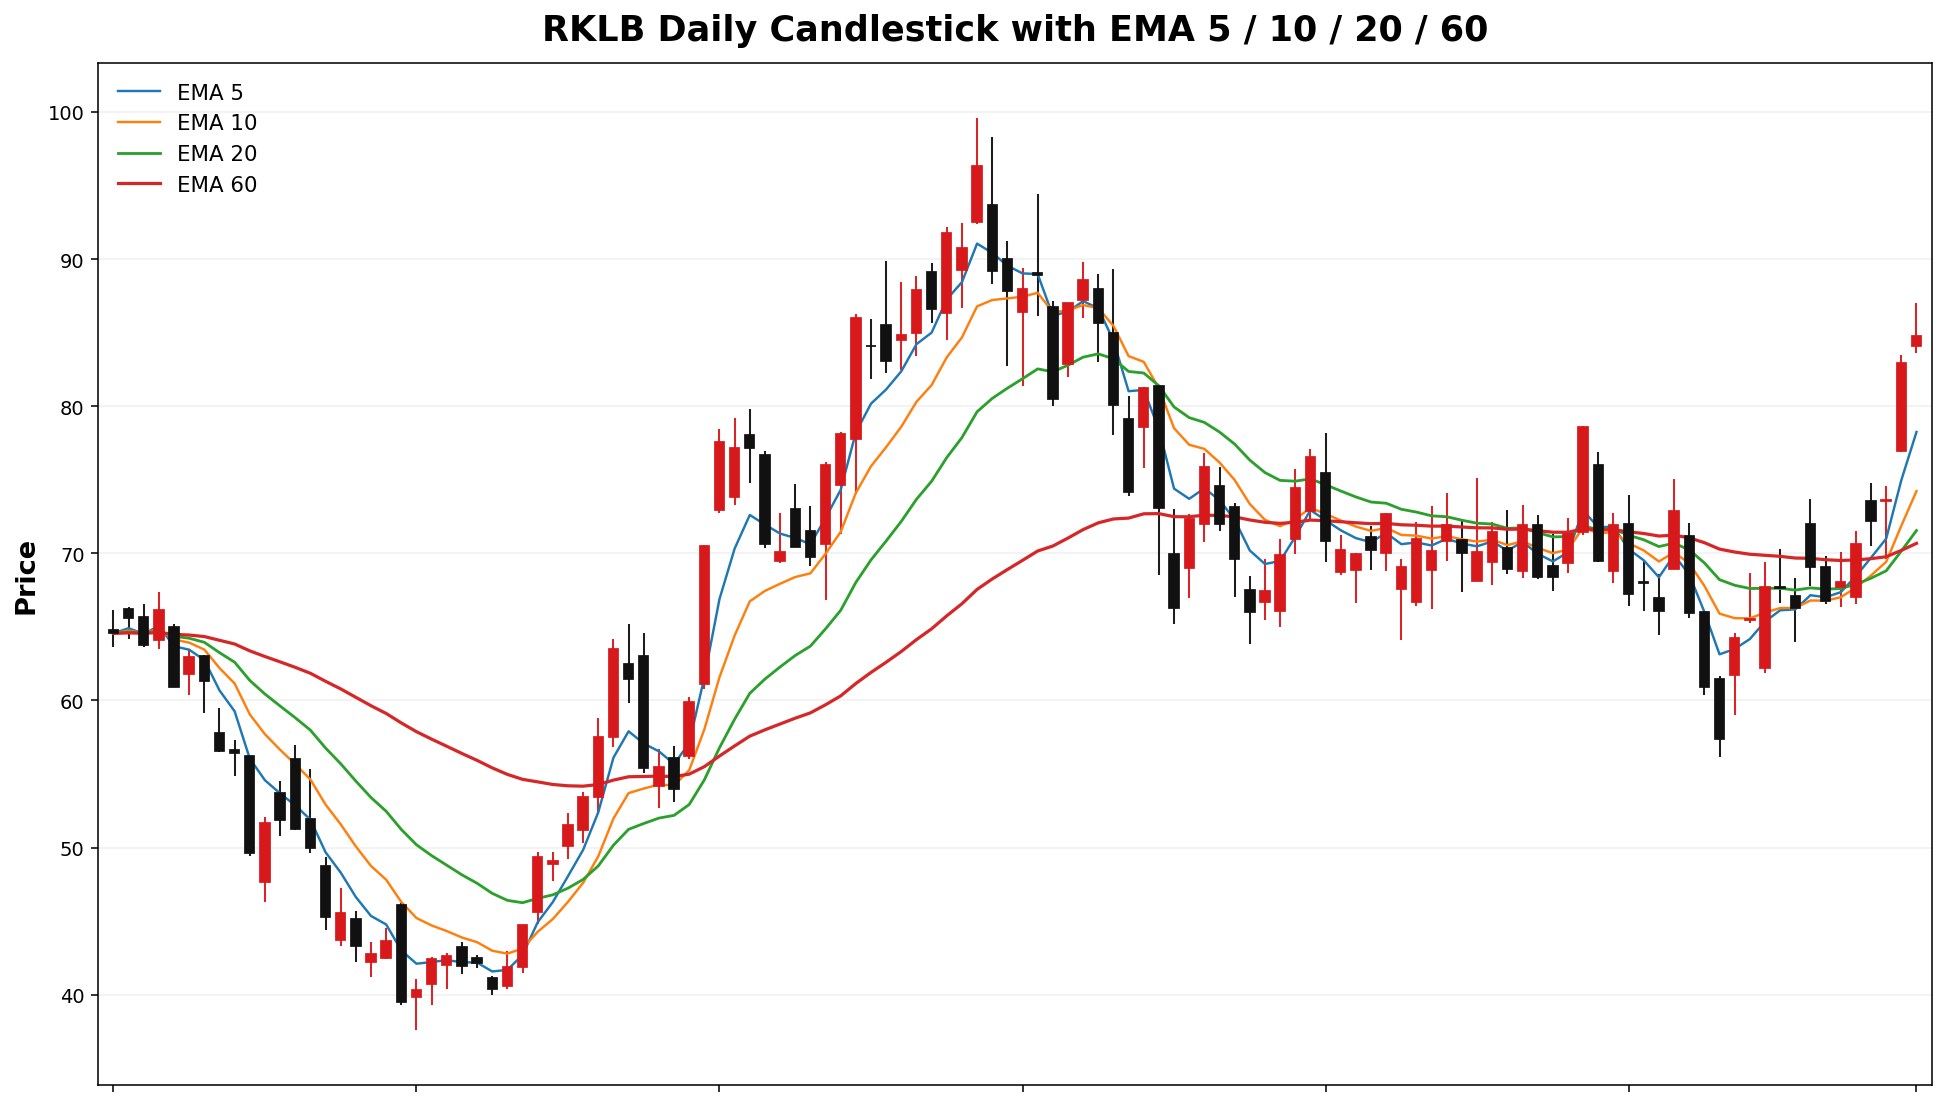
RKLBOKLO |
68.0566.81 |
65.00 |
70.00 |
64.7151.81 |
TRANSITION |
29.7%38.3% |
30.2%37.9% |
58.64 - 74.98 |
53.37 - 80.25 |
| CRCL |
105.91 |
100.00 |
107.00 |
88.03 |
TREND |
61.1% |
32.5% |
95.10 - 75.00116.72 |
56.6288.13 - 79.48123.69 |
| AGQ |
122.21138.07 |
100.130.00 |
125.140.00 |
106.115.13 |
TRANSITION |
44.8% |
26.5% |
120.50 - 155.64 |
109.17 - 166.97 |
| HOOD |
90.75 |
90.00 |
91.00 |
75.15 |
TRANSITION |
48.9% |
38.6% |
83.43 - 98.07 |
78.71 - 102.79 |
| USO |
116.04 |
115.00 |
120.00 |
137.81 |
TREND |
48.7% |
51.6% |
104.42 - 127.66 |
96.92 - 135.16 |
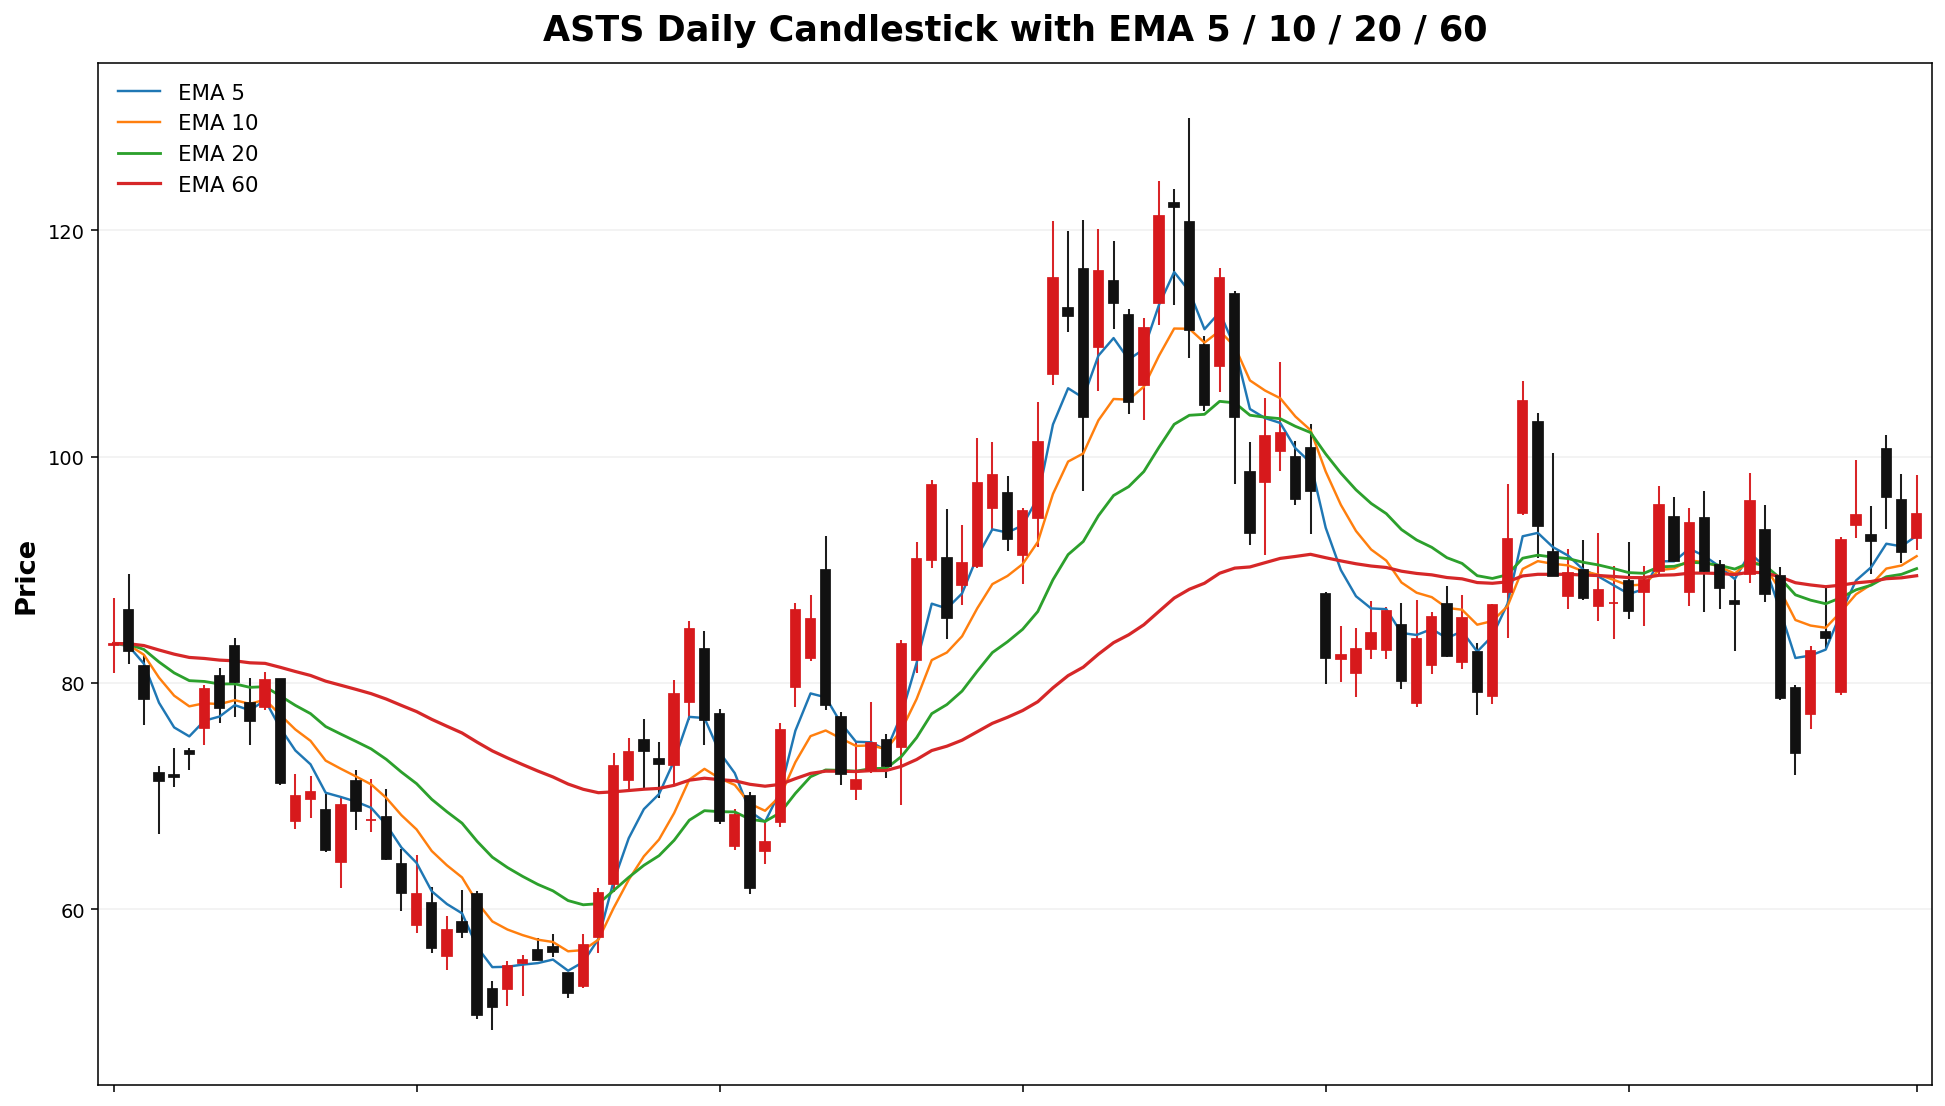
| ASTS |
85.53 |
85.00 |
90.00 |
76.17 |
TREND |
45.1% |
53.4% |
74.70 - 96.36 |
67.72 - 103.34 |
| IREN |
48.12 |
47.00 |
50.00 |
38.56 |
TRANSITION |
32.8%3% |
7.4%37.2% |
106.42.79 - 53.45 |
39.35 - 138.0756.89 |
| RBLX |
96.1360.34 |
57.00 |
61.00 |
56.27 |
TRANSITION |
37.1% |
23.2% |
54.49 - 148.2966.19 |
50.72 - 69.96 |
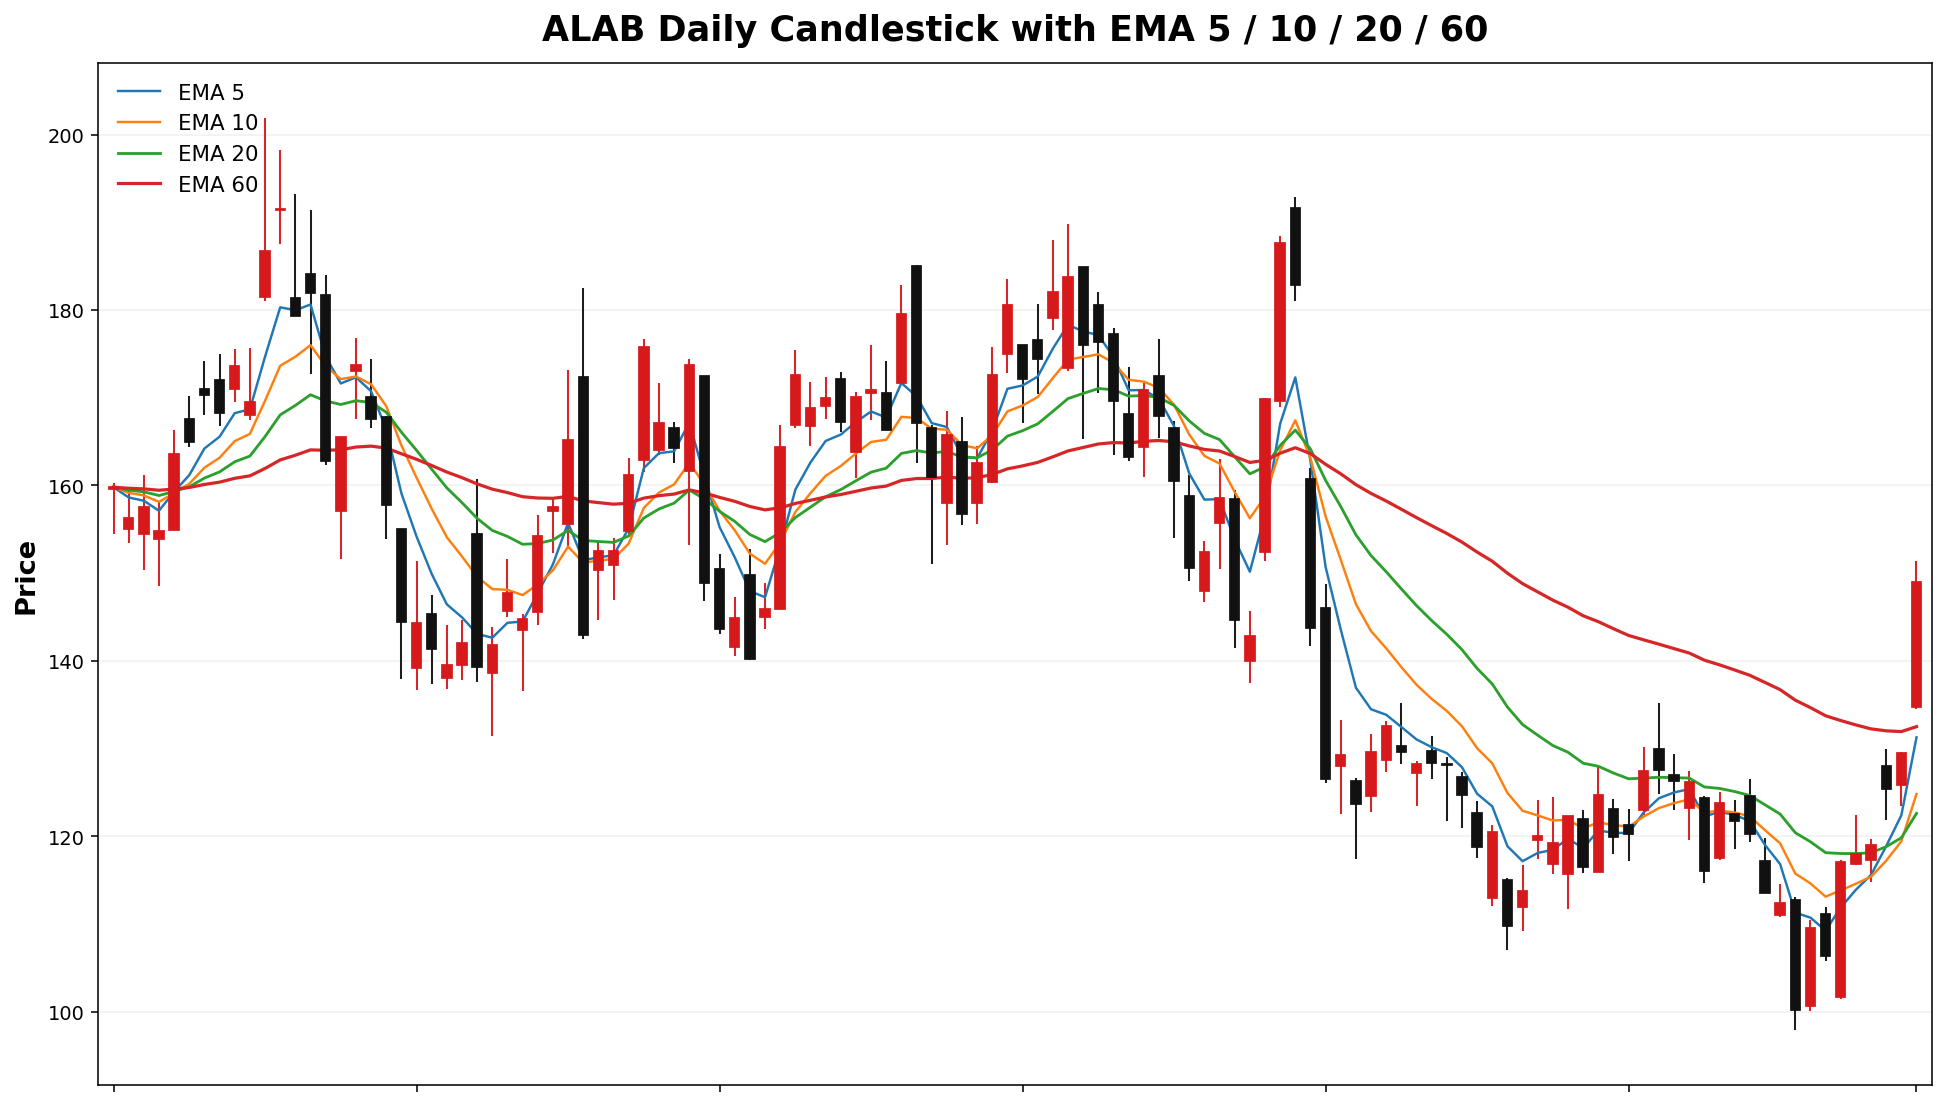
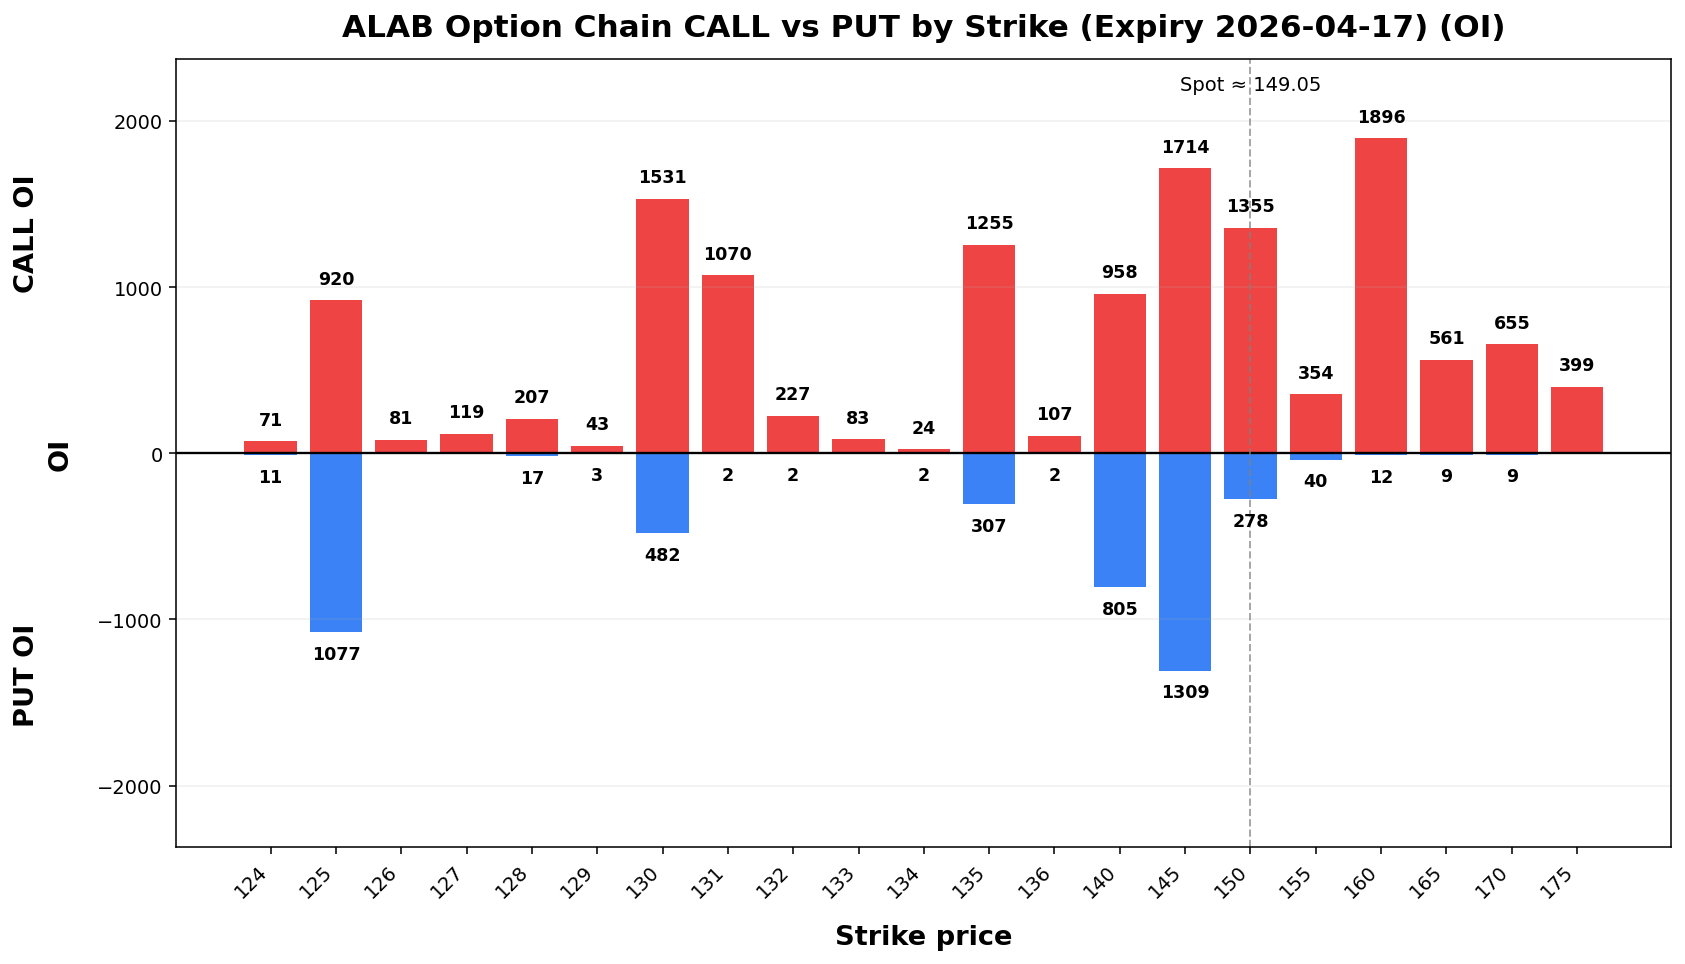
| ALAB |
174.05 |
170.00 |
175.00 |
119.14 |
TRANSITION |
40.6% |
34.3% |
157.40 - 190.70 |
146.66 - 201.44 |
| APLD |
26.2631.53 |
25.31.00 |
28.32.00 |
24.3474 |
TRANSITION |
23.8%44.2% |
36.5% |
27.74 - 35.32 |
25.30 - 37.76 |
| LMND |
70.94 |
70.00 |
71.00 |
57.84 |
TRANSITION |
44.6% |
33.8% |
23.1263.50 - 29.4078.38 |
21.1058.71 - 31.4283.17 |
BNOUAL |
47.25101.80 |
100.00 |
110.00 |
84.17 |
TRANSITION |
15.8% |
45.9% |
93.15 - 110.45 |
87.58 - 116.02 |
| PL |
38.48 |
38.00 |
40.00 |
50.0038.80 |
39.00PIN |
TRANSITION31.0% |
26.2%38.1% |
5.2%33.78 - 43.18 |
42.3730.74 - 52.13 |
39.46.22 - 55.28 |
OKLOTEM |
50.2555.87 |
50.55.00 |
60.00 |
52.3551.29 |
TRENDTRANSITION |
4.2%16.5% |
58.35.1% |
44.8850.91 - 55.6260.83 |
41.4247.71 - 59.0864.03 |
IRENGLXY |
39.3225.84 |
37.24.50 |
39.5027.00 |
38.0426.90 |
TRANSITION |
39.7% |
33.5% |
34.87 - 43.7728.9% |
32.013% |
22.96 - 46.6328.72 |
21.10 - 30.58 |
| ETHU |
25.6629.71 |
25.28.50 |
31.00 |
27.00 |
21.4220.57 |
TRANSITION |
29.38.9% |
36.2%39.6% |
25.13 - 34.29 |
22.1417 - 29.18 |
19.87 - 31.4537.25 |
| DPST |
114.01120.63 |
100.120.00 |
115.125.00 |
99.23103.09 |
TRANSITION |
34.6%31.9% |
7.52.5% |
103.88109.56 - 124.14131.70 |
97.35102.42 - 130.67 |
USD |
61.89 |
61.00 |
62.00 |
48.57 |
TRANSITION |
40.5% |
43.4% |
55.79 - 67.99 |
51.85 - 71.93 |
LEU |
187.22 |
185.00 |
200.00 |
186.07 |
TREND |
23.2% |
51.1% |
168.66 - 205.78 |
156.70 - 217.74138.84 |
| NAIL |
42.1646.80 |
40.45.00 |
42.5050.00 |
36.2344.89 |
TRANSITION |
36.0%22.5% |
29.4%38.3% |
37.4842.17 - 46.8451.43 |
34.4739.19 - 49.8554.41 |
RHKTOS |
125.5870.99 |
120.70.00 |
135.77.00 |
120.9772.92 |
TRANSITIONTREND |
14.8%22.4% |
28.8%59.0% |
115.3064.80 - 135.8677.18 |
108.6760.81 - 142.4981.17 |
USOAAOI
Spot: 124.82159.42
Report Time: 2026-04-1219 08:4713 AM MYT
Regime: PINTRANSITION
Dealer Gamma: LONG
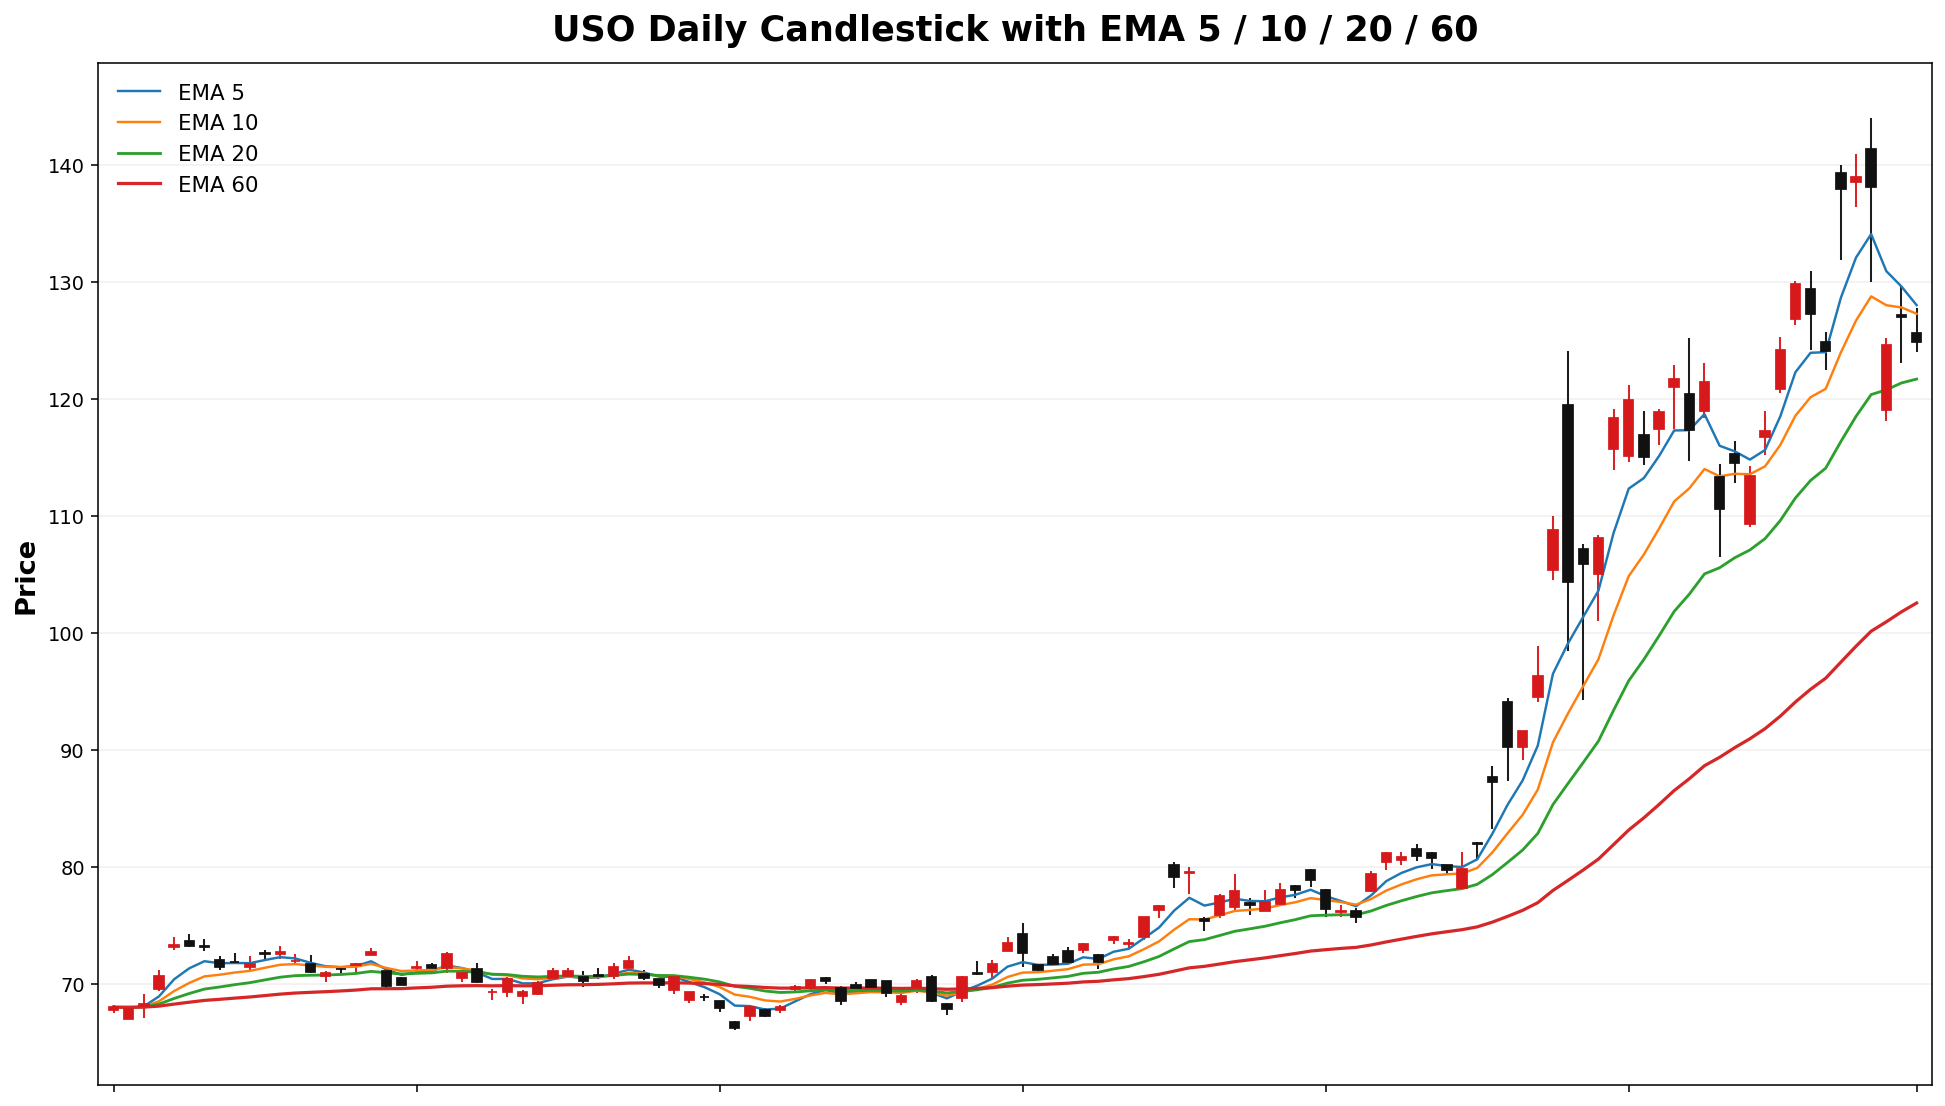
Term Structure
| Expiry |
DTE |
Forward |
ATM IV |
ATM Straddle |
2026-04-1524 |
46 |
124.81159.37 |
72.25%108.54% |
9.2021.85 |
2026-04-1705-01 |
613 |
124.81159.28 |
72.00%107.29% |
11.3232.05 |
Weekly Range
| Confidence |
Low |
High |
Width |
| 68% |
112.18135.15 |
137.46183.69 |
25.2848.55 |
| 80% |
108.62128.31 |
141.02190.53 |
32.4062.21 |
| 90% |
104.03119.49 |
145.61199.35 |
41.5979.85 |
| 95% |
100.04111.85 |
149.60206.99 |
49.5595.15 |
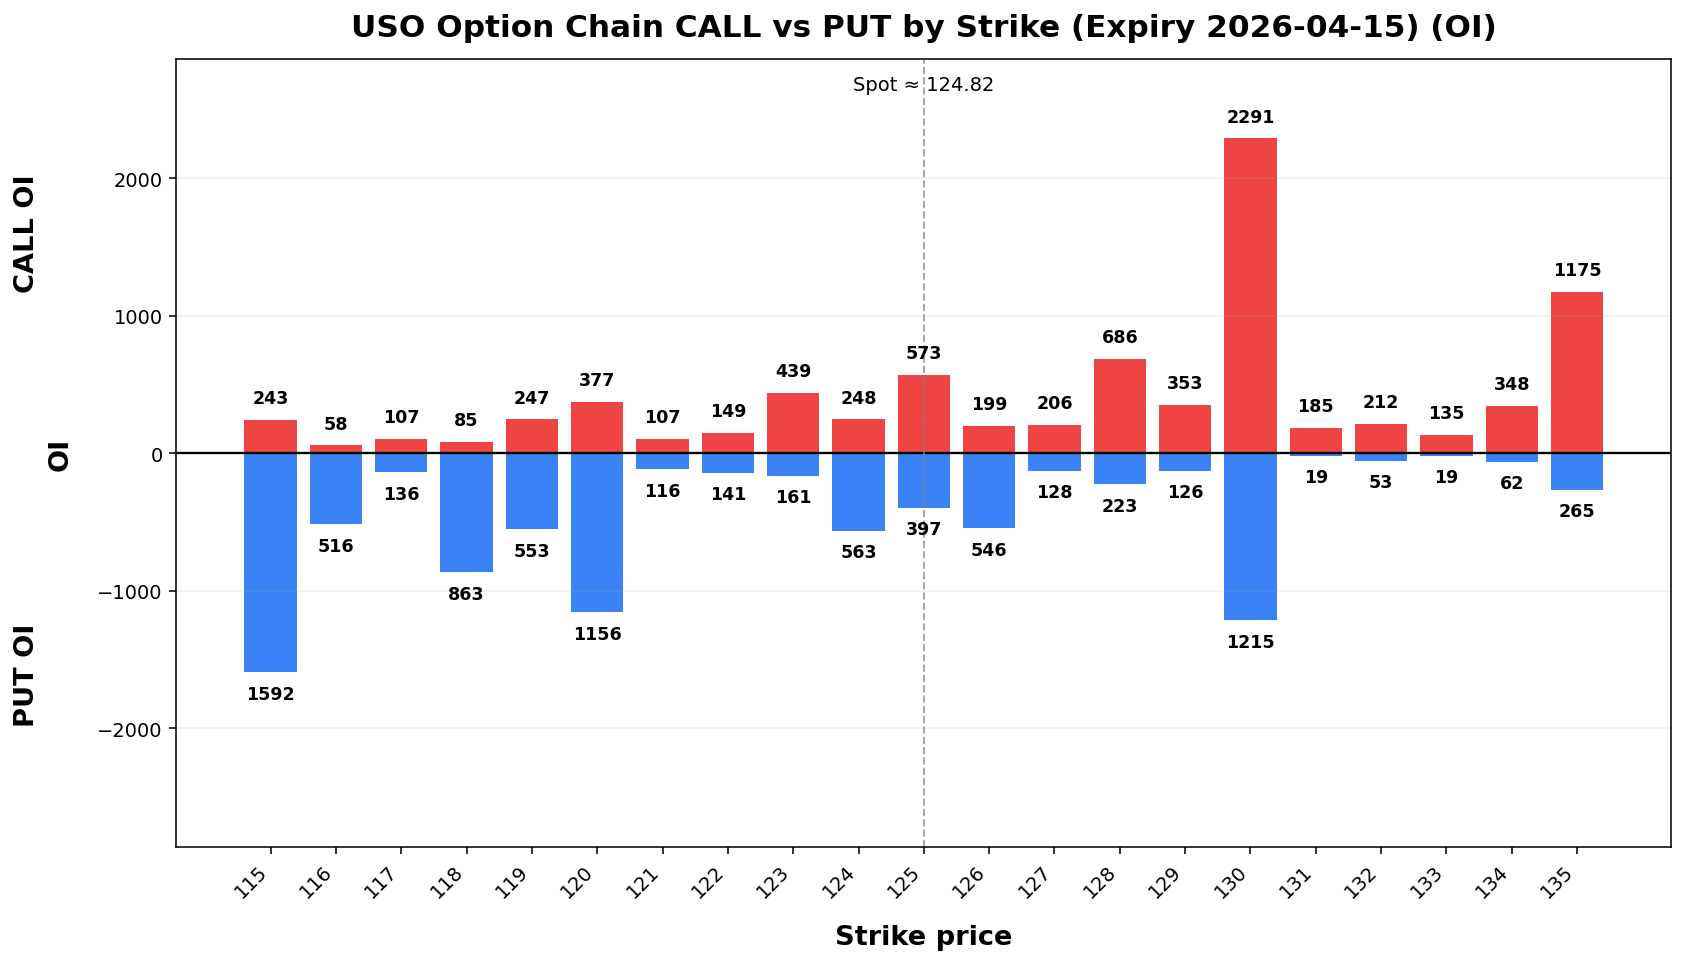
Structure & Probabilities
| Support |
Resistance |
Gamma Flip |
Max Pain |
P>Res |
P<Sup |
120.129.00 |
128.160.00 |
123.144.22 |
129.00 |
126.0040.7% |
36.6% |
26.8%8.7% |
Flow & Skew
| Call Vol |
Put Vol |
Vol P/C |
Call OI |
Put OI |
OI P/C |
Skew |
Skew Bias |
19,5327,704 |
10,7995,725 |
0.5574 |
13,80111,374 |
10,63314,503 |
0.771.28 |
-10.110.49 vol pts |
CALL_SKEWFLAT |
Tail Risk
| Q10 |
Q50 |
Q90 |
Down Tail |
Up Tail |
Down/Up |
114.118.50 |
155.02 |
189.76 |
124.9340.92 |
142.0630.34 |
10.06 |
17.24 |
0.581.35 |
Daily Technicals
| EMA20 |
EMA50 |
VWAP20 |
BB Lower |
BB Mid |
BB Upper |
BB Width |
Vol Ratio |
Path |
121.68125.38 |
106.1598.74 |
122.00116.89 |
106.9965.70 |
123.33118.39 |
139.68171.09 |
26.50%89.02% |
0.3166 |
UP trend (expanding) |
Day Plan
120.129.00-128.160.00 range: fade extremes- >
128.160.00: chase only if hold + vol
- <
120.129.00: risk expand; reduce size
- Regime:
PINTRANSITION
- Tech: UP trend (expanding)
Swing Plan
- Accumulate:
120.129.00-120.129.00
- Trim:
128.160.00-128.160.00
- Add: close >
128.160.00
- Cut: close <
120.129.00
- Best for:
pintransition regime
Raw Text Summary
📌 USOAAOI @ 124.82159.42 (2026-04-1219 08:4713 AM MYT)

• Current price is **124.82*159.42**. Key support is around **120.129.00**, and resistance is around **128.160.00**.
• For the next week, the model’s **68% expected range** is roughly **112.18135.15 to 137.46*183.69**.
• A wider **90% range** is about **104.03119.49 to 145.61*199.35**.
• Dealer positioning looks **LONG gamma**, so the market behavior is classified as **PIN*TRANSITION**.
• The estimated **gamma flip** is near **123.00*144.22**. Crossing and holding beyond this area can change the trading behavior.
• Approximate breakout odds: **above resistance 36.6%40.7%**, **below support 26.8%8.7%** by the target horizon.
• Options skew is tiltedfairly towardbalanced, so there is **calls*no strong directional bias**, whichfrom suggestsskew upside speculation is relatively stronger.alone.
• Near-term implied volatility is higher than the next expiry (**IV1 72.25%108.54% vs IV2 72.00%107.29%**), which suggests **near-term event stress / backwardation**.
• Recent volume is only **0.31x*66x** the 20-day average, so breakouts may be less reliable unless volume improves.
• On the daily chart, the stock currently looks like **UP trend (expanding)**.
• The implied distribution shows **moreheavier downside tail risk** than upside tail potential** than downside tail risk.potential.
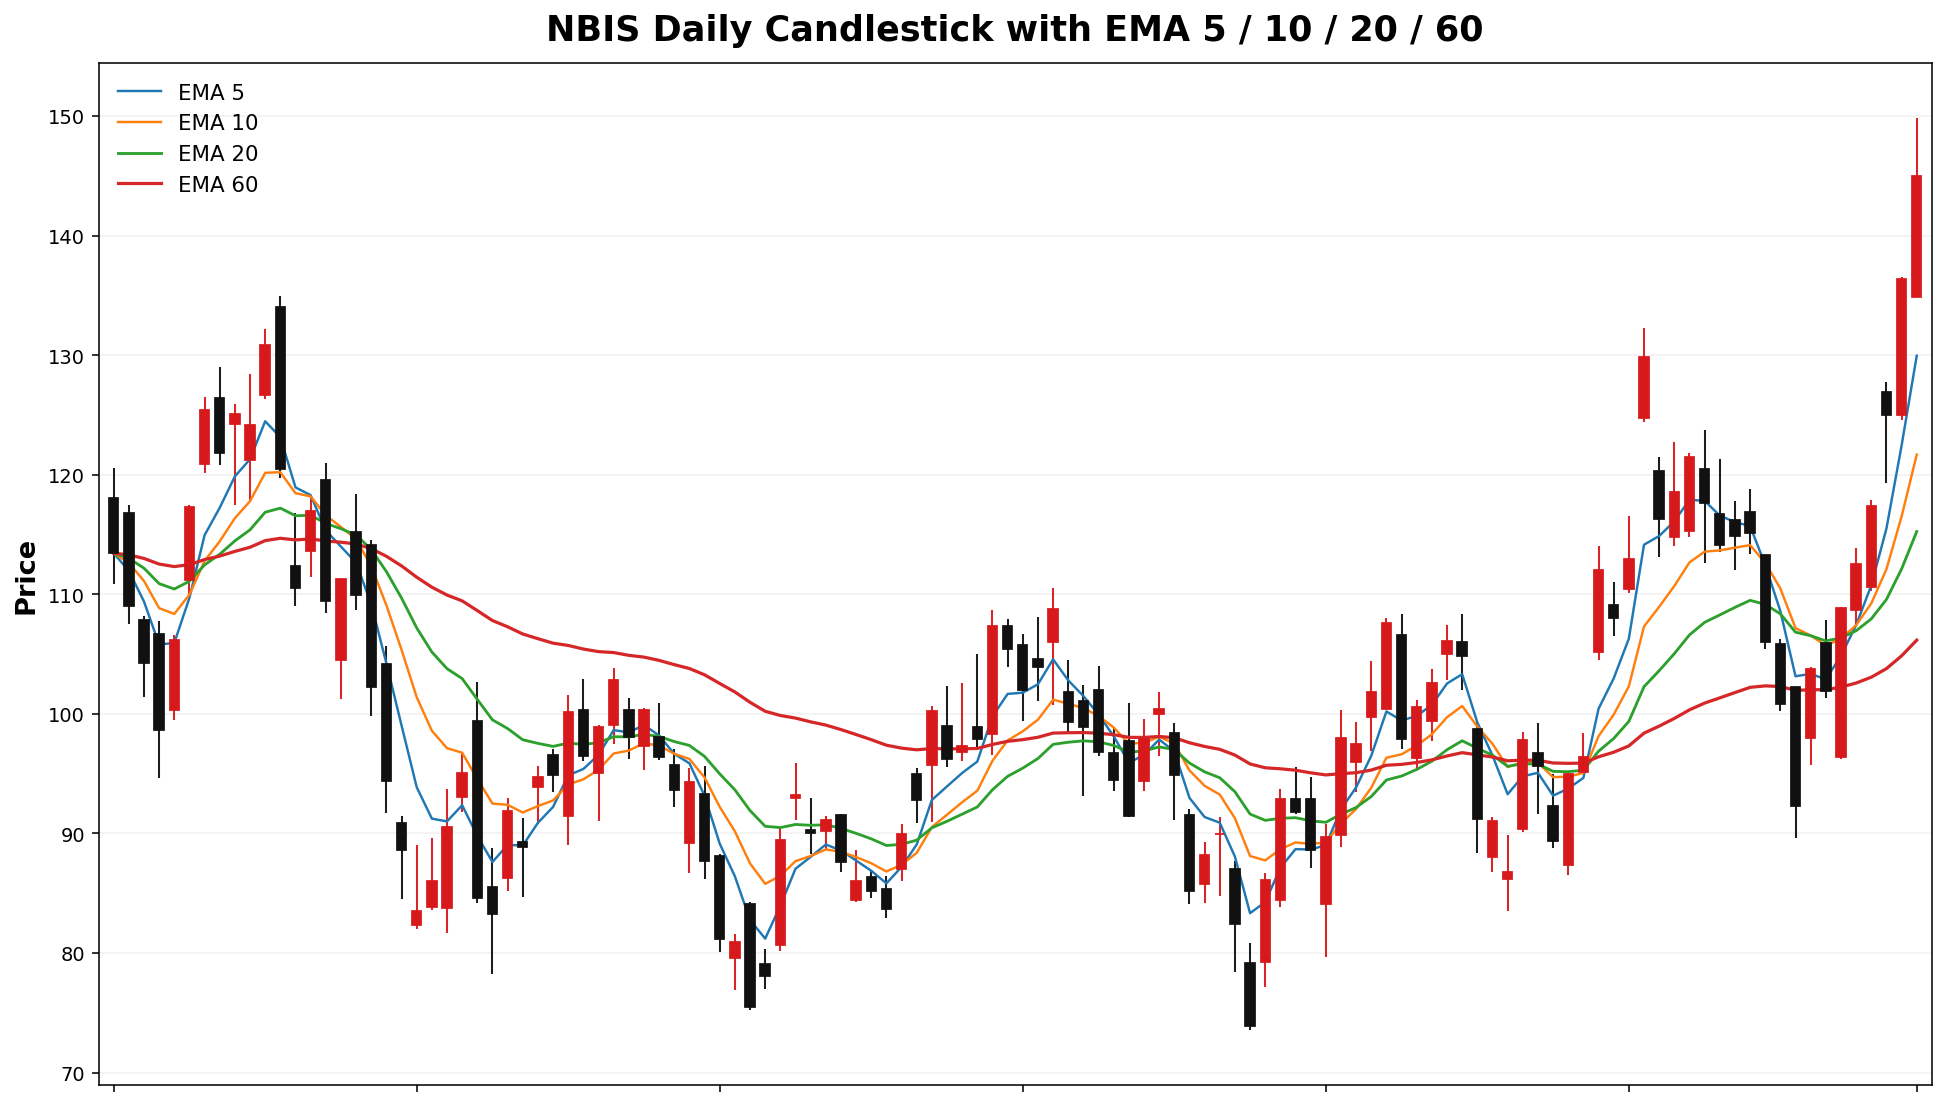
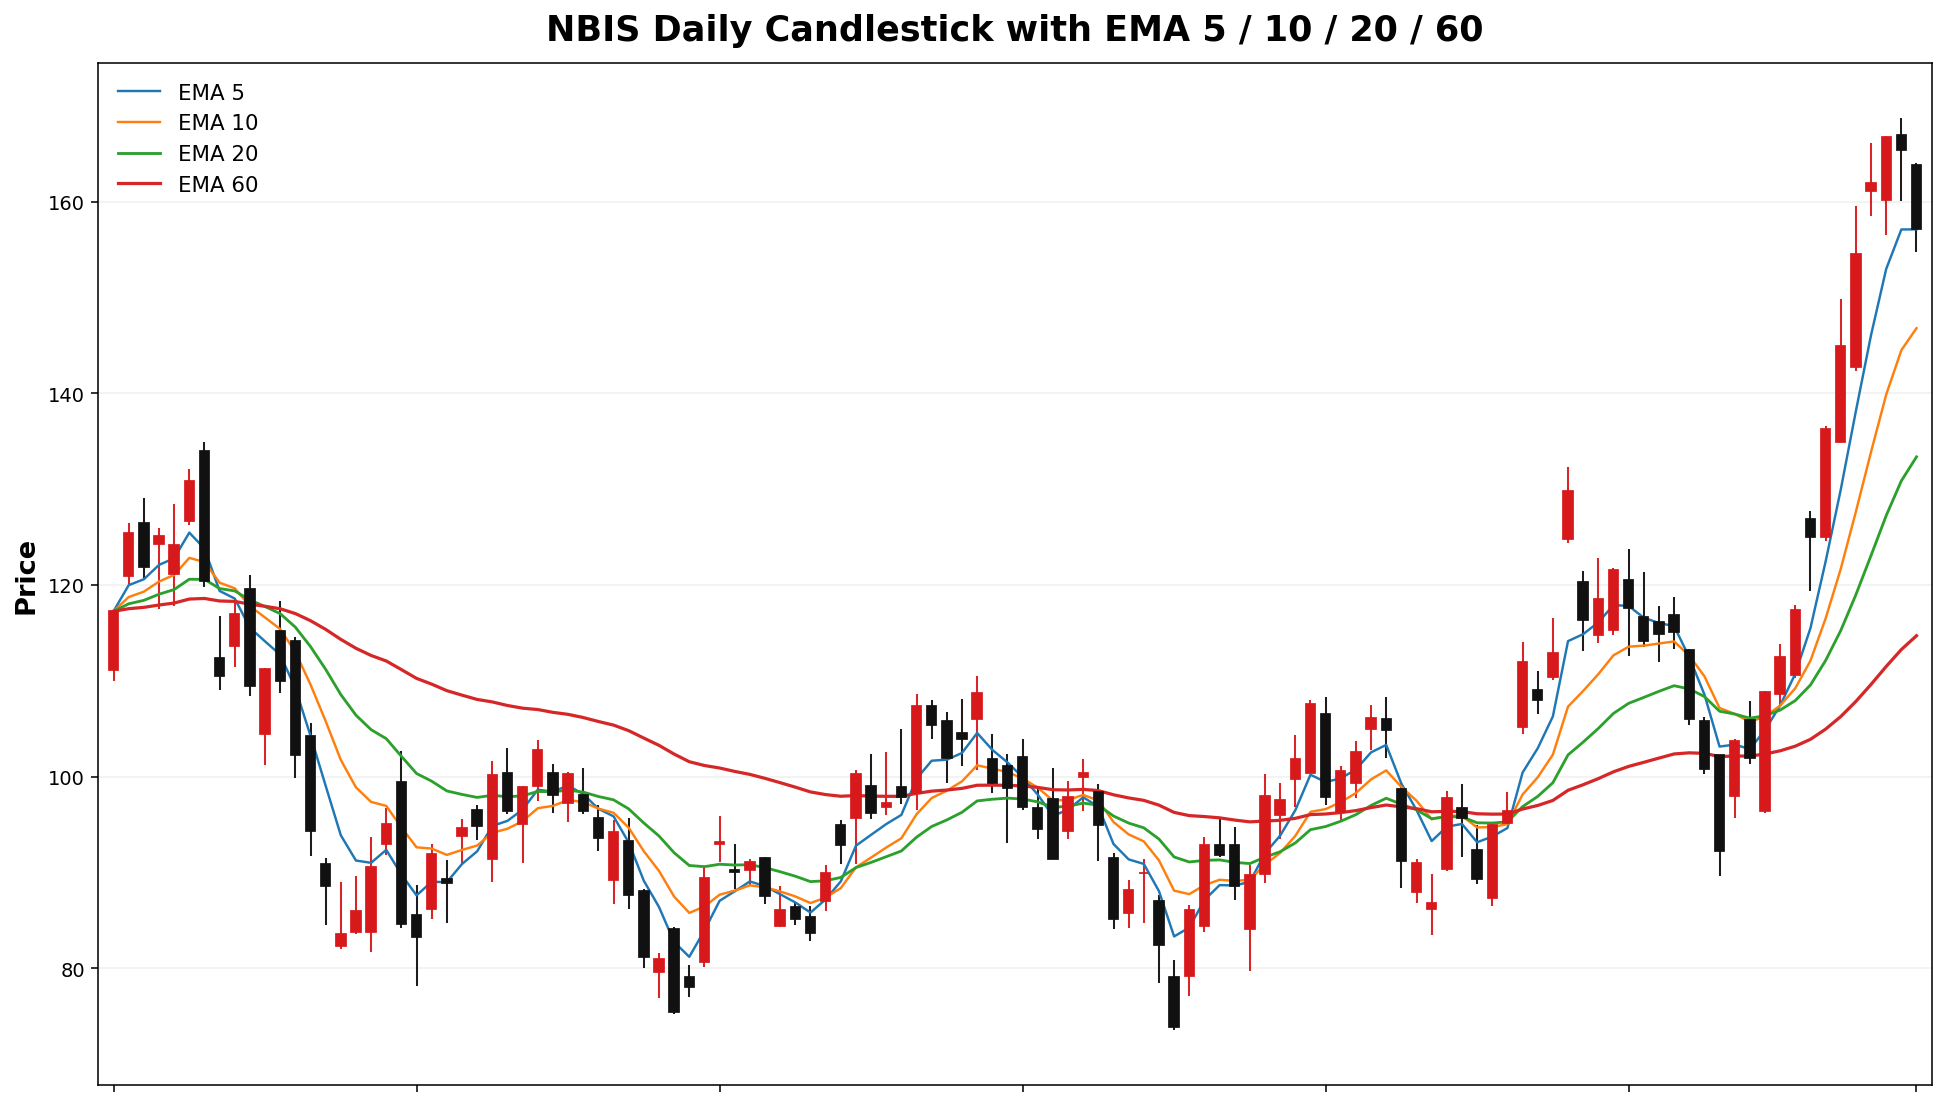
NBIS
Spot: 144.97157.14
Report Time: 2026-04-1219 08:4713 AM MYT
Regime: TRANSITIONTREND
Dealer Gamma: LONGSHORT
Term Structure
| Expiry |
DTE |
Forward |
ATM IV |
ATM Straddle |
2026-04-1724 |
6 |
145.01157.04 |
76.36%70.56% |
13.9514.00 |
2026-04-2405-01 |
13 |
145.38157.03 |
72.68.77% |
19.7520.25 |
Weekly Range
| Confidence |
Low |
High |
Width |
| 68% |
129.64141.66 |
160.30172.62 |
30.6695 |
| 80% |
125.32137.31 |
164.62176.97 |
39.2967 |
| 90% |
119.76131.68 |
170.18182.60 |
50.4391 |
| 95% |
114.92126.81 |
175.02187.47 |
60.0967 |
Structure & Probabilities
| Support |
Resistance |
Gamma Flip |
Max Pain |
P>Res |
P<Sup |
140.155.00 |
150.160.00 |
108.71147.21 |
110.139.00 |
30.5%47.4% |
36.6%59.1% |
Flow & Skew
| Call Vol |
Put Vol |
Vol P/C |
Call OI |
Put OI |
OI P/C |
Skew |
Skew Bias |
58,76714,894 |
28,3809,581 |
0.4864 |
50,18021,554 |
45,11829,679 |
0.901.38 |
2.643.12 vol pts |
PUT_SKEW |
Tail Risk
| Q10 |
Q50 |
Q90 |
Down Tail |
Up Tail |
Down/Up |
121.07120.88 |
143.18154.57 |
165.34177.33 |
23.9036.26 |
20.3719 |
1.1780 |
Daily Technicals
| EMA20 |
EMA50 |
VWAP20 |
BB Lower |
BB Mid |
BB Upper |
BB Width |
Vol Ratio |
Path |
115.25 |
107.26133.37 |
117.1904 |
90.90127.72 |
115.5477.74 |
140.18125.87 |
42.65%174.00 |
76.48% |
1.3105 |
UP trend (expanding) |
Day Plan
140.155.00-150.160.00 range: fade extremes- >
150.160.00: chase only if hold + vol
- <
140.155.00: risk expand; reduce size
- Regime:
TRANSITIONTREND
- Tech: UP trend (expanding)
Swing Plan
- Accumulate:
140.155.00-140.155.00
- Trim:
150.160.00-150.160.00
- Add: close >
150.160.00
- Cut: close <
140.155.00
- Best for:
transitiontrend regime
Raw Text Summary
📌 NBIS @ 144.97157.14 (2026-04-1219 08:4713 AM MYT)

• Current price is **144.97*157.14**. Key support is around **140.155.00**, and resistance is around **150.160.00**.
• For the next week, the model’s **68% expected range** is roughly **129.64141.66 to 160.30*172.62**.
• A wider **90% range** is about **119.76131.68 to 170.18*182.60**.
• Dealer positioning looks **LONGSHORT gamma**, so the market behavior is classified as **TRANSITION*TREND**.
• The estimated **gamma flip** is near **108.71*147.21**. Crossing and holding beyond this area can change the trading behavior.
• Approximate breakout odds: **above resistance 30.5%47.4%**, **below support 36.6%59.1%** by the target horizon.
• Options skew is tilted toward **puts**, which suggests traders are paying more for downside protection.
• Near-term implied volatility is higher than the next expiry (**IV1 76.36%70.56% vs IV2 72.68.77%**), which suggests **near-term event stress / backwardation**.
• On the daily chart, the stock currently looks like **UP trend (expanding)**.
• The implied distribution shows **heavier downside tail risk** than upside tail potential.
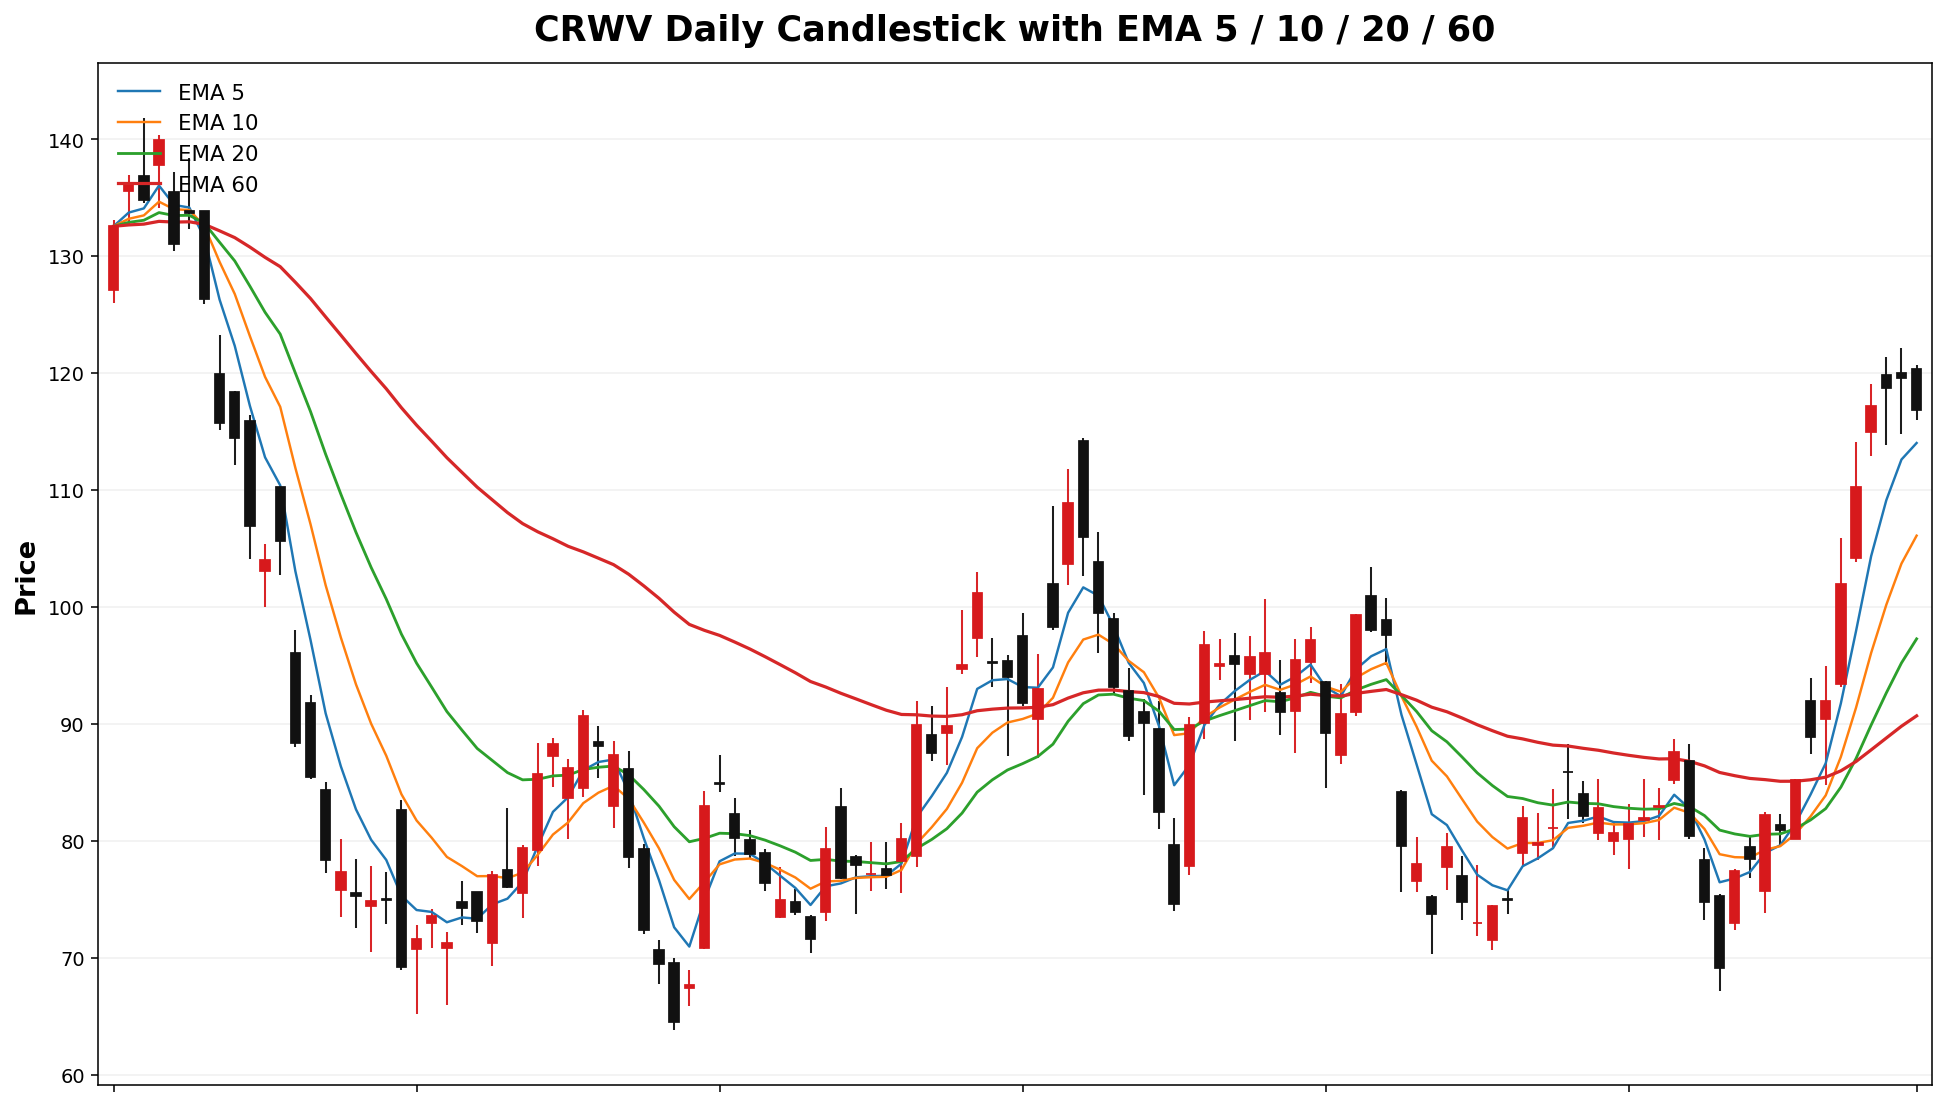
ASTSCRWV
Spot: 94.90116.85
Report Time: 2026-04-1219 08:4713 AM MYT
Regime: PIN
Dealer Gamma: LONG
Term Structure
| Expiry |
DTE |
Forward |
ATM IV |
ATM Straddle |
2026-04-1724 |
6 |
94.85116.95 |
87.17%70.15% |
10.4335 |
2026-04-2405-01 |
13 |
94.86117.15 |
86.82%67.48% |
15.4314.78 |
Weekly Range
| Confidence |
Low |
High |
Width |
| 68% |
83.26105.46 |
106.54128.24 |
23.2722.78 |
| 80% |
79.99102.25 |
109.81131.45 |
29.8219 |
| 90% |
75.7698.12 |
114.04135.58 |
38.2837.47 |
| 95% |
72.0994.53 |
117.71139.17 |
45.6144.65 |
Structure & Probabilities
| Support |
Resistance |
Gamma Flip |
Max Pain |
P>Res |
P<Sup |
90.115.00 |
95.120.00 |
93.25116.01 |
92.96.00 |
40.8%29.9% |
33.1%39.8% |
Flow & Skew
| Call Vol |
Put Vol |
Vol P/C |
Call OI |
Put OI |
OI P/C |
Skew |
Skew Bias |
20,5677,947 |
15,50636,349 |
0.754.57 |
75,28426,231 |
66,576 |
0.8857,267 |
2.0018 |
5.08 vol pts |
PUT_SKEW |
Tail Risk
| Q10 |
Q50 |
Q90 |
Down Tail |
Up Tail |
Down/Up |
78.1895.04 |
94.28106.65 |
111.79116.45 |
16.72 |
16.8921.81 |
0.9900 |
NA |
Daily Technicals
| EMA20 |
EMA50 |
VWAP20 |
BB Lower |
BB Mid |
BB Upper |
BB Width |
Vol Ratio |
Path |
90.1097.28 |
89.6390.84 |
89.4394.93 |
77.3158.70 |
89.3891.41 |
101.44124.12 |
26.99%71.57% |
0.9577 |
UP trend (expanding) |
Day Plan
90.115.00-95.120.00 range: fade extremes- >
95.120.00: chase only if hold + vol
- <
90.115.00: risk expand; reduce size
- Regime: PIN
- Tech: UP trend (expanding)
Swing Plan
- Accumulate:
90.115.00-90.115.00
- Trim:
95.120.00-95.120.00
- Add: close >
95.120.00
- Cut: close <
90.115.00
- Best for: pin regime
Raw Text Summary
📌 ASTSCRWV @ 94.90116.85 (2026-04-1219 08:4713 AM MYT)

• Current price is **94.90*116.85**. Key support is around **90.115.00**, and resistance is around **95.120.00**.
• For the next week, the model’s **68% expected range** is roughly **83.26105.46 to 106.54*128.24**.
• A wider **90% range** is about **75.7698.12 to 114.04*135.58**.
• Dealer positioning looks **LONG gamma**, so the market behavior is classified as **PIN**.
• The estimated **gamma flip** is near **93.25*116.01**. Crossing and holding beyond this area can change the trading behavior.
• Approximate breakout odds: **above resistance 40.8%29.9%**, **below support 33.1%39.8%** by the target horizon.
• Options skew is tilted toward **puts**, which suggests traders are paying more for downside protection.
• Near-term implied volatility is higher than the next expiry (**IV1 87.17%70.15% vs IV2 86.82%67.48%**), which suggests **near-term event stress / backwardation**.
• Recent volume is only **0.77x** the 20-day average, so breakouts may be less reliable unless volume improves.
• On the daily chart, the stock currently looks like **UP trend (expanding)**.
• The implied distribution is **fairly balanced** between upside and downside tails.
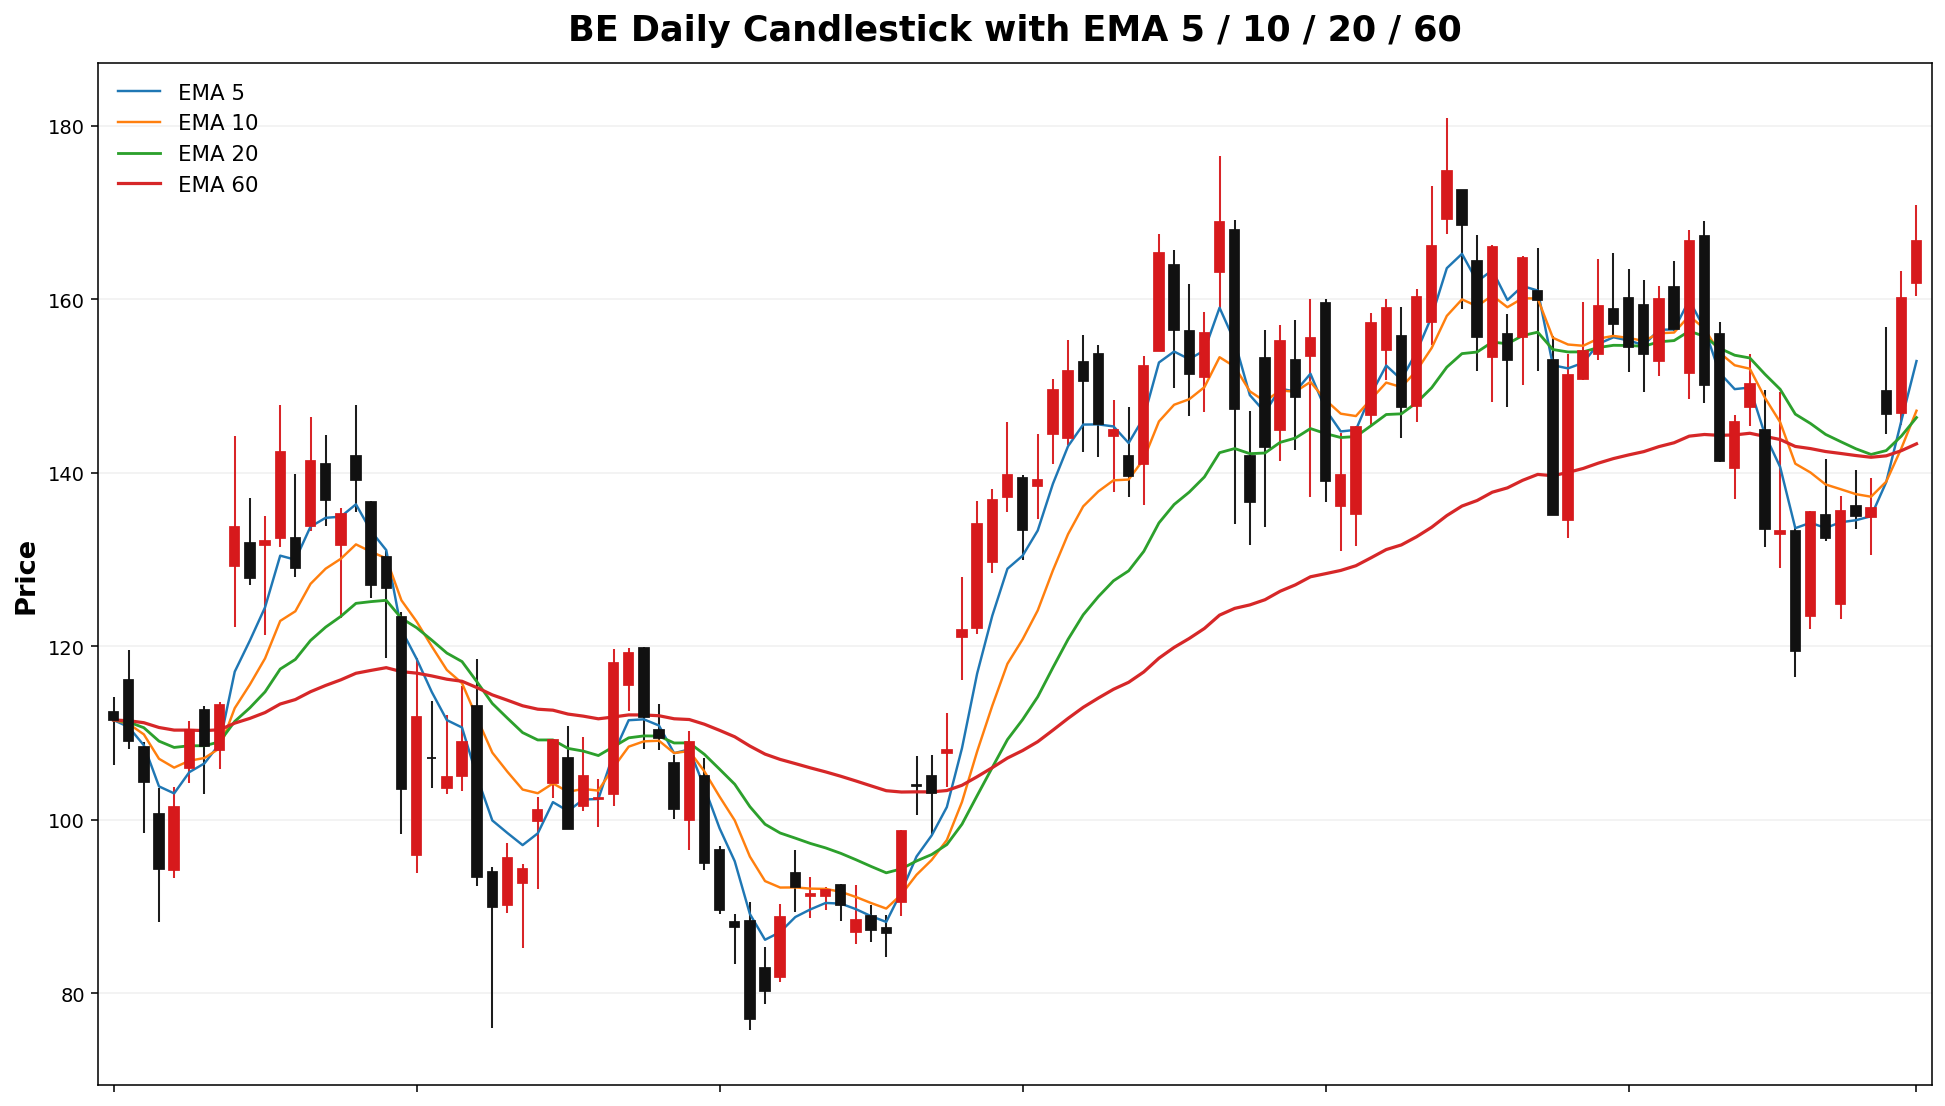
BERKLB
Spot: 166.7084.80
Report Time: 2026-04-1219 08:4713 AM MYT
Regime: TRANSITION
Dealer Gamma: LONG
Term Structure
| Expiry |
DTE |
Forward |
ATM IV |
ATM Straddle |
2026-04-1724 |
6 |
166.6584.77 |
84.14%73.08% |
17.687.83 |
2026-04-2405-01 |
13 |
166.4884.80 |
82.99%69.86% |
25.9011.10 |
Weekly Range
| Confidence |
Low |
High |
Width |
| 68% |
147.0476.21 |
186.3693.39 |
39.3217.19 |
| 80% |
141.5173.79 |
191.8995.81 |
50.3922.02 |
| 90% |
134.3670.67 |
199.0498.93 |
64.6728.27 |
| 95% |
128.1767.96 |
205.23101.64 |
77.0633.68 |
Structure & Probabilities
| Support |
Resistance |
Gamma Flip |
Max Pain |
P>Res |
P<Sup |
160.80.00 |
175.85.00 |
133.6169.59 |
130.70.00 |
27.6%48.2% |
36.0%23.7% |
Flow & Skew
| Call Vol |
Put Vol |
Vol P/C |
Call OI |
Put OI |
OI P/C |
Skew |
Skew Bias |
13,59026,280 |
19,911 |
1.47 |
58,865 |
55,74616,630 |
0.9563 |
9.8427,878 |
27,078 |
0.97 |
-2.44 vol pts |
PUT_SKEWCALL_SKEW |
Tail Risk
| Q10 |
Q50 |
Q90 |
Down Tail |
Up Tail |
Down/Up |
31.5468.80 |
37.7282.63 |
179.3097.64 |
135.1616.00 |
12.6084 |
10.721.25 |
Daily Technicals
| EMA20 |
EMA50 |
VWAP20 |
BB Lower |
BB Mid |
BB Upper |
BB Width |
Vol Ratio |
Path |
146.3871.55 |
144.5770.75 |
146.2069.62 |
119.7356.19 |
145.6768.90 |
171.6181.60 |
35.62%36.87% |
0.941.02 |
UP trend (expanding) |
Day Plan
160.80.00-175.85.00 range: fade extremes- >
175.85.00: chase only if hold + vol
- <
160.80.00: risk expand; reduce size
- Regime: TRANSITION
- Tech: UP trend (expanding)
Swing Plan
- Accumulate:
160.80.00-160.80.00
- Trim:
175.85.00-175.85.00
- Add: close >
175.85.00
- Cut: close <
160.80.00
- Best for: transition regime
Raw Text Summary
📌 BERKLB @ 166.7084.80 (2026-04-1219 08:4713 AM MYT)

• Current price is **166.70*84.80**. Key support is around **160.80.00**, and resistance is around **175.85.00**.
• For the next week, the model’s **68% expected range** is roughly **147.0476.21 to 186.36*93.39**.
• A wider **90% range** is about **134.3670.67 to 199.04*98.93**.
• Dealer positioning looks **LONG gamma**, so the market behavior is classified as **TRANSITION**.
• The estimated **gamma flip** is near **133.61*69.59**. Crossing and holding beyond this area can change the trading behavior.
• Approximate breakout odds: **above resistance 27.6%48.2%**, **below support 36.0%23.7%** by the target horizon.
• Options skew is tilted toward **puts*calls**, which suggests tradersupside arespeculation payingis morerelatively for downside protection.stronger.
• Near-term implied volatility is higher than the next expiry (**IV1 84.14%73.08% vs IV2 82.99%69.86%**), which suggests **near-term event stress / backwardation**.
• On the daily chart, the stock currently looks like **UP trend (expanding)**.
• The implied distribution shows **heavier downside tail risk** than upside tail potential.
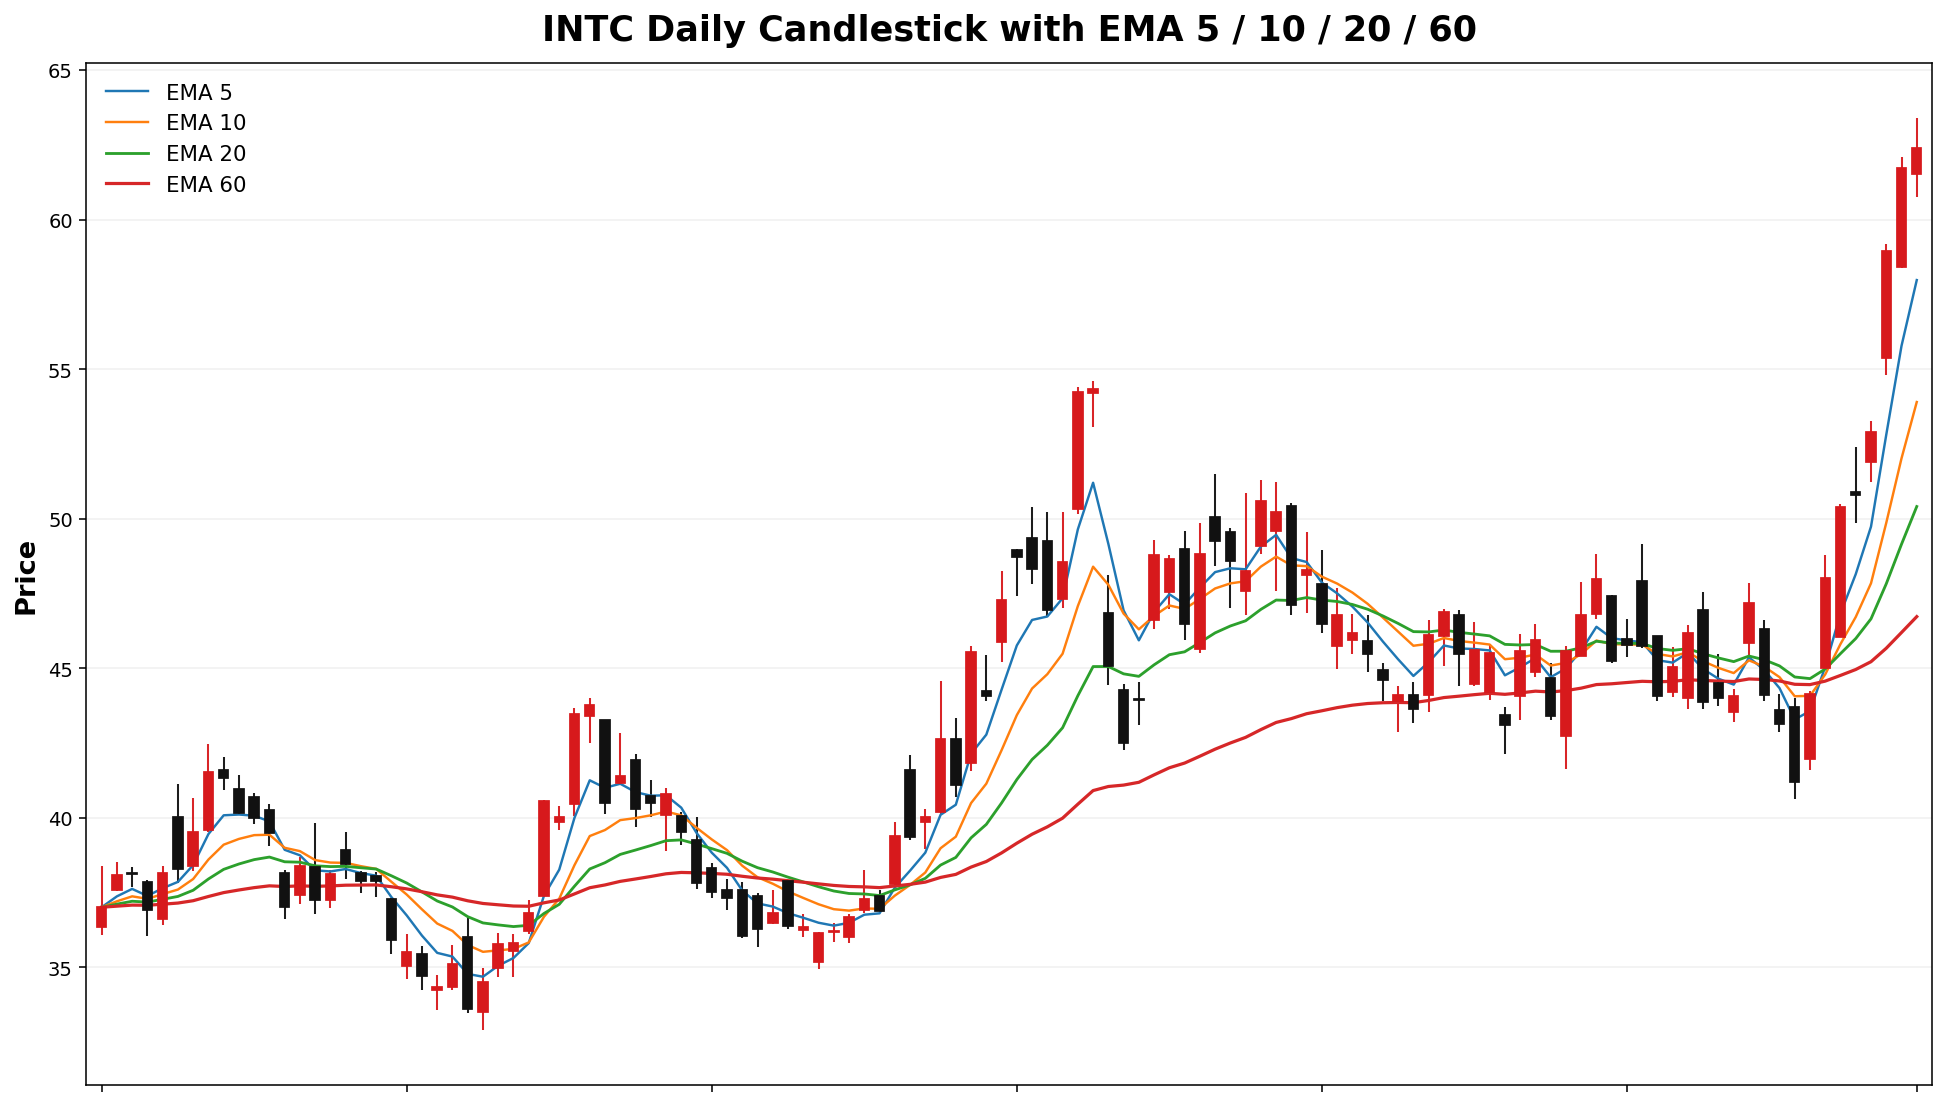
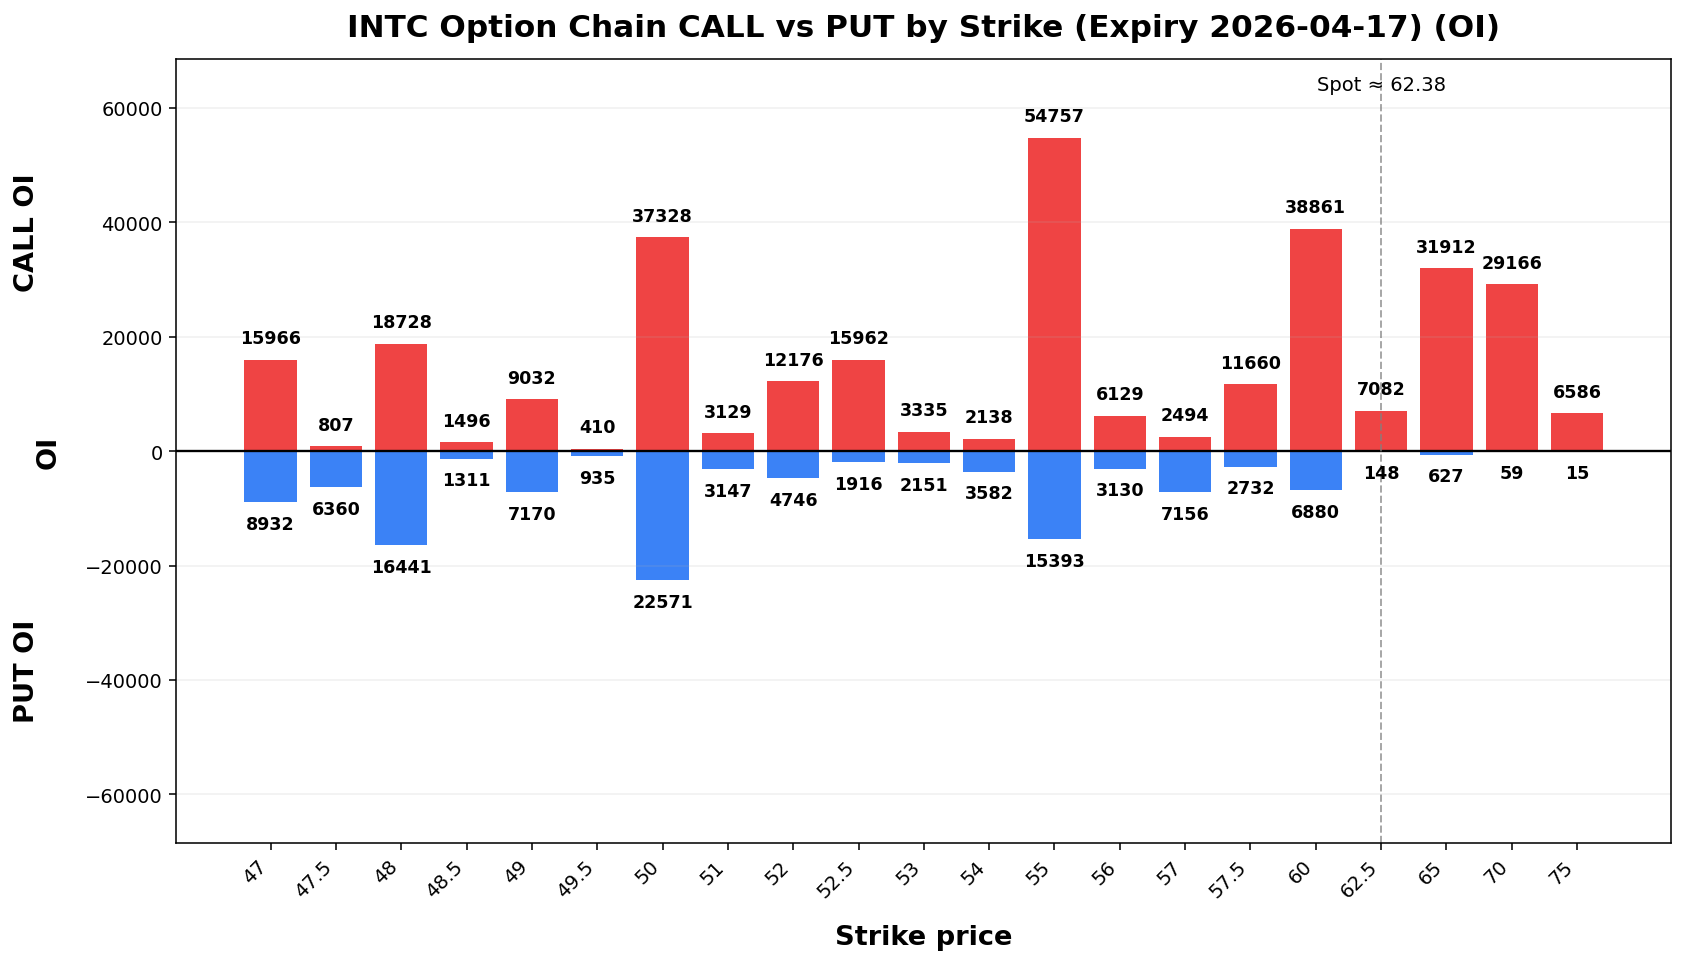
INTC
Spot: 62.3868.50
Report Time: 2026-04-1219 08:4713 AM MYT
Regime: TRANSITION
Dealer Gamma: LONG
Term Structure
| Expiry |
DTE |
Forward |
ATM IV |
ATM Straddle |
2026-04-1724 |
6 |
62.4168.54 |
54.83%88.44% |
4.317.65 |
2026-04-2405-01 |
13 |
62.4768.56 |
73.22%70.90% |
8.559.10 |
Weekly Range
| Confidence |
Low |
High |
Width |
| 68% |
56.9260.53 |
67.8476.47 |
10.15.93 |
| 80% |
55.3858.29 |
69.3878.71 |
14.0020.42 |
| 90% |
53.3955.40 |
71.3781.60 |
17.9726.21 |
| 95% |
51.6752.89 |
73.0984.11 |
21.4131.23 |
Structure & Probabilities
| Support |
Resistance |
Gamma Flip |
Max Pain |
P>Res |
P<Sup |
60.00 |
65.00 |
47.54 |
48.70.00 |
25.59.58 |
56.00 |
41.8% |
27.1% |
Flow & Skew
| Call Vol |
Put Vol |
Vol P/C |
Call OI |
Put OI |
OI P/C |
Skew |
Skew Bias |
66,46964,026 |
65,617 |
0.99 |
424,497 |
434,05776,338 |
1.0219 |
125,666 |
133,576 |
1.06 |
-1.513.22 vol pts |
CALL_SKEW |
Tail Risk
| Q10 |
Q50 |
Q90 |
Down Tail |
Up Tail |
Down/Up |
51.5355.27 |
61.5966.95 |
69.5879.88 |
10.8513.23 |
7.2011.38 |
1.5116 |
Daily Technicals
| EMA20 |
EMA50 |
VWAP20 |
BB Lower |
BB Mid |
BB Upper |
BB Width |
Vol Ratio |
Path |
50.41 |
47.28 |
49.12 |
35.56.71 |
48.1850.72 |
60.6553.95 |
51.77%33.95 |
0.9653.39 |
UP trend (expanding) |
Day Plan
60.00-65.00 range: fade extremes
> 65.00: chase only if hold + vol
< 60.00: risk expand; reduce size
Regime: TRANSITION
Tech: UP trend (expanding)
Swing Plan
Accumulate: 60.00-60.00
Trim: 65.00-65.00
Add: close > 65.00
Cut: close < 60.00
Best for: transition regime
Raw Text Summary
📌 INTC @ 62.38 (2026-04-12 08:47 AM MYT)

• Current price is **62.38**. Key support is around **60.00**, and resistance is around **65.00**.
• For the next week, the model’s **68% expected range** is roughly **56.92 to 67.84**.
• A wider **90% range** is about **53.39 to 71.37**.
• Dealer positioning looks **LONG gamma**, so the market behavior is classified as **TRANSITION**.
• The estimated **gamma flip** is near **47.54**. Crossing and holding beyond this area can change the trading behavior.
• Approximate breakout odds: **above resistance 25.8%**, **below support 27.1%** by the target horizon.
• Options skew is fairly balanced, so there is **no strong directional bias** from skew alone.
• Near-term implied volatility is lower than the next expiry (**IV1 54.83% vs IV2 73.22%**), which suggests a **contango / calmer front expiry** setup.
• On the daily chart, the stock currently looks like **UP trend (expanding)**.
• The implied distribution shows **heavier downside tail risk** than upside tail potential.
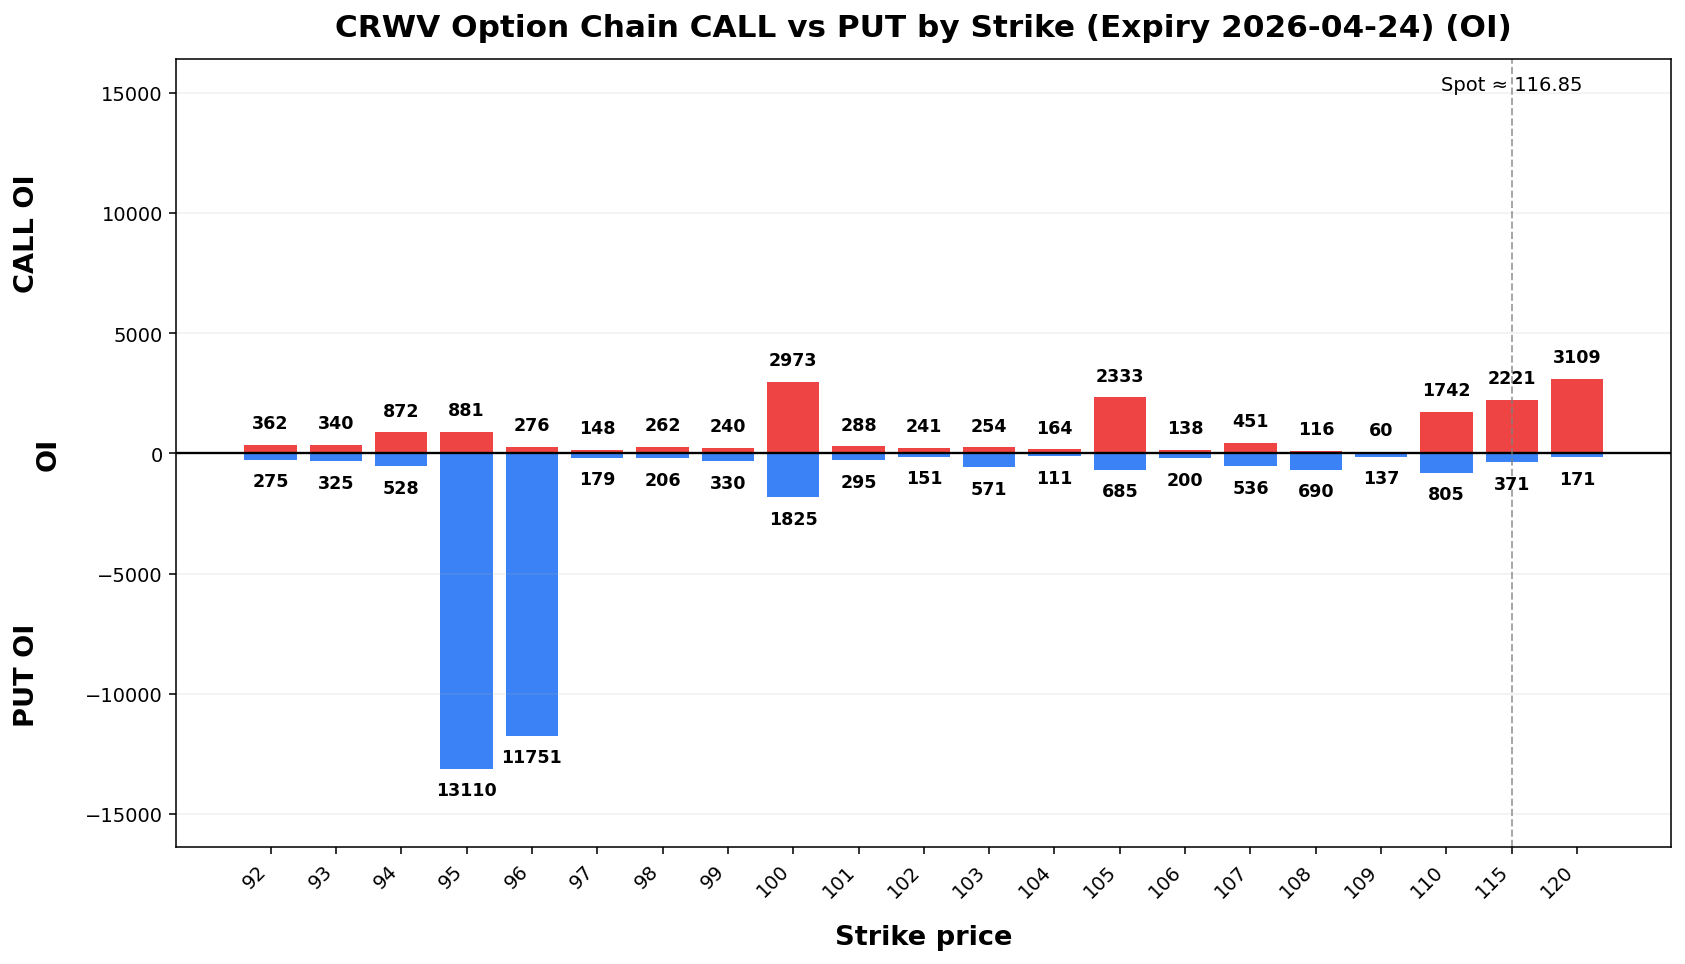
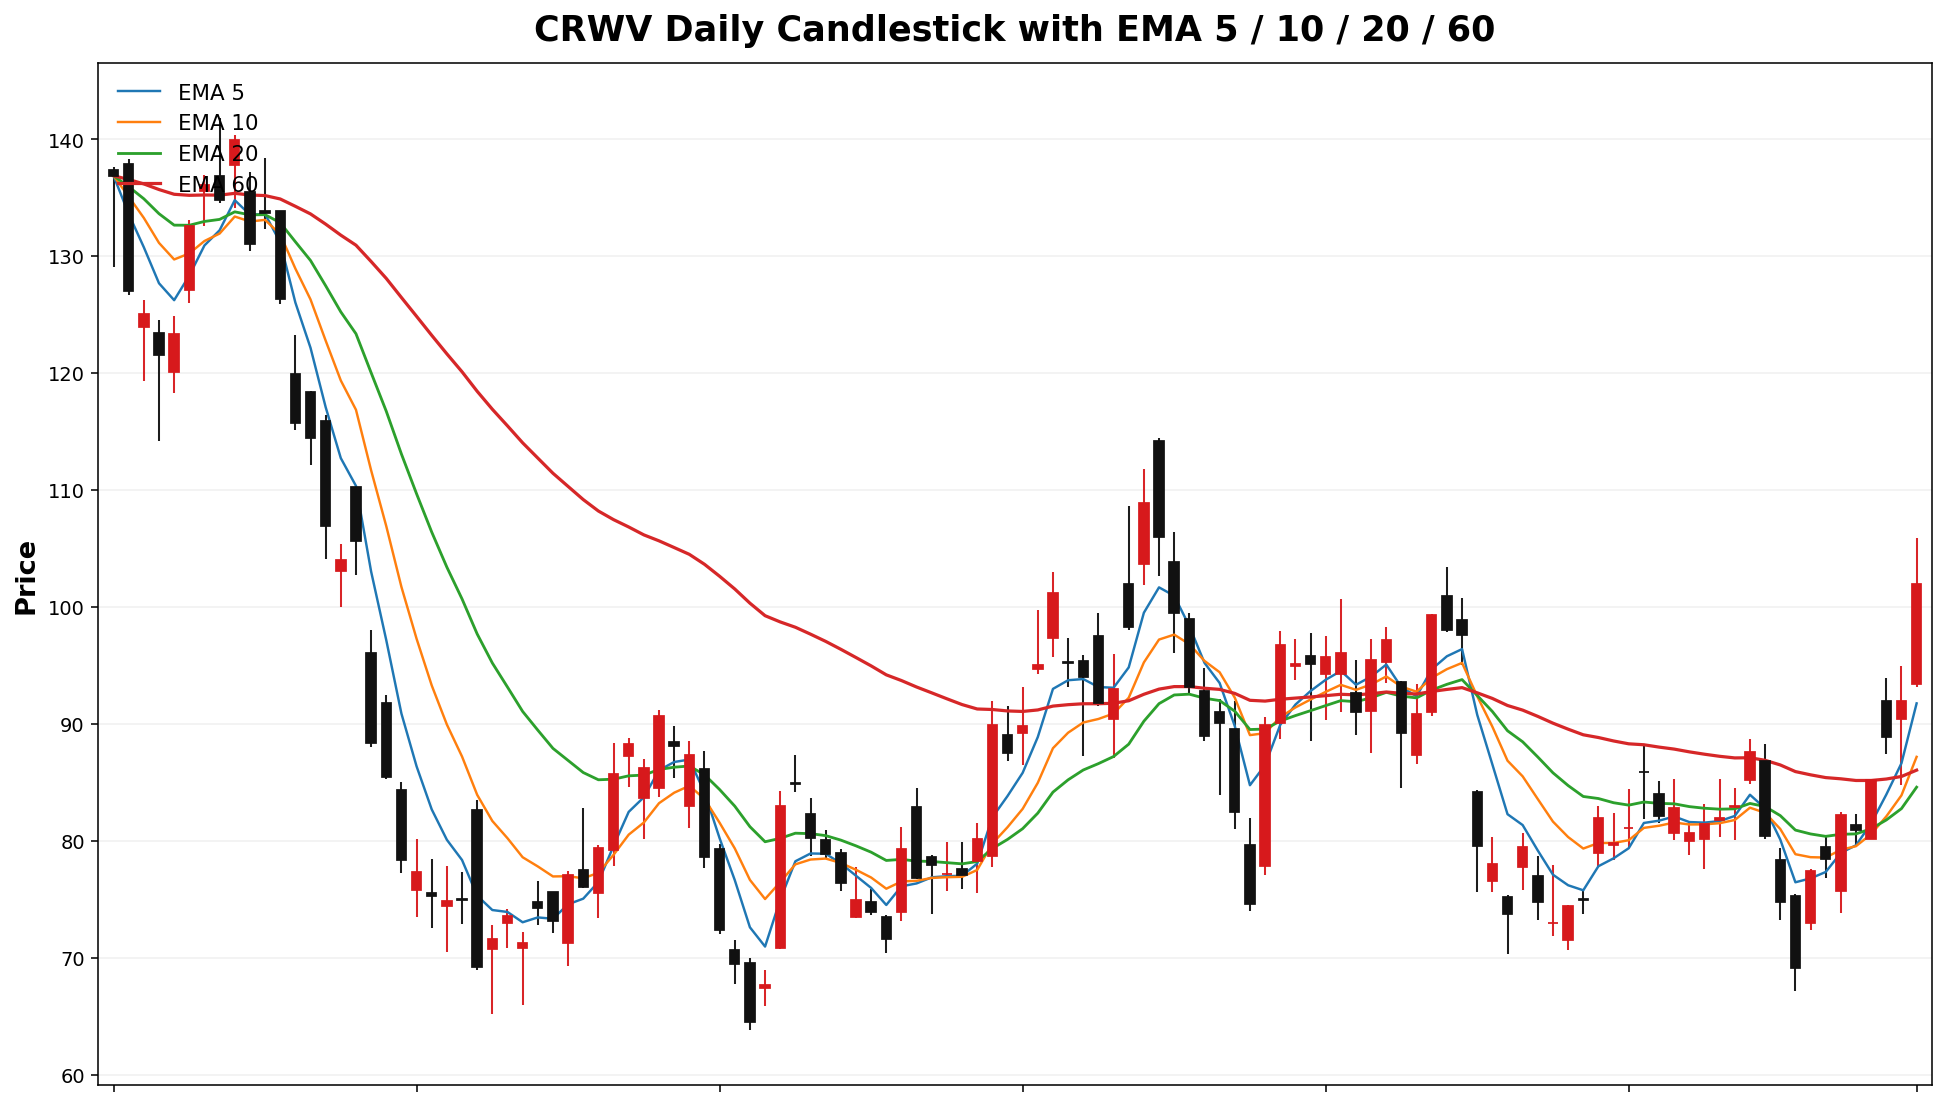
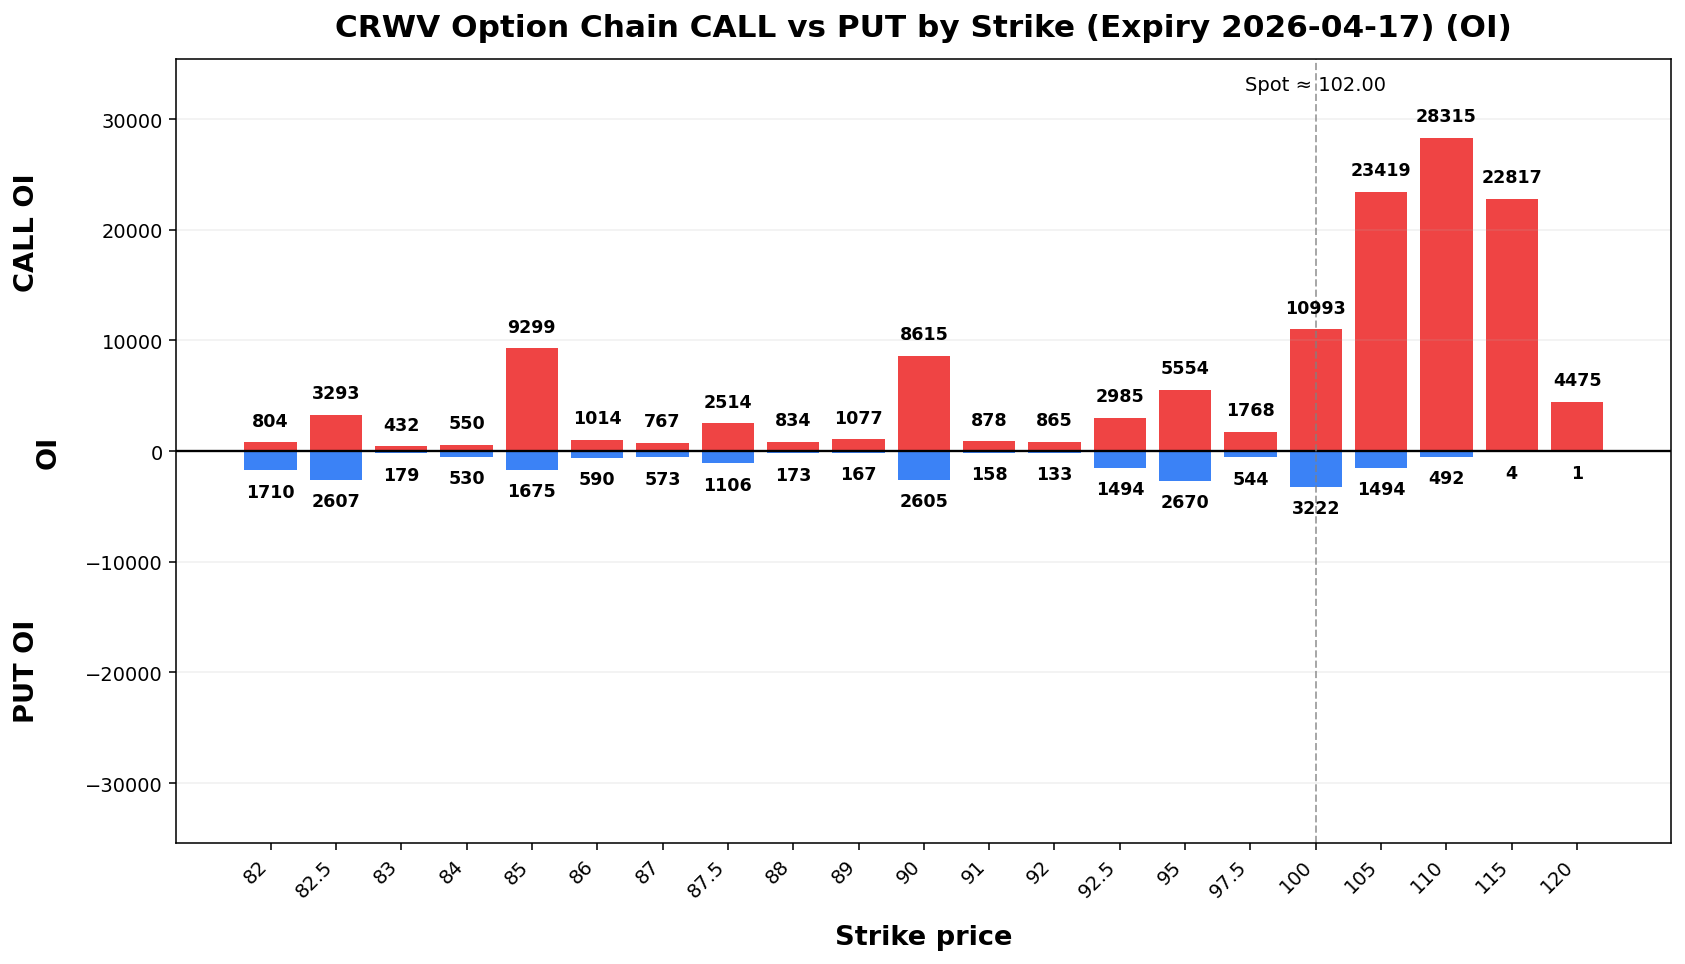
CRWV
Spot: 102.00
Report Time: 2026-04-12 08:47 AM MYT
Regime: TRANSITION
Dealer Gamma: LONG
Term Structure
Expiry |
DTE |
Forward |
ATM IV |
ATM Straddle |
|---|
2026-04-1772.82 |
6 |
102.05 |
78.58% |
10.10 |
2026-04-24 |
13 |
102.08 |
74.63% |
14.25 |
Weekly Range
Confidence |
Low |
High |
Width |
|---|
68% |
90.91 |
113.09 |
22.17 |
72.80% |
87.79 |
116.21 |
28.41 |
90% |
83.77 |
120.23 |
36.47 |
95% |
80.27 |
123.73 |
43.46 |
Structure & Probabilities
Support |
Resistance |
Gamma Flip |
Max Pain |
P>Res |
P<Sup |
|---|
100.00 |
105.00 |
85.25 |
82.50 |
36.2% |
47.1% |
Flow & Skew
Call Vol |
Put Vol |
Vol P/C |
Call OI |
Put OI |
OI P/C |
Skew |
Skew Bias |
|---|
146,464 |
92,411 |
0.63 |
188,773 |
179,205 |
0.95 |
7.32 vol pts |
PUT_SKEW |
Tail Risk
Q10 |
Q50 |
Q90 |
Down Tail |
Up Tail |
Down/Up |
|---|
82.44 |
101.91 |
117.95 |
19.56 |
15.95 |
1.23 |
Daily Technicals
EMA20 |
EMA50 |
VWAP20 |
BB Lower |
BB Mid |
BB Upper |
BB Width |
Vol Ratio |
Path |
|---|
84.60 |
85.13 |
85.11 |
69.57 |
82.91 |
96.26 |
32.19% |
3.11 |
Sideways / Range |
Day Plan
100.00-105.00 range: fade extremes
> 105.00: chase only if hold + vol
< 100.00: risk expand; reduce size
Regime: TRANSITION
Tech: Sideways / Range
Swing Plan
Accumulate: 100.00-100.00
Trim: 105.00-105.00
Add: close > 105.00
Cut: close < 100.00
Best for: transition regime
Raw Text Summary
📌 CRWV @ 102.00 (2026-04-12 08:47 AM MYT)

• Current price is **102.00**. Key support is around **100.00**, and resistance is around **105.00**.
• For the next week, the model’s **68% expected range** is roughly **90.91 to 113.09**.
• A wider **90% range** is about **83.77 to 120.23**.
• Dealer positioning looks **LONG gamma**, so the market behavior is classified as **TRANSITION**.
• The estimated **gamma flip** is near **85.25**. Crossing and holding beyond this area can change the trading behavior.
• Approximate breakout odds: **above resistance 36.2%**, **below support 47.1%** by the target horizon.
• Options skew is tilted toward **puts**, which suggests traders are paying more for downside protection.
• Near-term implied volatility is higher than the next expiry (**IV1 78.58% vs IV2 74.63%**), which suggests **near-term event stress / backwardation**.
• Recent volume is **3.11x** the 20-day average, which supports stronger continuation or breakout follow-through.
• On the daily chart, the stock currently looks like **Sideways / Range**.
• The implied distribution shows **heavier downside tail risk** than upside tail potential.
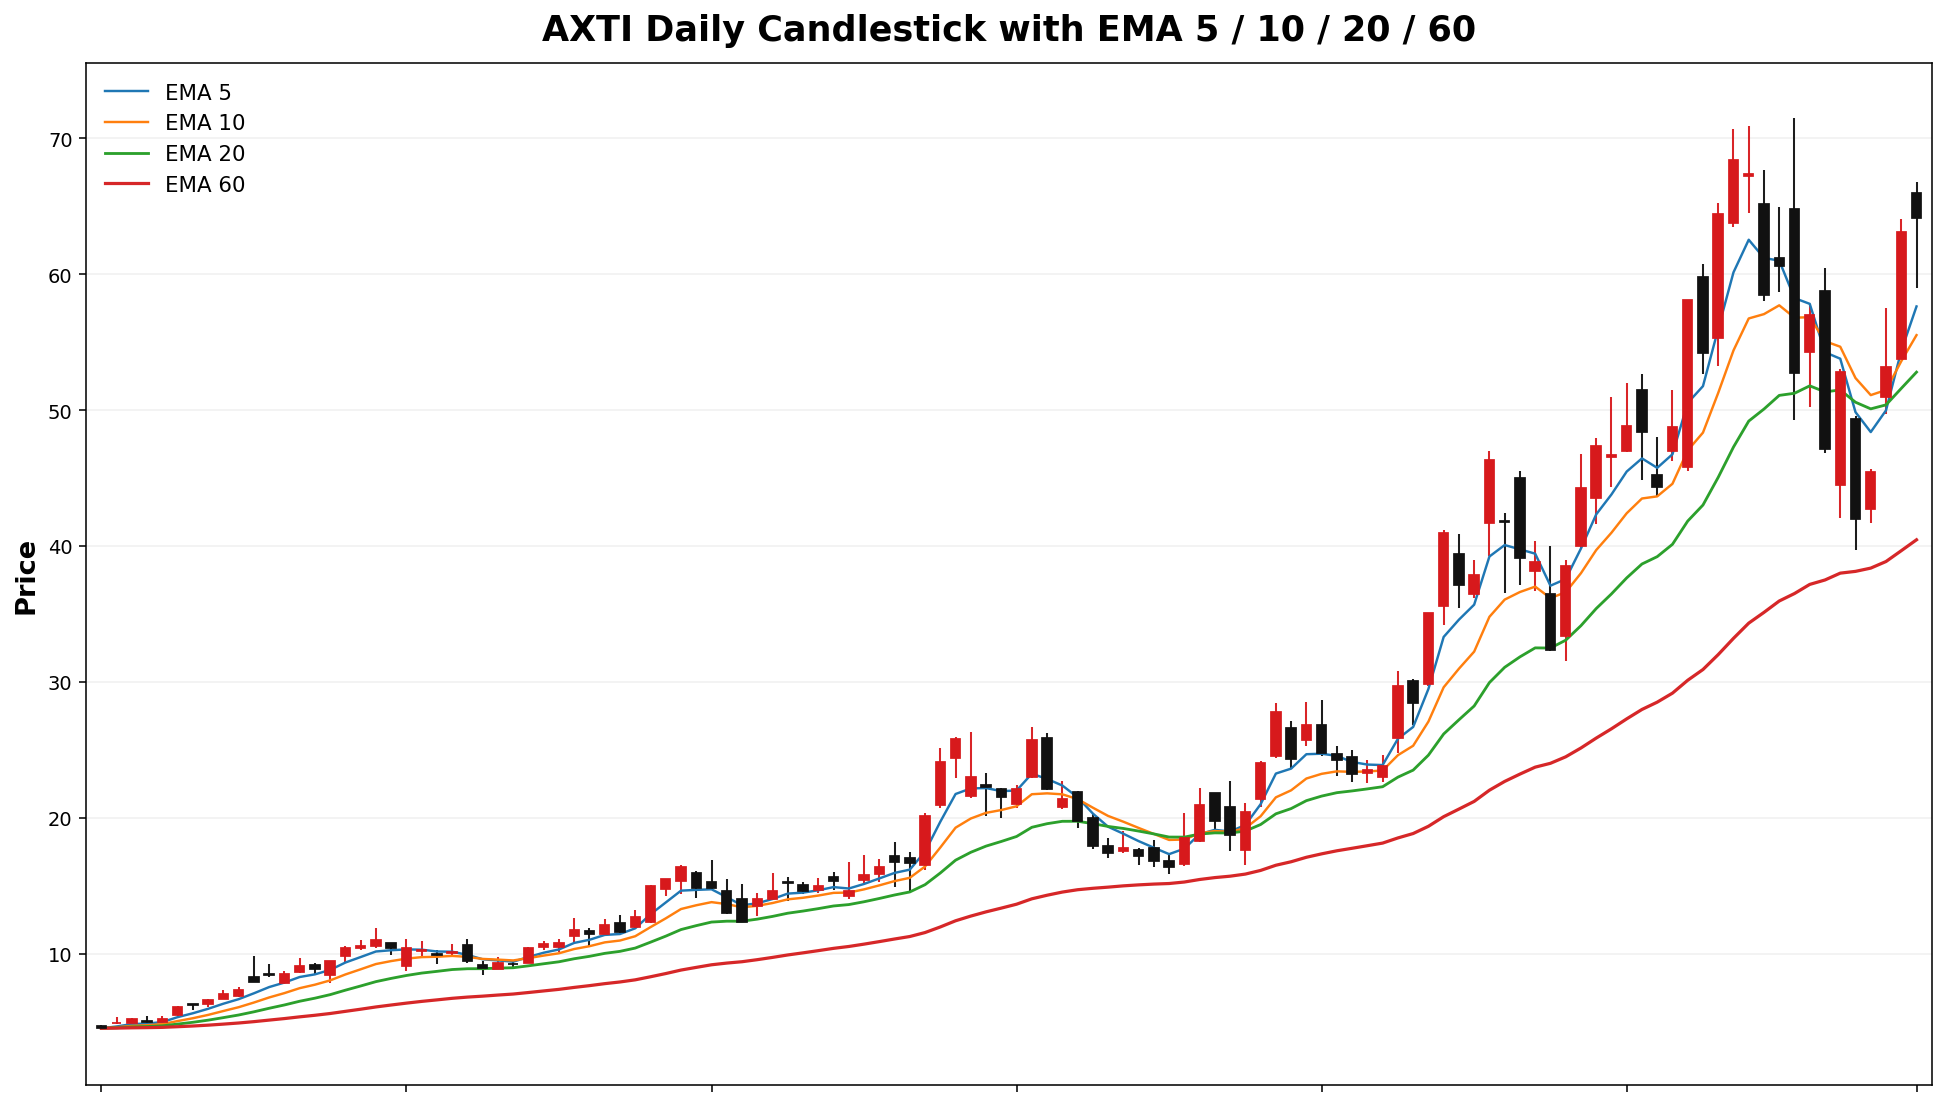
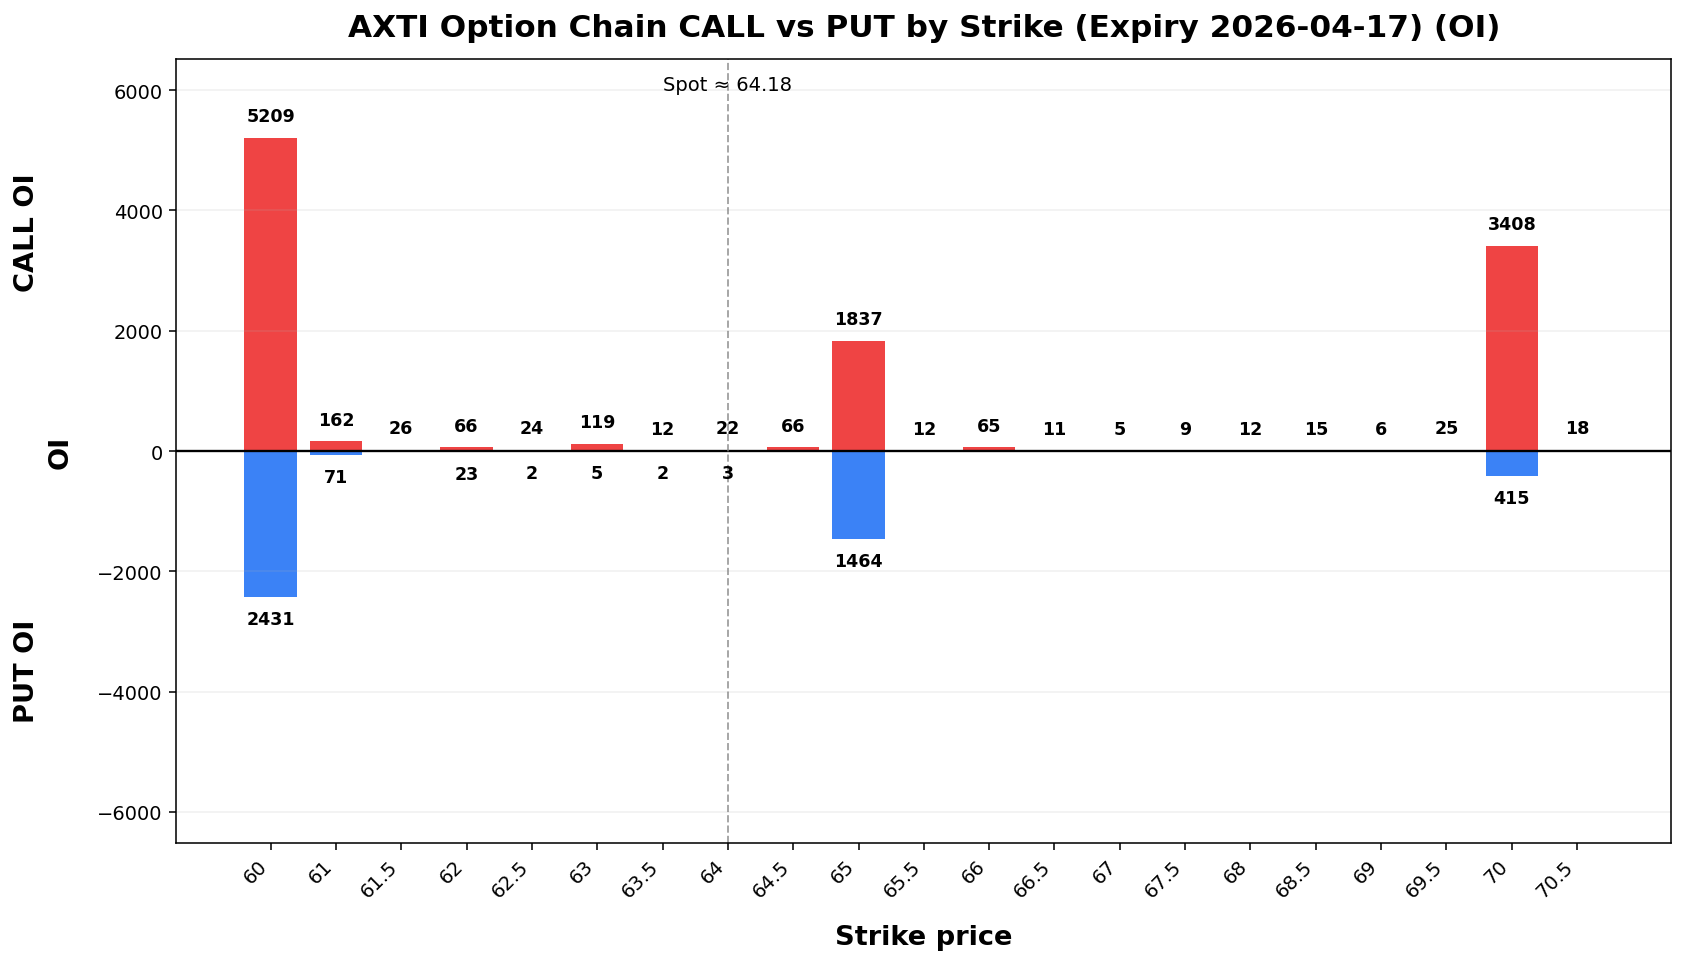
AXTI
Spot: 64.18
Report Time: 2026-04-12 08:47 AM MYT
Regime: TRANSITION
Dealer Gamma: LONG
Term Structure
Expiry |
DTE |
Forward |
ATM IV |
ATM Straddle |
|---|
2026-04-17 |
6 |
64.88 |
157.65% |
12.75 |
2026-04-24 |
13 |
64.91 |
145.65% |
17.50 |
Weekly Range
Confidence |
Low |
High |
Width |
|---|
68% |
50.31 |
78.05 |
27.73 |
80% |
46.41 |
81.95 |
35.54 |
90% |
41.37 |
86.99 |
45.61 |
95% |
37.00 |
91.36 |
54.35 |
Structure & Probabilities
Support |
Resistance |
Gamma Flip |
Max Pain |
P>Res |
P<Sup |
|---|
60.00 |
65.00 |
48.80 |
50.00 |
46.8% |
31.3% |
Flow & Skew
Call Vol |
Put Vol |
Vol P/C |
Call OI |
Put OI |
OI P/C |
Skew |
Skew Bias |
|---|
6,285 |
3,758 |
0.60 |
28,499 |
27,246 |
0.96 |
-3.91 vol pts |
CALL_SKEW |
Tail Risk
Q10 |
Q50 |
Q90 |
Down Tail |
Up Tail |
Down/Up |
|---|
45.03 |
65.77 |
84.01 |
19.15 |
19.83 |
0.97 |
Daily Technicals
EMA20 |
EMA50 |
VWAP20 |
BB Lower |
BB Mid |
BB Upper |
BB Width |
Vol Ratio |
Path |
|---|
52.80 |
43.11 |
54.44 |
39.10 |
54.98 |
70.87 |
57.80% |
0.93 |
UP trend (expanding) |
Day Plan
60.00-65.00 range: fade extremes
> 65.00: chase only if hold + vol
< 60.00: risk expand; reduce size
Regime: TRANSITION
Tech: UP trend (expanding)
Swing Plan
Accumulate: 60.00-60.00
Trim: 65.00-65.00
Add: close > 65.00
Cut: close < 60.00
Best for: transition regime
Raw Text Summary
📌 AXTI @ 64.18 (2026-04-12 08:47 AM MYT)

• Current price is **64.18**. Key support is around **60.00**, and resistance is around **65.00**.
• For the next week, the model’s **68% expected range** is roughly **50.31 to 78.05**.
• A wider **90% range** is about **41.37 to 86.99**.
• Dealer positioning looks **LONG gamma**, so the market behavior is classified as **TRANSITION**.
• The estimated **gamma flip** is near **48.80**. Crossing and holding beyond this area can change the trading behavior.
• Approximate breakout odds: **above resistance 46.8%**, **below support 31.3%** by the target horizon.
• Options skew is tilted toward **calls**, which suggests upside speculation is relatively stronger.
• Near-term implied volatility is higher than the next expiry (**IV1 157.65% vs IV2 145.65%**), which suggests **near-term event stress / backwardation**.
• On the daily chart, the stock currently looks like **UP trend (expanding)**.
• The implied distribution is **fairly balanced** between upside and downside tails.
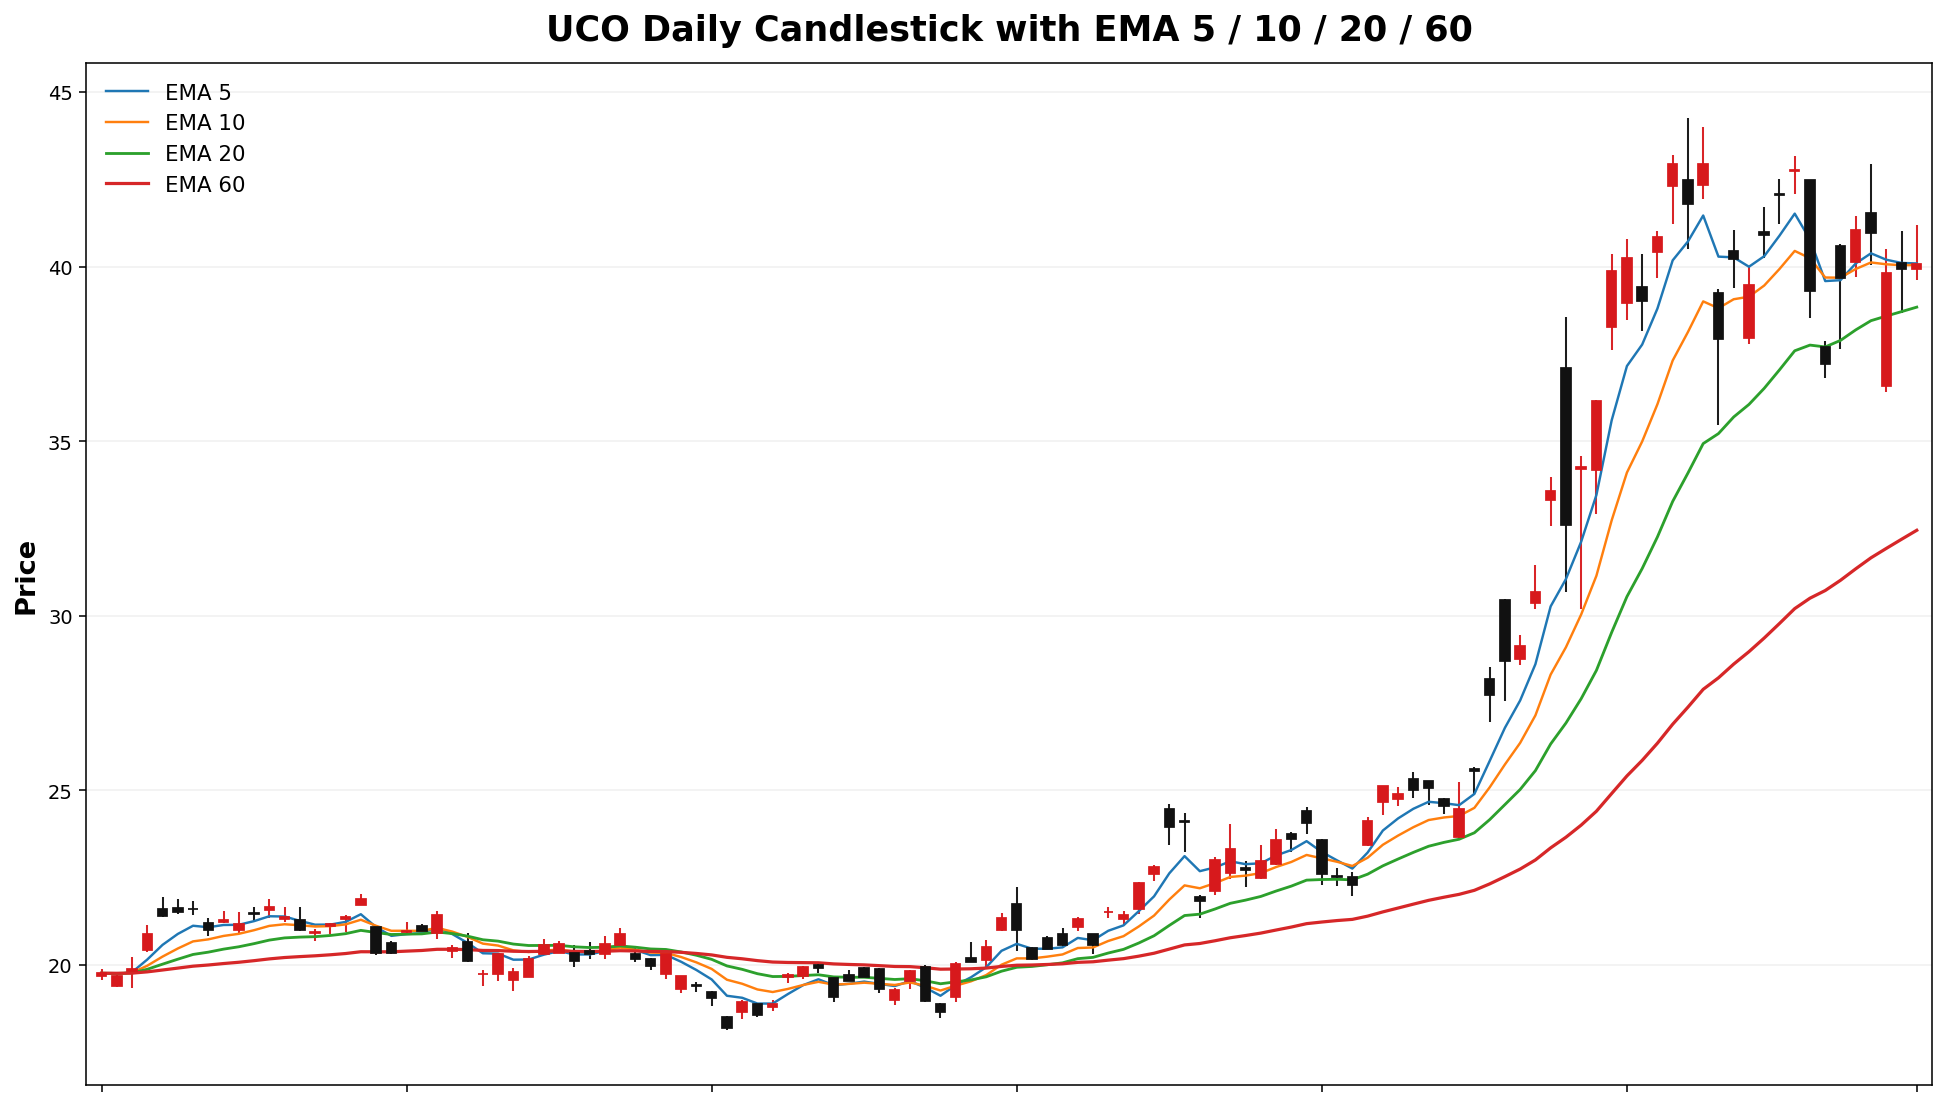
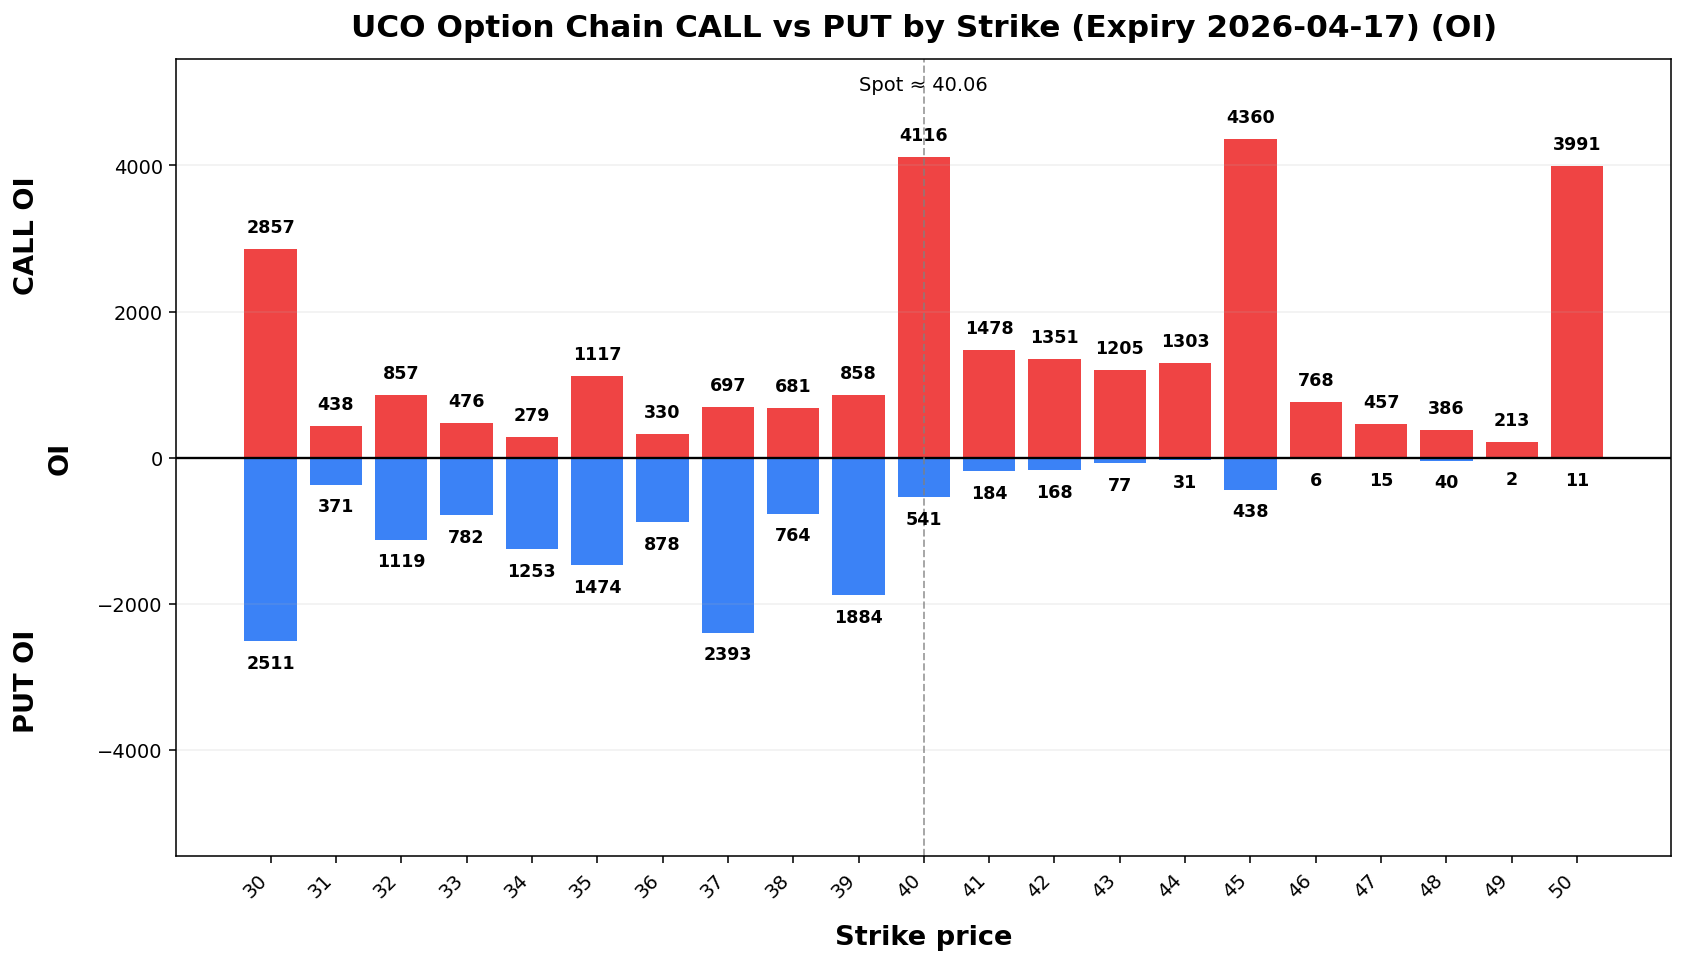
UCO
Spot: 40.06
Report Time: 2026-04-12 08:47 AM MYT
Regime: PIN
Dealer Gamma: LONG
Term Structure
Expiry |
DTE |
Forward |
ATM IV |
ATM Straddle |
|---|
2026-04-17 |
6 |
40.04 |
88.15% |
4.45 |
2026-05-15 |
34 |
39.93 |
75.49% |
9.20 |
Weekly Range
Confidence |
Low |
High |
Width |
|---|
68% |
35.25 |
44.87 |
9.62 |
80% |
33.89 |
46.23 |
12.33 |
90% |
32.15 |
47.97 |
15.83 |
95% |
30.63 |
49.49 |
18.86 |
Structure & Probabilities
Support |
Resistance |
Gamma Flip |
Max Pain |
P>Res |
P<Sup |
|---|
40.00 |
45.00 |
34.52 |
33.00 |
13.9% |
37.8% |
Flow & Skew
Call Vol |
Put Vol |
Vol P/C |
Call OI |
Put OI |
OI P/C |
Skew |
Skew Bias |
|---|
2,882 |
1,215 |
0.42 |
39,957 |
26,891 |
0.67 |
-14.36 vol pts |
CALL_SKEW |
Tail Risk
Q10 |
Q50 |
Q90 |
Down Tail |
Up Tail |
Down/Up |
|---|
13.53 |
15.86 |
42.88 |
26.53 |
2.82 |
9.41 |
Daily Technicals
EMA20 |
EMA50 |
VWAP20 |
BB Lower |
BB Mid |
BB Upper |
BB Width |
Vol Ratio |
Path |
|---|
38.84 |
33.76 |
40.29 |
37.34 |
40.46 |
43.57 |
15.41% |
0.54 |
UP bias |
Day Plan
40.00-45.00 range: fade extremes
> 45.00: chase only if hold + vol
< 40.00: risk expand; reduce size
Regime: PIN
Tech: UP bias
Swing Plan
Accumulate: 40.00-40.00
Trim: 45.00-45.00
Add: close > 45.00
Cut: close < 40.00
Best for: pin regime
Raw Text Summary
📌 UCO @ 40.06 (2026-04-12 08:47 AM MYT)

• Current price is **40.06**. Key support is around **40.00**, and resistance is around **45.00**.
• For the next week, the model’s **68% expected range** is roughly **35.25 to 44.87**.
• A wider **90% range** is about **32.15 to 47.97**.
• Dealer positioning looks **LONG gamma**, so the market behavior is classified as **PIN**.
• The estimated **gamma flip** is near **34.52**. Crossing and holding beyond this area can change the trading behavior.
• Approximate breakout odds: **above resistance 13.9%**, **below support 37.8%** by the target horizon.
• Options skew is tilted toward **calls**, which suggests upside speculation is relatively stronger.
• Near-term implied volatility is higher than the next expiry (**IV1 88.15% vs IV2 75.49%**), which suggests **near-term event stress / backwardation**.
• Recent volume is only **0.54x** the 20-day average, so breakouts may be less reliable unless volume improves.
• On the daily chart, the stock currently looks like **UP bias**.
• The implied distribution shows **heavier downside tail risk** than upside tail potential.
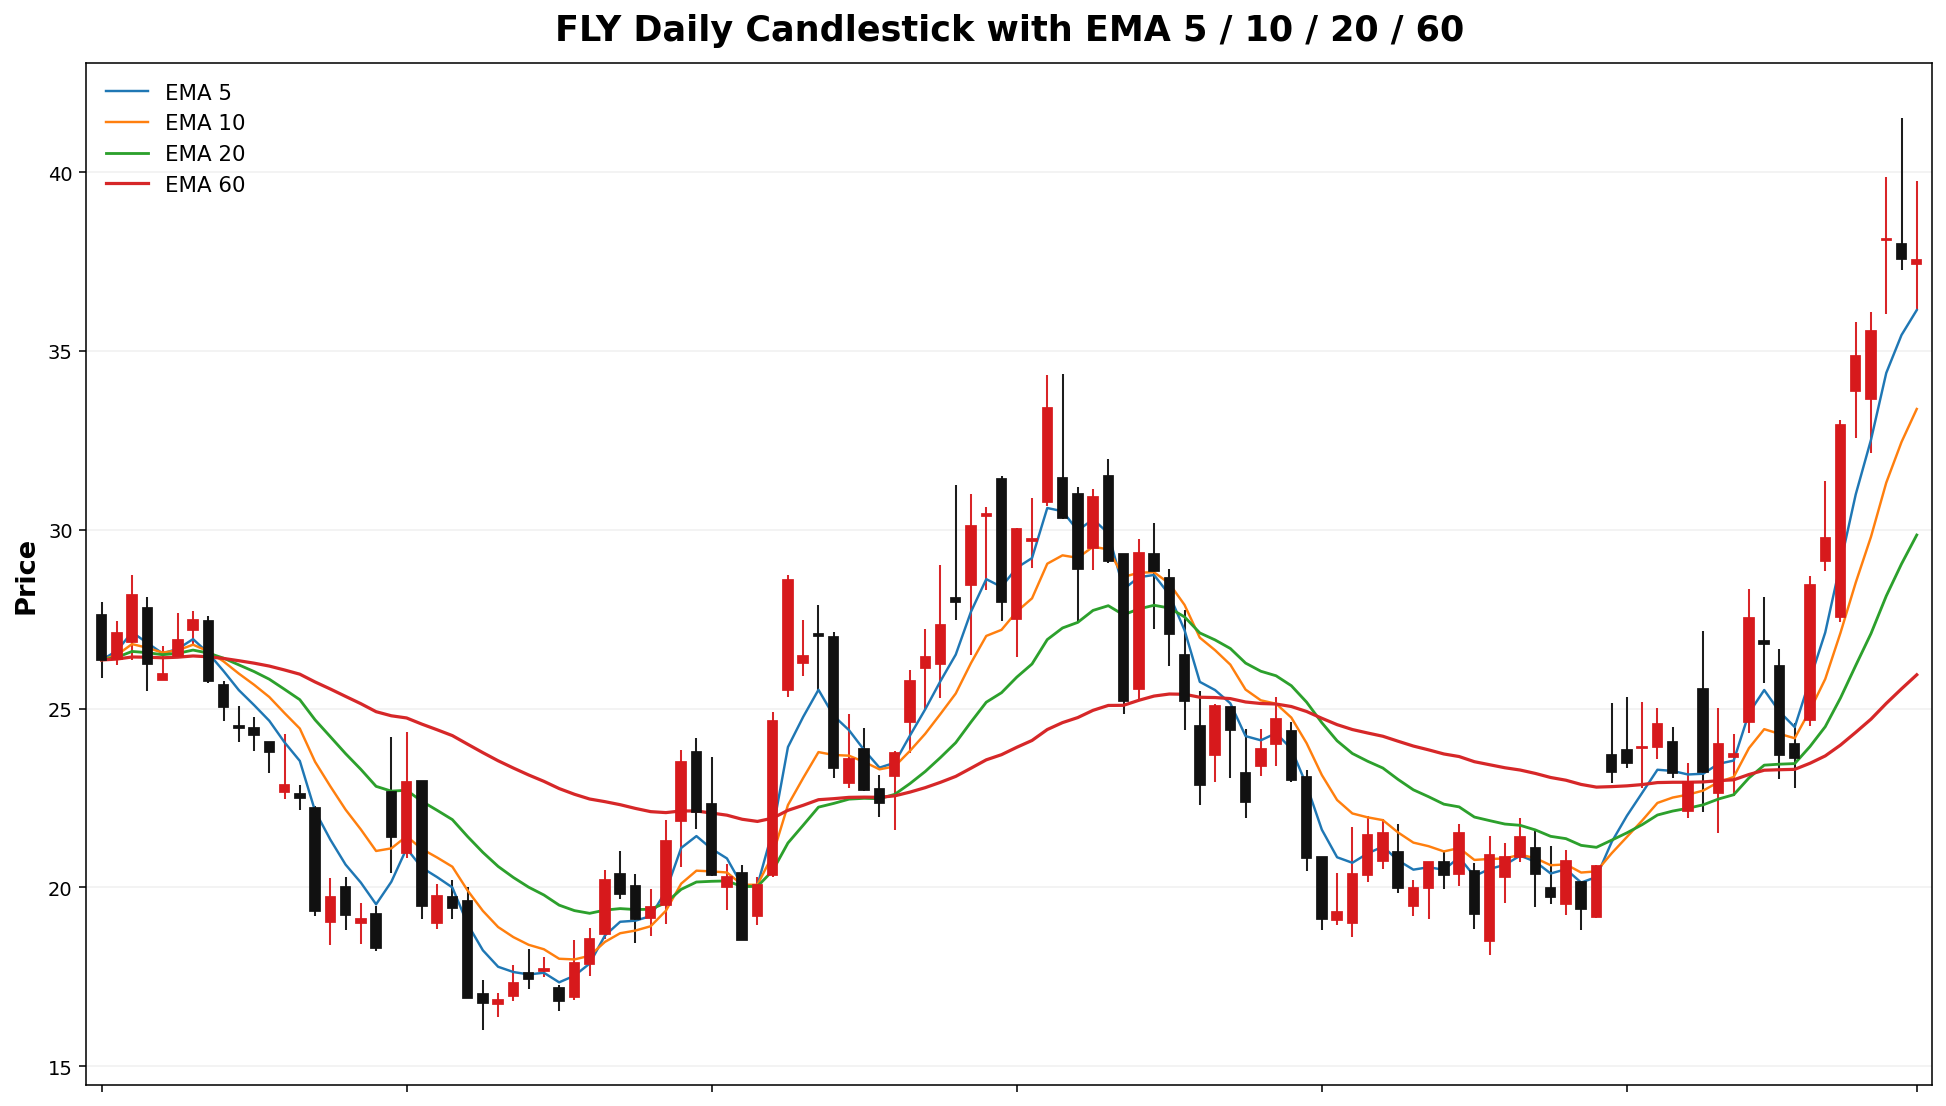
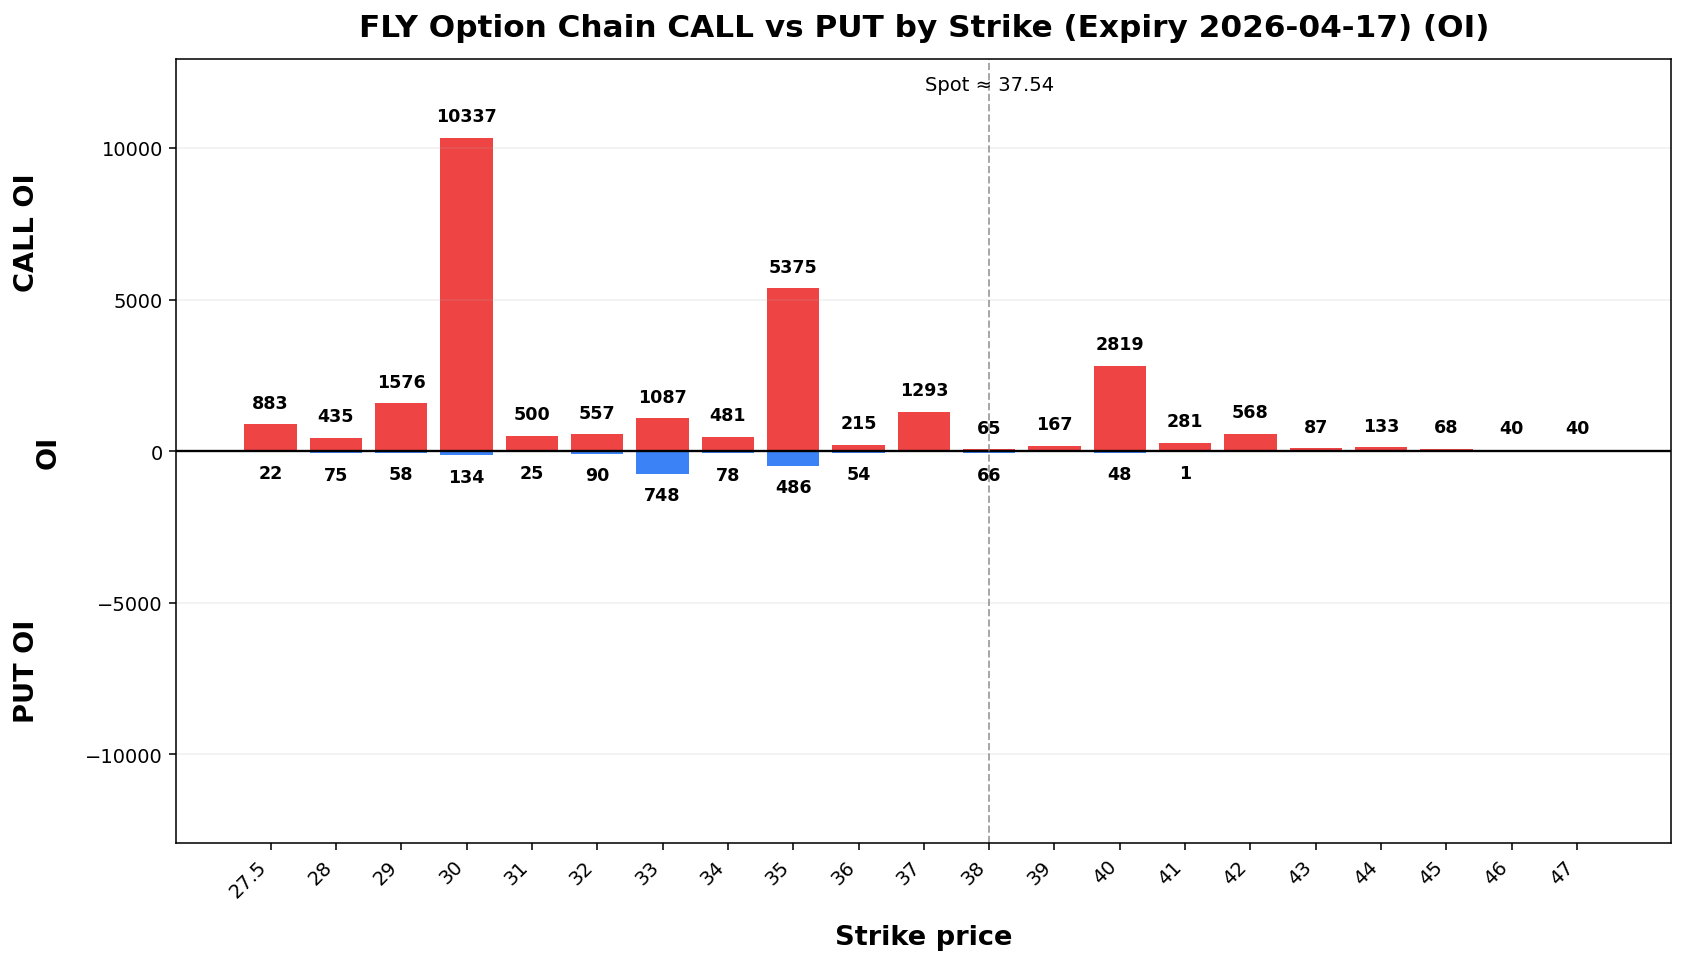
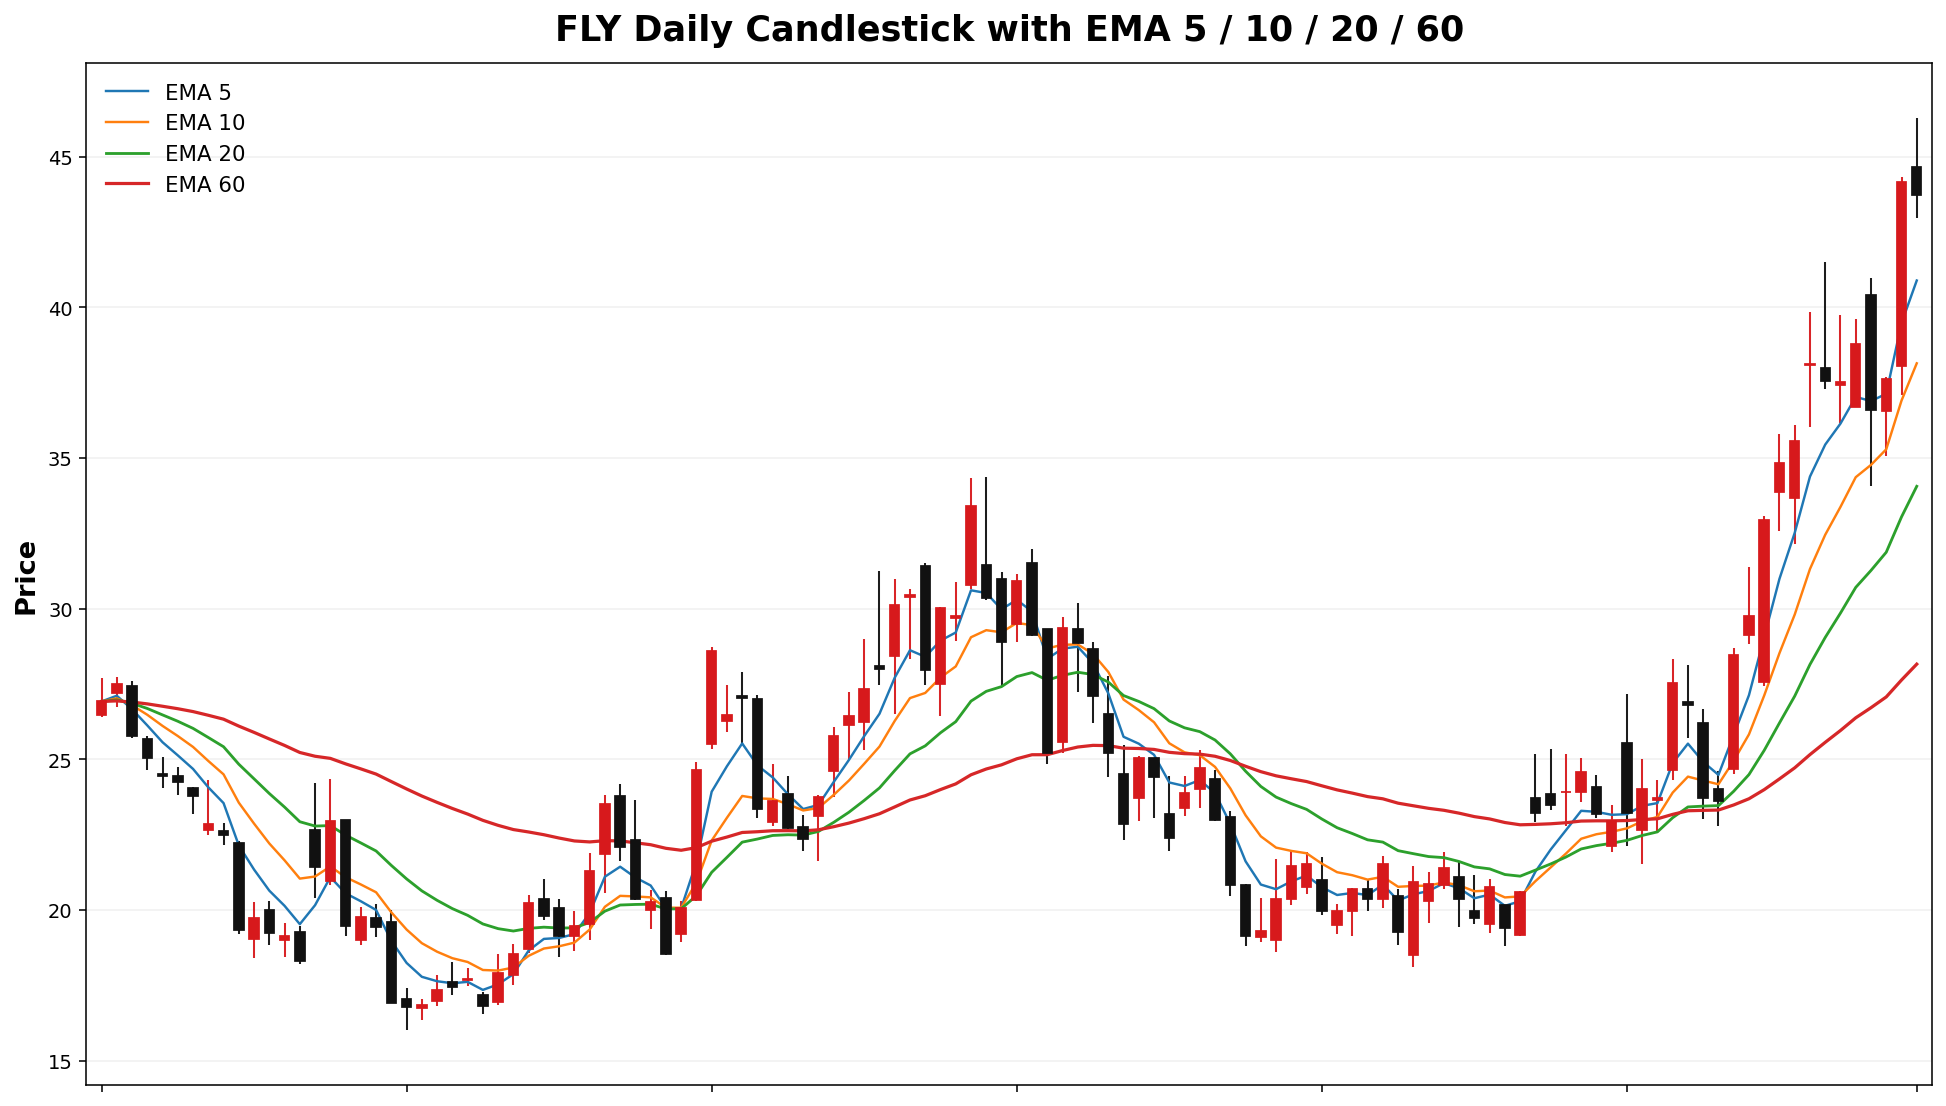
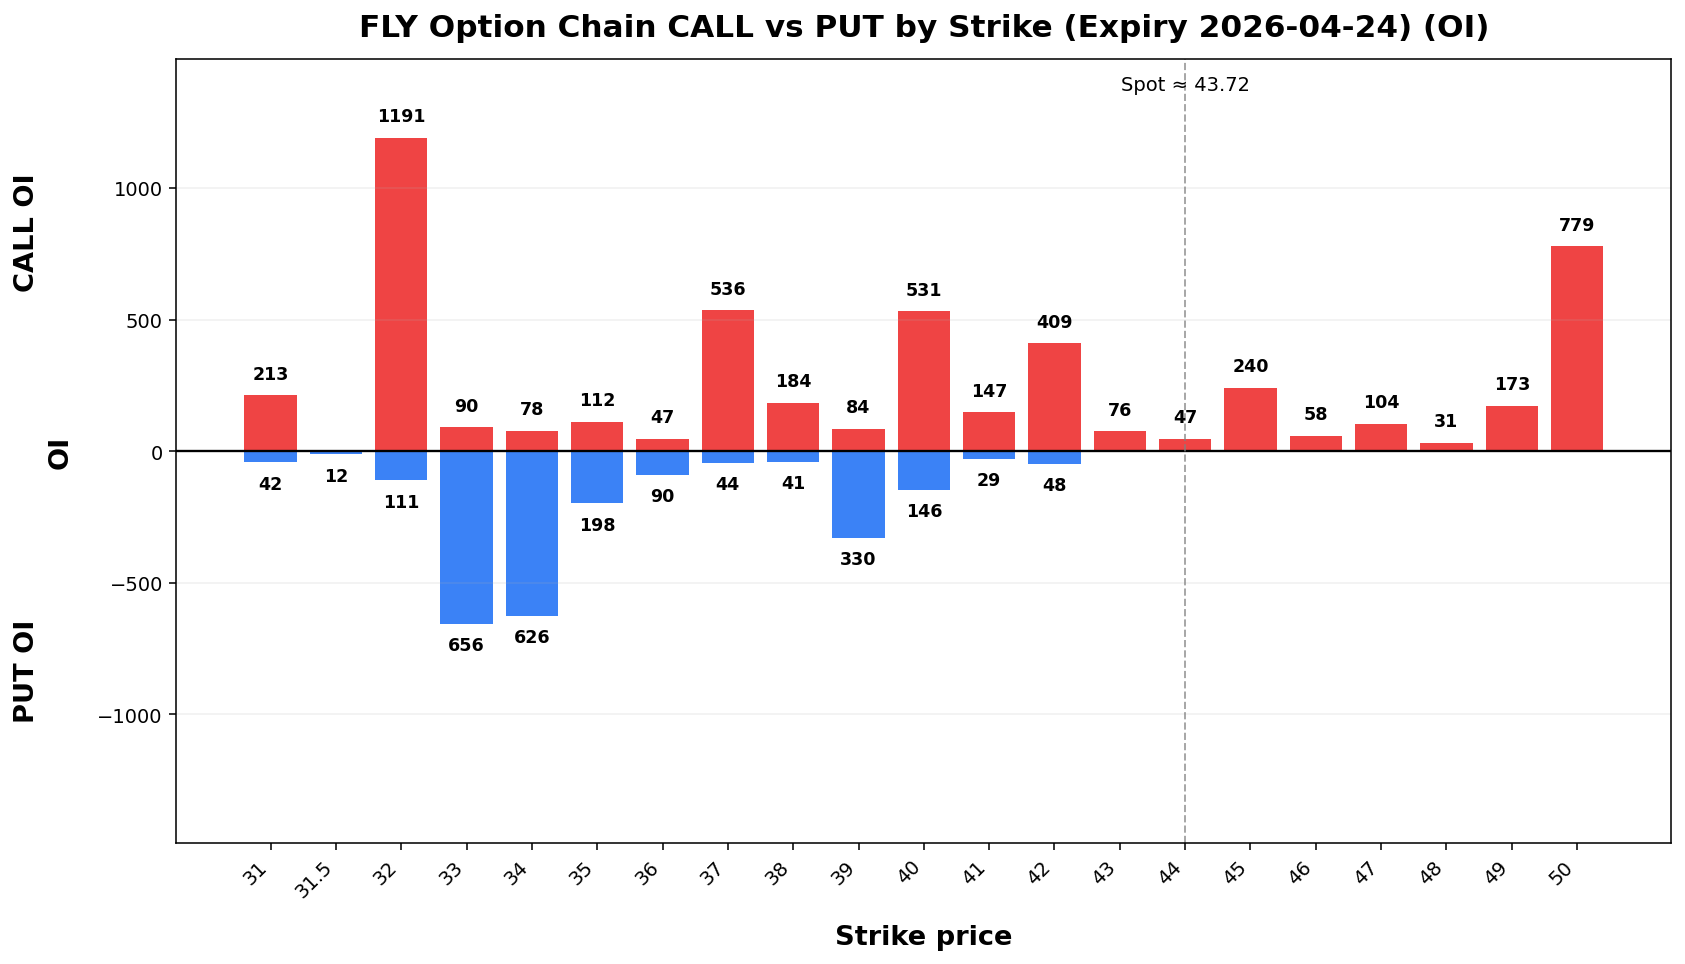
FLY
Spot: 37.54
Report Time: 2026-04-12 08:47 AM MYT
Regime: TREND
Dealer Gamma: SHORT
Term Structure
Expiry |
DTE |
Forward |
ATM IV |
ATM Straddle |
|---|
2026-04-17 |
6 |
37.64 |
89.31% |
4.22 |
2026-04-24 |
13 |
37.68 |
86.80% |
6.10 |
Weekly Range
Confidence |
Low |
High |
Width |
|---|
68% |
32.87 |
42.21 |
9.35 |
80% |
31.55 |
43.53 |
11.98 |
90% |
29.85 |
45.23 |
15.38 |
95% |
28.38 |
46.70 |
18.32 |
Structure & Probabilities
Support |
Resistance |
Gamma Flip |
Max Pain |
P>Res |
P<Sup |
|---|
37.00 |
40.00 |
NA |
25.00 |
36.1% |
54.8% |
Flow & Skew
Call Vol |
Put Vol |
Vol P/C |
Call OI |
Put OI |
OI P/C |
Skew |
Skew Bias |
|---|
2,625 |
1,083 |
0.41 |
32,631 |
8,435 |
0.26 |
0.88 vol pts |
FLAT |
Tail Risk
Q10 |
Q50 |
Q90 |
Down Tail |
Up Tail |
Down/Up |
|---|
22.22 |
36.82 |
43.41 |
15.32 |
5.87 |
2.61 |
Daily Technicals
EMA20 |
EMA50 |
VWAP20 |
BB Lower |
BB Mid |
BB Upper |
BB Width |
Vol Ratio |
Path |
|---|
29.85 |
26.48 |
29.25 |
16.96 |
28.28 |
39.60 |
80.08% |
0.89 |
UP trend (expanding) |
Day Plan
37.00-40.00 range: fade extremes
> 40.00: chase only if hold + vol
< 37.00: risk expand; reduce size
Regime: TREND
Tech: UP trend (expanding)
Swing Plan
Accumulate: 37.00-37.00
Trim: 40.00-40.00
Add: close > 40.00
Cut: close < 37.00
Best for: trend regime
Raw Text Summary
📌 FLY @ 37.54 (2026-04-12 08:47 AM MYT)

• Current price is **37.54**. Key support is around **37.00**, and resistance is around **40.00**.
• For the next week, the model’s **68% expected range** is roughly **32.87 to 42.21**.
• A wider **90% range** is about **29.85 to 45.23**.
• Dealer positioning looks **SHORT gamma**, so the market behavior is classified as **TREND**.
• Approximate breakout odds: **above resistance 36.1%**, **below support 54.8%** by the target horizon.
• Options skew is fairly balanced, so there is **no strong directional bias** from skew alone.
• Near-term implied volatility is higher than the next expiry (**IV1 89.31% vs IV2 86.80%**), which suggests **near-term event stress / backwardation**.
• On the daily chart, the stock currently looks like **UP trend (expanding)**.
• The implied distribution shows **heavier downside tail risk** than upside tail potential.
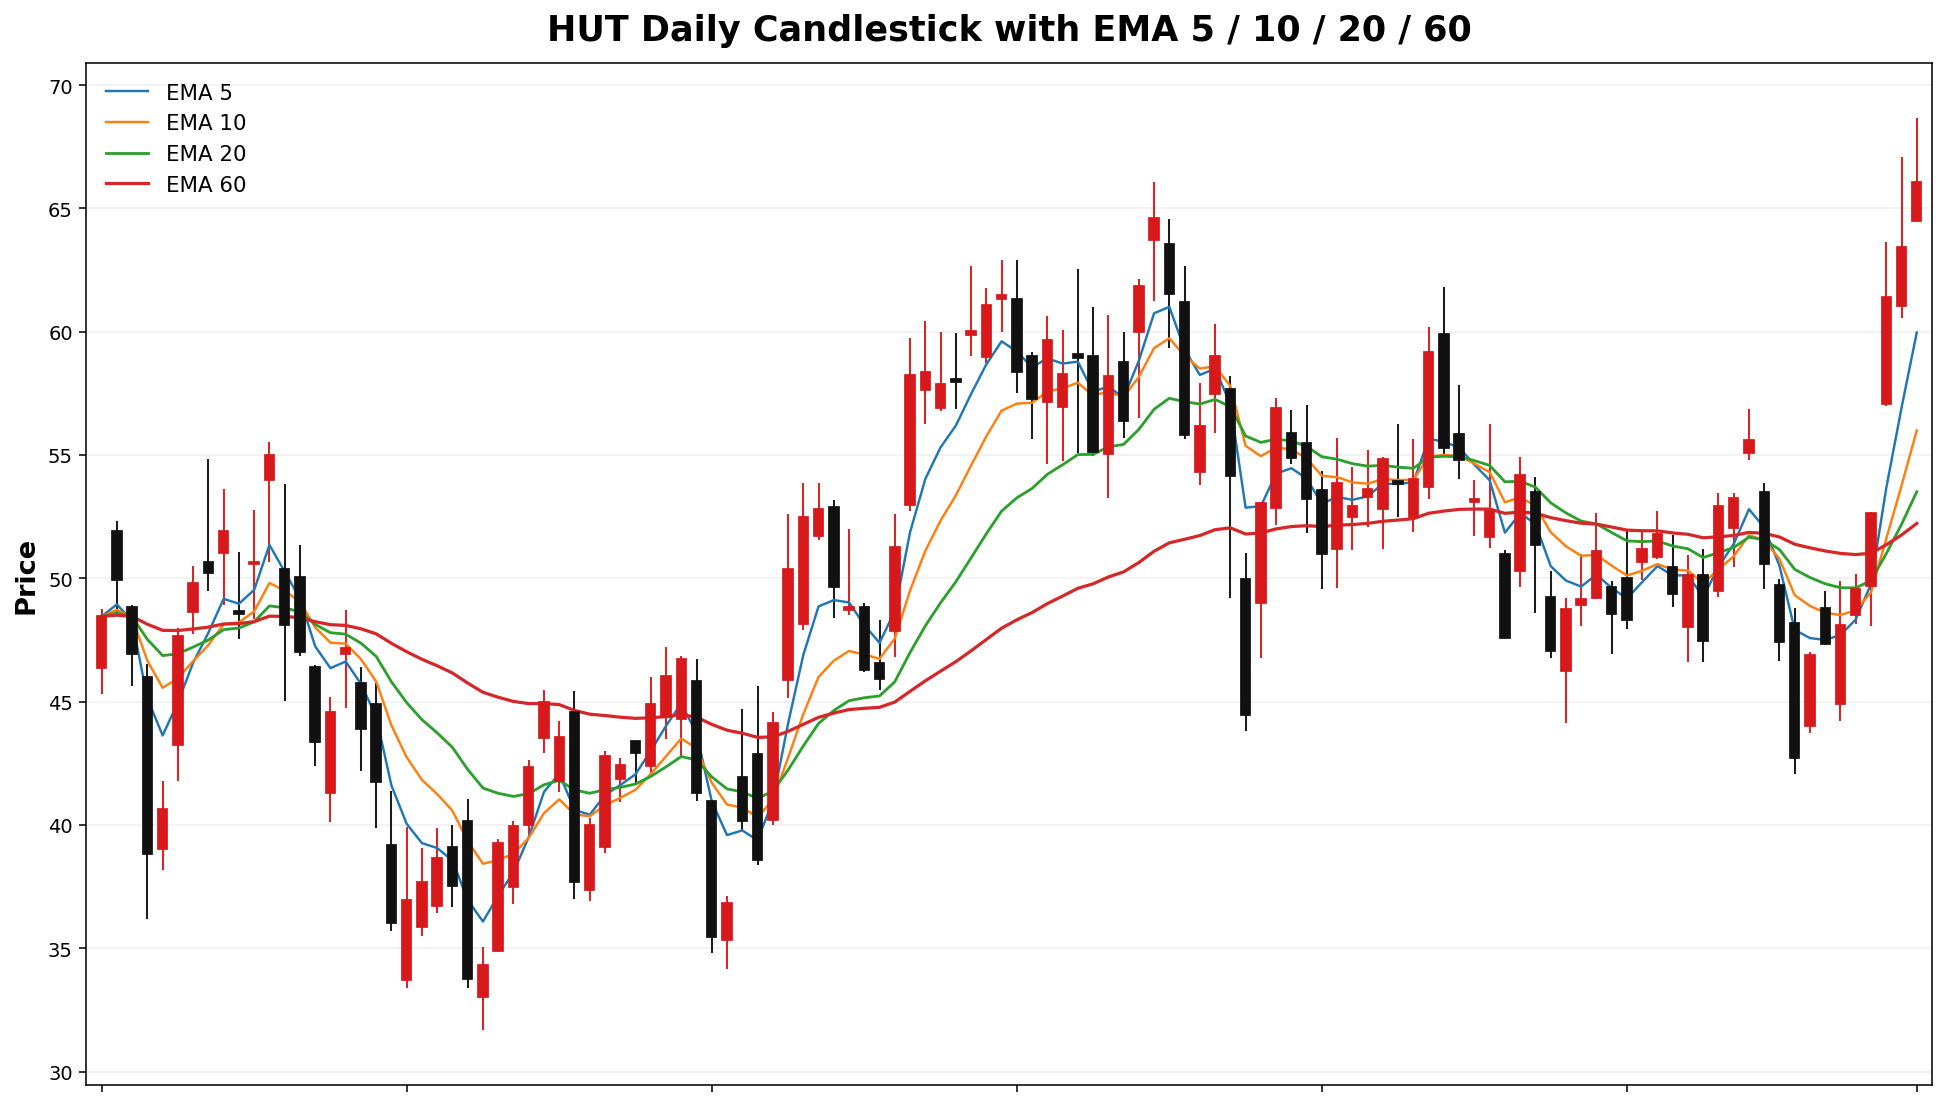
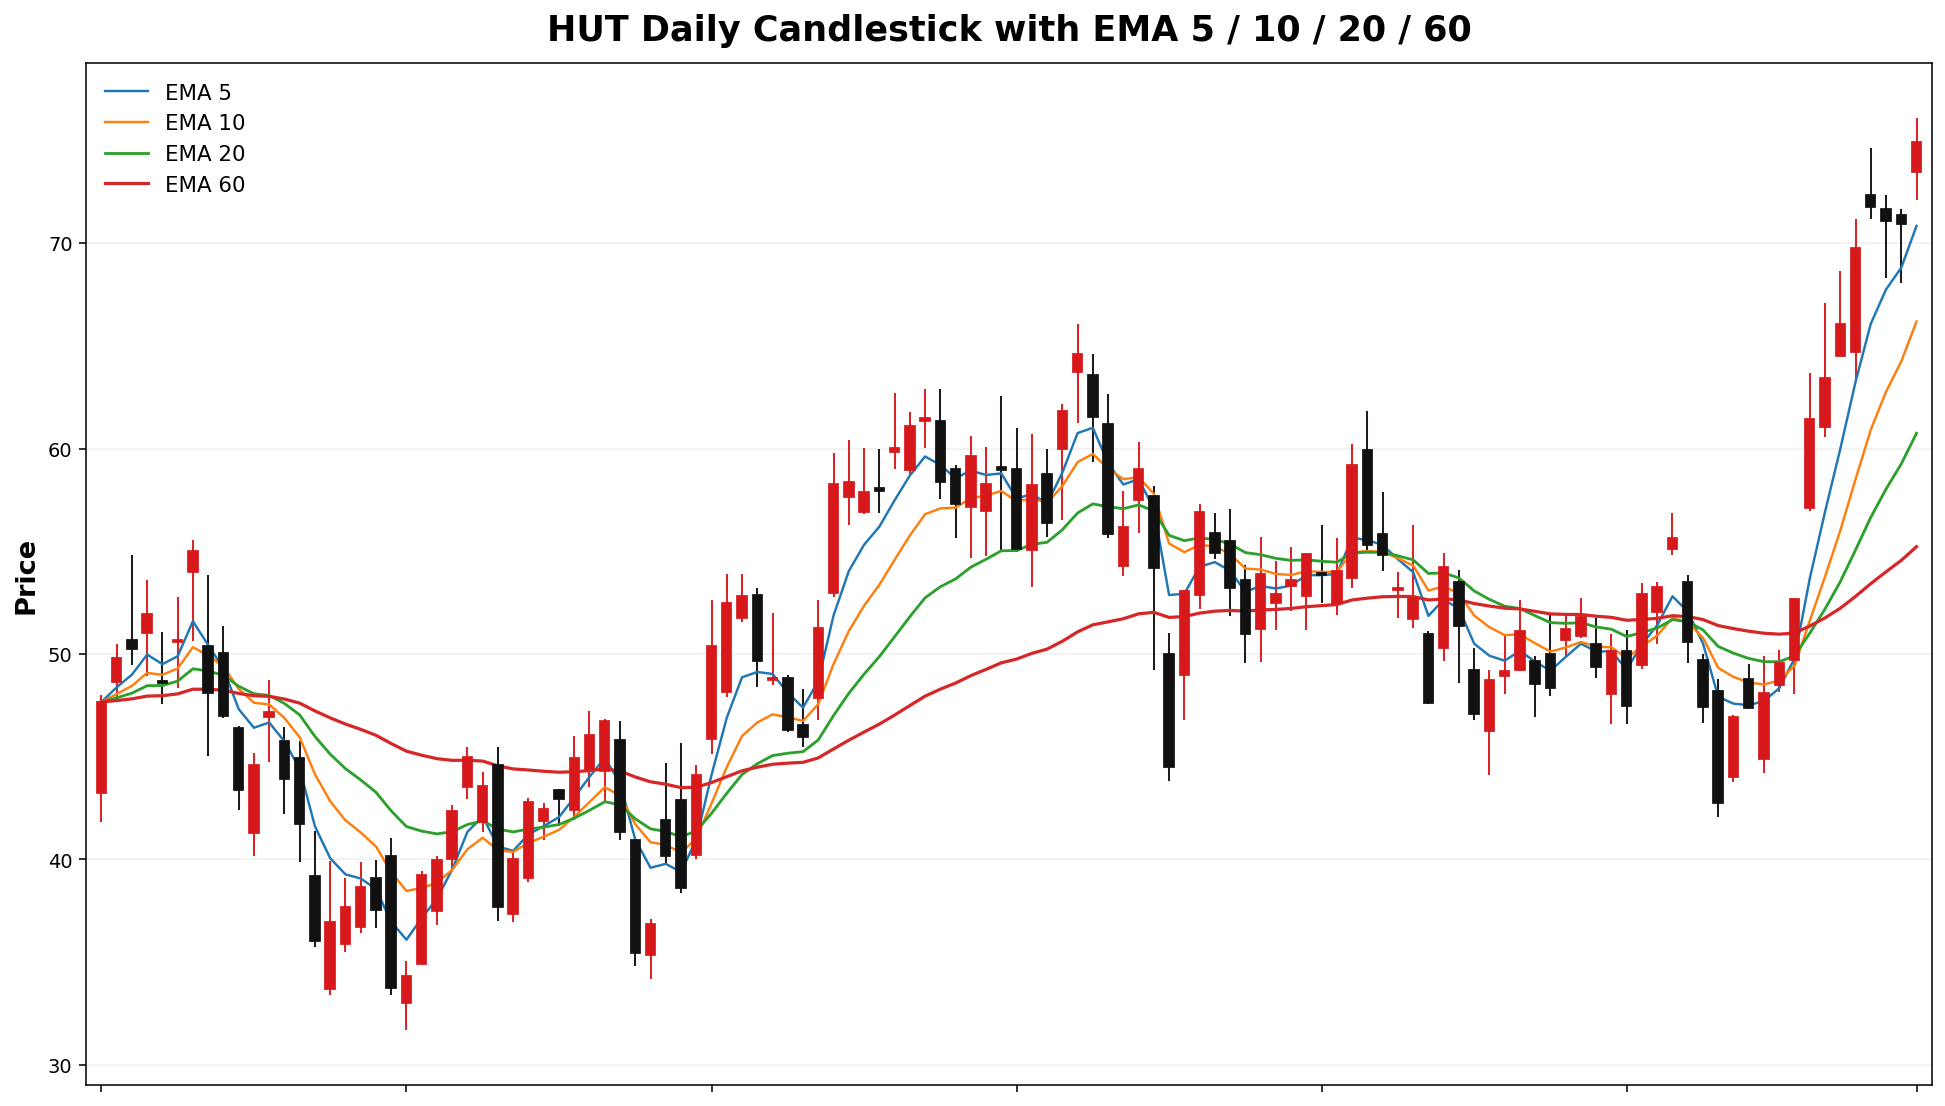
HUT
Spot: 66.08
Report Time: 2026-04-12 08:47 AM MYT
Regime: TRANSITION
Dealer Gamma: LONG
Term Structure
Expiry |
DTE |
Forward |
ATM IV |
ATM Straddle |
|---|
2026-04-17 |
6 |
65.48 |
84.84% |
7.06 |
2026-04-24 |
13 |
66.42 |
82.93% |
10.26 |
Weekly Range
Confidence |
Low |
High |
Width |
|---|
68% |
58.25 |
73.92 |
15.67 |
80% |
56.05 |
76.12 |
20.08 |
90% |
53.20 |
78.97 |
25.77 |
95% |
50.73 |
81.44 |
30.70 |
Structure & Probabilities
Support |
Resistance |
Gamma Flip |
Max Pain |
P>Res |
P<Sup |
|---|
65.00 |
70.00 |
57.78 |
55.00 |
25.3% |
43.7% |
Flow & Skew
Call Vol |
Put Vol |
Vol P/C |
Call OI |
Put OI |
OI P/C |
Skew |
Skew Bias |
|---|
3,116 |
5,027 |
1.61 |
26,779 |
31,154 |
1.16 |
5.91 vol pts |
PUT_SKEW |
Tail Risk
Q10 |
Q50 |
Q90 |
Down Tail |
Up Tail |
Down/Up |
|---|
15.28 |
16.42 |
69.29 |
50.80 |
3.21 |
15.83 |
Daily Technicals
EMA20 |
EMA50 |
VWAP20 |
BB Lower |
BB Mid |
BB Upper |
BB Width |
Vol Ratio |
Path |
|---|
53.51 |
52.32 |
53.36 |
40.06 |
51.82 |
63.57 |
45.36% |
1.2409 |
UP trend (expanding) |
Day Plan
- 65.00-70.00 range: fade extremes
- > 70.00: chase only if hold + vol
- < 65.00: risk expand; reduce size
- Regime: TRANSITION
- Tech: UP trend (expanding)
Swing Plan
- Accumulate: 65.00-65.00
- Trim: 70.00-70.00
- Add: close > 70.00
- Cut: close < 65.00
- Best for: transition regime
Raw Text Summary
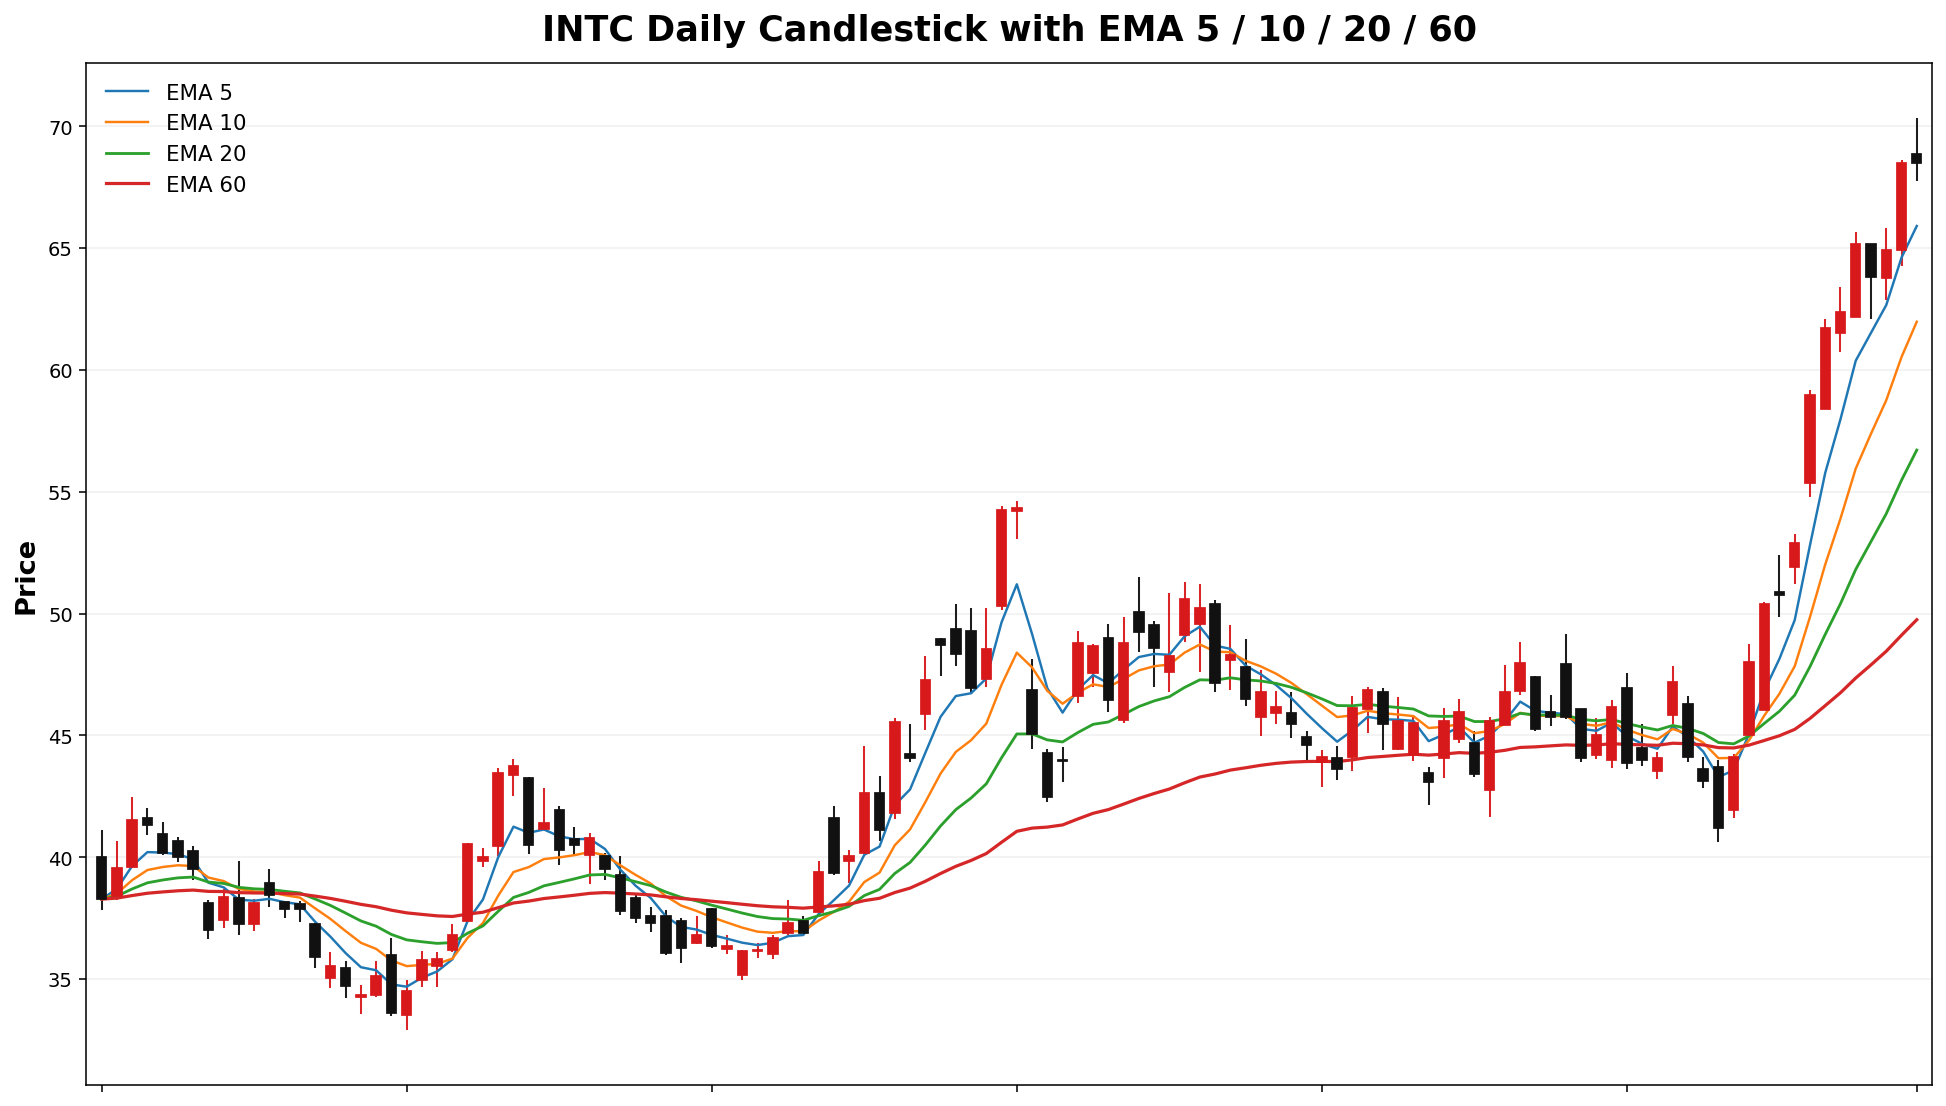
📌 HUTINTC @ 66.0868.50 (2026-04-1219 08:4713 AM MYT)

• Current price is **66.08*68.50**. Key support is around **65.00**, and resistance is around **70.00**.
• For the next week, the model’s **68% expected range** is roughly **58.2560.53 to 73.92*76.47**.
• A wider **90% range** is about **53.2055.40 to 78.97*81.60**.
• Dealer positioning looks **LONG gamma**, so the market behavior is classified as **TRANSITION**.
• The estimated **gamma flip** is near **57.78*59.58**. Crossing and holding beyond this area can change the trading behavior.
• Approximate breakout odds: **above resistance 25.3%41.8%**, **below support 43.7%27.1%** by the target horizon.
• Options skew is tilted toward **puts*calls**, which suggests tradersupside arespeculation payingis morerelatively for downside protection.stronger.
• Near-term implied volatility is higher than the next expiry (**IV1 84.84%88.44% vs IV2 82.93%70.90%**), which suggests **near-term event stress / backwardation**.
• On the daily chart, the stock currently looks like **UP trend (expanding)**.
• The implied distribution shows **heavier downside tail risk** than upside tail potential.
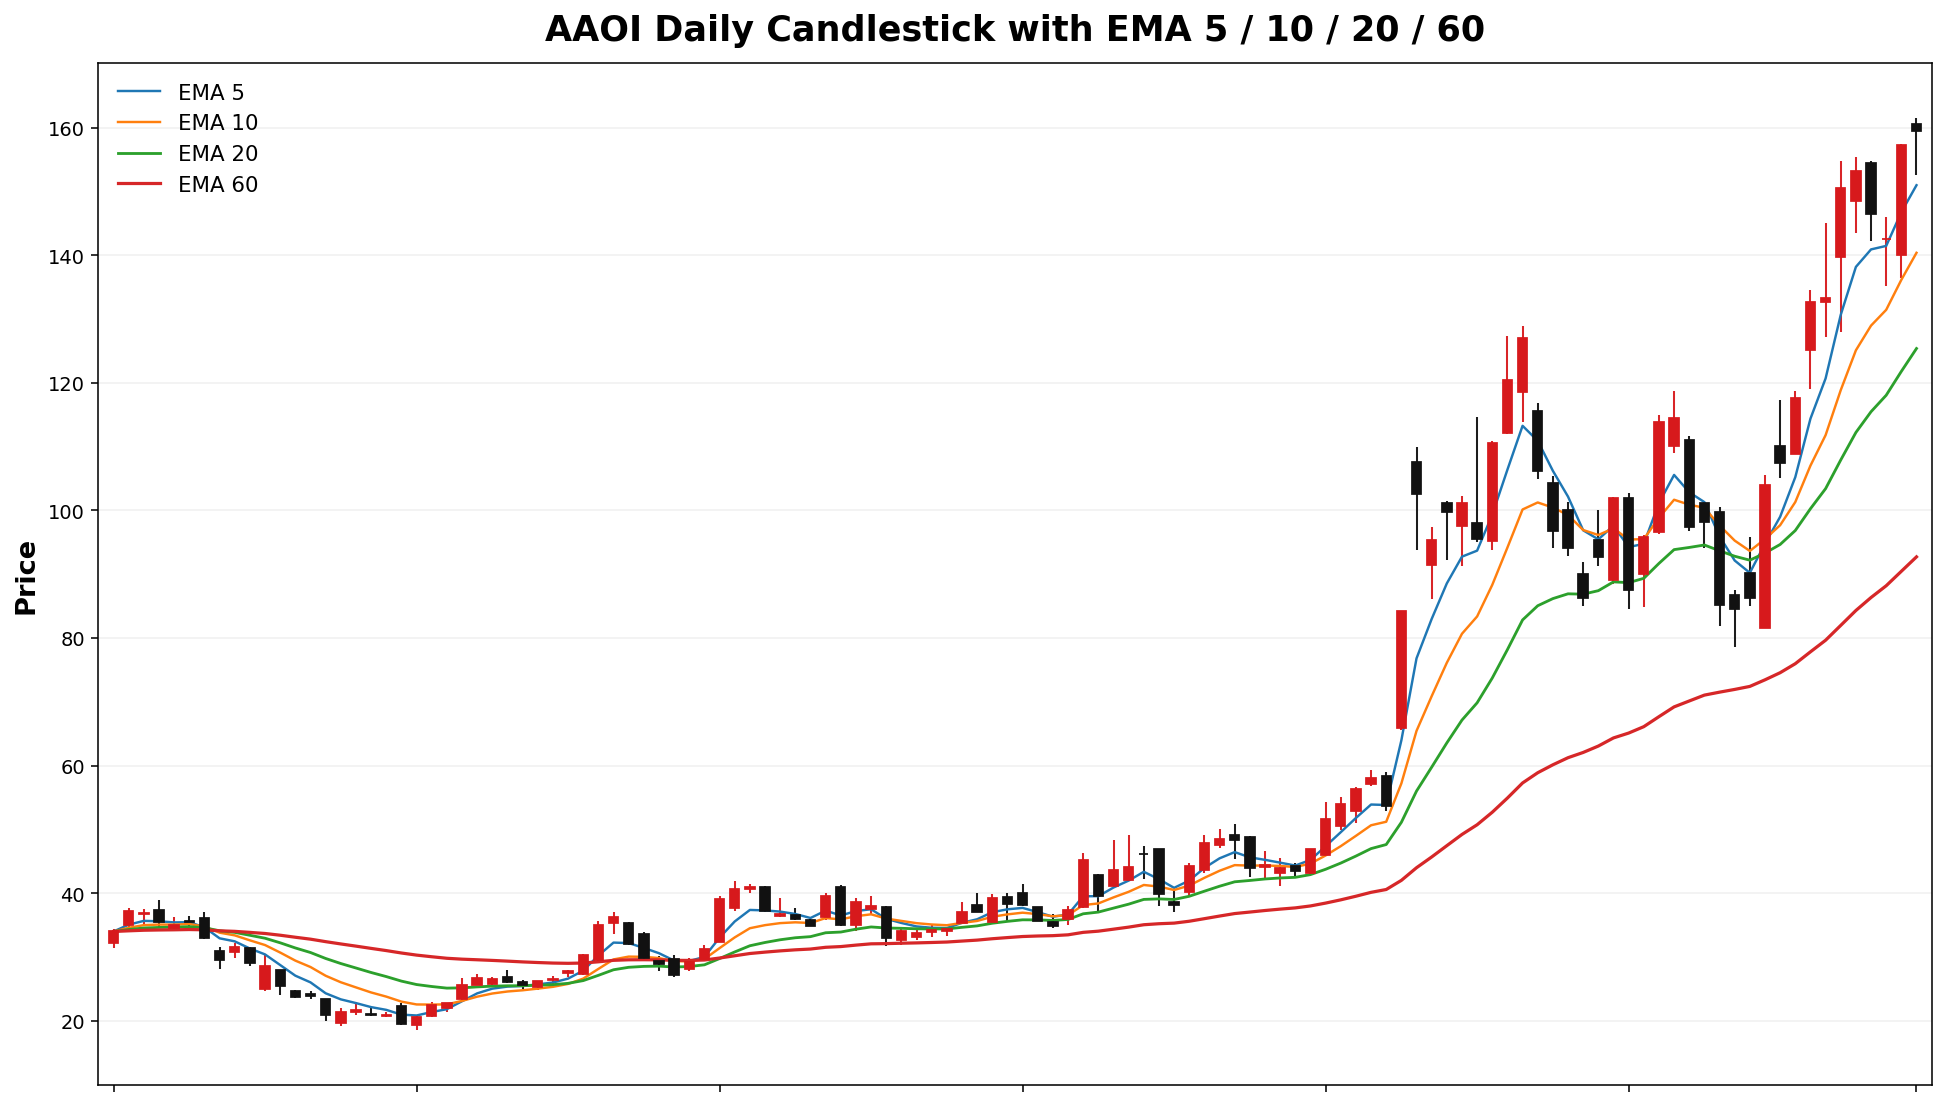
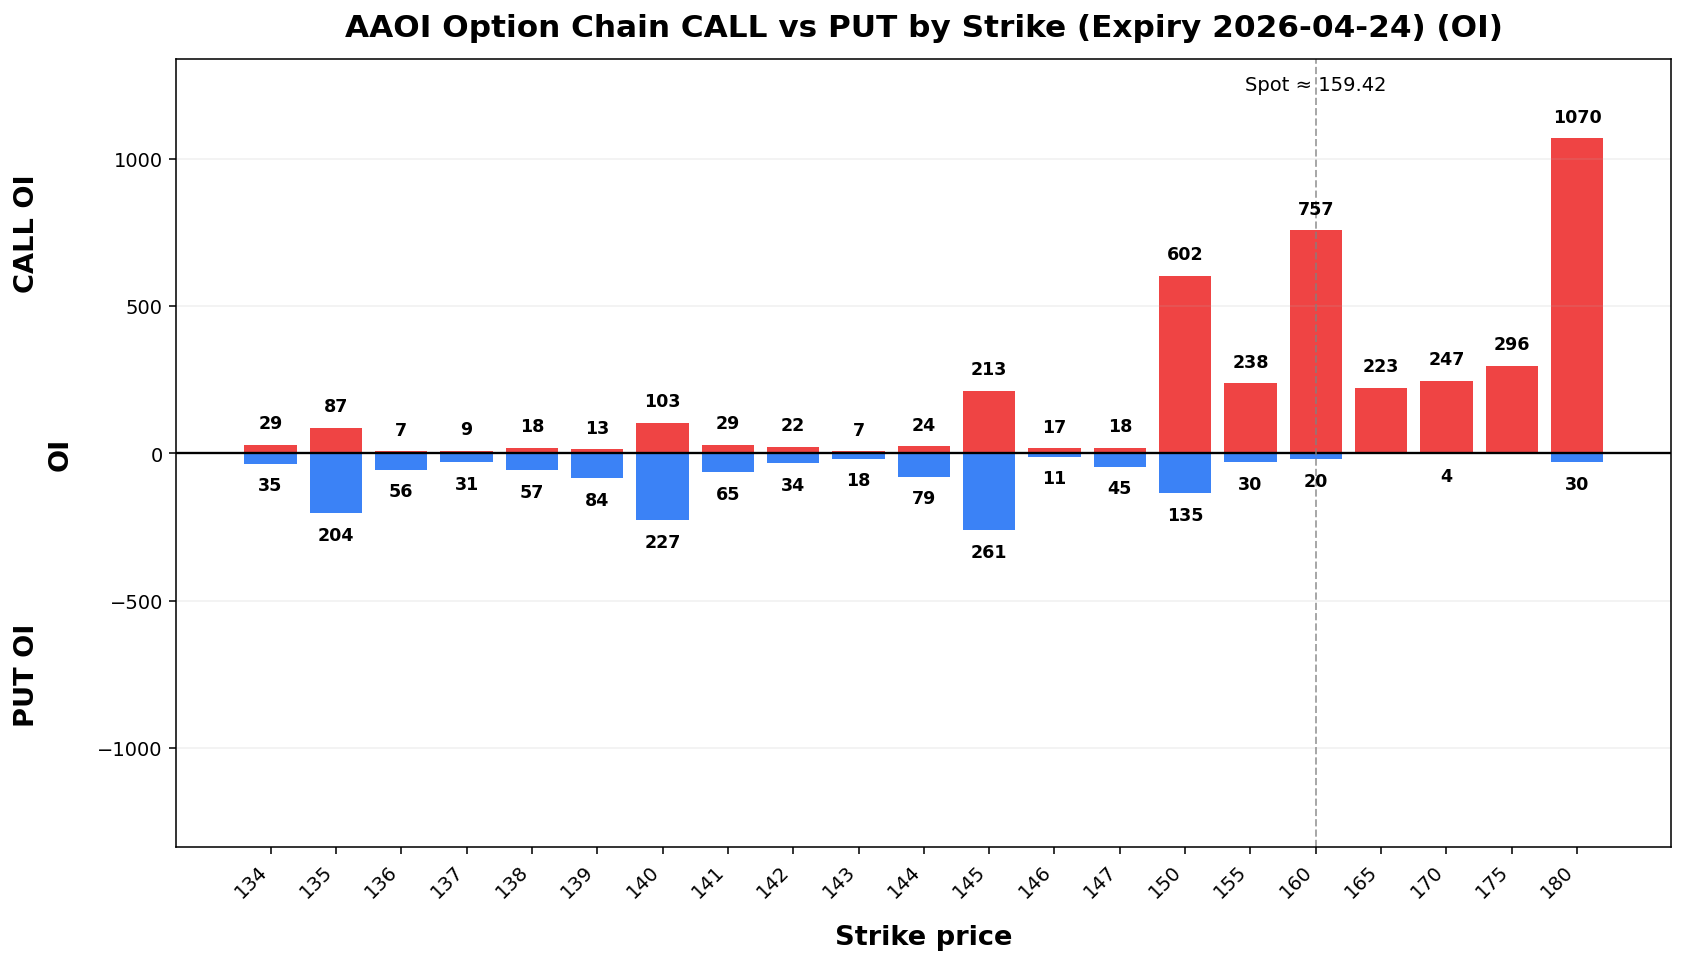
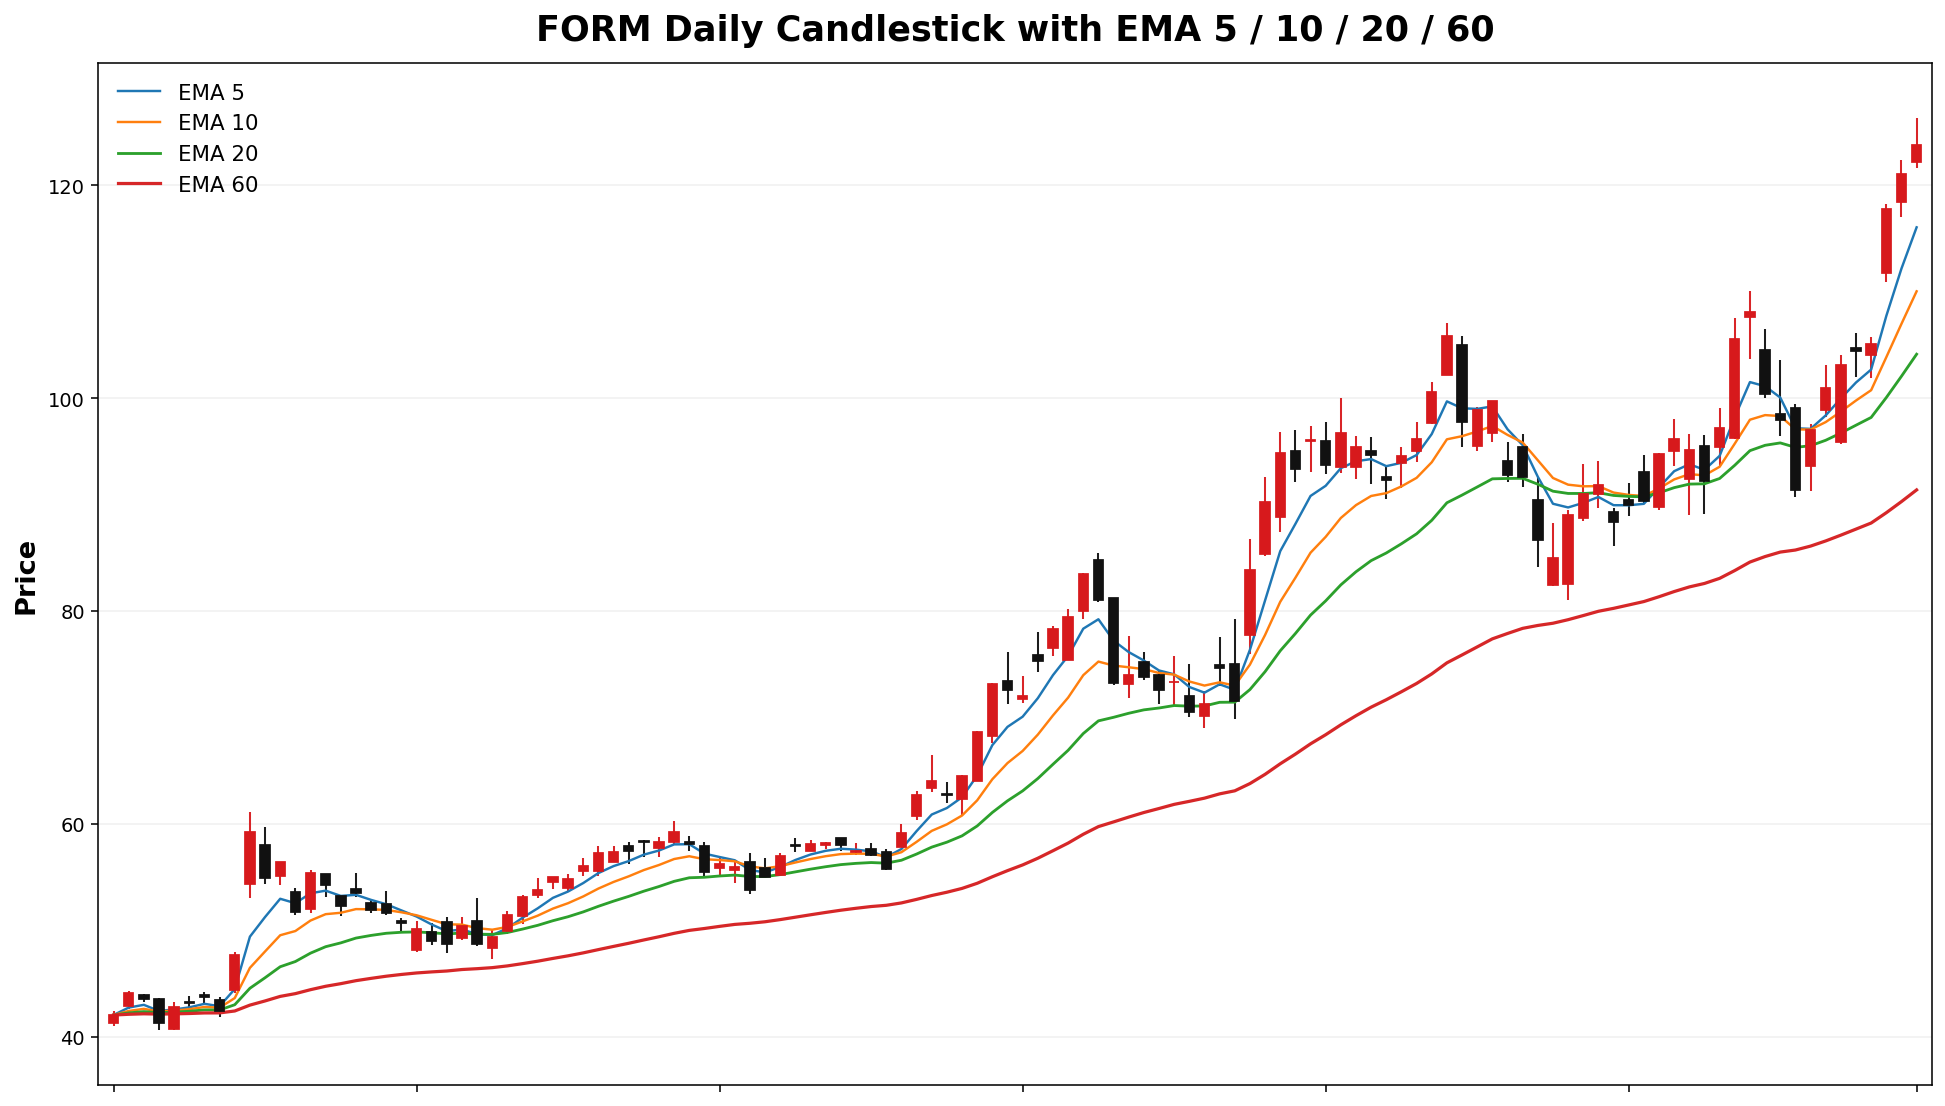
FORMDOCN
Spot: 123.8085.63
Report Time: 2026-04-1219 08:4813 AM MYT
Regime: TRANSITION
Dealer Gamma: LONG
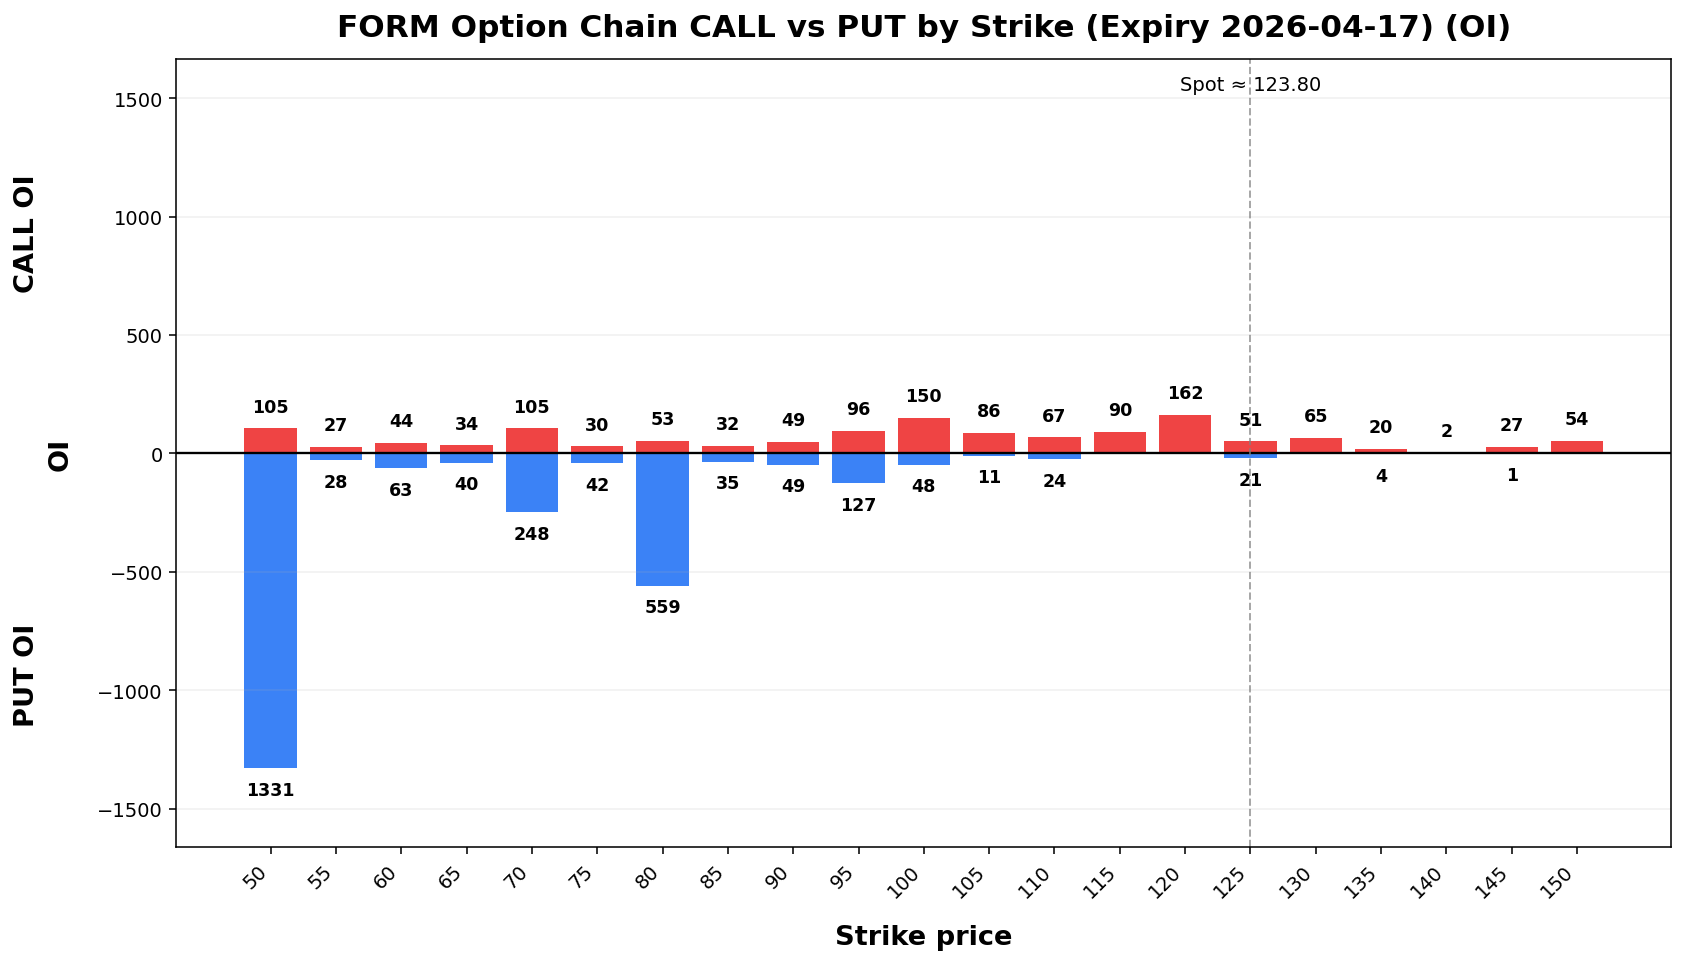
Term Structure
| Expiry |
DTE |
Forward |
ATM IV |
ATM Straddle |
2026-04-1724 |
6 |
120.1485.87 |
62.82%78.15% |
9.808.45 |
2026-05-1501 |
3413 |
123.9085.91 |
72.09%76.04% |
27.1512.20 |
Weekly Range
| Confidence |
Low |
High |
Width |
| 68% |
112.4376.29 |
135.1794.97 |
22.7318.67 |
| 80% |
109.2373.67 |
138.3797.59 |
29.1323.93 |
| 90% |
105.1170.27 |
142.49100.99 |
37.3930.71 |
| 95% |
101.5267.33 |
146.08103.93 |
44.5536.59 |
Structure & Probabilities
| Support |
Resistance |
Gamma Flip |
Max Pain |
P>Res |
P<Sup |
120.00 |
135.17 |
98.45 |
80.00 |
11.9%86.00 |
33.1%98.09 |
40.00 |
44.2% |
20.9% |
Flow & Skew
| Call Vol |
Put Vol |
Vol P/C |
Call OI |
Put OI |
OI P/C |
Skew |
Skew Bias |
9,1192,449 |
1338,510 |
0.3.47 |
1,825 |
9,151 |
5.01 |
1,589 |
2,916 |
1.84 |
13.82-2.88 vol pts |
PUT_SKEWCALL_SKEW |
Tail Risk
| Q10 |
Q50 |
Q90 |
Down Tail |
Up Tail |
Down/Up |
122.25 |
129.35 |
139.19 |
1.55 |
15.39 |
0.10 |
Daily Technicals
EMA20 |
EMA50 |
VWAP20 |
BB Lower |
BB Mid |
BB Upper |
BB Width |
Vol Ratio |
Path |
|---|
104.13 |
94.14 |
102.25 |
81.91 |
101.61 |
121.48.32 |
38.79%49.60 |
1.2593.90 |
UP trend (expanding) |
Day Plan
120.00-135.17 range: fade extremes
> 135.17: chase only if hold + vol
< 120.00: risk expand; reduce size
Regime: TRANSITION
Tech: UP trend (expanding)
Swing Plan
Accumulate: 120.00-120.00
Trim: 135.17-135.17
Add: close > 135.17
Cut: close < 120.00
Best for: transition regime
Raw Text Summary
📌 FORM @ 123.80 (2026-04-12 08:48 AM MYT)

• Current price is **123.80**. Key support is around **120.00**, and resistance is around **135.17**.
• For the next week, the model’s **68% expected range** is roughly **112.43 to 135.17**.
• A wider **90% range** is about **105.11 to 142.49**.
• Dealer positioning looks **LONG gamma**, so the market behavior is classified as **TRANSITION**.
• The estimated **gamma flip** is near **98.45**. Crossing and holding beyond this area can change the trading behavior.
• Approximate breakout odds: **above resistance 11.9%**, **below support 33.1%** by the target horizon.
• Options skew is tilted toward **puts**, which suggests traders are paying more for downside protection.
• Near-term implied volatility is lower than the next expiry (**IV1 62.82% vs IV2 72.09%**), which suggests a **contango / calmer front expiry** setup.
• On the daily chart, the stock currently looks like **UP trend (expanding)**.
• The implied distribution shows **more upside tail potential** than downside tail risk.
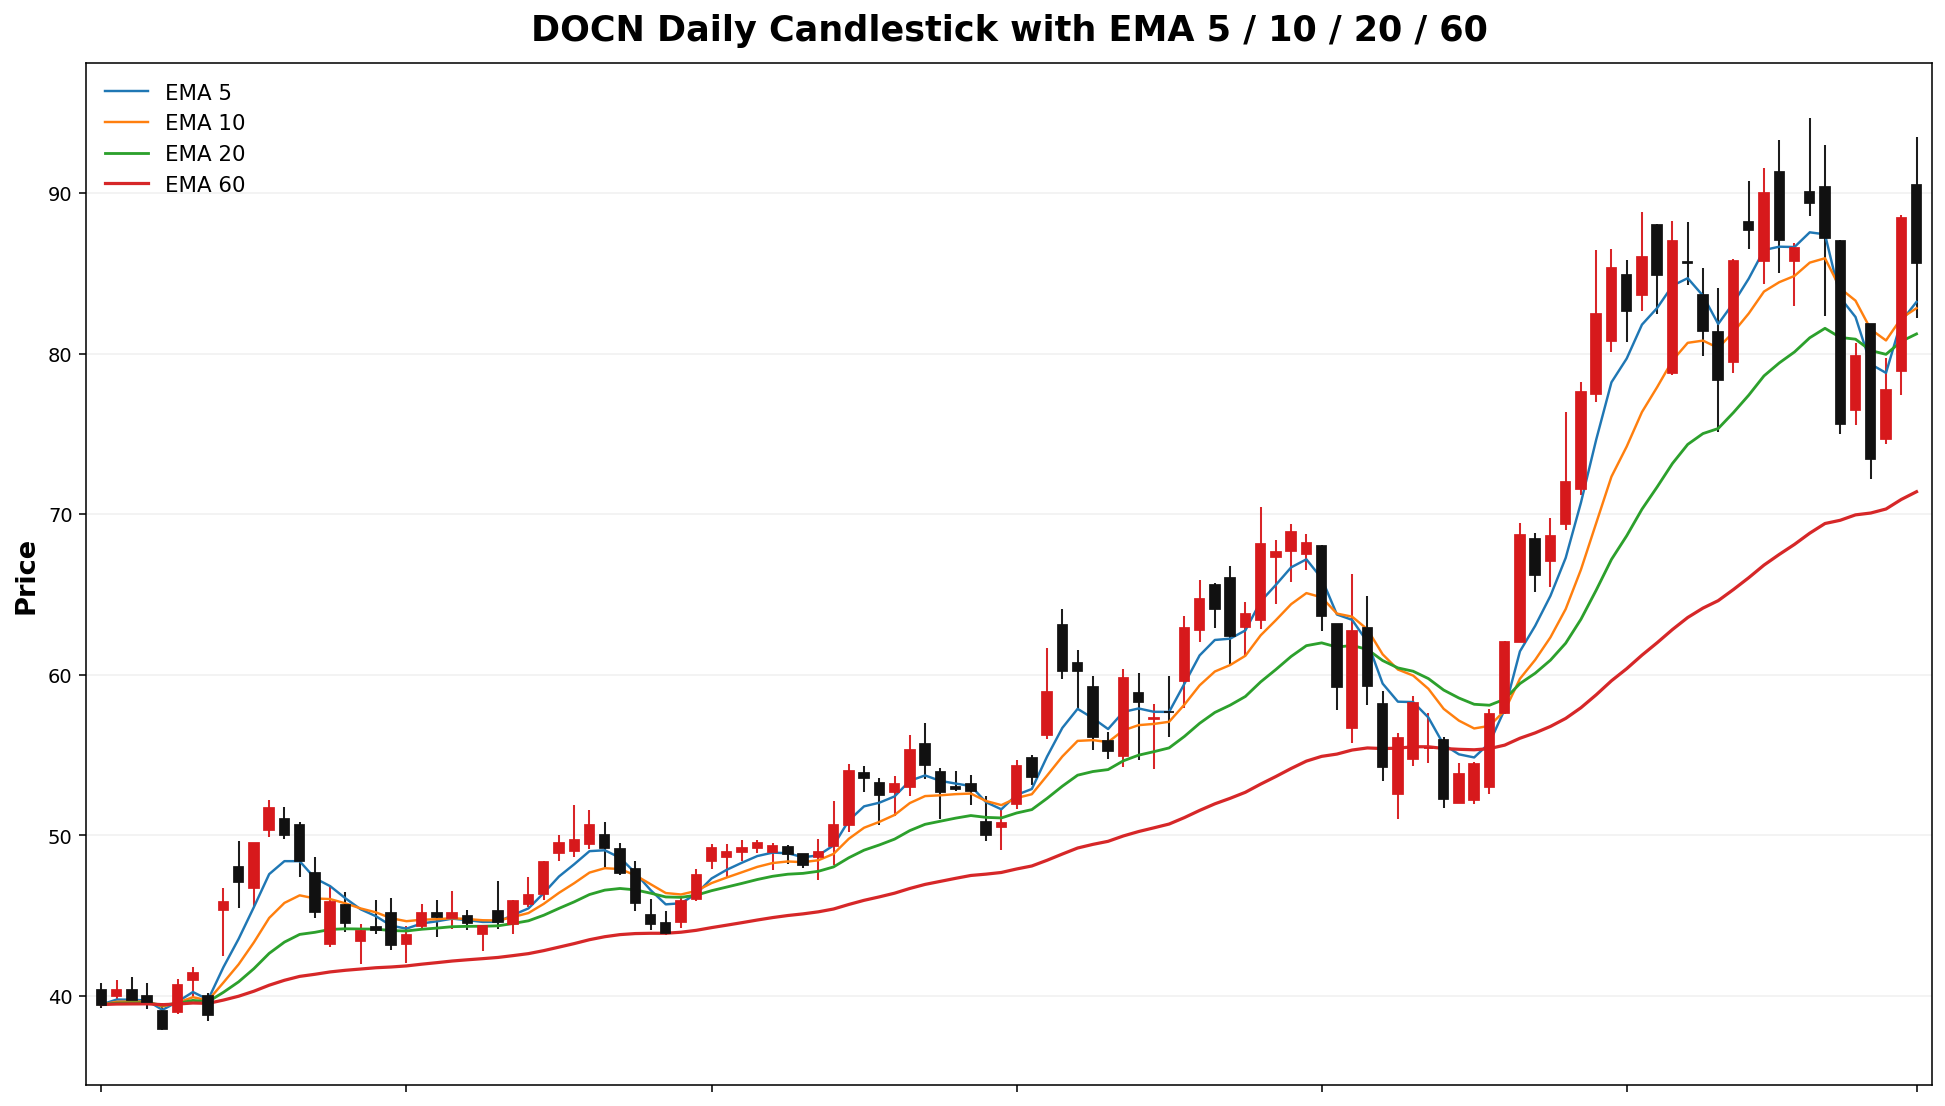
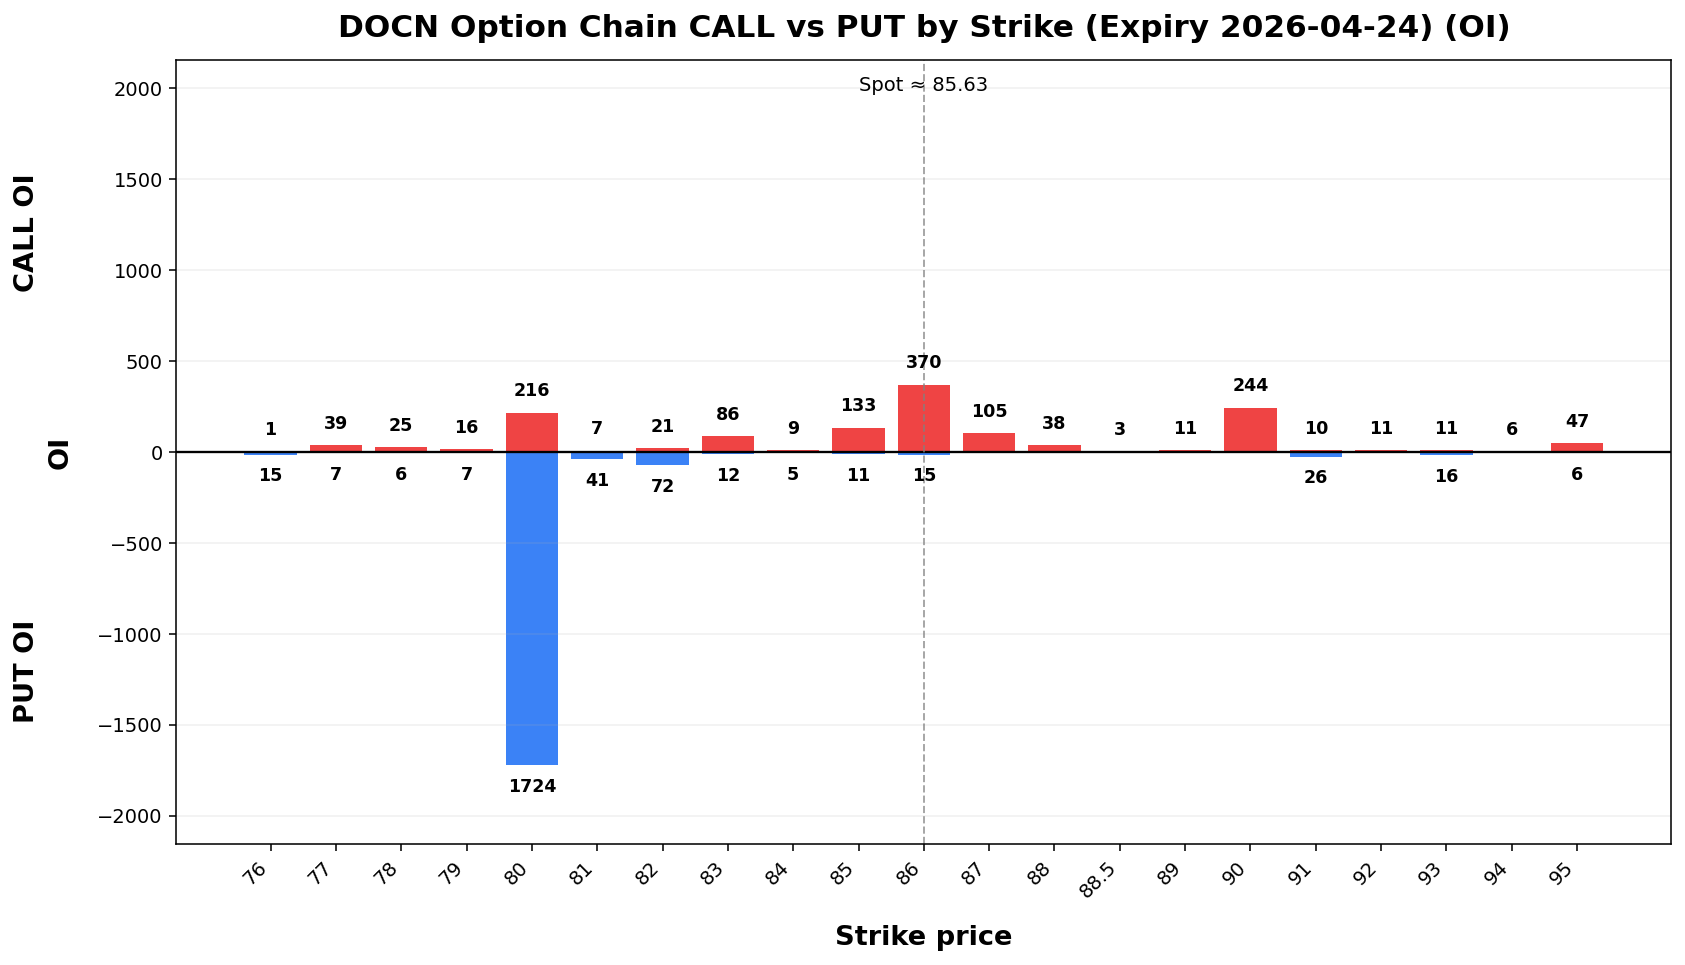
DOCN
Spot: 75.59
Report Time: 2026-04-12 08:48 AM MYT
Regime: TREND
Dealer Gamma: SHORT
Term Structure
Expiry |
DTE |
Forward |
ATM IV |
ATM Straddle |
|---|
2026-04-17 |
6 |
75.63 |
87.14%37.31 |
8.30 |
2026-04-24 |
13 |
75.84 |
77.74% |
11.00 |
Weekly Range
Confidence |
Low |
High |
Width |
|---|
68% |
66.66 |
84.52 |
17.85 |
80% |
64.15 |
87.03 |
22.88 |
90% |
60.91 |
90.27 |
29.36 |
95% |
58.10 |
93.08 |
34.99 |
Structure & Probabilities
Support |
Resistance |
Gamma Flip |
Max Pain |
P>Res |
P<Sup |
|---|
75.00 |
78.00 |
71.92 |
75.00 |
49.0% |
70.5% |
Flow & Skew
Call Vol |
Put Vol |
Vol P/C |
Call OI |
Put OI |
OI P/C |
Skew |
Skew Bias |
|---|
6,120 |
5,035 |
0.82 |
11,112 |
8,170 |
0.74 |
12.84 vol pts |
PUT_SKEW |
Tail Risk
Q10 |
Q50 |
Q90 |
Down Tail |
Up Tail |
Down/Up |
|---|
47.11 |
77.21 |
87.42 |
28.48 |
11.83 |
2.414.51 |
Daily Technicals
| EMA20 |
EMA50 |
VWAP20 |
BB Lower |
BB Mid |
BB Upper |
BB Width |
Vol Ratio |
Path |
81.0022 |
71.8373.53 |
83.7784.32 |
71.4274.54 |
83.0684.02 |
94.7093.49 |
28.03%22.55% |
1.810.76 |
UP trend (expanding) |
Day Plan
75.80.00-78.86.00 range: fade extremes- >
78.86.00: chase only if hold + vol
- <
75.80.00: risk expand; reduce size
- Regime:
TRENDTRANSITION
- Tech: UP trend (expanding)
Swing Plan
- Accumulate:
75.80.00-75.80.00
- Trim:
78.86.00-78.86.00
- Add: close >
78.86.00
- Cut: close <
75.80.00
- Best for:
trendtransition regime
Bias: downside break risk elevated
Raw Text Summary
📌 DOCN @ 75.5985.63 (2026-04-1219 08:4813 AM MYT)

• Current price is **75.59*85.63**. Key support is around **75.80.00**, and resistance is around **78.86.00**.
• For the next week, the model’s **68% expected range** is roughly **66.6676.29 to 84.52*94.97**.
• A wider **90% range** is about **60.9170.27 to 90.27**.
• Dealer positioning looks **SHORT gamma**, so the market behavior is classified as **TREND**.
• The estimated **gamma flip** is near **71.92**. Crossing and holding beyond this area can change the trading behavior.
• Approximate breakout odds: **above resistance 49.0%**, **below support 70.5%** by the target horizon.
• Options skew is tilted toward **puts**, which suggests traders are paying more for downside protection.
• Near-term implied volatility is higher than the next expiry (**IV1 87.14% vs IV2 77.74%**), which suggests **near-term event stress / backwardation**.
• Recent volume is **1.81x** the 20-day average, which supports stronger continuation or breakout follow-through.
• On the daily chart, the stock currently looks like **UP trend (expanding)**.
• The implied distribution shows **heavier downside tail risk** than upside tail potential.
ALAB
Spot: 149.05
Report Time: 2026-04-12 08:48 AM MYT
Regime: TRANSITION
Dealer Gamma: LONG
Term Structure
Expiry |
DTE |
Forward |
ATM IV |
ATM Straddle |
|---|
2026-04-17 |
6 |
149.37 |
72.41% |
13.60 |
2026-04-24 |
13 |
149.60 |
67.83% |
18.93 |
Weekly Range
Confidence |
Low |
High |
Width |
|---|
68% |
134.19 |
163.91 |
29.72 |
80% |
130.01 |
168.09 |
38.08 |
90% |
124.61 |
173.49 |
48.88 |
95% |
119.93 |
178.17 |
58.24 |
Structure & Probabilities
Support |
Resistance |
Gamma Flip |
Max Pain |
P>Res |
P<Sup |
|---|
145.00 |
150.00 |
124.49 |
121.00 |
47.4% |
39.2% |
Flow & Skew
Call Vol |
Put Vol |
Vol P/C |
Call OI |
Put OI |
OI P/C |
Skew |
Skew Bias |
|---|
19,056 |
5,788 |
0.30 |
25,813 |
19,606 |
0.76 |
0.37 vol pts |
FLAT |
Tail Risk
Q10 |
Q50 |
Q90 |
Down Tail |
Up Tail |
Down/Up |
|---|
129.37 |
147.90 |
170.87 |
19.68 |
21.82 |
0.90 |
Daily Technicals
EMA20 |
EMA50 |
VWAP20 |
BB Lower |
BB Mid |
BB Upper |
BB Width |
Vol Ratio |
Path |
|---|
122.63 |
130.17 |
121.81 |
100.10 |
120.51 |
140.92 |
33.87% |
2.38 |
Sideways / Range |
Day Plan
145.00-150.00 range: fade extremes
> 150.00: chase only if hold + vol
< 145.00: risk expand; reduce size
Regime: TRANSITION
Tech: Sideways / Range
Swing Plan
Accumulate: 145.00-145.00
Trim: 150.00-150.00
Add: close > 150.00
Cut: close < 145.00
Best for: transition regime
Raw Text Summary
📌 ALAB @ 149.05 (2026-04-12 08:48 AM MYT)

• Current price is **149.05**. Key support is around **145.00**, and resistance is around **150.00**.
• For the next week, the model’s **68% expected range** is roughly **134.19 to 163.91**.
• A wider **90% range** is about **124.61 to 173.49*99**.
• Dealer positioning looks **LONG gamma**, so the market behavior is classified as **TRANSITION**.
• The estimated **gamma flip** is near **124.49*98.09**. Crossing and holding beyond this area can change the trading behavior.
• Approximate breakout odds: **above resistance 47.4%44.2%**, **below support 39.2%20.9%** by the target horizon.
• Options skew is fairlytilted balanced,toward so**calls**, therewhich suggests upside speculation is **norelatively strong directional bias** from skew alone.stronger.
• Near-term implied volatility is higher than the next expiry (**IV1 72.41%78.15% vs IV2 67.83%76.04%**), which suggests **near-term event stress / backwardation**.
• Recent volume is **2.38x** the 20-day average, which supports stronger continuation or breakout follow-through.
• On the daily chart, the stock currently looks like **Sideways / Range**.
• The implied distribution is **fairly balanced** between upside and downside tails.
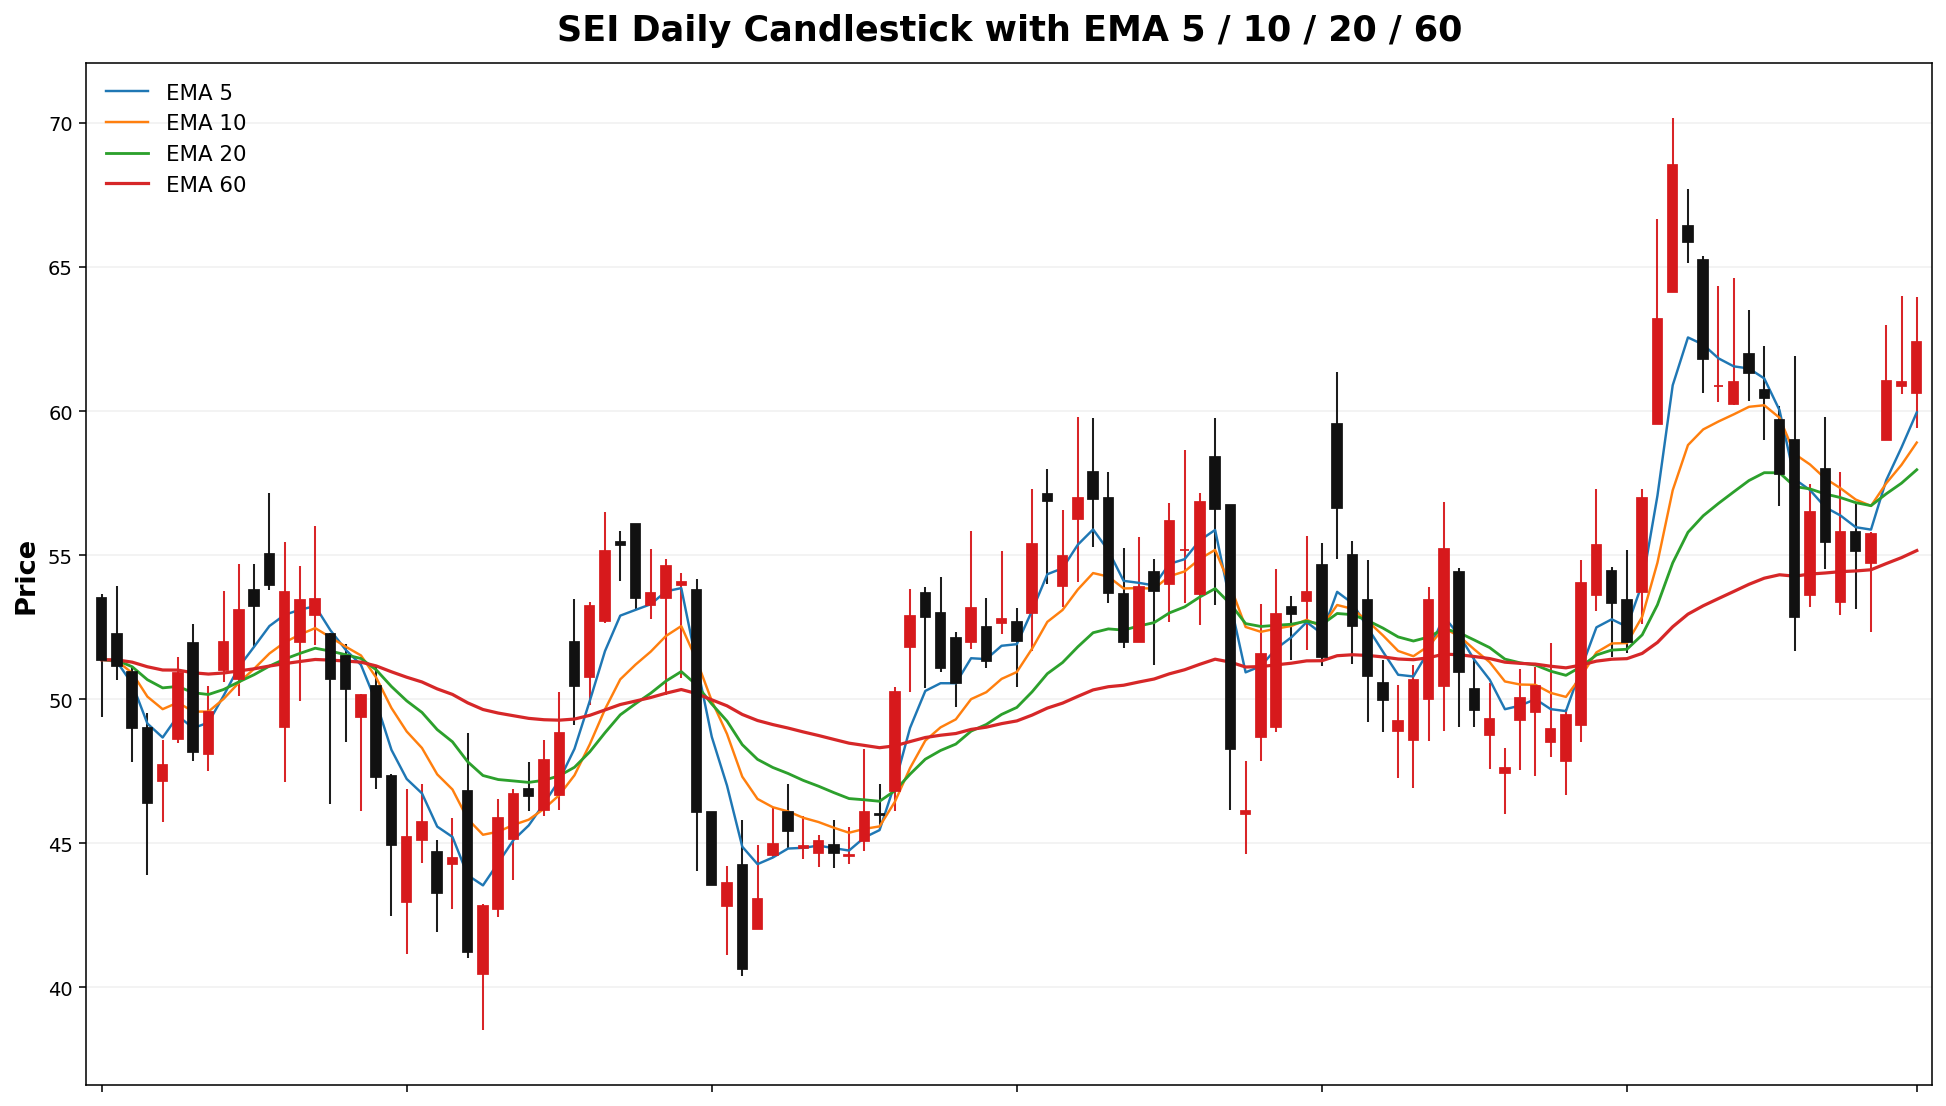
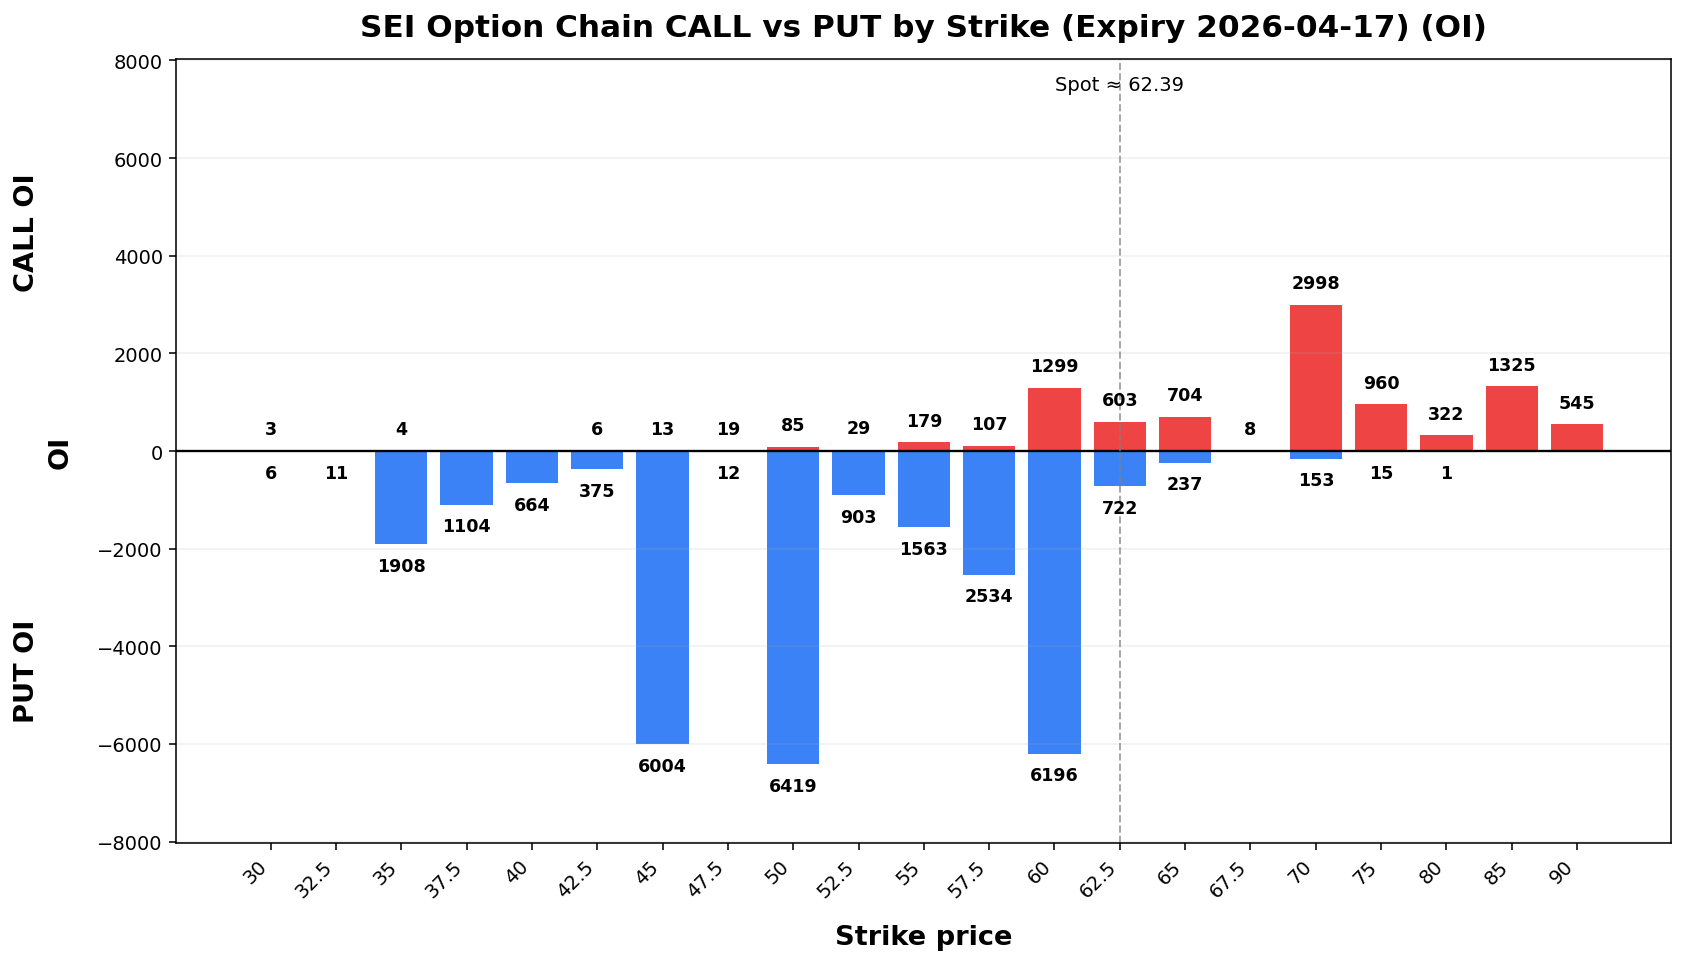
SEI
Spot: 62.39
Report Time: 2026-04-12 08:48 AM MYT
Regime: TREND
Dealer Gamma: SHORT
Term Structure
Expiry |
DTE |
Forward |
ATM IV |
ATM Straddle |
|---|
2026-04-17 |
6 |
62.34 |
83.95% |
6.60 |
2026-05-15 |
34 |
62.71 |
85.88% |
16.30 |
Weekly Range
Confidence |
Low |
High |
Width |
|---|
68% |
54.97 |
69.81 |
14.84 |
80% |
52.88 |
71.90 |
19.02 |
90% |
50.19 |
74.59 |
24.41 |
95% |
47.85 |
76.93 |
29.08 |
Structure & Probabilities
Support |
Resistance |
Gamma Flip |
Max Pain |
P>Res |
P<Sup |
|---|
60.00 |
70.00 |
68.22 |
60.00 |
14.4% |
42.2% |
Flow & Skew
Call Vol |
Put Vol |
Vol P/C |
Call OI |
Put OI |
OI P/C |
Skew |
Skew Bias |
|---|
509 |
499 |
0.98 |
9,220 |
28,827 |
3.13 |
5.91 vol pts |
PUT_SKEW |
Tail Risk
Q10 |
Q50 |
Q90 |
Down Tail |
Up Tail |
Down/Up |
|---|
49.65 |
62.02 |
72.81 |
12.74 |
10.42 |
1.22 |
Daily Technicals
EMA20 |
EMA50 |
VWAP20 |
BB Lower |
BB Mid |
BB Upper |
BB Width |
Vol Ratio |
Path |
|---|
57.97 |
55.58 |
60.63 |
50.78 |
59.29 |
67.80 |
28.70% |
0.71 |
UP trend (expanding) |
Day Plan
60.00-70.00 range: fade extremes
> 70.00: chase only if hold + vol
< 60.00: risk expand; reduce size
Regime: TREND
Tech: UP trend (expanding)
Swing Plan
Accumulate: 60.00-60.00
Trim: 70.00-70.00
Add: close > 70.00
Cut: close < 60.00
Best for: trend regime
Raw Text Summary
📌 SEI @ 62.39 (2026-04-12 08:48 AM MYT)

• Current price is **62.39**. Key support is around **60.00**, and resistance is around **70.00**.
• For the next week, the model’s **68% expected range** is roughly **54.97 to 69.81**.
• A wider **90% range** is about **50.19 to 74.59**.
• Dealer positioning looks **SHORT gamma**, so the market behavior is classified as **TREND**.
• The estimated **gamma flip** is near **68.22**. Crossing and holding beyond this area can change the trading behavior.
• Approximate breakout odds: **above resistance 14.4%**, **below support 42.2%** by the target horizon.
• Options skew is tilted toward **puts**, which suggests traders are paying more for downside protection.
• Near-term implied volatility is lower than the next expiry (**IV1 83.95% vs IV2 85.88%**), which suggests a **contango / calmer front expiry** setup.
• Recent volume is only **0.71x*76x** the 20-day average, so breakouts may be less reliable unless volume improves.
• On the daily chart, the stock currently looks like **UP trend (expanding)**.
• The implied distribution shows **heavier downside tail risk** than upside tail potential.
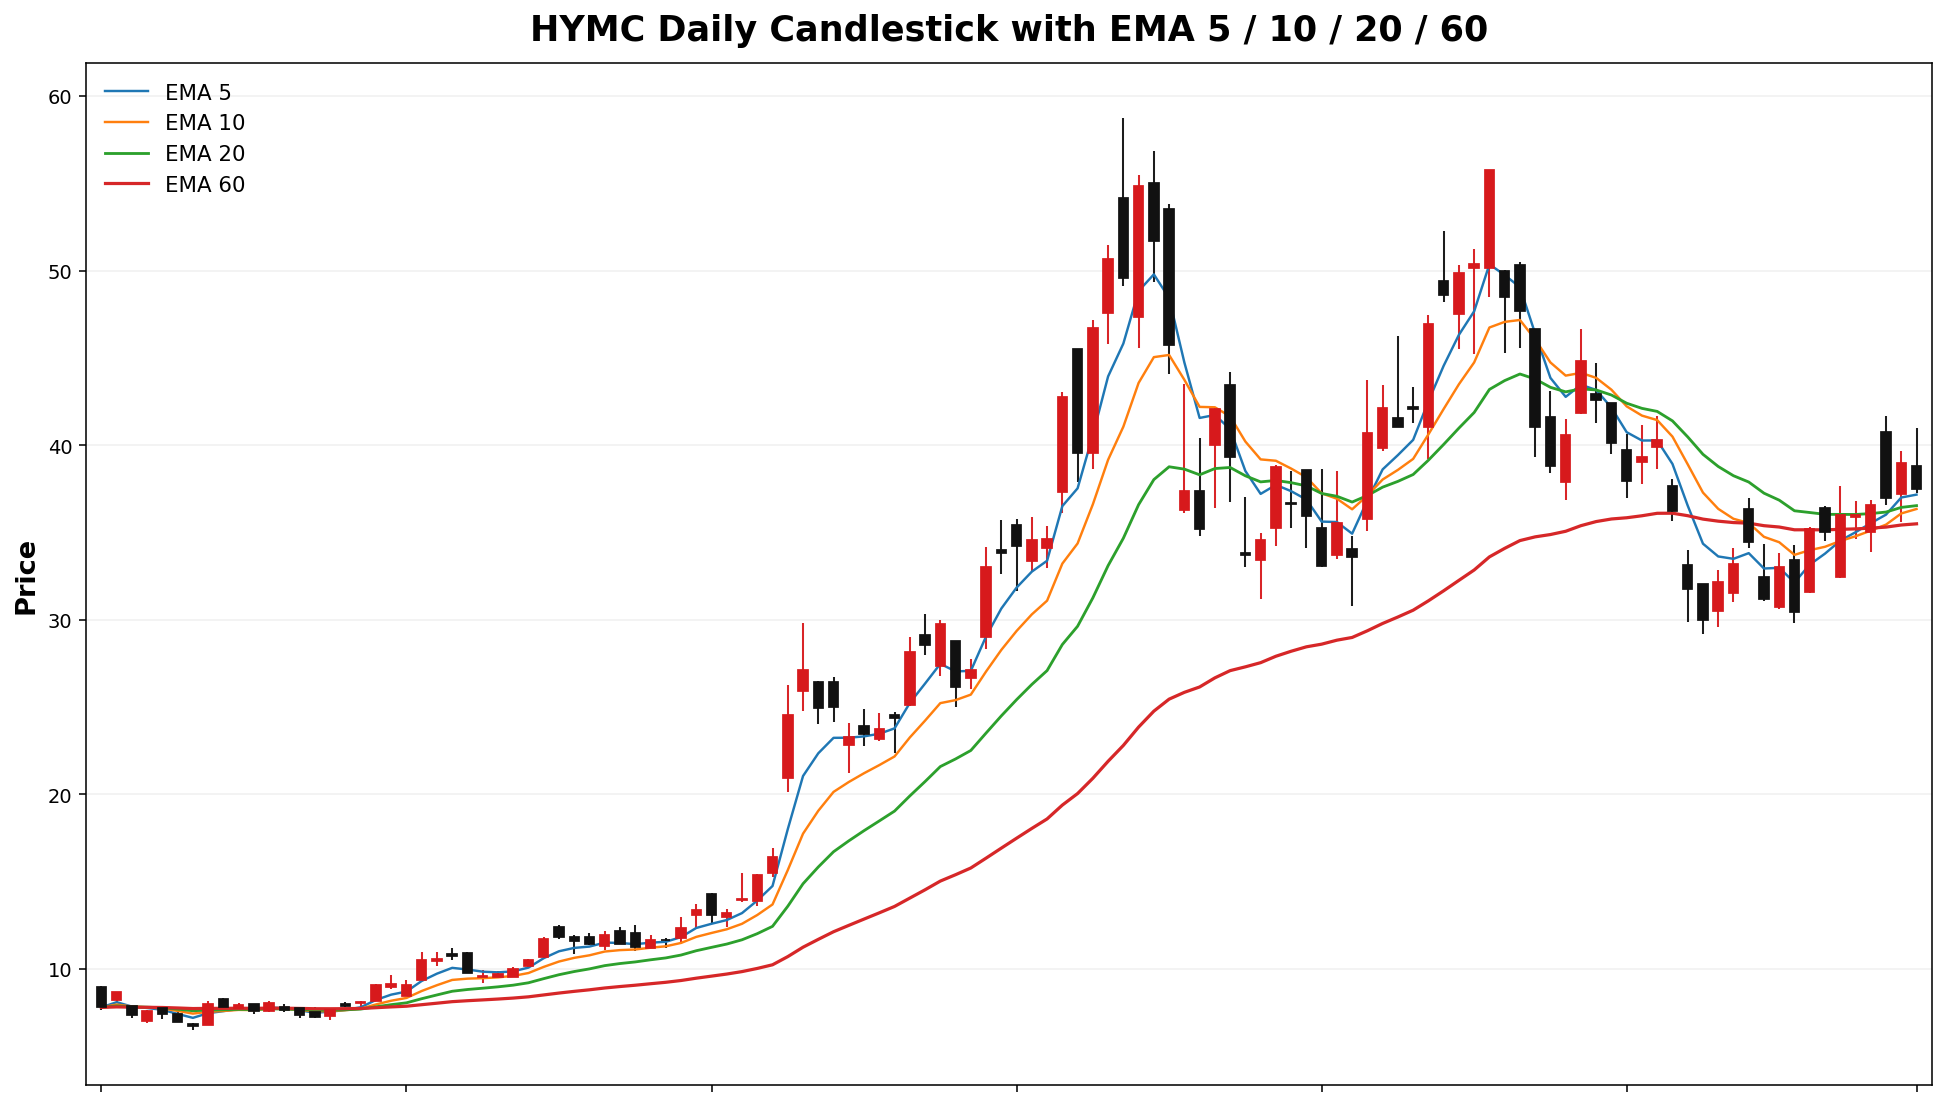
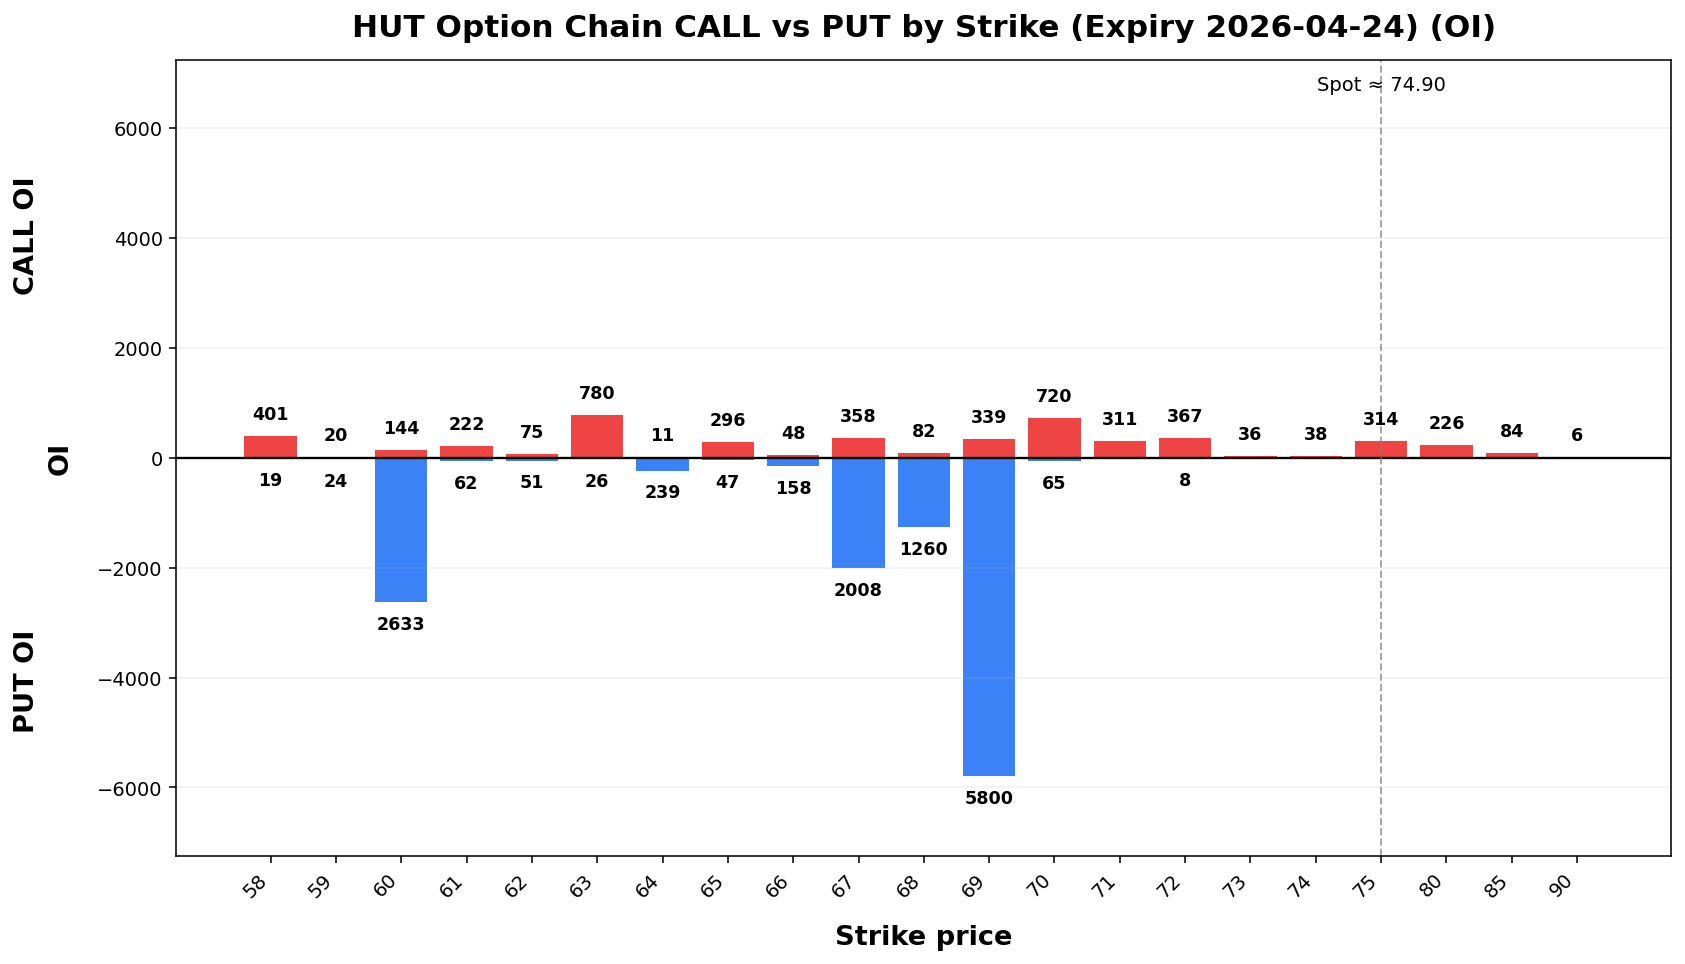
HYMCHUT
Spot: 37.5074.90
Report Time: 2026-04-1219 08:4814 AM MYT
Regime: TRANSITION
Dealer Gamma: LONG
Term Structure
| Expiry |
DTE |
Forward |
ATM IV |
ATM Straddle |
2026-04-1724 |
6 |
37.5274.66 |
88.35%80.46% |
4.187.61 |
2026-05-1501 |
3413 |
37.6174.82 |
82.40%77.13% |
9.4010.82 |
Weekly Range
| Confidence |
Low |
High |
Width |
| 68% |
32.9166.54 |
42.0983.26 |
9.1916.73 |
| 80% |
31.6164.18 |
43.3985.62 |
11.7721.44 |
| 90% |
29.9461.14 |
45.0688.66 |
15.1127.52 |
| 95% |
28.5058.51 |
46.5091.29 |
18.0032.79 |
Structure & Probabilities
| Support |
Resistance |
Gamma Flip |
Max Pain |
P>Res |
P<Sup |
36.69.00 |
40.83.26 |
92.47 |
69.00 |
34.1013.0% |
36.00 |
22.4% |
34.0%23.6% |
Flow & Skew
| Call Vol |
Put Vol |
Vol P/C |
Call OI |
Put OI |
OI P/C |
Skew |
Skew Bias |
9001,999 |
5371,221 |
0.6061 |
13,0297,792 |
10,11418,883 |
0.782.42 |
4.693.22 vol pts |
PUT_SKEW |
Tail Risk
| Q10 |
Q50 |
Q90 |
Down Tail |
Up Tail |
Down/Up |
30.8536.00 |
37.4967.33 |
43.3285.11 |
6.6538.90 |
5.8210.21 |
1.143.81 |
Daily Technicals
| EMA20 |
EMA50 |
VWAP20 |
BB Lower |
BB Mid |
BB Upper |
BB Width |
Vol Ratio |
Path |
36.5460.74 |
55.85 |
58.24 |
36.3145 |
34.4257.20 |
29.0977.94 |
35.1272.53% |
41.15 |
34.35% |
0.711.16 |
UP trend (expanding) |
Day Plan
36.69.00-40.0083.26 range: fade extremes- >
40.00:83.26: chase only if hold + vol
- <
36.69.00: risk expand; reduce size
- Regime: TRANSITION
- Tech: UP trend (expanding)
Swing Plan
- Accumulate:
36.69.00-36.69.00
- Trim:
40.00-40.0083.26-83.26
- Add: close >
40.0083.26
- Cut: close <
36.69.00
- Best for: transition regime
Raw Text Summary
📌 HYMCHUT @ 37.5074.90 (2026-04-1219 08:4814 AM MYT)

• Current price is **37.50*74.90**. Key support is around **36.69.00**, and resistance is around **40.00*83.26**.
• For the next week, the model’s **68% expected range** is roughly **32.9166.54 to 42.09*83.26**.
• A wider **90% range** is about **29.9461.14 to 45.06*88.66**.
• Dealer positioning looks **LONG gamma**, so the market behavior is classified as **TRANSITION**.
• The estimated **gamma flip** is near **34.10*92.47**. Crossing and holding beyond this area can change the trading behavior.
• Approximate breakout odds: **above resistance 22.4%13.0%**, **below support 34.0%23.6%** by the target horizon.
• Options skew is tilted toward **puts**, which suggests traders are paying more for downside protection.
• Near-term implied volatility is higher than the next expiry (**IV1 88.35%80.46% vs IV2 82.40%77.13%**), which suggests **near-term event stress / backwardation**.
• Recent volume is only **0.71x** the 20-day average, so breakouts may be less reliable unless volume improves.
• On the daily chart, the stock currently looks like **UP trend (expanding)**.
• The implied distribution shows **heavier downside tail risk** than upside tail potential.
PLFLY
Spot: 34.6743.72
Report Time: 2026-04-1219 08:4814 AM MYT
Regime: TRANSITION
Dealer Gamma: LONG
Term Structure
| Expiry |
DTE |
Forward |
ATM IV |
ATM Straddle |
2026-04-1724 |
6 |
34.6943.74 |
86.98%102.35% |
3.805.65 |
2026-04-2405-01 |
13 |
34.8243.76 |
81.66%98.88% |
5.308.10 |
Weekly Range
| Confidence |
Low |
High |
Width |
| 68% |
30.5237.49 |
38.8249.95 |
8.3112.45 |
| 80% |
29.3535.74 |
39.9951.70 |
10.6515.96 |
| 90% |
27.8433.48 |
41.5053.96 |
13.6720.48 |
| 95% |
26.5331.52 |
42.8155.92 |
16.2924.41 |
Structure & Probabilities
| Support |
Resistance |
Gamma Flip |
Max Pain |
P>Res |
P<Sup |
31.40.00 |
35.50.00 |
23.NA |
13.00 |
14.0% |
24.6% |
Flow & Skew
| Call Vol |
Put Vol |
Vol P/C |
Call OI |
Put OI |
OI P/C |
Skew |
Skew Bias |
| 1,781 |
902 |
0.51 |
7,263 |
5,180 |
0.71 |
-1.46 vol pts |
CALL_SKEW |
Tail Risk
| Q10 |
Q50 |
Q90 |
Down Tail |
Up Tail |
Down/Up |
| 37.15 |
39.61 |
48.14 |
6.57 |
4.42 |
1.49 |
Daily Technicals
| EMA20 |
EMA50 |
VWAP20 |
BB Lower |
BB Mid |
BB Upper |
BB Width |
Vol Ratio |
Path |
| 34.06 |
28.99 |
32.30 |
18.54 |
32.42 |
46.29 |
85.61% |
0.91 |
UP trend (expanding) |
Day Plan
- 40.00-50.00 range: fade extremes
- > 50.00: chase only if hold + vol
- < 40.00: risk expand; reduce size
- Regime: TRANSITION
- Tech: UP trend (expanding)
Swing Plan
- Accumulate: 40.00-40.00
- Trim: 50.00-50.00
- Add: close > 50.00
- Cut: close < 40.00
- Best for: transition regime
Raw Text Summary
📌 FLY @ 43.72 (2026-04-19 08:14 AM MYT)

• Current price is **43.72**. Key support is around **40.00**, and resistance is around **50.00**.
• For the next week, the model’s **68% expected range** is roughly **37.49 to 49.95**.
• A wider **90% range** is about **33.48 to 53.96**.
• Dealer positioning looks **LONG gamma**, so the market behavior is classified as **TRANSITION**.
• Approximate breakout odds: **above resistance 14.0%**, **below support 24.6%** by the target horizon.
• Options skew is fairly balanced, so there is **no strong directional bias** from skew alone.
• Near-term implied volatility is higher than the next expiry (**IV1 102.35% vs IV2 98.88%**), which suggests **near-term event stress / backwardation**.
• On the daily chart, the stock currently looks like **UP trend (expanding)**.
• The implied distribution shows **heavier downside tail risk** than upside tail potential.
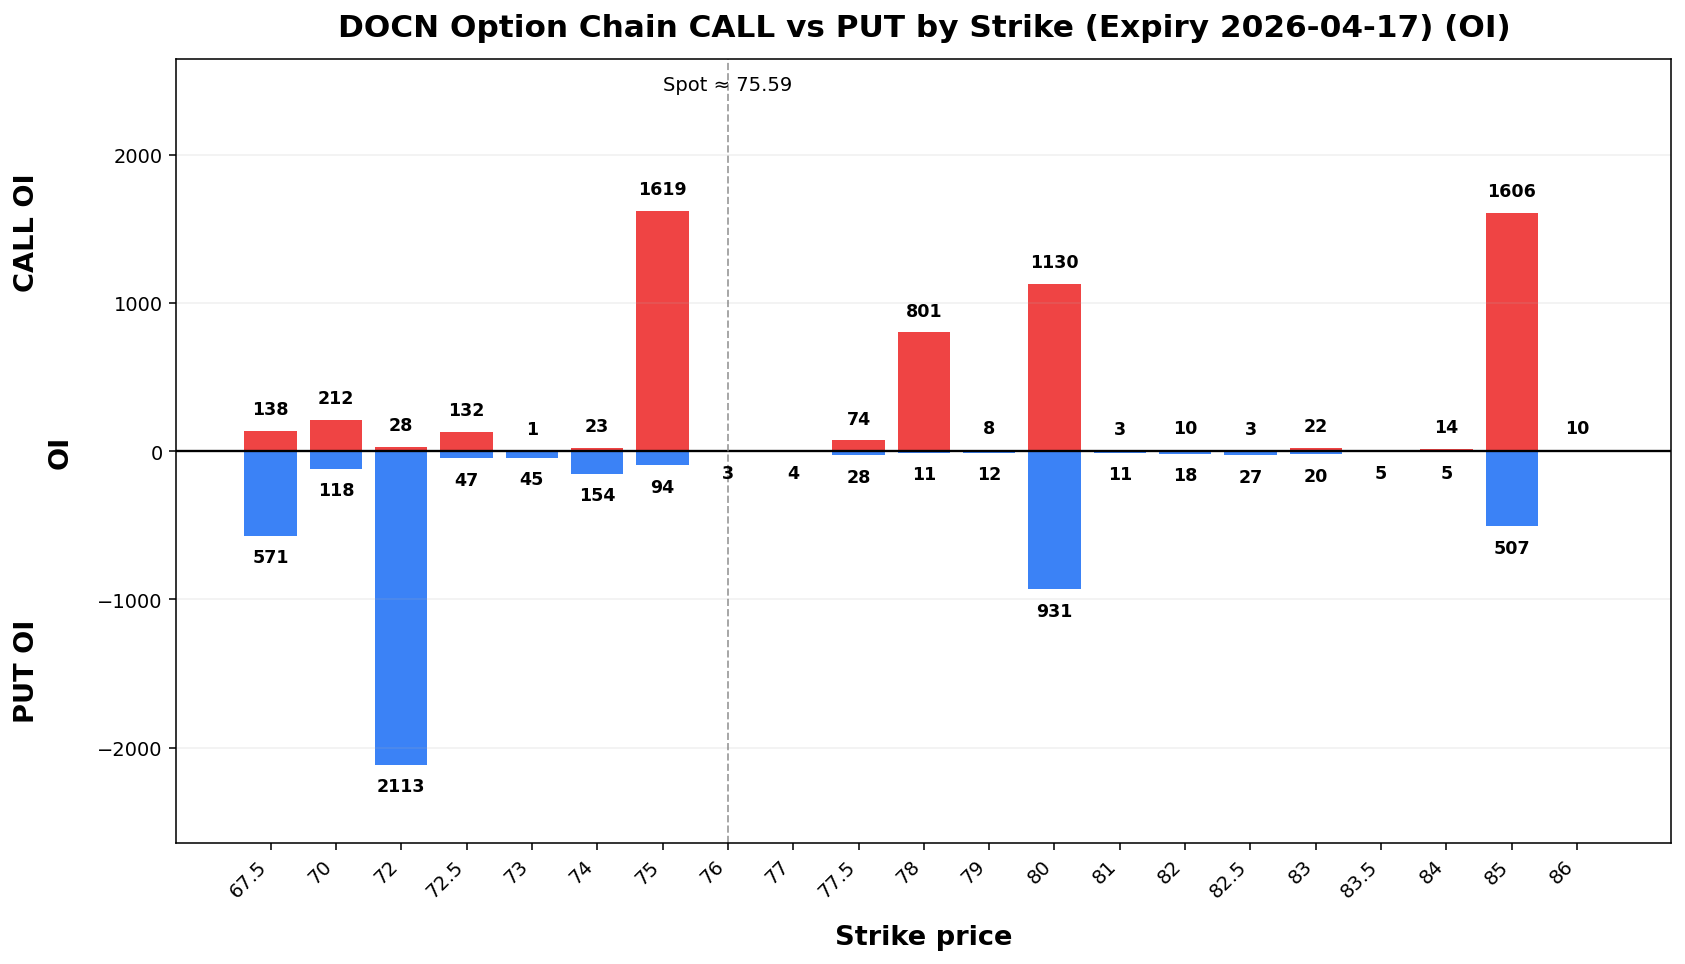
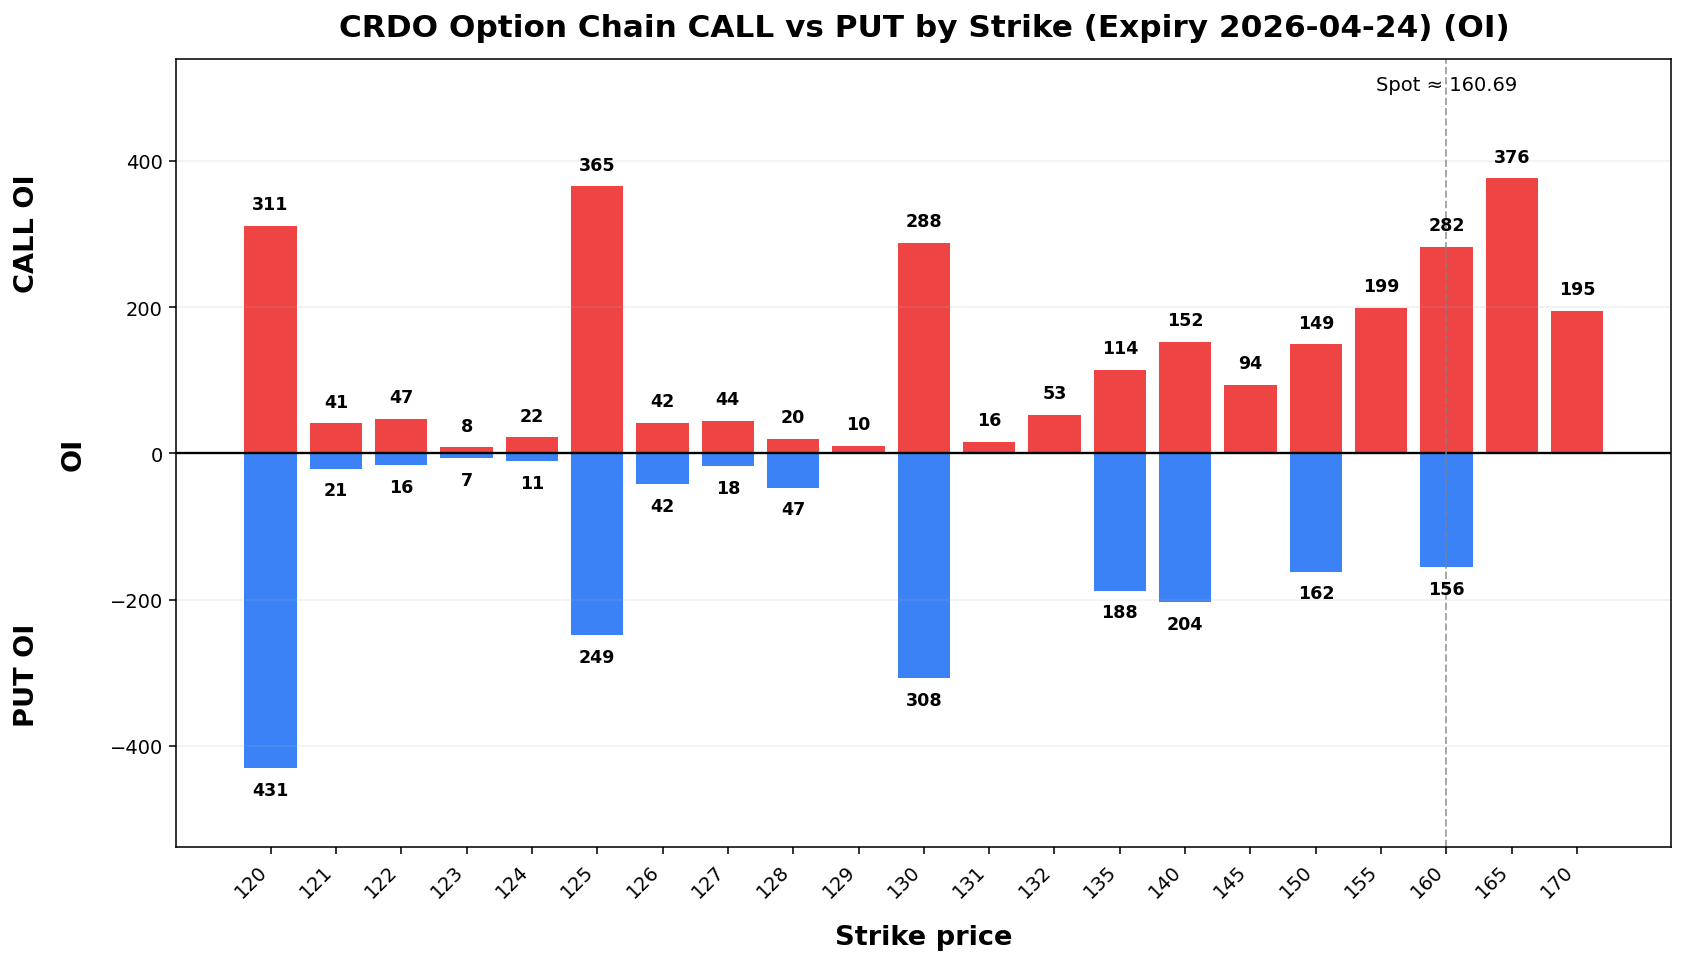
CRDO
Spot: 160.69
Report Time: 2026-04-19 08:14 AM MYT
Regime: TRANSITION
Dealer Gamma: LONG
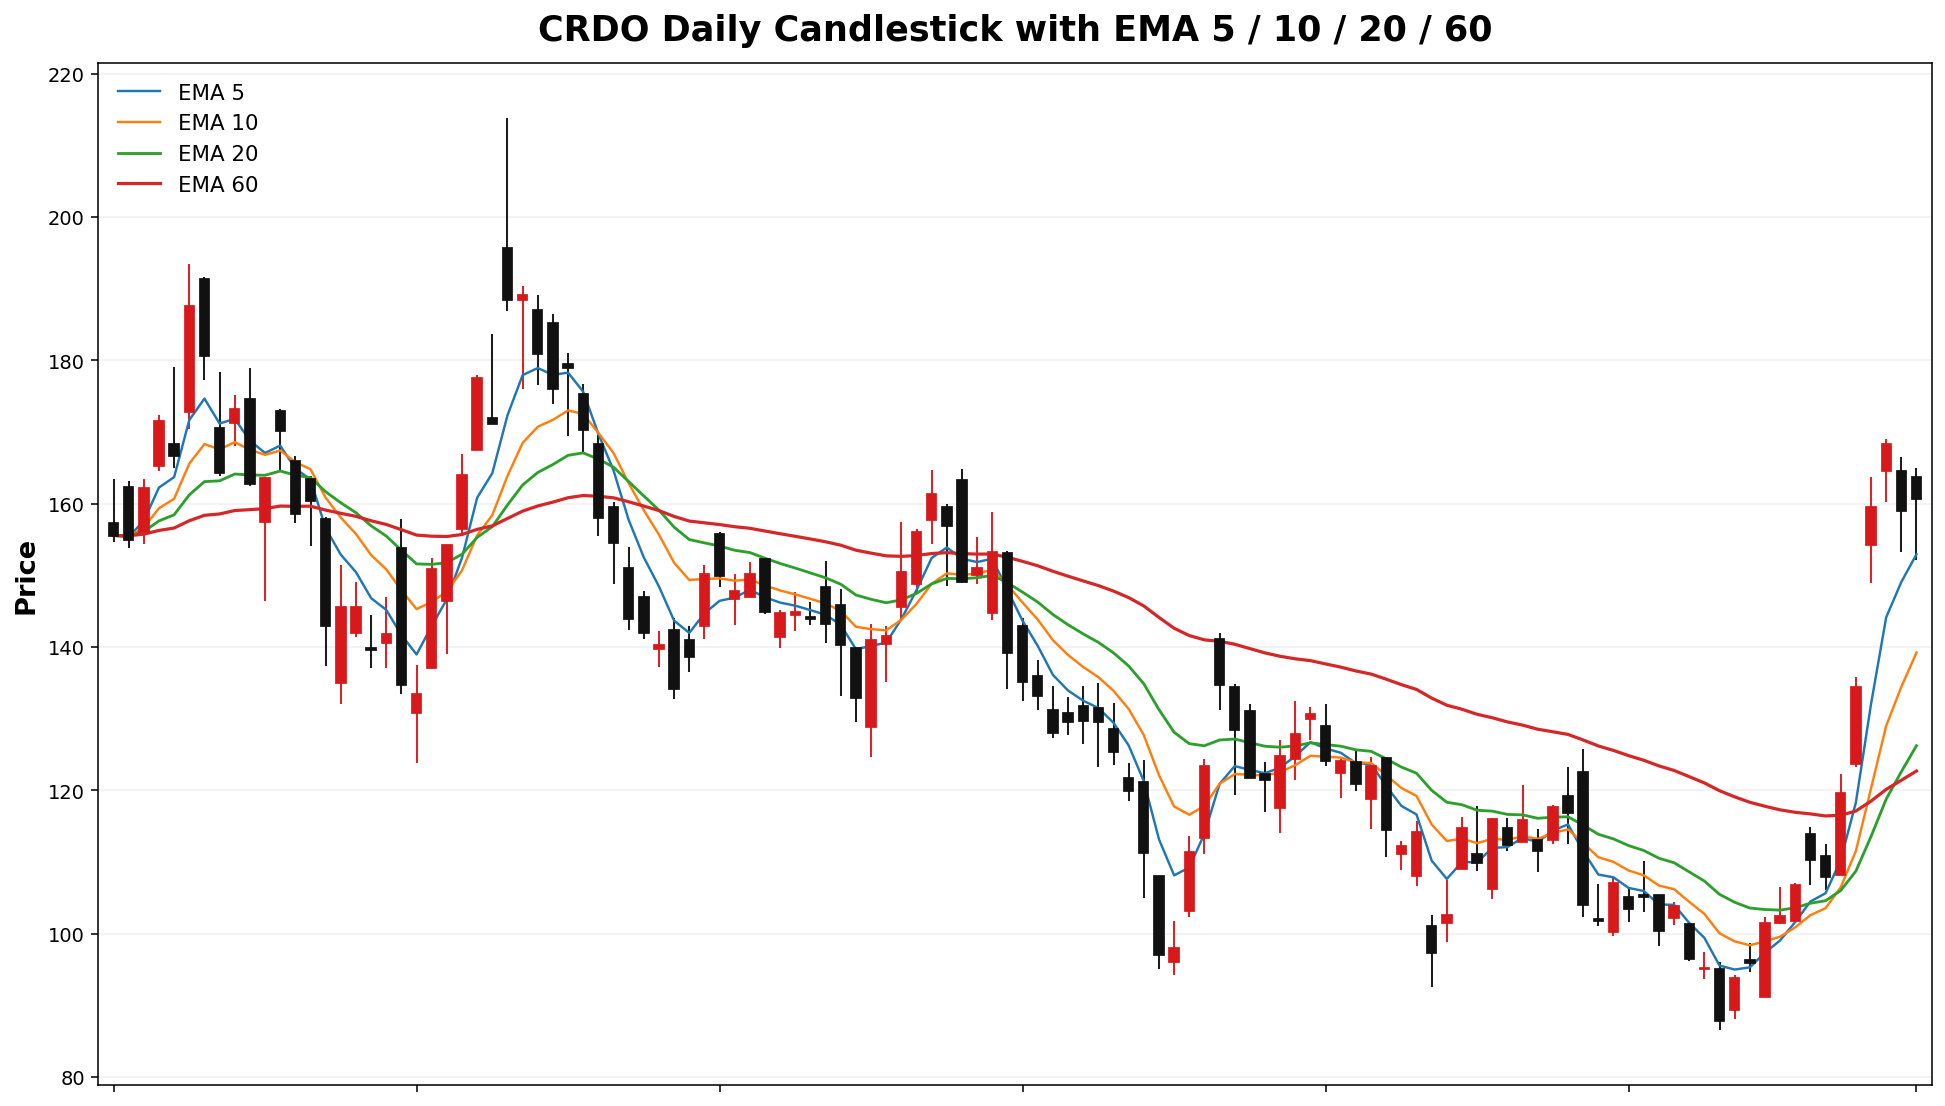
Term Structure
| Expiry |
DTE |
Forward |
ATM IV |
ATM Straddle |
| 2026-04-24 |
6 |
160.61 |
73.19% |
14.85 |
| 2026-05-01 |
13 |
160.46 |
97.65% |
29.40 |
Weekly Range
| Confidence |
Low |
High |
Width |
| 68% |
141.94 |
179.44 |
37.49 |
| 80% |
136.66 |
184.72 |
48.05 |
| 90% |
129.85 |
191.53 |
21.61.67 |
| 95% |
123.95 |
197.43 |
73.49 |
Structure & Probabilities
| Support |
Resistance |
Gamma Flip |
Max Pain |
P>Res |
P<Sup |
| 160.00 |
165.00 |
132.78 |
120.00 |
30.7% |
43.6% |
Flow & Skew
| Call Vol |
Put Vol |
Vol P/C |
Call OI |
Put OI |
OI P/C |
Skew |
Skew Bias |
| 1,628 |
1,714 |
1.05 |
4,457 |
5,631 |
1.26 |
4.42 vol pts |
PUT_SKEW |
Tail Risk
| Q10 |
Q50 |
Q90 |
Down Tail |
Up Tail |
Down/Up |
| 129.14 |
147.63 |
164.46 |
31.55 |
3.77 |
8.37 |
Daily Technicals
| EMA20 |
EMA50 |
VWAP20 |
BB Lower |
BB Mid |
BB Upper |
BB Width |
Vol Ratio |
Path |
| 126.23 |
121.41 |
122.99 |
64.17 |
115.61 |
167.06 |
89.00% |
1.01 |
UP trend (expanding) |
Day Plan
- 160.00-165.00 range: fade extremes
- > 165.00: chase only if hold + vol
- < 160.00: risk expand; reduce size
- Regime: TRANSITION
- Tech: UP trend (expanding)
Swing Plan
- Accumulate: 160.00-160.00
- Trim: 165.00-165.00
- Add: close > 165.00
- Cut: close < 160.00
- Best for: transition regime
Raw Text Summary
📌 CRDO @ 160.69 (2026-04-19 08:14 AM MYT)

• Current price is **160.69**. Key support is around **160.00**, and resistance is around **165.00**.
• For the next week, the model’s **68% expected range** is roughly **141.94 to 179.44**.
• A wider **90% range** is about **129.85 to 191.53**.
• Dealer positioning looks **LONG gamma**, so the market behavior is classified as **TRANSITION**.
• The estimated **gamma flip** is near **132.78**. Crossing and holding beyond this area can change the trading behavior.
• Approximate breakout odds: **above resistance 30.7%**, **below support 43.6%** by the target horizon.
• Options skew is tilted toward **puts**, which suggests traders are paying more for downside protection.
• Near-term implied volatility is lower than the next expiry (**IV1 73.19% vs IV2 97.65%**), which suggests a **contango / calmer front expiry** setup.
• On the daily chart, the stock currently looks like **UP trend (expanding)**.
• The implied distribution shows **heavier downside tail risk** than upside tail potential.
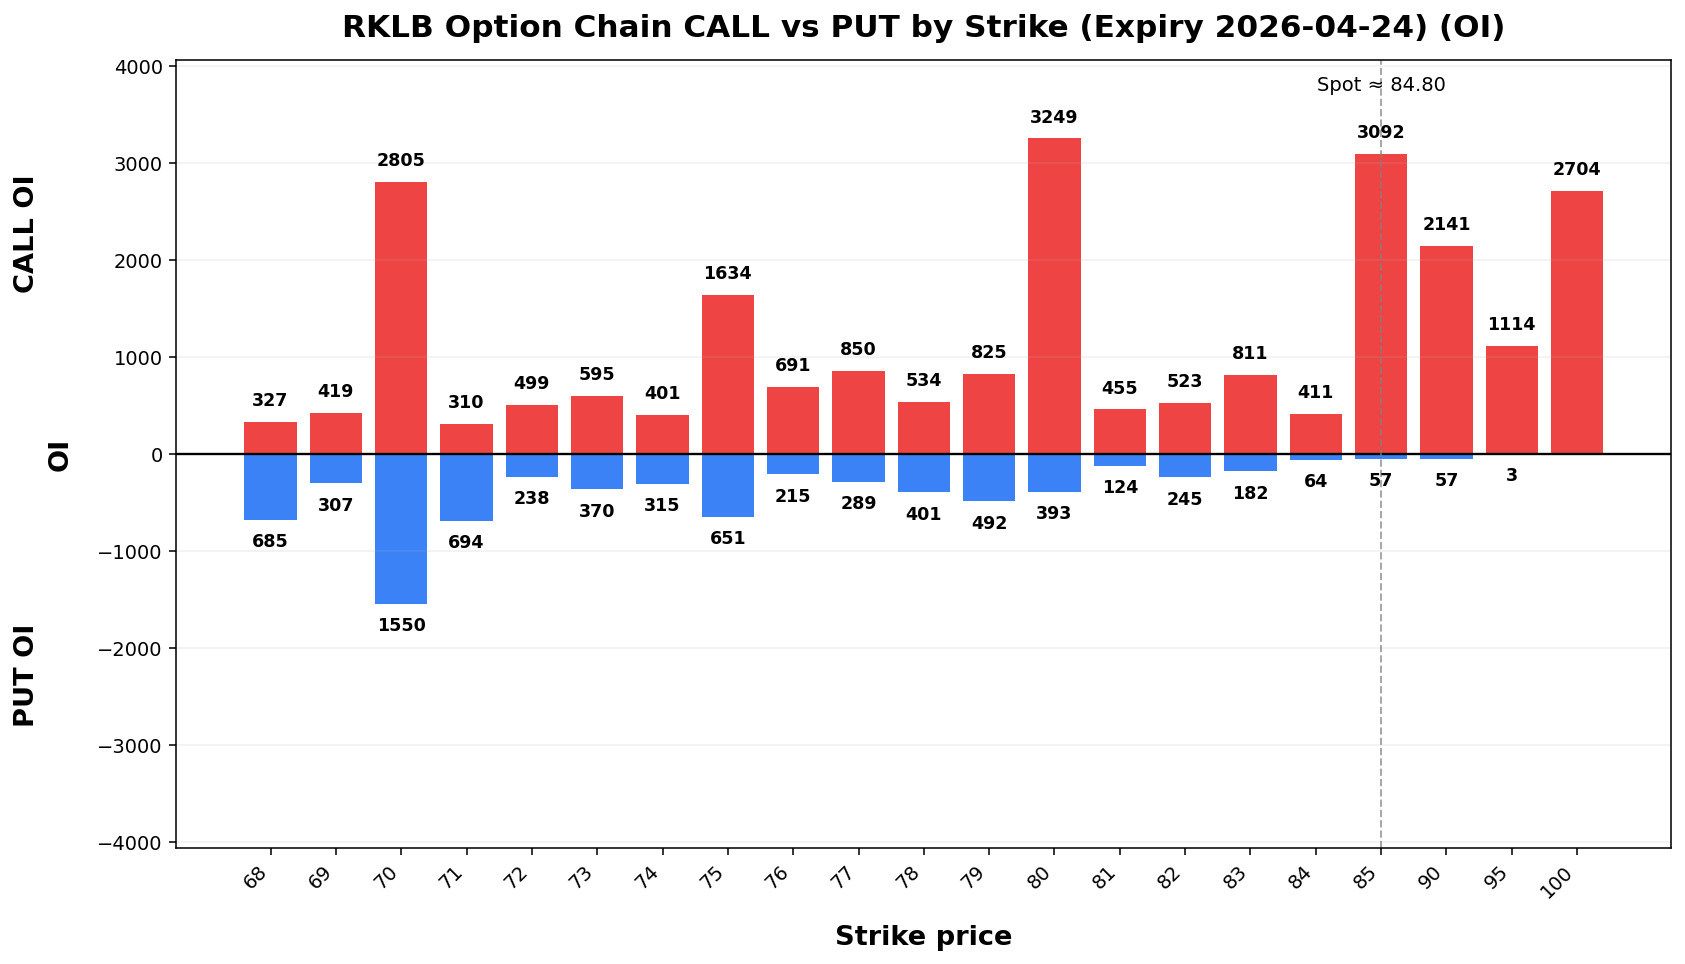
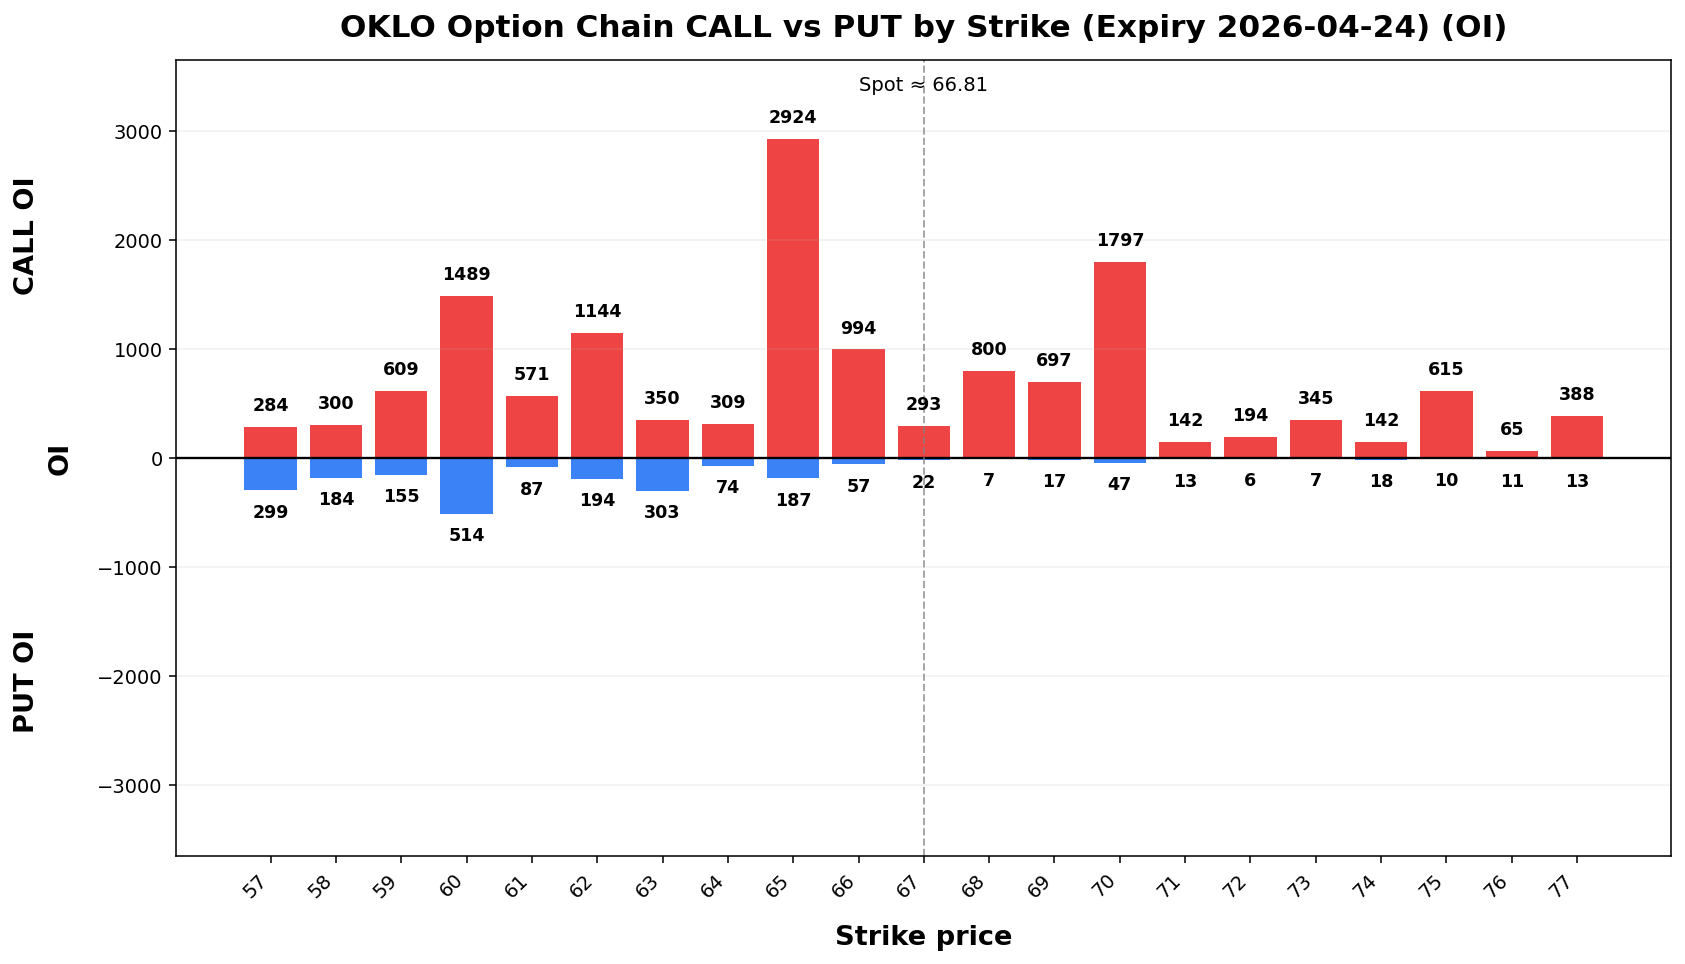
OKLO
Spot: 66.81
Report Time: 2026-04-19 08:14 AM MYT
Regime: TRANSITION
Dealer Gamma: LONG
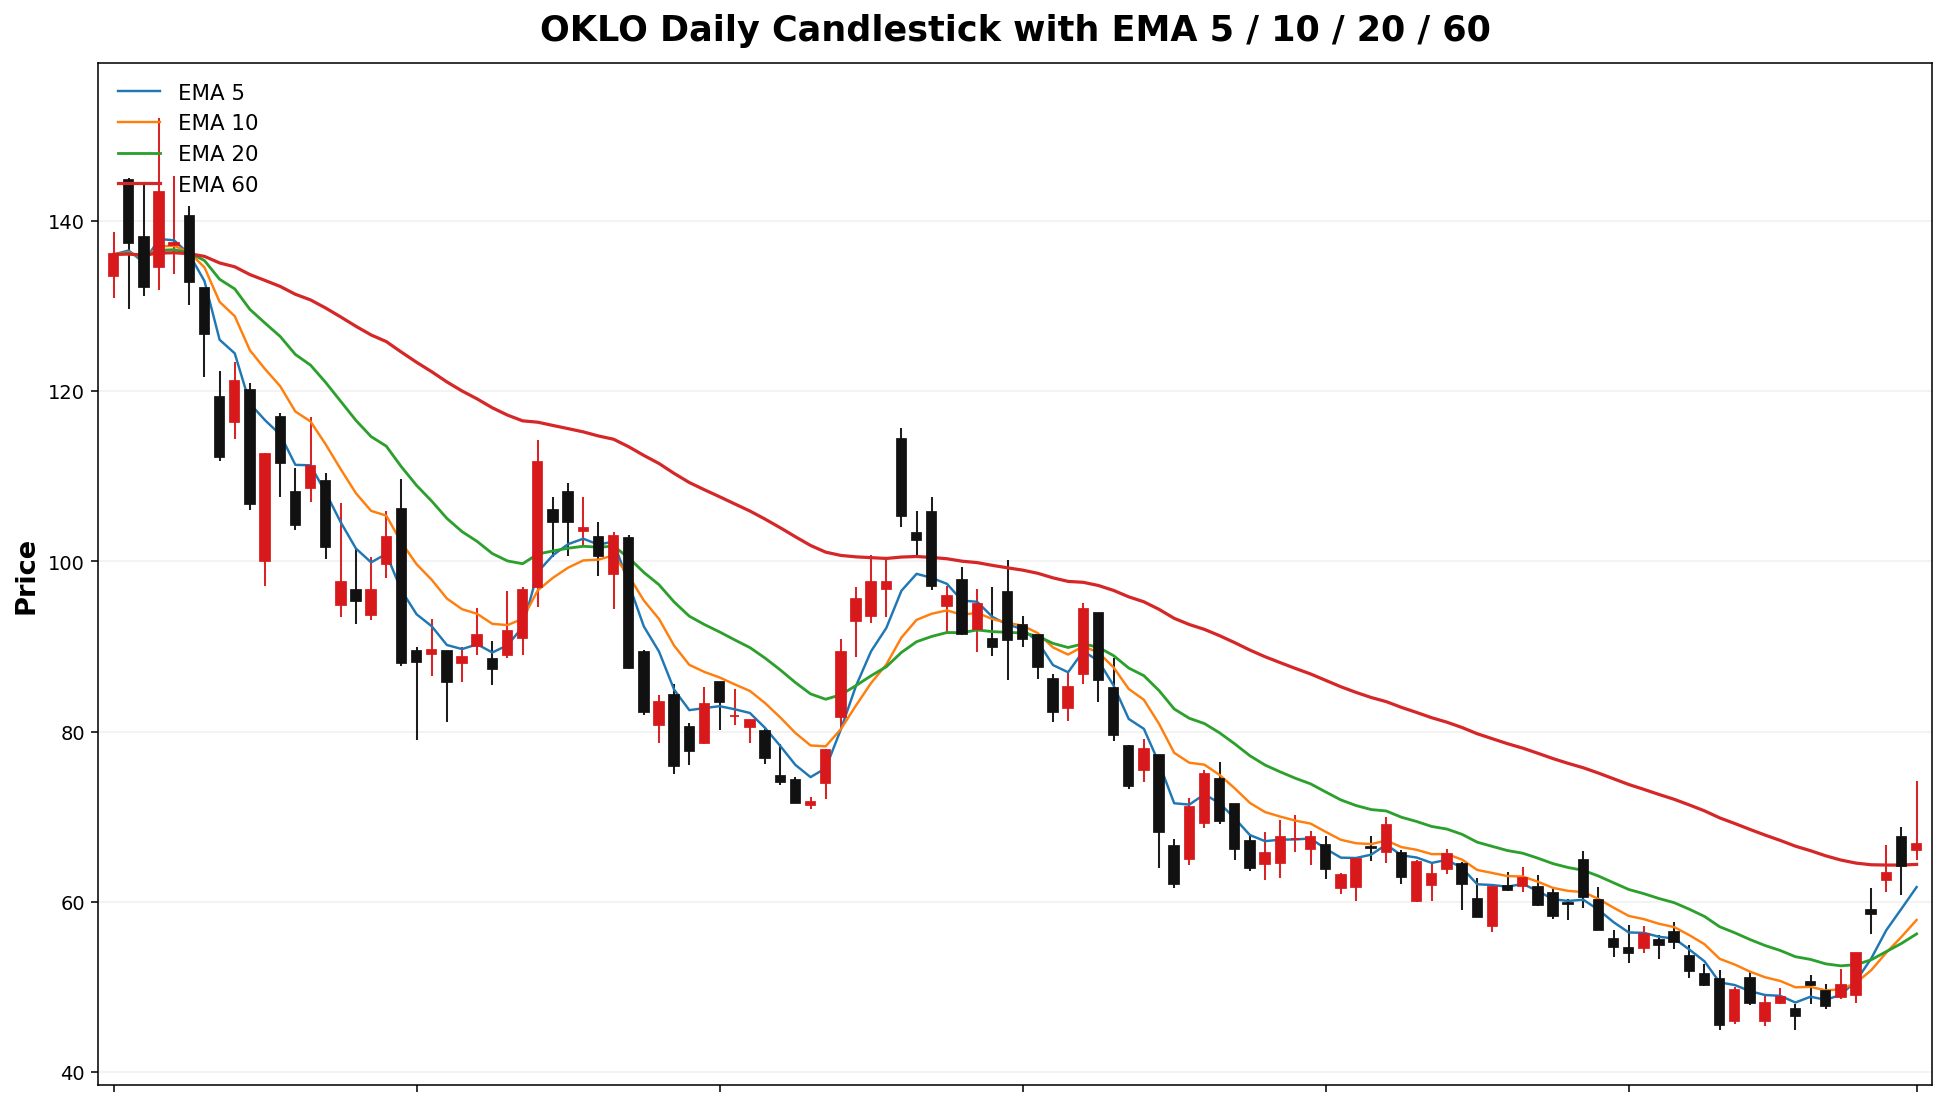
Term Structure
| Expiry |
DTE |
Forward |
ATM IV |
ATM Straddle |
| 2026-04-24 |
6 |
66.96 |
88.31% |
7.45 |
| 2026-05-01 |
13 |
67.05 |
84.08% |
10.52 |
Weekly Range
| Confidence |
Low |
High |
Width |
| 68% |
58.64 |
74.98 |
16.34 |
| 80% |
56.34 |
77.28 |
20.94 |
| 90% |
53.37 |
80.25 |
26.88 |
| 95% |
50.80 |
82.82 |
32.02 |
Structure & Probabilities
| Support |
Resistance |
Gamma Flip |
Max Pain |
P>Res |
P<Sup |
| 65.00 |
70.00 |
51.81 |
56.00 |
38.3% |
37.9% |
Flow & Skew
| Call Vol |
Put Vol |
Vol P/C |
Call OI |
Put OI |
OI P/C |
Skew |
Skew Bias |
| 27,474 |
12,581 |
0.46 |
20,591 |
18,093 |
0.88 |
-11.08 vol pts |
CALL_SKEW |
Tail Risk
| Q10 |
Q50 |
Q90 |
Down Tail |
Up Tail |
Down/Up |
| 36.05 |
63.79 |
78.06 |
30.76 |
11.25 |
2.73 |
Daily Technicals
| EMA20 |
EMA50 |
VWAP20 |
BB Lower |
BB Mid |
BB Upper |
BB Width |
Vol Ratio |
Path |
| 56.22 |
61.63 |
56.30 |
41.07 |
53.22 |
65.36 |
45.65% |
2.34 |
Sideways / Range |
Day Plan
- 65.00-70.00 range: fade extremes
- > 70.00: chase only if hold + vol
- < 65.00: risk expand; reduce size
- Regime: TRANSITION
- Tech: Sideways / Range
Swing Plan
- Accumulate: 65.00-65.00
- Trim: 70.00-70.00
- Add: close > 70.00
- Cut: close < 65.00
- Best for: transition regime
Raw Text Summary
📌 OKLO @ 66.81 (2026-04-19 08:14 AM MYT)

• Current price is **66.81**. Key support is around **65.00**, and resistance is around **70.00**.
• For the next week, the model’s **68% expected range** is roughly **58.64 to 74.98**.
• A wider **90% range** is about **53.37 to 80.25**.
• Dealer positioning looks **LONG gamma**, so the market behavior is classified as **TRANSITION**.
• The estimated **gamma flip** is near **51.81**. Crossing and holding beyond this area can change the trading behavior.
• Approximate breakout odds: **above resistance 38.3%**, **below support 37.9%** by the target horizon.
• Options skew is tilted toward **calls**, which suggests upside speculation is relatively stronger.
• Near-term implied volatility is higher than the next expiry (**IV1 88.31% vs IV2 84.08%**), which suggests **near-term event stress / backwardation**.
• Recent volume is **2.34x** the 20-day average, which supports stronger continuation or breakout follow-through.
• On the daily chart, the stock currently looks like **Sideways / Range**.
• The implied distribution shows **heavier downside tail risk** than upside tail potential.
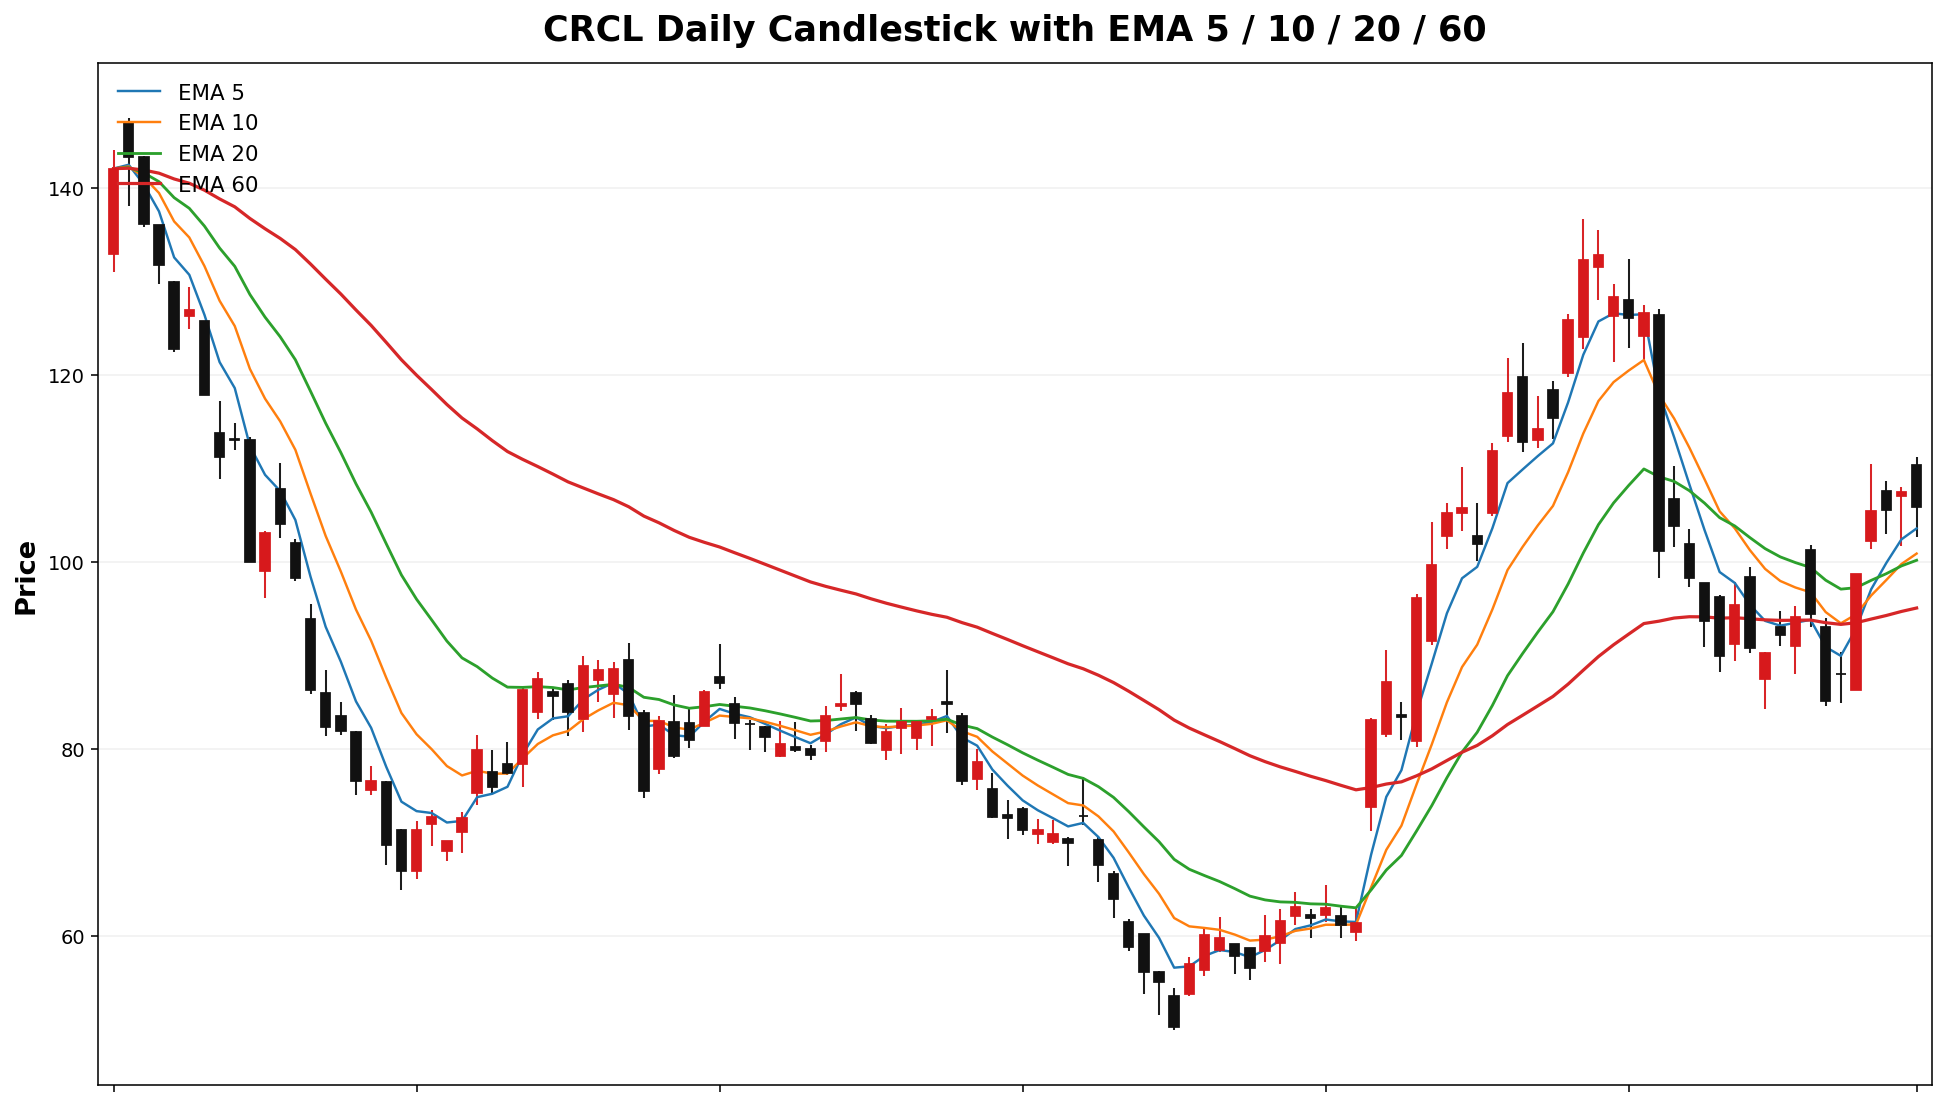
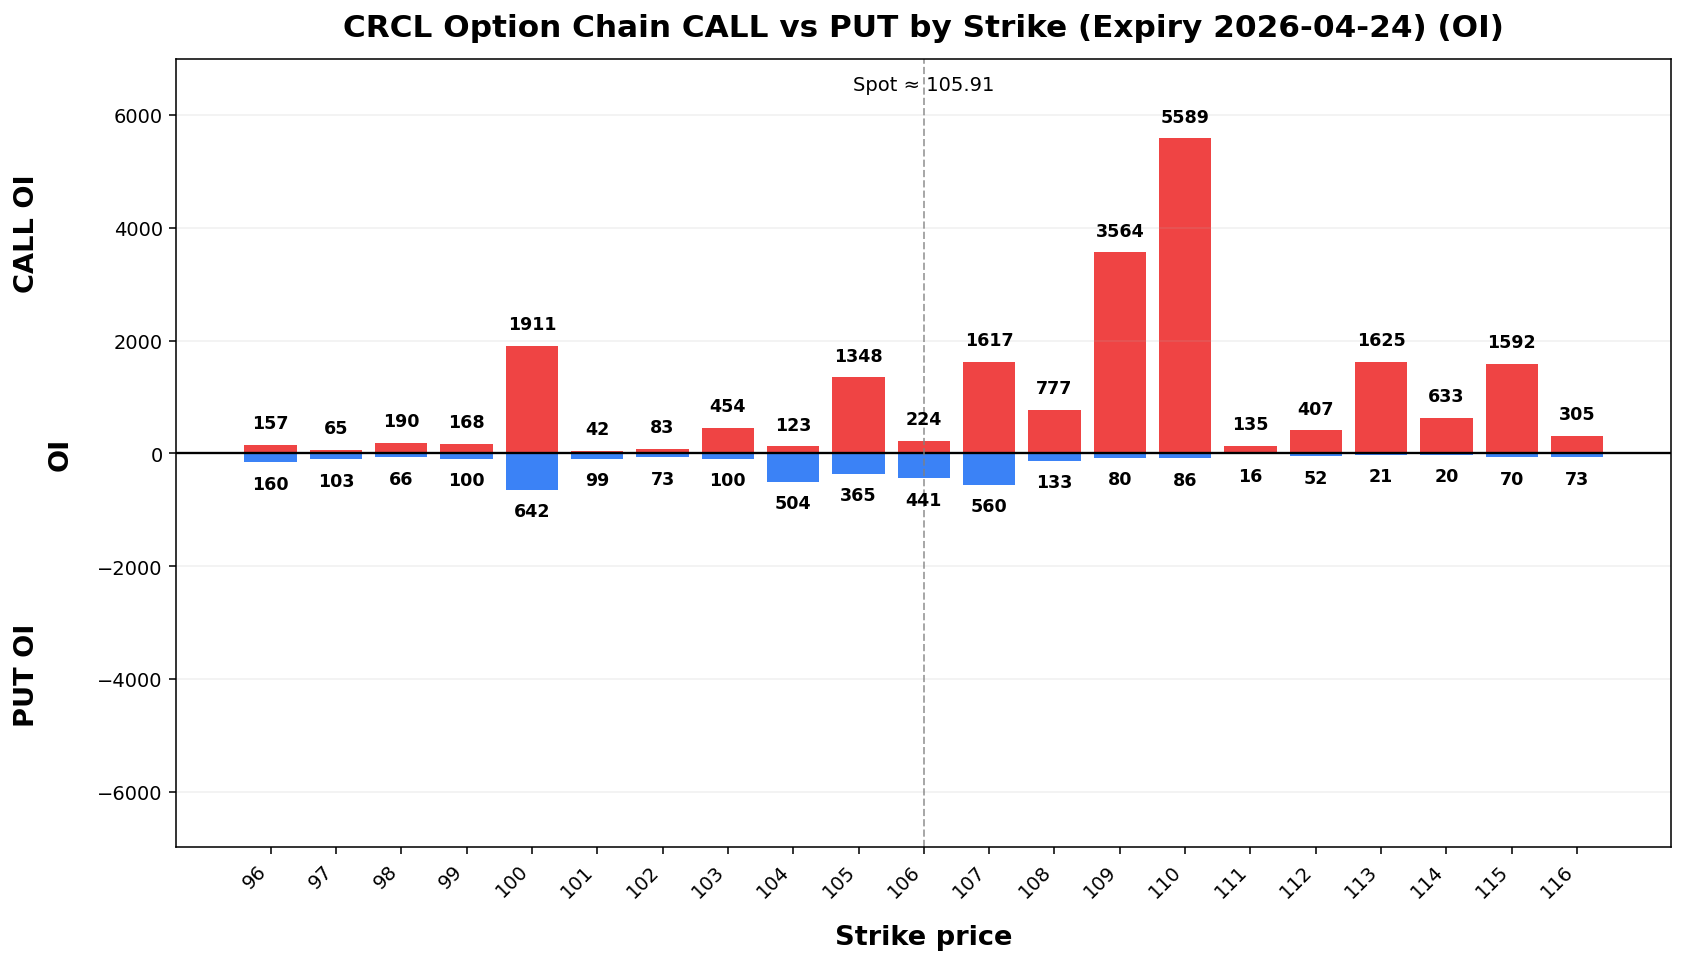
CRCL
Spot: 105.91
Report Time: 2026-04-19 08:14 AM MYT
Regime: TREND
Dealer Gamma: SHORT
Term Structure
| Expiry |
DTE |
Forward |
ATM IV |
ATM Straddle |
| 2026-04-24 |
6 |
105.72 |
72.72% |
9.73 |
| 2026-05-01 |
13 |
105.62 |
71.93% |
14.27 |
Weekly Range
| Confidence |
Low |
High |
Width |
| 68% |
95.10 |
116.72 |
21.61 |
| 80% |
92.06 |
119.76 |
27.70 |
| 90% |
88.13 |
123.69 |
35.55 |
| 95% |
84.73 |
127.09 |
42.36 |
Structure & Probabilities
| Support |
Resistance |
Gamma Flip |
Max Pain |
P>Res |
P<Sup |
| 100.00 |
107.00 |
88.03 |
100.00 |
61.1% |
32.5% |
Flow & Skew
| Call Vol |
Put Vol |
Vol P/C |
Call OI |
Put OI |
OI P/C |
Skew |
Skew Bias |
| 32,601 |
19,321 |
0.59 |
33,819 |
19,715 |
0.58 |
-2.54 vol pts |
CALL_SKEW |
Tail Risk
| Q10 |
Q50 |
Q90 |
Down Tail |
Up Tail |
Down/Up |
| 69.86 |
99.91 |
118.85 |
36.05 |
12.94 |
2.79 |
Daily Technicals
| EMA20 |
EMA50 |
VWAP20 |
BB Lower |
BB Mid |
BB Upper |
BB Width |
Vol Ratio |
Path |
| 100.17 |
95.86 |
102.85 |
77.20 |
99.64 |
122.09 |
45.05% |
0.91 |
UP trend (expanding) |
Day Plan
- 100.00-107.00 range: fade extremes
- > 107.00: chase only if hold + vol
- < 100.00: risk expand; reduce size
- Regime: TREND
- Tech: UP trend (expanding)
Swing Plan
- Accumulate: 100.00-100.00
- Trim: 107.00-107.00
- Add: close > 107.00
- Cut: close < 100.00
- Best for: trend regime
- Bias: upside breakout more favored
Raw Text Summary
📌 CRCL @ 105.91 (2026-04-19 08:14 AM MYT)

• Current price is **105.91**. Key support is around **100.00**, and resistance is around **107.00**.
• For the next week, the model’s **68% expected range** is roughly **95.10 to 116.72**.
• A wider **90% range** is about **88.13 to 123.69**.
• Dealer positioning looks **SHORT gamma**, so the market behavior is classified as **TREND**.
• The estimated **gamma flip** is near **88.03**. Crossing and holding beyond this area can change the trading behavior.
• Approximate breakout odds: **above resistance 61.1%**, **below support 32.5%** by the target horizon.
• Options skew is tilted toward **calls**, which suggests upside speculation is relatively stronger.
• Near-term implied volatility is higher than the next expiry (**IV1 72.72% vs IV2 71.93%**), which suggests **near-term event stress / backwardation**.
• On the daily chart, the stock currently looks like **UP trend (expanding)**.
• The implied distribution shows **heavier downside tail risk** than upside tail potential.
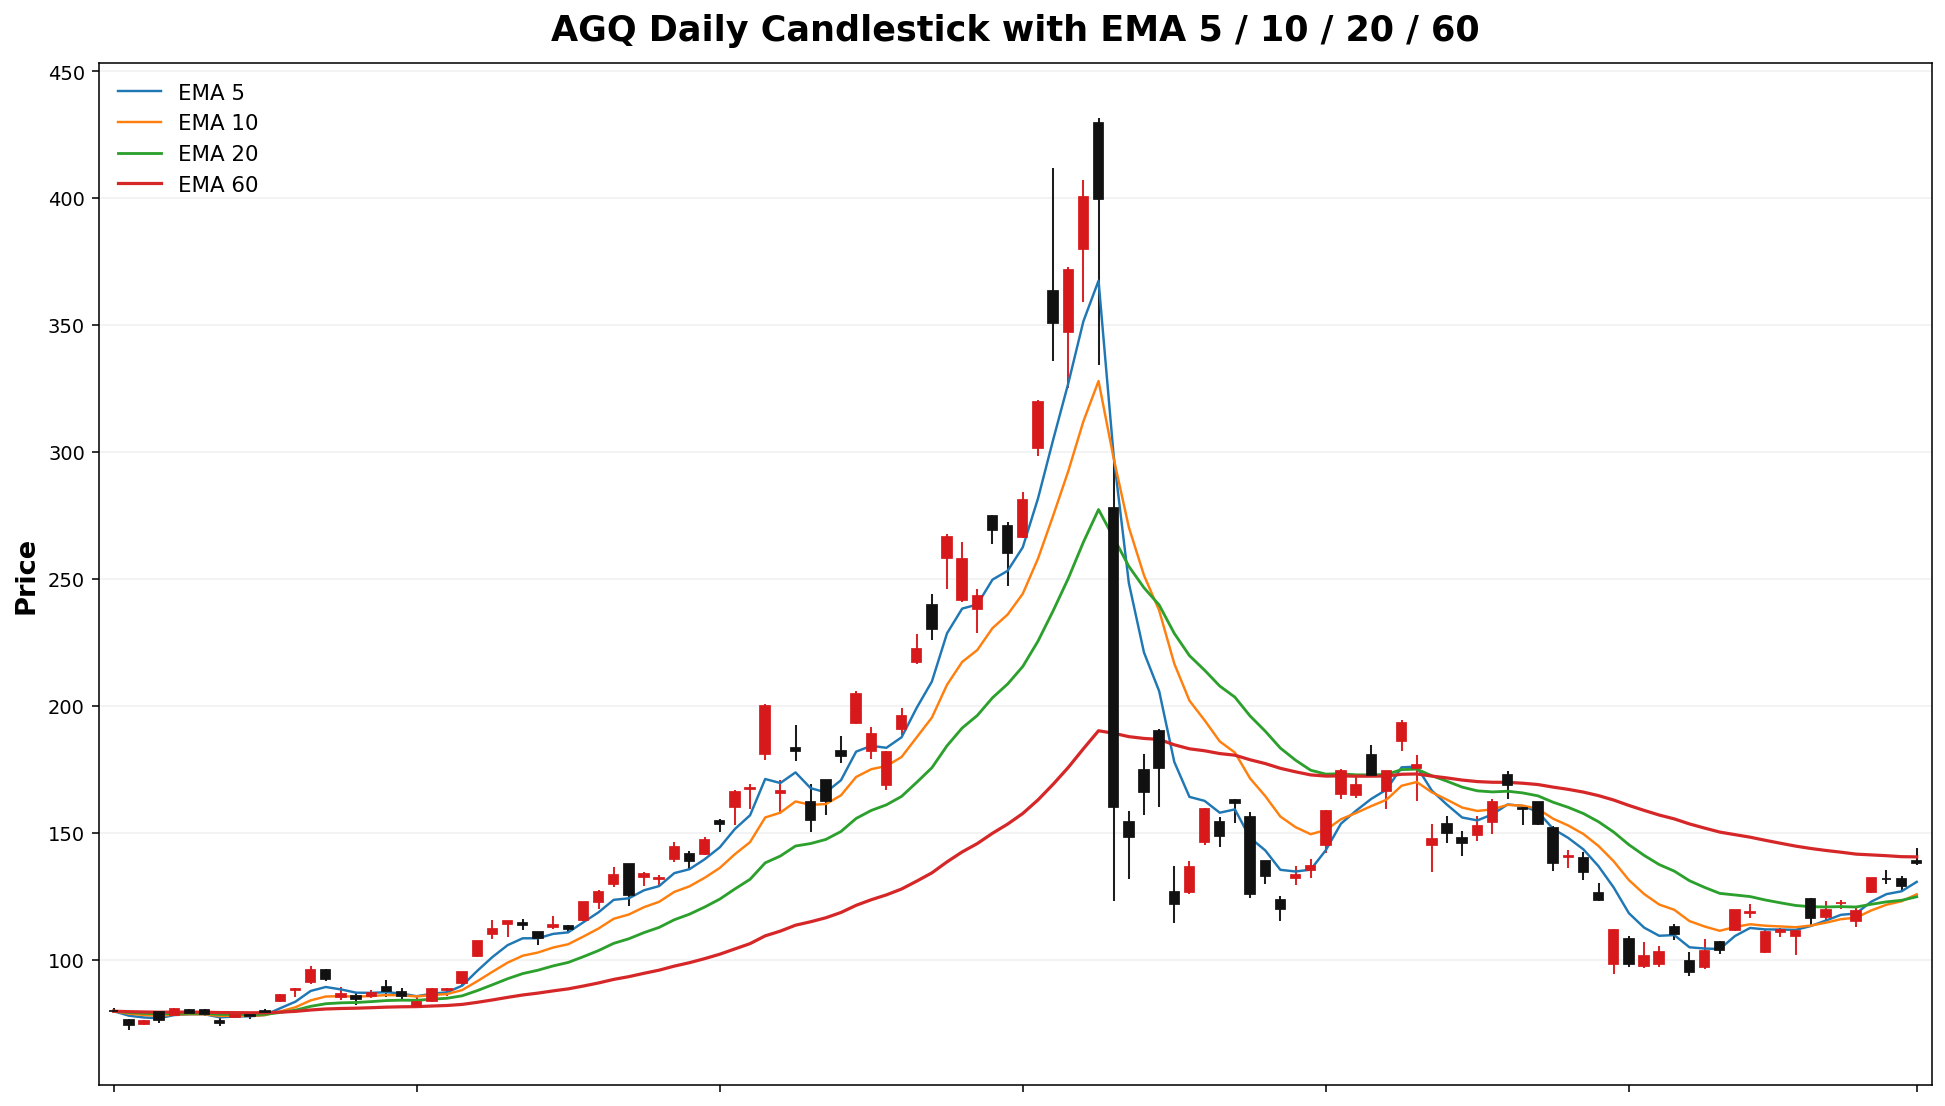
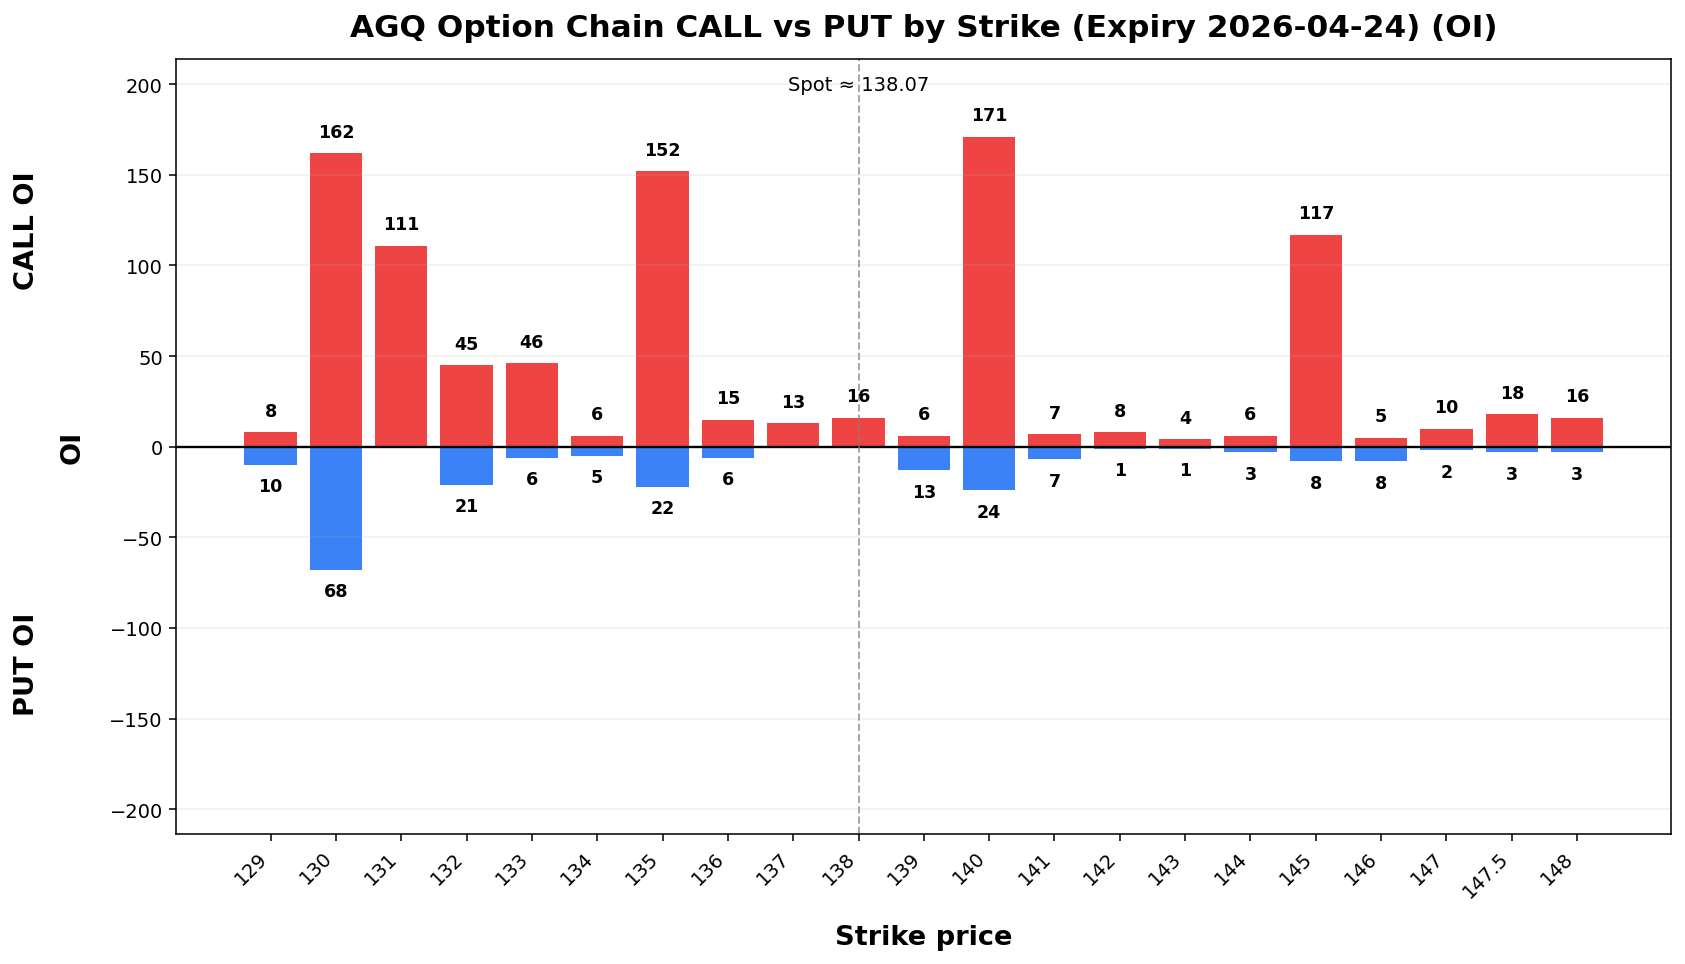
AGQ
Spot: 138.07
Report Time: 2026-04-19 08:14 AM MYT
Regime: TRANSITION
Dealer Gamma: LONG
Term Structure
| Expiry |
DTE |
Forward |
ATM IV |
ATM Straddle |
| 2026-04-24 |
6 |
138.15 |
90.92% |
15.85 |
| 2026-05-01 |
13 |
138.38 |
89.29% |
23.10 |
Weekly Range
| Confidence |
Low |
High |
Width |
| 68% |
120.50 |
155.64 |
35.14 |
| 80% |
115.55 |
160.59 |
45.03 |
| 90% |
109.17 |
166.97 |
57.80 |
| 95% |
103.64 |
172.50 |
68.87 |
Structure & Probabilities
| Support |
Resistance |
Gamma Flip |
Max Pain |
P>Res |
P<Sup |
| 130.00 |
140.00 |
115.13 |
120.00 |
44.8% |
26.5% |
Flow & Skew
| Call Vol |
Put Vol |
Vol P/C |
Call OI |
Put OI |
OI P/C |
Skew |
Skew Bias |
| 3,061 |
1,934 |
0.63 |
2,994 |
2,205 |
0.74 |
-8.59 vol pts |
CALL_SKEW |
Tail Risk
| Q10 |
Q50 |
Q90 |
Down Tail |
Up Tail |
Down/Up |
| 115.50 |
138.02 |
166.30 |
22.57 |
28.23 |
0.80 |
Daily Technicals
| EMA20 |
EMA50 |
VWAP20 |
BB Lower |
BB Mid |
BB Upper |
BB Width |
Vol Ratio |
Path |
| 124.80 |
138.01 |
111.17 |
90.68 |
114.82 |
138.95 |
42.04% |
0.85 |
Sideways / Range |
Day Plan
- 130.00-140.00 range: fade extremes
- > 140.00: chase only if hold + vol
- < 130.00: risk expand; reduce size
- Regime: TRANSITION
- Tech: Sideways / Range
Swing Plan
- Accumulate: 130.00-130.00
- Trim: 140.00-140.00
- Add: close > 140.00
- Cut: close < 130.00
- Best for: transition regime
Raw Text Summary
📌 AGQ @ 138.07 (2026-04-19 08:14 AM MYT)

• Current price is **138.07**. Key support is around **130.00**, and resistance is around **140.00**.
• For the next week, the model’s **68% expected range** is roughly **120.50 to 155.64**.
• A wider **90% range** is about **109.17 to 166.97**.
• Dealer positioning looks **LONG gamma**, so the market behavior is classified as **TRANSITION**.
• The estimated **gamma flip** is near **115.13**. Crossing and holding beyond this area can change the trading behavior.
• Approximate breakout odds: **above resistance 44.8%**, **below support 26.5%** by the target horizon.
• Options skew is tilted toward **calls**, which suggests upside speculation is relatively stronger.
• Near-term implied volatility is higher than the next expiry (**IV1 90.92% vs IV2 89.29%**), which suggests **near-term event stress / backwardation**.
• On the daily chart, the stock currently looks like **Sideways / Range**.
• The implied distribution shows **more upside tail potential** than downside tail risk.
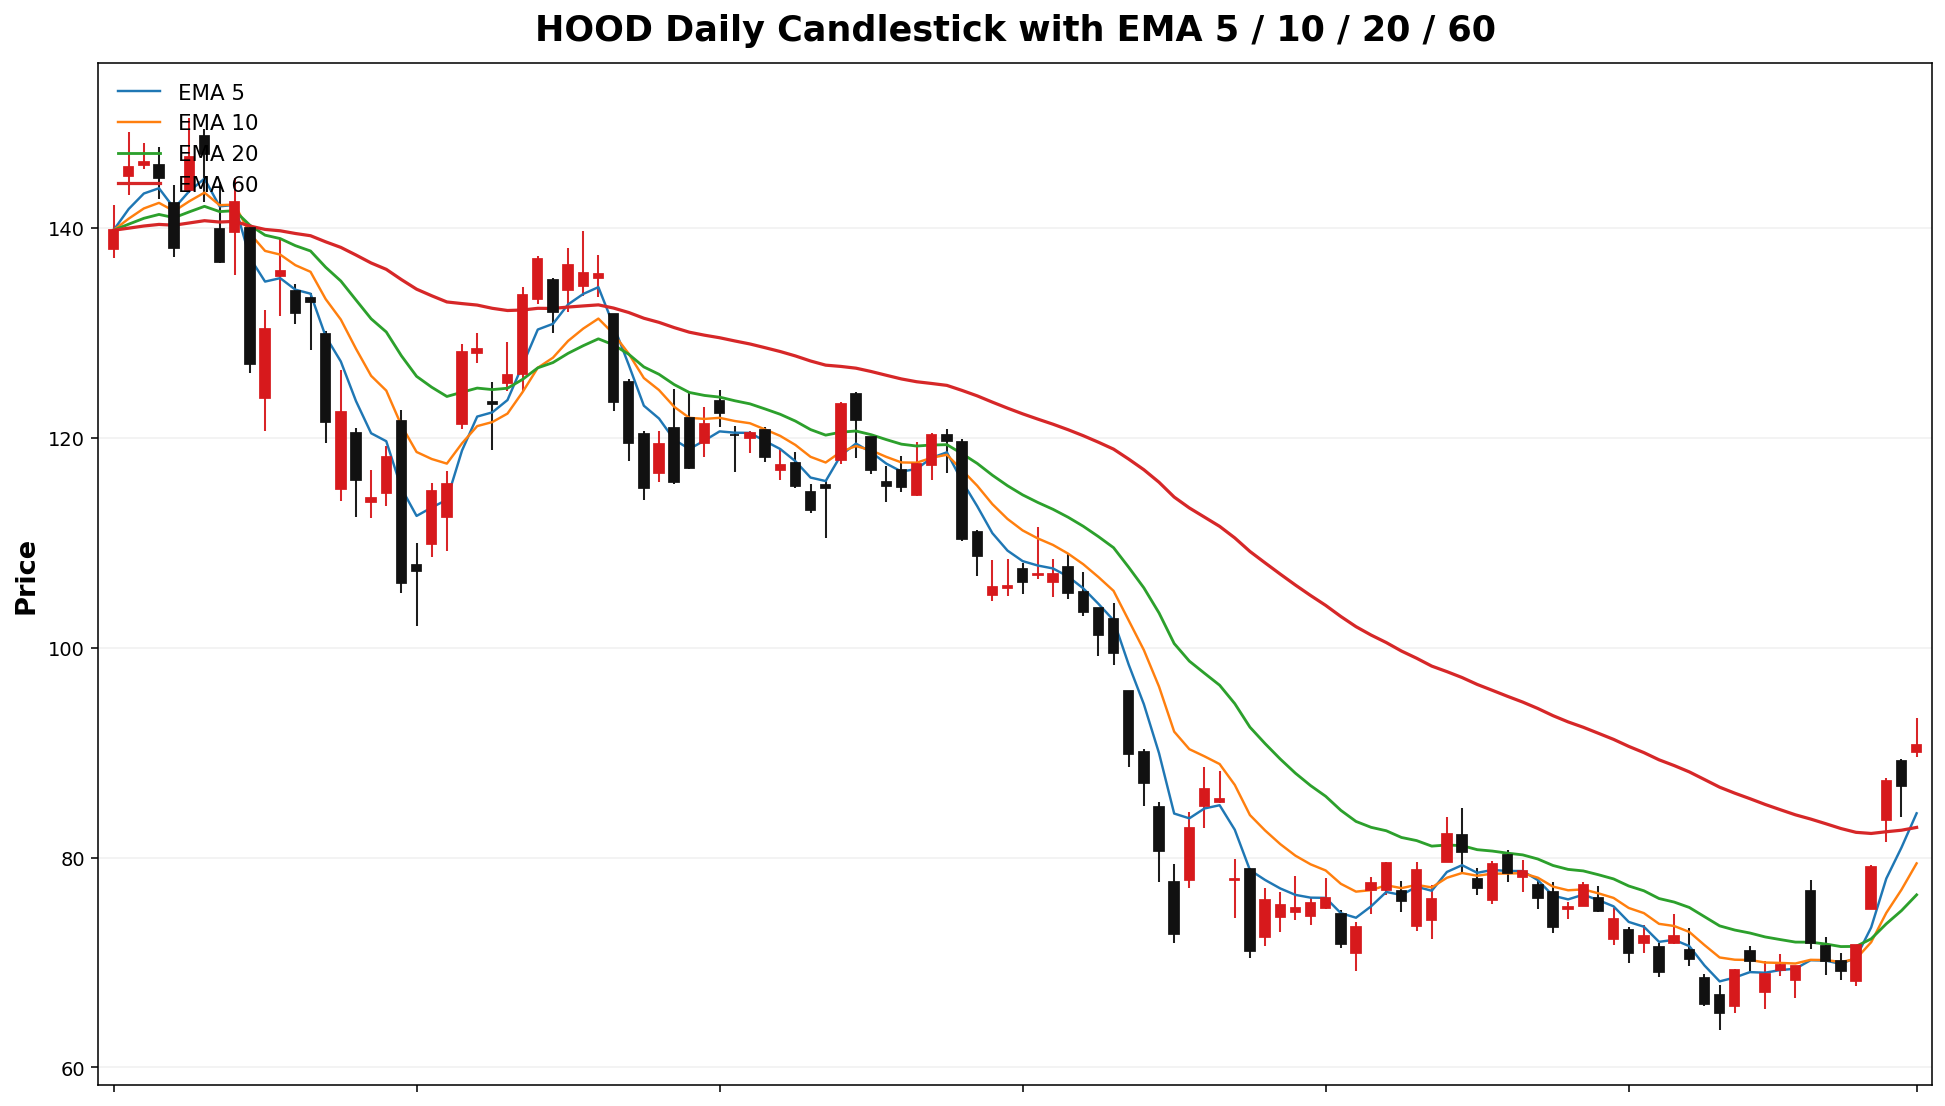
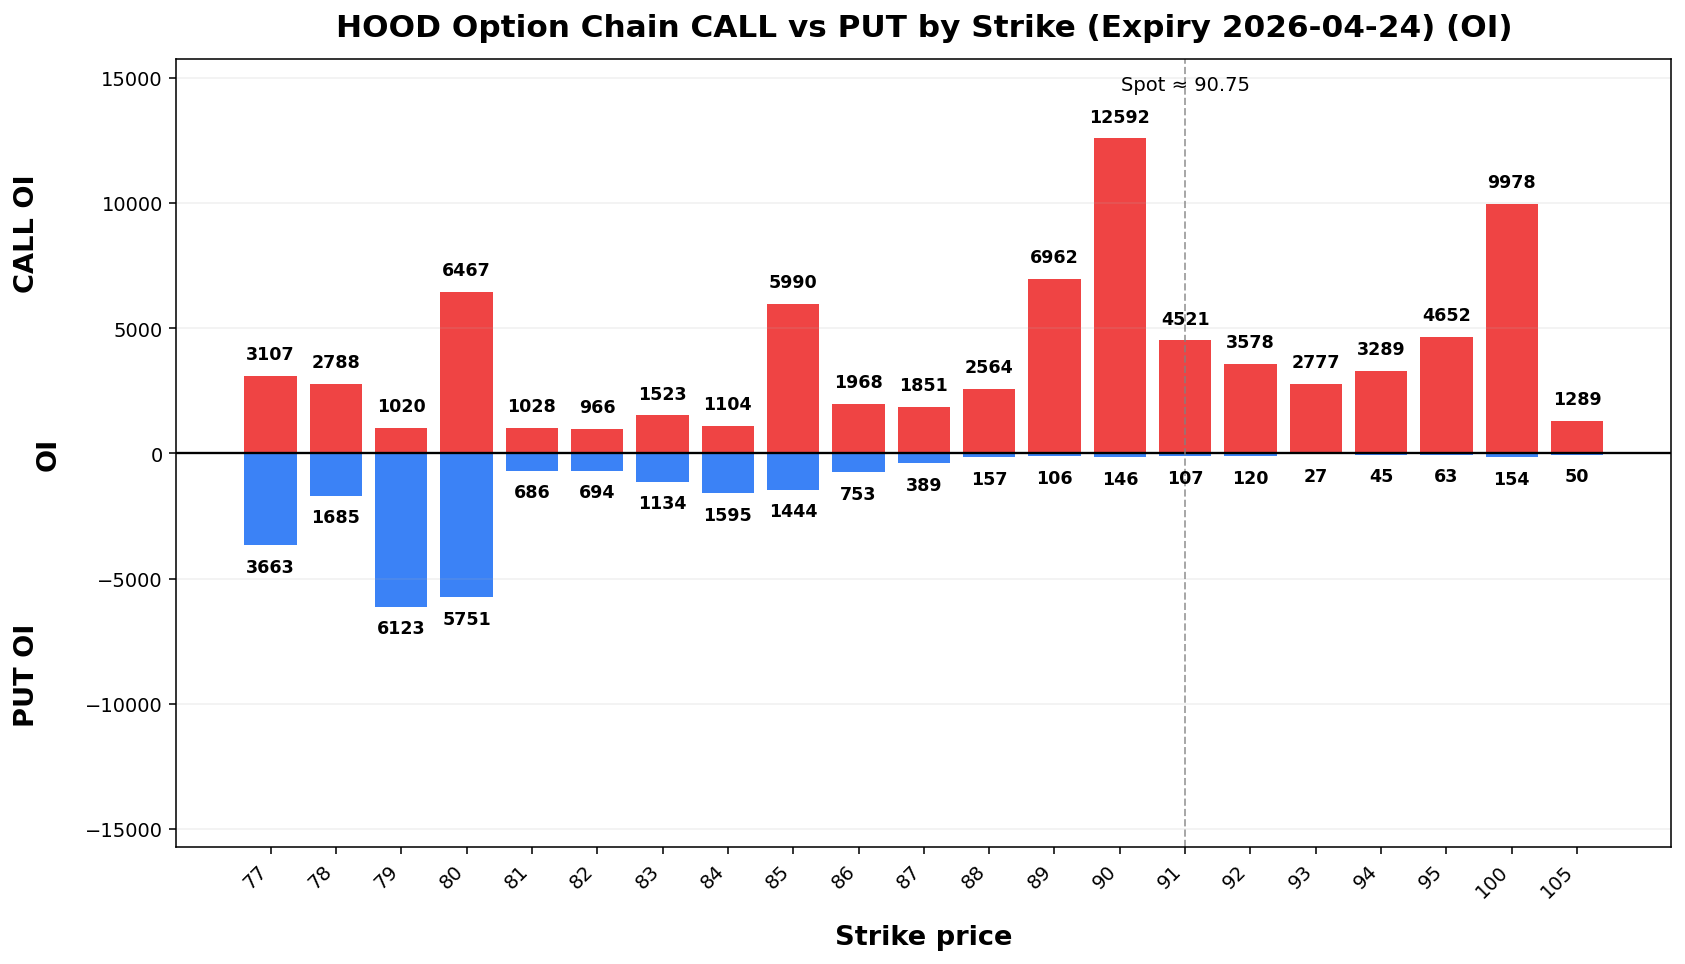
HOOD
Spot: 90.75
Report Time: 2026-04-19 08:14 AM MYT
Regime: TRANSITION
Dealer Gamma: LONG
Term Structure
| Expiry |
DTE |
Forward |
ATM IV |
ATM Straddle |
| 2026-04-24 |
6 |
90.88 |
53.19% |
6.09 |
| 2026-05-01 |
13 |
90.98 |
63.81% |
10.85 |
Weekly Range
| Confidence |
Low |
High |
Width |
| 68% |
83.43 |
98.07 |
14.63 |
| 80% |
81.37 |
100.13 |
18.75 |
| 90% |
78.71 |
102.79 |
24.07 |
| 95% |
76.41 |
105.09 |
28.68 |
Structure & Probabilities
| Support |
Resistance |
Gamma Flip |
Max Pain |
P>Res |
P<Sup |
| 90.00 |
91.00 |
75.15 |
78.00 |
48.9% |
38.6% |
Flow & Skew
| Call Vol |
Put Vol |
Vol P/C |
Call OI |
Put OI |
OI P/C |
Skew |
Skew Bias |
| 90,494 |
55,888 |
0.62 |
99,885 |
59,625 |
0.60 |
-3.03 vol pts |
CALL_SKEW |
Tail Risk
| Q10 |
Q50 |
Q90 |
Down Tail |
Up Tail |
Down/Up |
| 74.20 |
89.60 |
101.12 |
16.55 |
10.37 |
1.60 |
Daily Technicals
| EMA20 |
EMA50 |
VWAP20 |
BB Lower |
BB Mid |
BB Upper |
BB Width |
Vol Ratio |
Path |
| 76.44 |
80.28 |
75.17 |
58.74 |
73.05 |
87.37 |
39.18% |
1.53 |
Sideways / Range |
Day Plan
- 90.00-91.00 range: fade extremes
- > 91.00: chase only if hold + vol
- < 90.00: risk expand; reduce size
- Regime: TRANSITION
- Tech: Sideways / Range
Swing Plan
- Accumulate: 90.00-90.00
- Trim: 91.00-91.00
- Add: close > 91.00
- Cut: close < 90.00
- Best for: transition regime
Raw Text Summary
📌 HOOD @ 90.75 (2026-04-19 08:14 AM MYT)

• Current price is **90.75**. Key support is around **90.00**, and resistance is around **91.00**.
• For the next week, the model’s **68% expected range** is roughly **83.43 to 98.07**.
• A wider **90% range** is about **78.71 to 102.79**.
• Dealer positioning looks **LONG gamma**, so the market behavior is classified as **TRANSITION**.
• The estimated **gamma flip** is near **75.15**. Crossing and holding beyond this area can change the trading behavior.
• Approximate breakout odds: **above resistance 48.9%**, **below support 38.6%** by the target horizon.
• Options skew is tilted toward **calls**, which suggests upside speculation is relatively stronger.
• Near-term implied volatility is lower than the next expiry (**IV1 53.19% vs IV2 63.81%**), which suggests a **contango / calmer front expiry** setup.
• Recent volume is **1.53x** the 20-day average, which supports stronger continuation or breakout follow-through.
• On the daily chart, the stock currently looks like **Sideways / Range**.
• The implied distribution shows **heavier downside tail risk** than upside tail potential.
USO
Spot: 116.04
Report Time: 2026-04-19 08:14 AM MYT
Regime: TREND
Dealer Gamma: SHORT
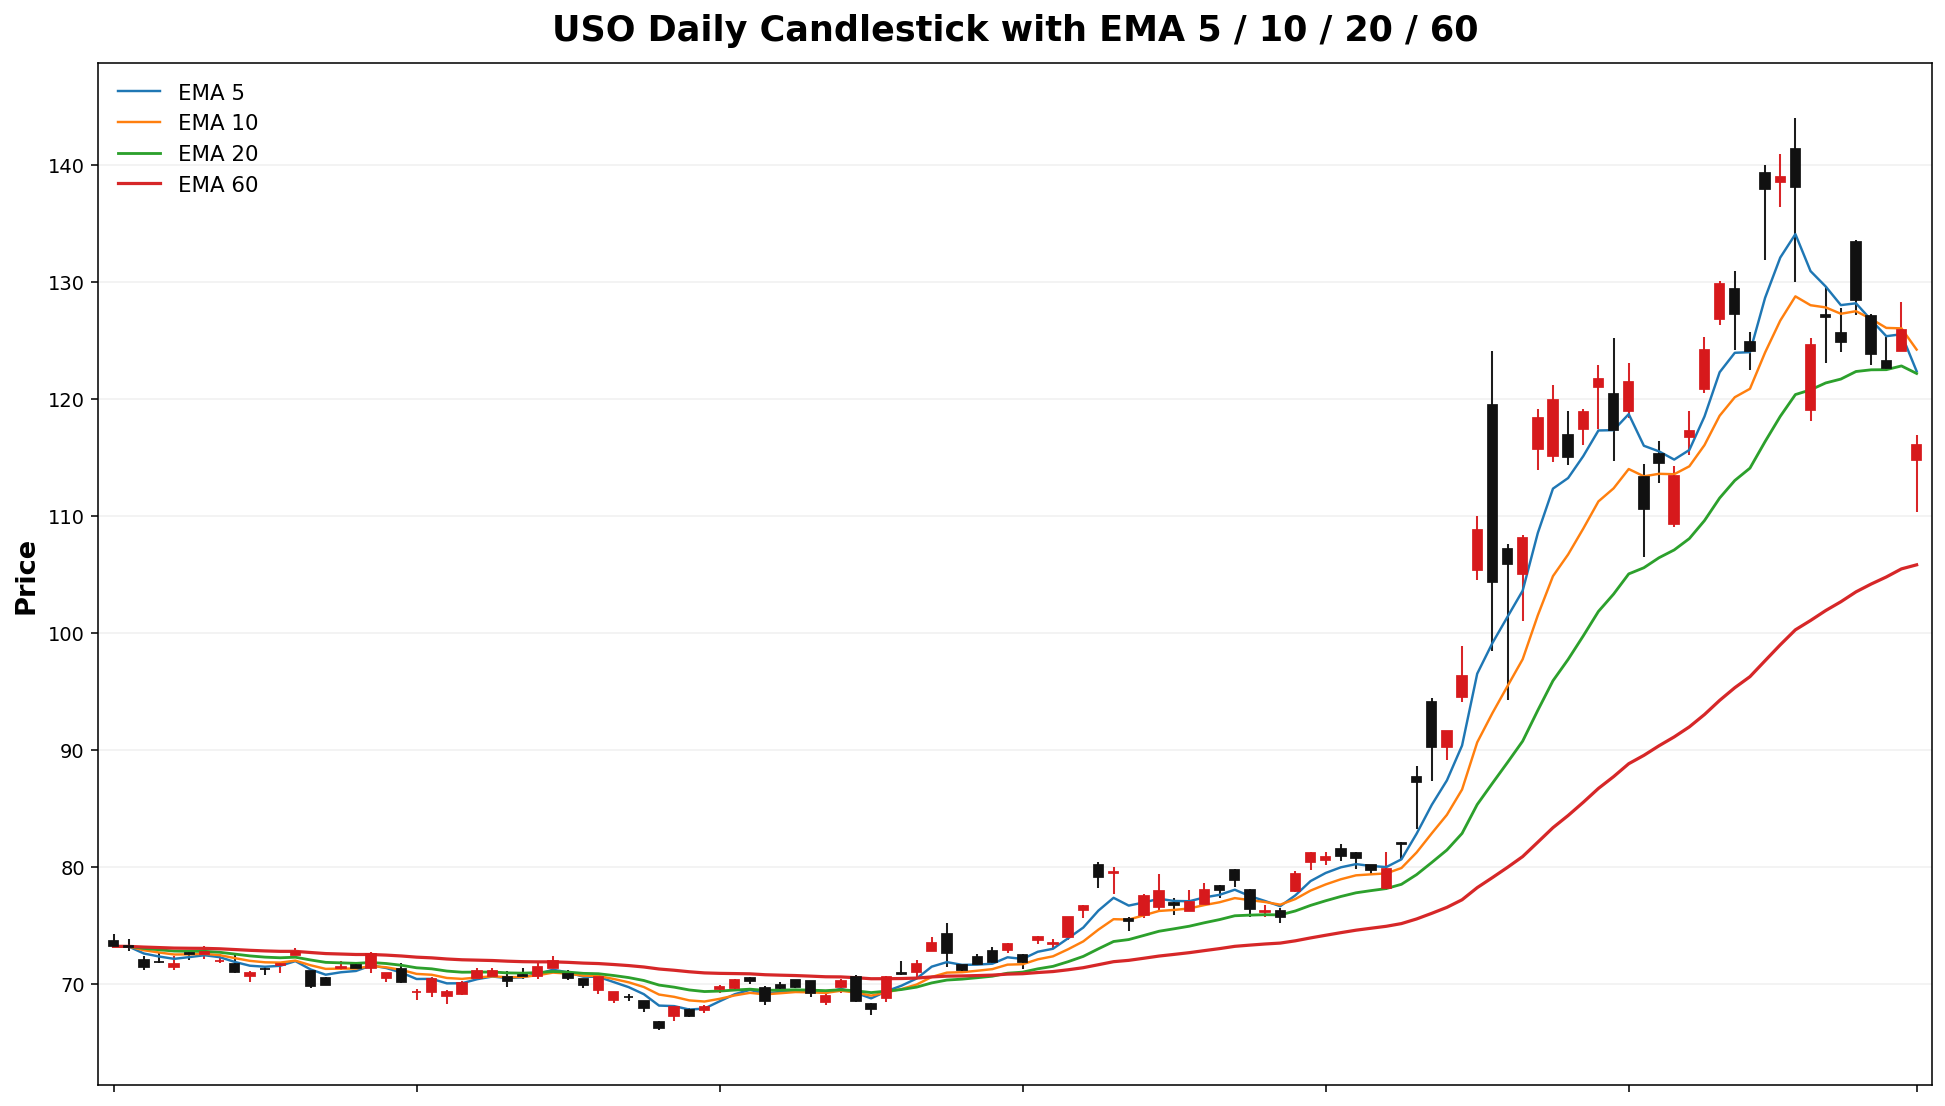
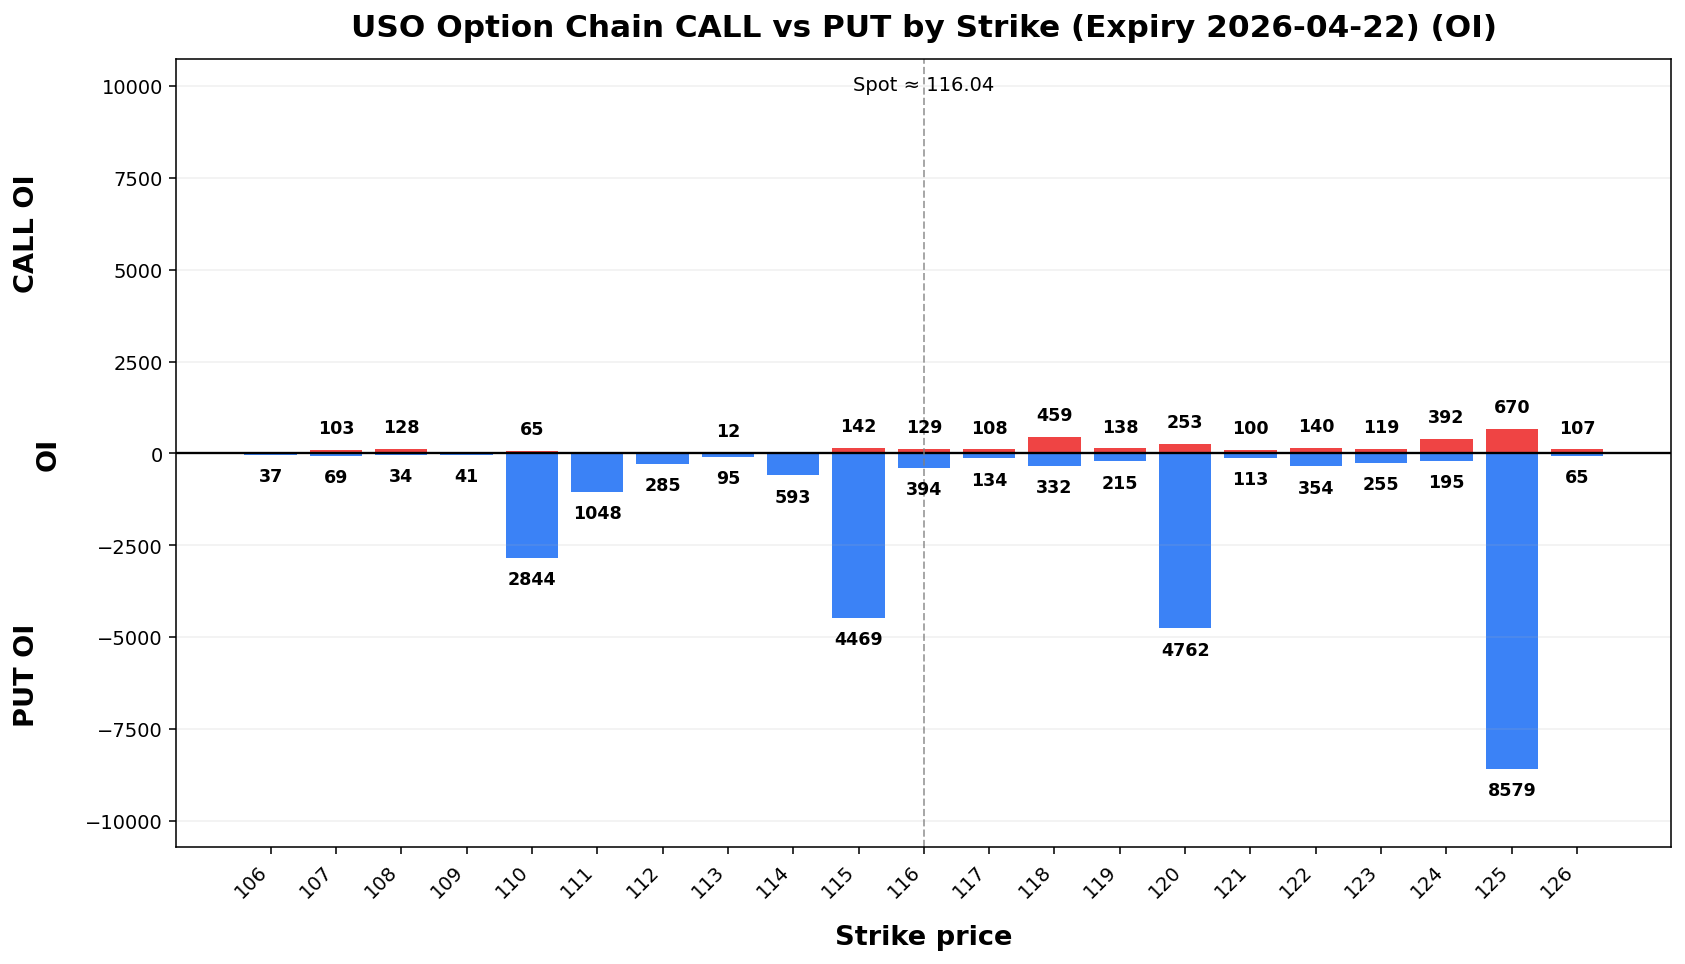
Term Structure
| Expiry |
DTE |
Forward |
ATM IV |
ATM Straddle |
| 2026-04-22 |
4 |
116.09 |
85.29% |
10.12 |
| 2026-04-24 |
6 |
116.03 |
75.25% |
11.03 |
Weekly Range
| Confidence |
Low |
High |
Width |
| 68% |
104.42 |
127.66 |
23.25 |
| 80% |
101.14 |
130.94 |
29.79 |
| 90% |
96.92 |
135.16 |
38.24 |
| 95% |
93.26 |
138.82 |
45.56 |
Structure & Probabilities
| Support |
Resistance |
Gamma Flip |
Max Pain |
P>Res |
P<Sup |
| 115.00 |
120.00 |
137.81 |
100.00 |
48.7% |
51.6% |
Flow & Skew
| Call Vol |
Put Vol |
Vol P/C |
Call OI |
Put OI |
OI P/C |
Skew |
Skew Bias |
| 28,646 |
28,360 |
0.99 |
18,391 |
29,016 |
1.58 |
-19.14 vol pts |
CALL_SKEW |
Tail Risk
| Q10 |
Q50 |
Q90 |
Down Tail |
Up Tail |
Down/Up |
| 106.55 |
116.06 |
133.57 |
9.49 |
17.53 |
0.54 |
Daily Technicals
| EMA20 |
EMA50 |
VWAP20 |
BB Lower |
BB Mid |
BB Upper |
BB Width |
Vol Ratio |
Path |
| 122.16 |
109.24 |
123.40 |
108.72 |
124.53 |
140.34 |
25.39% |
0.94 |
Sideways / Range |
Day Plan
- 115.00-120.00 range: fade extremes
- > 120.00: chase only if hold + vol
- < 115.00: risk expand; reduce size
- Regime: TREND
- Tech: Sideways / Range
Swing Plan
- Accumulate: 115.00-115.00
- Trim: 120.00-120.00
- Add: close > 120.00
- Cut: close < 115.00
- Best for: trend regime
Raw Text Summary
📌 USO @ 116.04 (2026-04-19 08:14 AM MYT)

• Current price is **116.04**. Key support is around **115.00**, and resistance is around **120.00**.
• For the next week, the model’s **68% expected range** is roughly **104.42 to 127.66**.
• A wider **90% range** is about **96.92 to 135.16**.
• Dealer positioning looks **SHORT gamma**, so the market behavior is classified as **TREND**.
• The estimated **gamma flip** is near **137.81**. Crossing and holding beyond this area can change the trading behavior.
• Approximate breakout odds: **above resistance 48.7%**, **below support 51.6%** by the target horizon.
• Options skew is tilted toward **calls**, which suggests upside speculation is relatively stronger.
• Near-term implied volatility is higher than the next expiry (**IV1 85.29% vs IV2 75.25%**), which suggests **near-term event stress / backwardation**.
• On the daily chart, the stock currently looks like **Sideways / Range**.
• The implied distribution shows **more upside tail potential** than downside tail risk.
ASTS
Spot: 85.53
Report Time: 2026-04-19 08:14 AM MYT
Regime: TREND
Dealer Gamma: SHORT
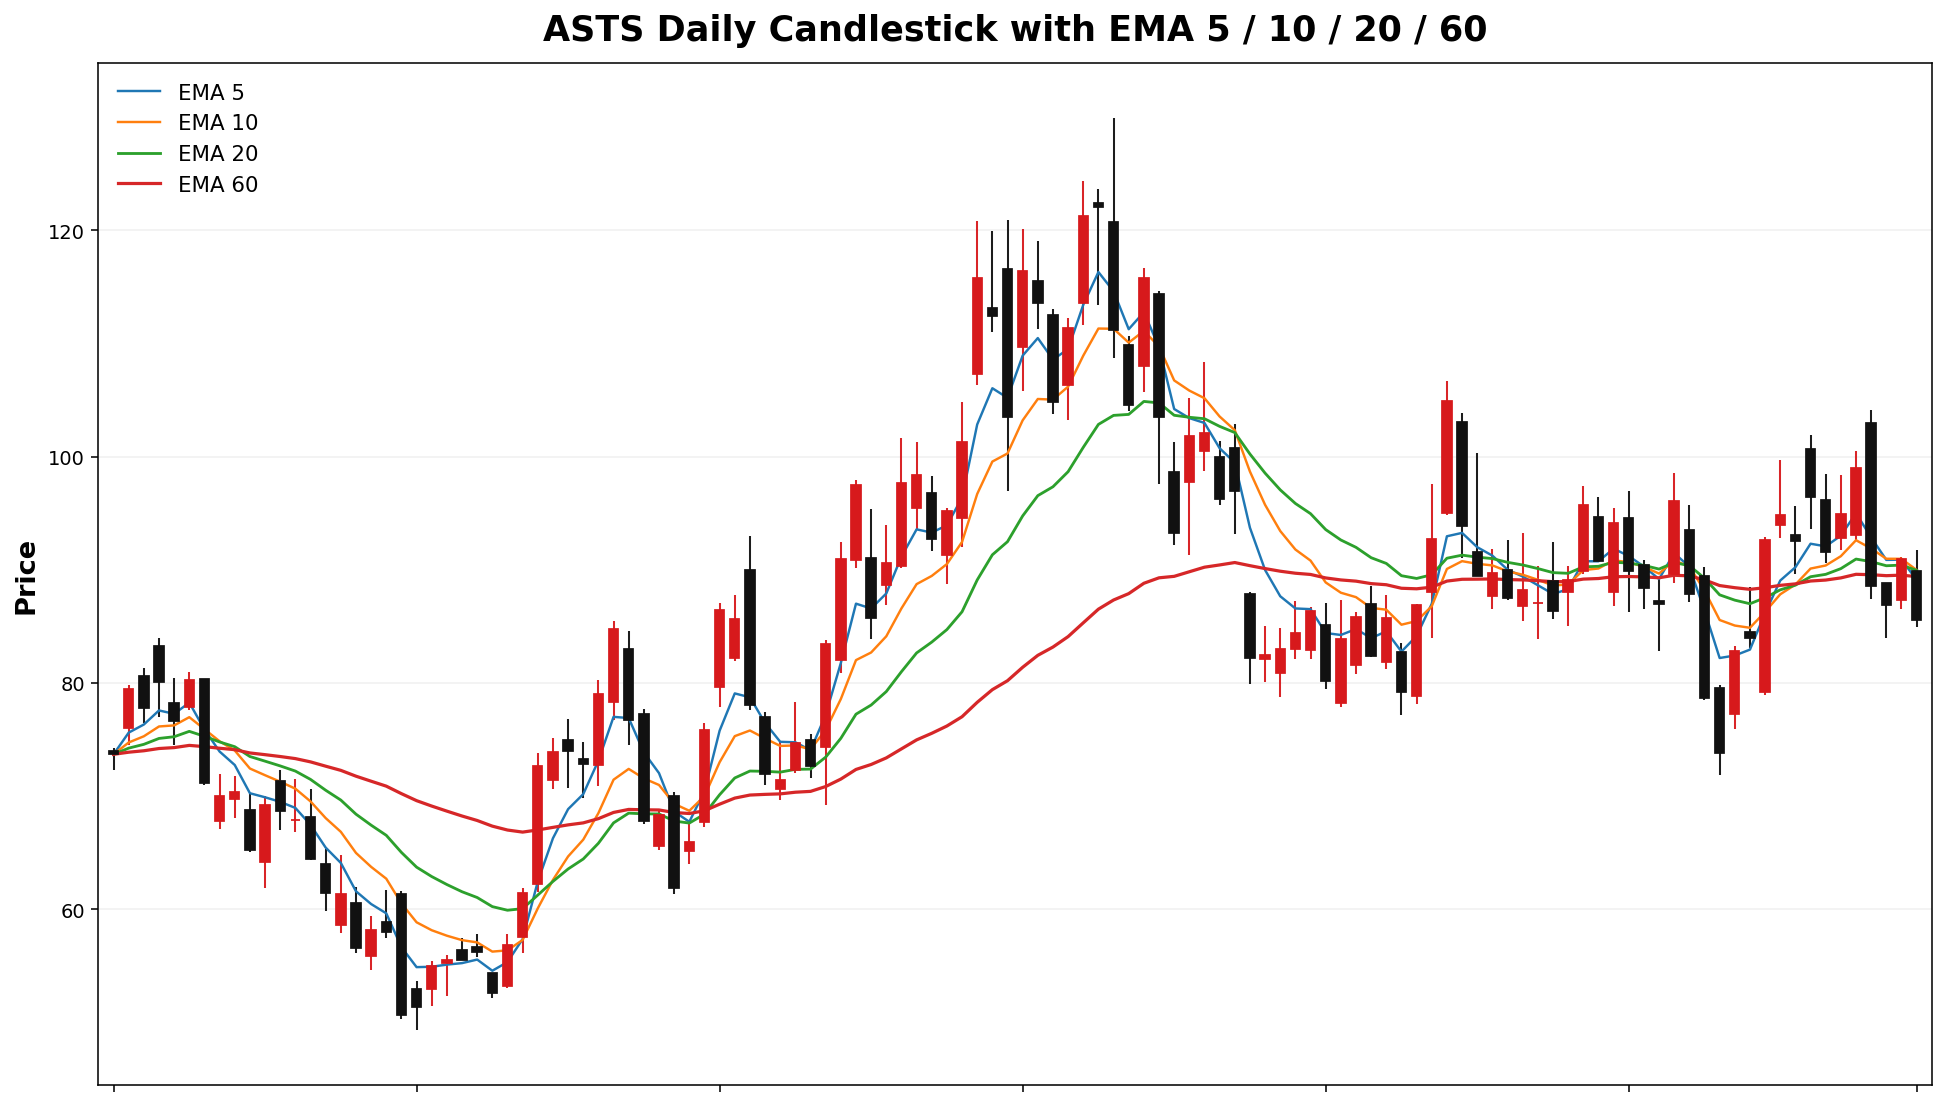
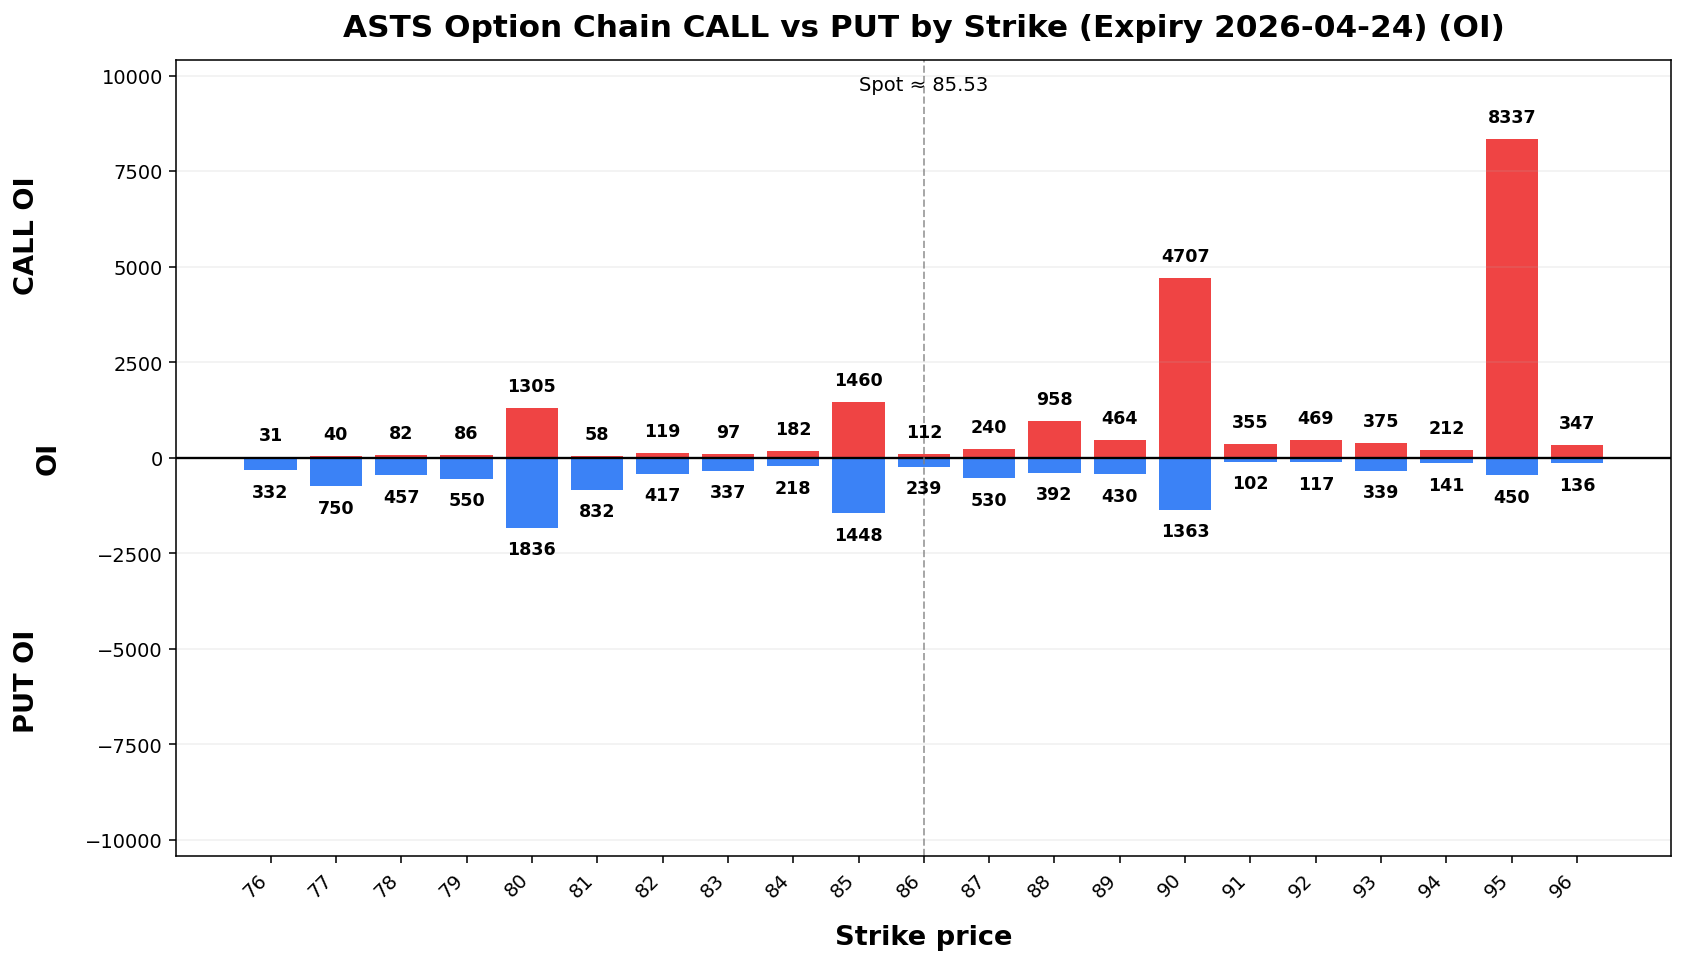
Term Structure
| Expiry |
DTE |
Forward |
ATM IV |
ATM Straddle |
| 2026-04-24 |
6 |
85.68 |
91.90% |
9.93 |
| 2026-05-01 |
13 |
85.77 |
86.11% |
13.80 |
Weekly Range
| Confidence |
Low |
High |
Width |
| 68% |
74.70 |
96.36 |
21.65 |
| 80% |
71.66 |
99.40 |
27.75 |
| 90% |
67.72 |
103.34 |
35.62 |
| 95% |
64.31 |
106.75 |
42.44 |
Structure & Probabilities
| Support |
Resistance |
Gamma Flip |
Max Pain |
P>Res |
P<Sup |
| 85.00 |
90.00 |
76.17 |
88.00 |
45.1% |
53.4% |
Flow & Skew
| Call Vol |
Put Vol |
Vol P/C |
Call OI |
Put OI |
OI P/C |
Skew |
Skew Bias |
3,35959,393 |
4,397 |
1.31 |
40,556 |
34,62128,387 |
0.8548 |
37,461 |
22,199 |
0.59 |
-7.9113.09 vol pts |
CALL_SKEW |
Tail Risk
| Q10 |
Q50 |
Q90 |
Down Tail |
Up Tail |
Down/Up |
27.1168.15 |
34.2384.04 |
40.83102.47 |
7.5617.38 |
6.1616.94 |
1.2303 |
Daily Technicals
| EMA20 |
EMA50 |
VWAP20 |
BB Lower |
BB Mid |
BB Upper |
BB Width |
Vol Ratio |
Path |
31.6589.95 |
89.69 |
89.58 |
76.71 |
89.12 |
101.54 |
27.9887% |
31.781.32 |
23.05 | Sideways 31.22 | / 39.40 |
52.37% |
0.49 |
UP trend (expanding)Range |
Day Plan
31.85.00-35.90.00 range: fade extremes- >
35.90.00: chase only if hold + vol
- <
31.85.00: risk expand; reduce size
- Regime:
TRANSITIONTREND
- Tech:
UPSideways trend/ (expanding)Range
Swing Plan
- Accumulate:
31.85.00-31.85.00
- Trim:
35.90.00-35.90.00
- Add: close >
35.90.00
- Cut: close <
31.85.00
- Best for:
transitiontrend regime
Raw Text Summary
📌 PLASTS @ 34.6785.53 (2026-04-1219 08:4814 AM MYT)

• Current price is **34.67*85.53**. Key support is around **31.85.00**, and resistance is around **35.90.00**.
• For the next week, the model’s **68% expected range** is roughly **30.5274.70 to 38.82*96.36**.
• A wider **90% range** is about **27.8467.72 to 41.50*103.34**.
• Dealer positioning looks **LONGSHORT gamma**, so the market behavior is classified as **TRANSITION*TREND**.
• The estimated **gamma flip** is near **23.53*76.17**. Crossing and holding beyond this area can change the trading behavior.
• Approximate breakout odds: **above resistance 42.8%45.1%**, **below support 14.53.4%** by the target horizon.
• Options skew is tilted toward **calls**, which suggests upside speculation is relatively stronger.
• Near-term implied volatility is higher than the next expiry (**IV1 86.98%91.90% vs IV2 81.66%86.11%**), which suggests **near-term event stress / backwardation**.
• Recent volume is only **0.49x** the 20-day average, so breakouts may be less reliable unless volume improves.
• On the daily chart, the stock currently looks like **UP trend (expanding)**.
• The implied distribution shows **heavier downside tail risk** than upside tail potential.
RDDT
Spot: 139.73
Report Time: 2026-04-12 08:48 AM MYT
Regime: TRANSITION
Dealer Gamma: LONG
Term Structure
Expiry |
DTE |
Forward |
ATM IV |
ATM Straddle |
|---|
2026-04-17 |
6 |
139.94 |
58.92% |
10.38 |
2026-04-24 |
13 |
139.94 |
58.78% |
15.38 |
Weekly Range
Confidence |
Low |
High |
Width |
|---|
68% |
128.14 |
151.32 |
23.17 |
80% |
124.88 |
154.58 |
29.70 |
90% |
120.67 |
158.79 |
38.12 |
95% |
117.02 |
162.44 |
45.42 |
Structure & Probabilities
Support |
Resistance |
Gamma Flip |
Max Pain |
P>Res |
P<Sup |
|---|
125.00 |
145.00 |
132.66 |
140.00 |
23.6% |
8.9% |
Flow & Skew
Call Vol |
Put Vol |
Vol P/C |
Call OI |
Put OI |
OI P/C |
Skew |
Skew Bias |
|---|
7,464 |
4,685 |
0.63 |
38,104 |
19,864 |
0.52 |
7.47 vol pts |
PUT_SKEW |
Tail Risk
Q10 |
Q50 |
Q90 |
Down Tail |
Up Tail |
Down/Up |
|---|
124.61 |
139.74 |
155.16 |
15.12 |
15.43 |
0.98 |
Daily Technicals
EMA20 |
EMA50 |
VWAP20 |
BB Lower |
BB Mid |
BB Upper |
BB Width |
Vol Ratio |
Path |
|---|
138.44 |
151.26 |
136.41 |
124.36 |
136.84 |
149.32 |
18.24% |
0.74 |
Sideways / Range |
Day Plan
125.00-145.00 range: fade extremes
> 145.00: chase only if hold + vol
< 125.00: risk expand; reduce size
Regime: TRANSITION
Tech: Sideways / Range
Swing Plan
Accumulate: 125.00-125.00
Trim: 145.00-145.00
Add: close > 145.00
Cut: close < 125.00
Best for: transition regime
Raw Text Summary
📌 RDDT @ 139.73 (2026-04-12 08:48 AM MYT)

• Current price is **139.73**. Key support is around **125.00**, and resistance is around **145.00**.
• For the next week, the model’s **68% expected range** is roughly **128.14 to 151.32**.
• A wider **90% range** is about **120.67 to 158.79**.
• Dealer positioning looks **LONG gamma**, so the market behavior is classified as **TRANSITION**.
• The estimated **gamma flip** is near **132.66**. Crossing and holding beyond this area can change the trading behavior.
• Approximate breakout odds: **above resistance 23.6%**, **below support 8.9%** by the target horizon.
• Options skew is tilted toward **puts**, which suggests traders are paying more for downside protection.
• Near-term implied volatility is higher than the next expiry (**IV1 58.92% vs IV2 58.78%**), which suggests **near-term event stress / backwardation**.
• Recent volume is only **0.74x** the 20-day average, so breakouts may be less reliable unless volume improves.
• On the daily chart, the stock currently looks like **Sideways / Range**.
• The implied distribution is **fairly balanced** between upside and downside tails.
CRDOIREN
Spot: 119.5948.12
Report Time: 2026-04-1219 08:4814 AM MYT
Regime: TRANSITION
Dealer Gamma: LONG
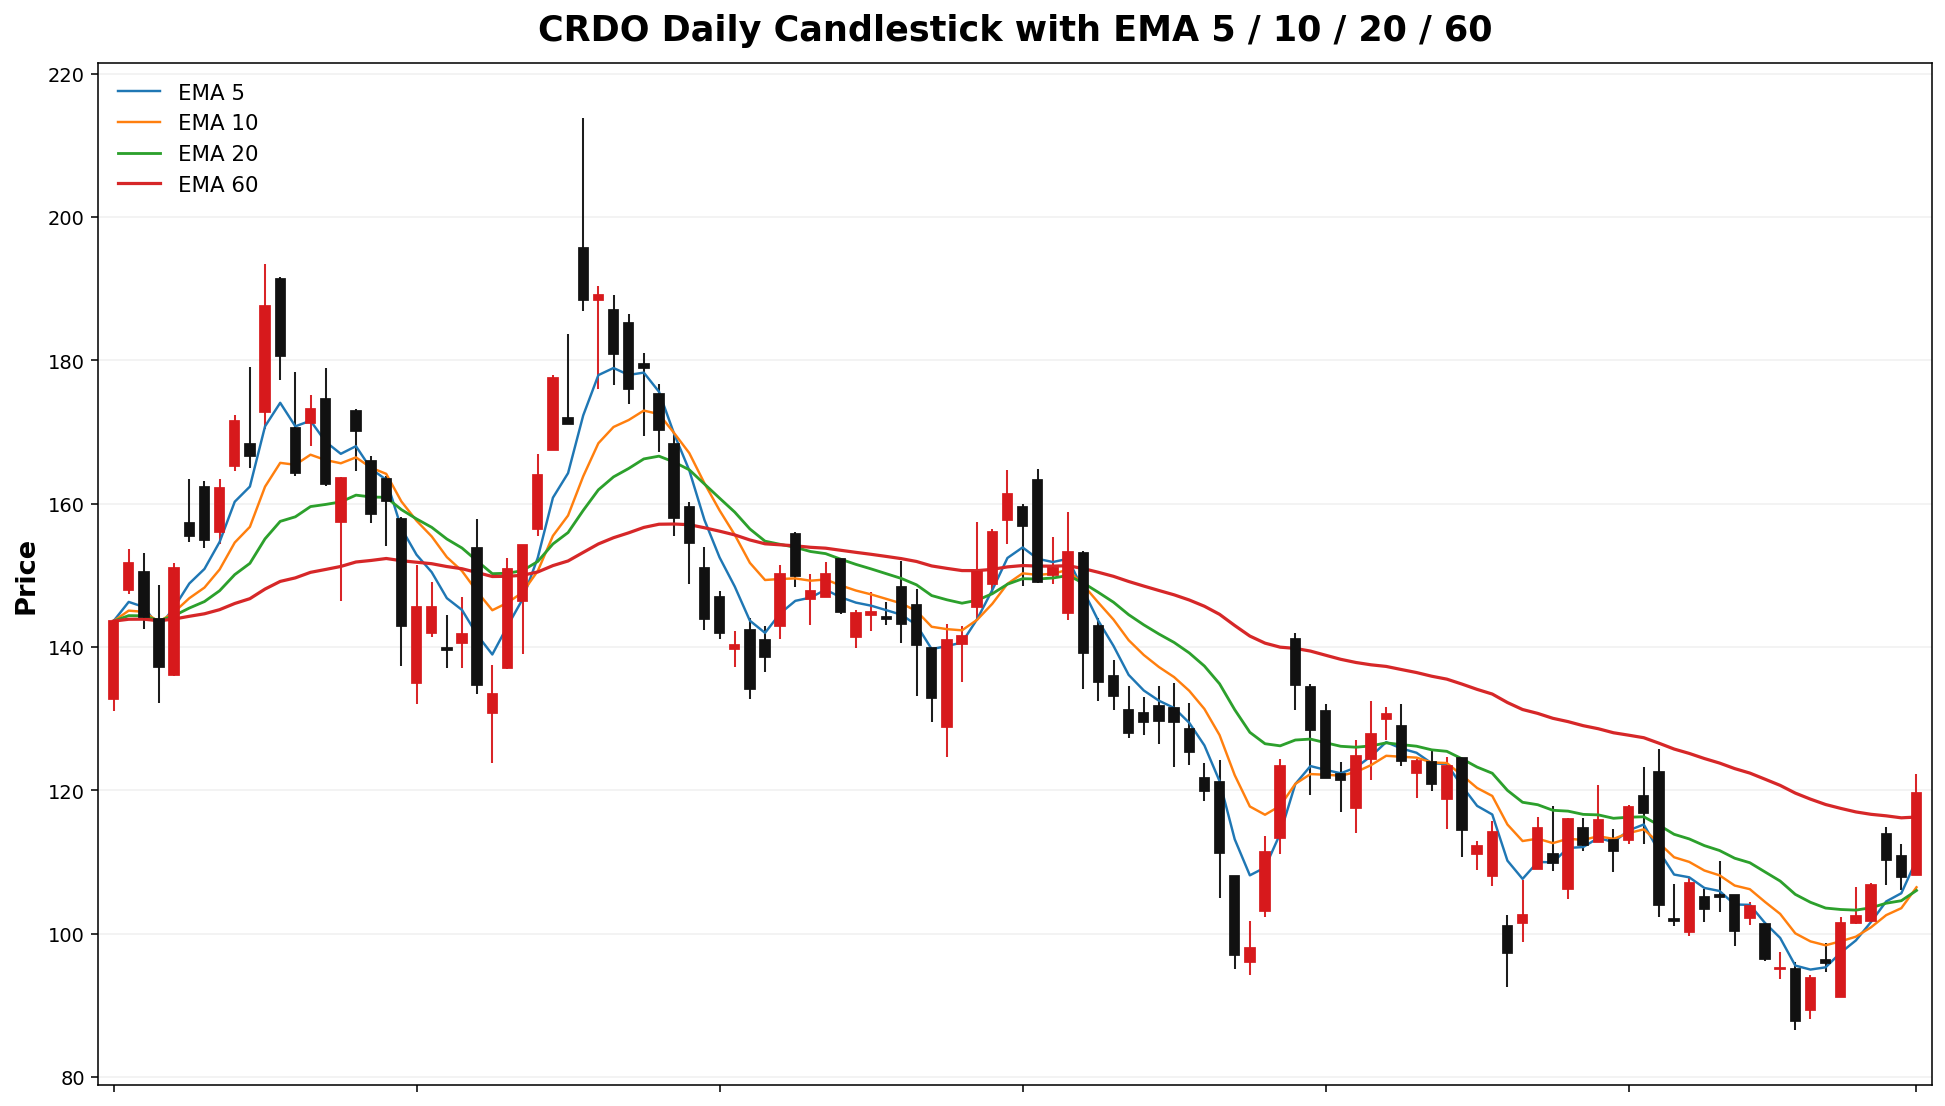
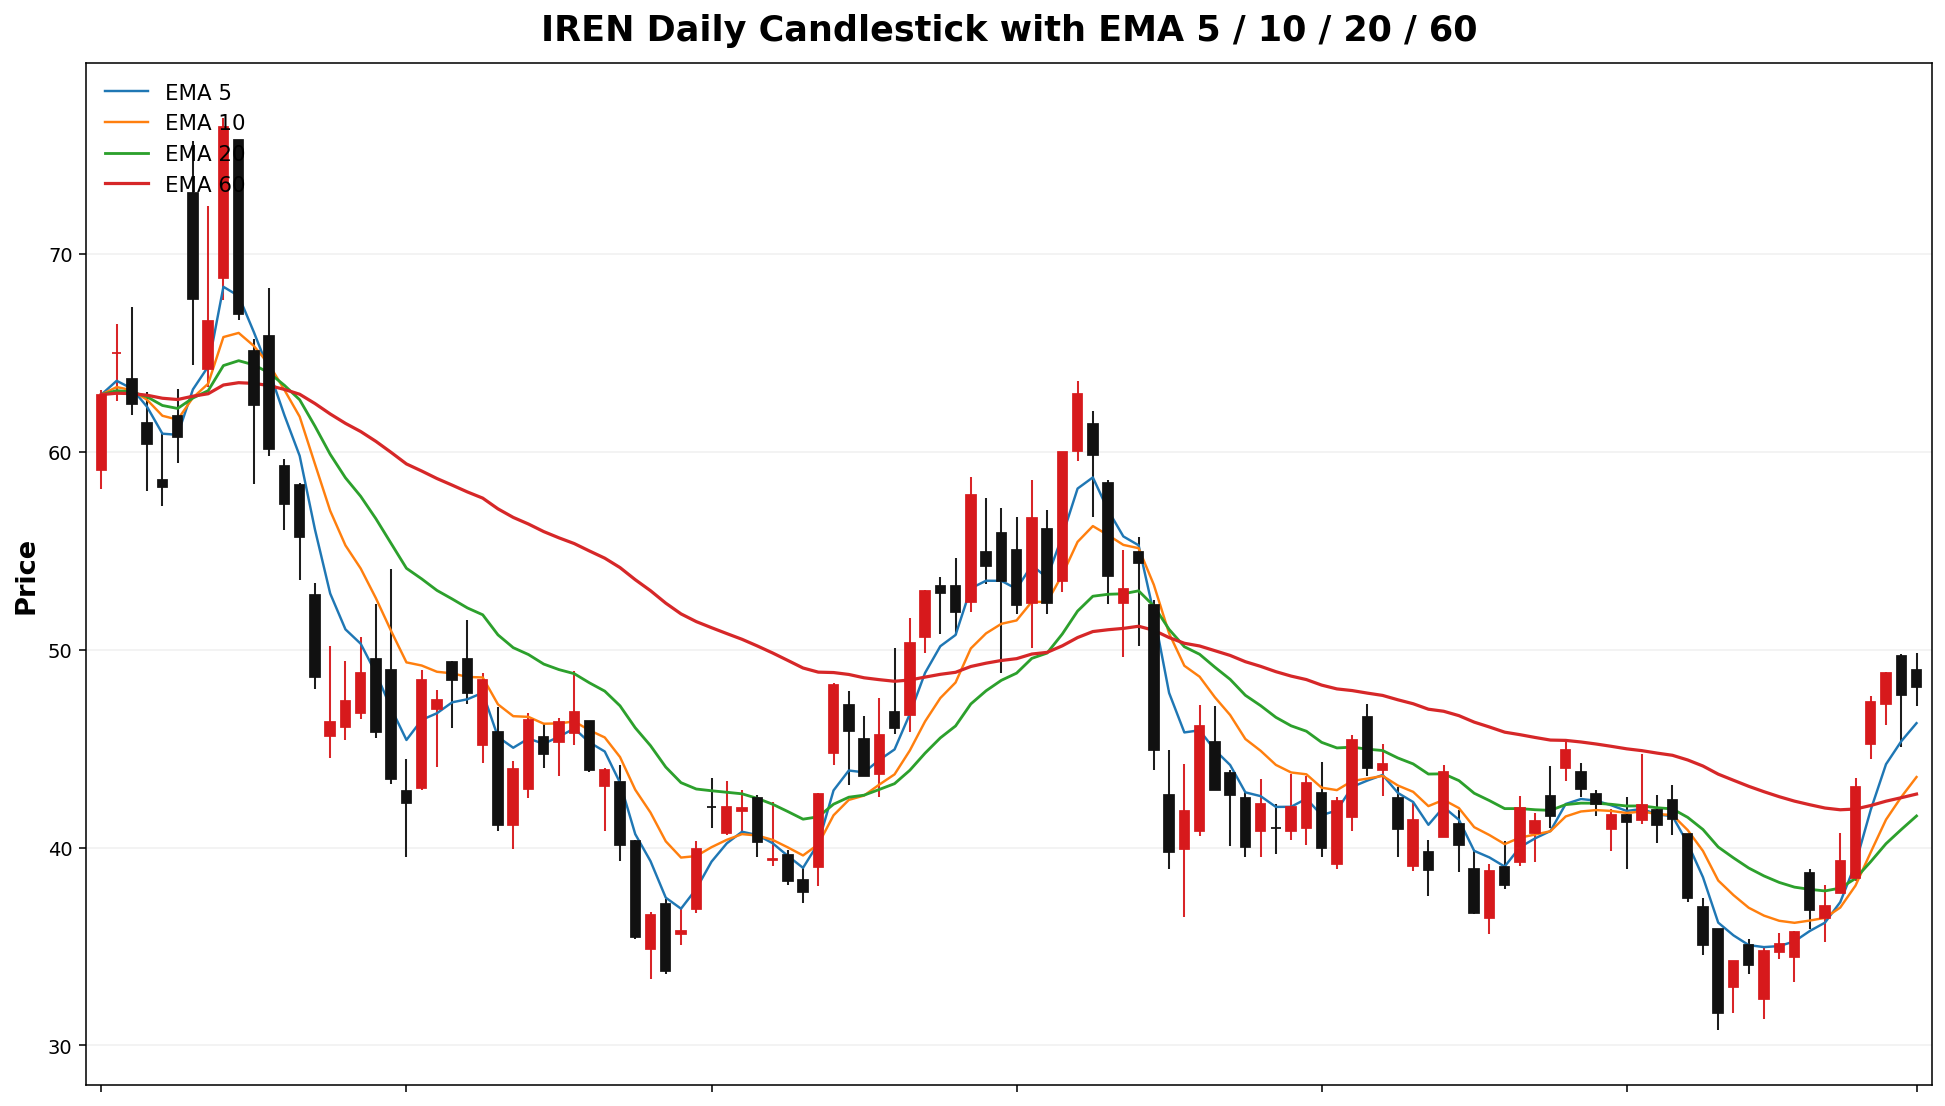
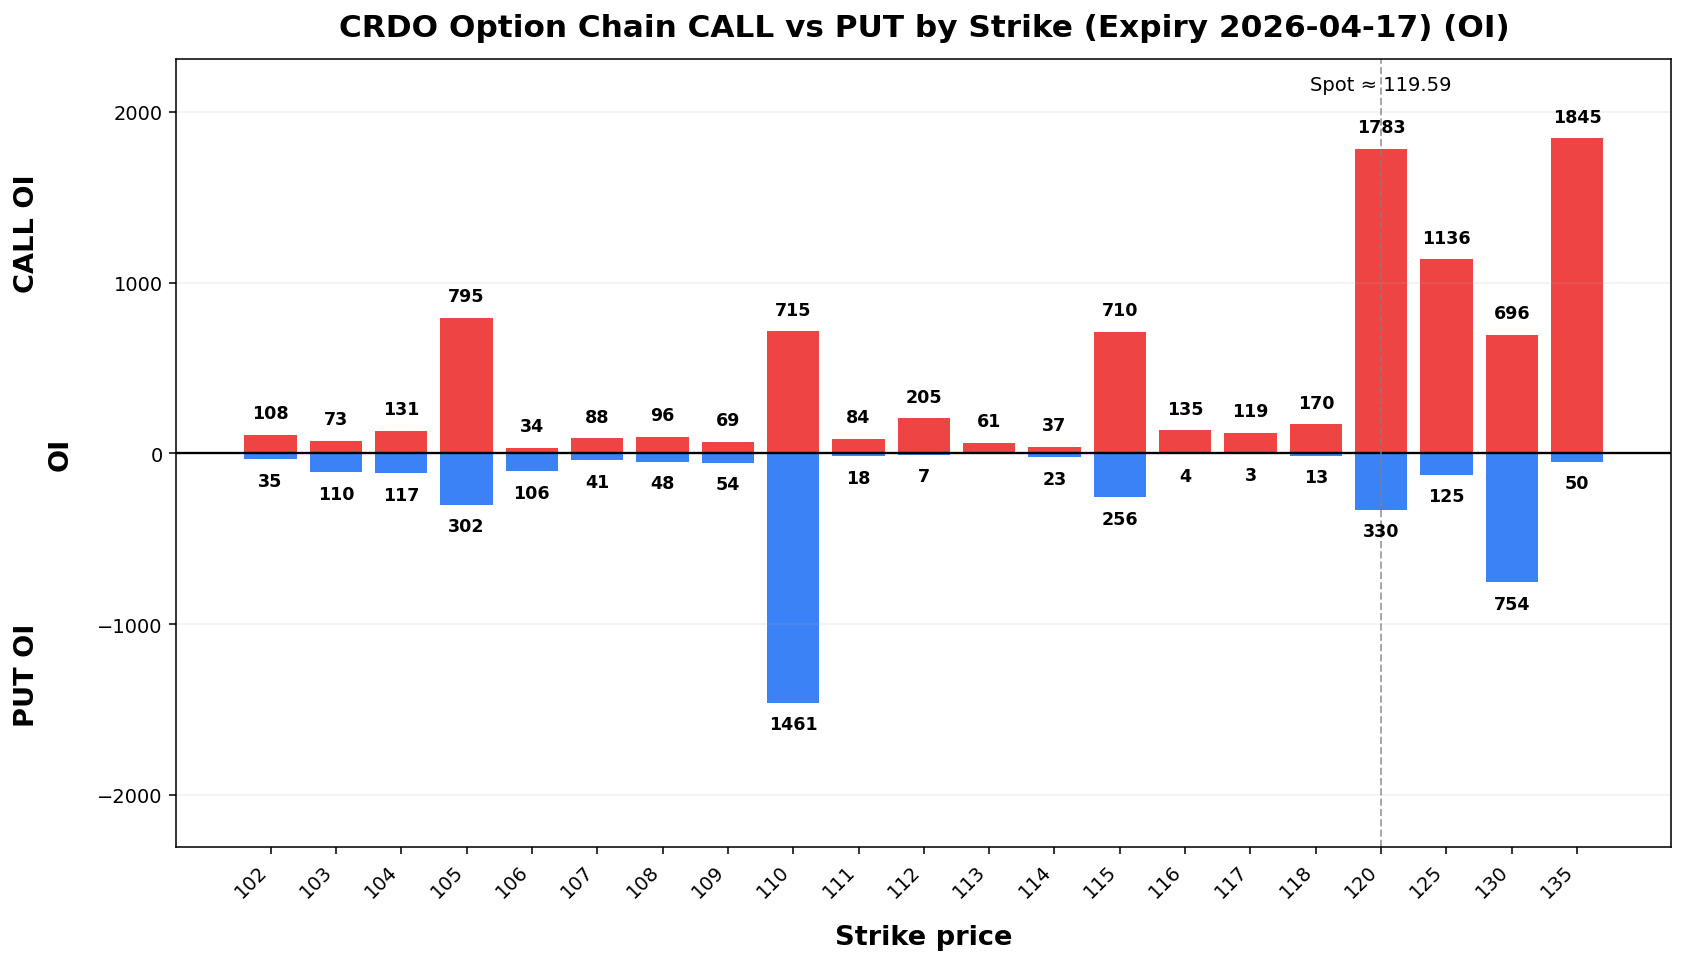
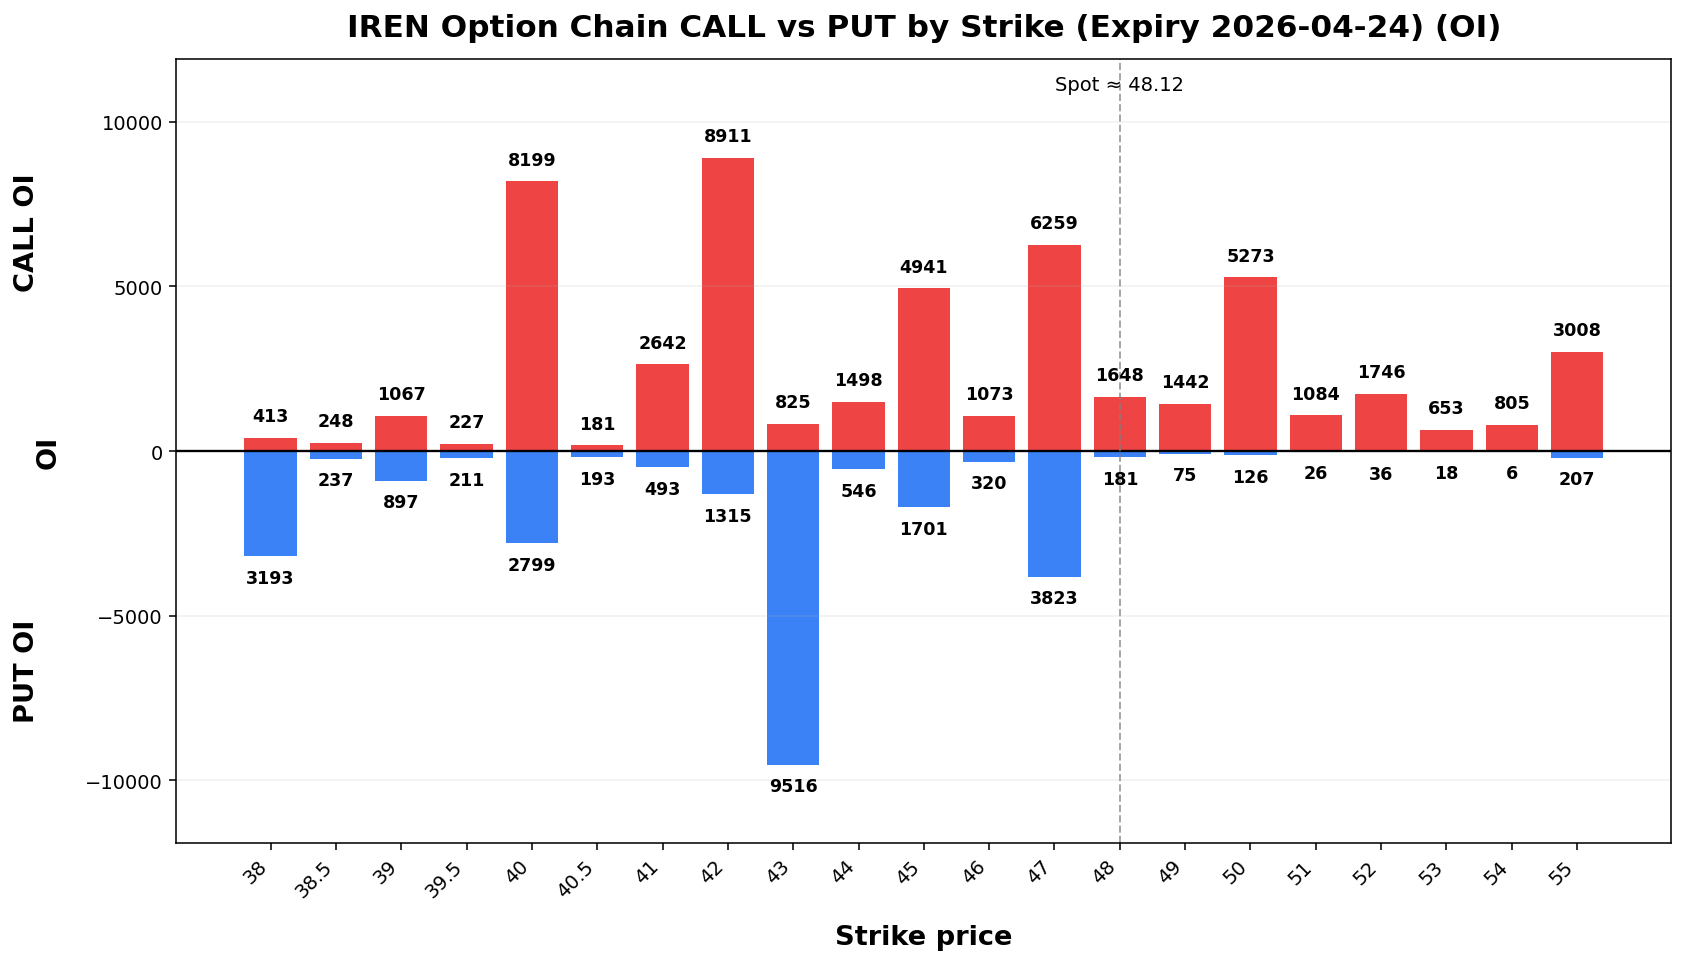
Term Structure
| Expiry |
DTE |
Forward |
ATM IV |
ATM Straddle |
2026-04-1724 |
6 |
119.8748.13 |
76.31%79.08% |
11.504.80 |
2026-04-2405-01 |
13 |
120.3348.13 |
72.14%77.92% |
16.157.03 |
Weekly Range
| Confidence |
Low |
High |
Width |
| 68% |
106.9942.79 |
132.1953.45 |
25.2110.66 |
| 80% |
103.4441.29 |
135.7454.95 |
32.3013.67 |
| 90% |
98.8639.35 |
140.3256.89 |
41.4617.54 |
| 95% |
94.8937.67 |
144.2958.57 |
49.4020.90 |
Structure & Probabilities
| Support |
Resistance |
Gamma Flip |
Max Pain |
P>Res |
P<Sup |
110.47.00 |
120.50.00 |
111.5838.56 |
109.42.00 |
40.0%32.3% |
21.9% |
Flow & Skew
Call Vol |
Put Vol |
Vol P/C |
Call OI |
Put OI |
OI P/C |
Skew |
Skew Bias |
|---|
6,910 |
3,308 |
0.48 |
16,007 |
46,025 |
2.88 |
3.59 vol pts |
PUT_SKEW |
Tail Risk
Q10 |
Q50 |
Q90 |
Down Tail |
Up Tail |
Down/Up |
|---|
61.94 |
69.70 |
133.16 |
57.65 |
13.57 |
4.25 |
Daily Technicals
EMA20 |
EMA50 |
VWAP20 |
BB Lower |
BB Mid |
BB Upper |
BB Width |
Vol Ratio |
Path |
|---|
106.02 |
113.58 |
105.01 |
87.60 |
103.89 |
120.18 |
31.36% |
1.31 |
Sideways / Range |
Day Plan
110.00-120.00 range: fade extremes
> 120.00: chase only if hold + vol
< 110.00: risk expand; reduce size
Regime: TRANSITION
Tech: Sideways / Range
Swing Plan
Accumulate: 110.00-110.00
Trim: 120.00-120.00
Add: close > 120.00
Cut: close < 110.00
Best for: transition regime
Raw Text Summary
📌 CRDO @ 119.59 (2026-04-12 08:48 AM MYT)

• Current price is **119.59**. Key support is around **110.00**, and resistance is around **120.00**.
• For the next week, the model’s **68% expected range** is roughly **106.99 to 132.19**.
• A wider **90% range** is about **98.86 to 140.32**.
• Dealer positioning looks **LONG gamma**, so the market behavior is classified as **TRANSITION**.
• The estimated **gamma flip** is near **111.58**. Crossing and holding beyond this area can change the trading behavior.
• Approximate breakout odds: **above resistance 40.0%**, **below support 21.9%** by the target horizon.
• Options skew is tilted toward **puts**, which suggests traders are paying more for downside protection.
• Near-term implied volatility is higher than the next expiry (**IV1 76.31% vs IV2 72.14%**), which suggests **near-term event stress / backwardation**.
• On the daily chart, the stock currently looks like **Sideways / Range**.
• The implied distribution shows **heavier downside tail risk** than upside tail potential.
RKLB
Spot: 68.05
Report Time: 2026-04-12 08:48 AM MYT
Regime: TRANSITION
Dealer Gamma: LONG
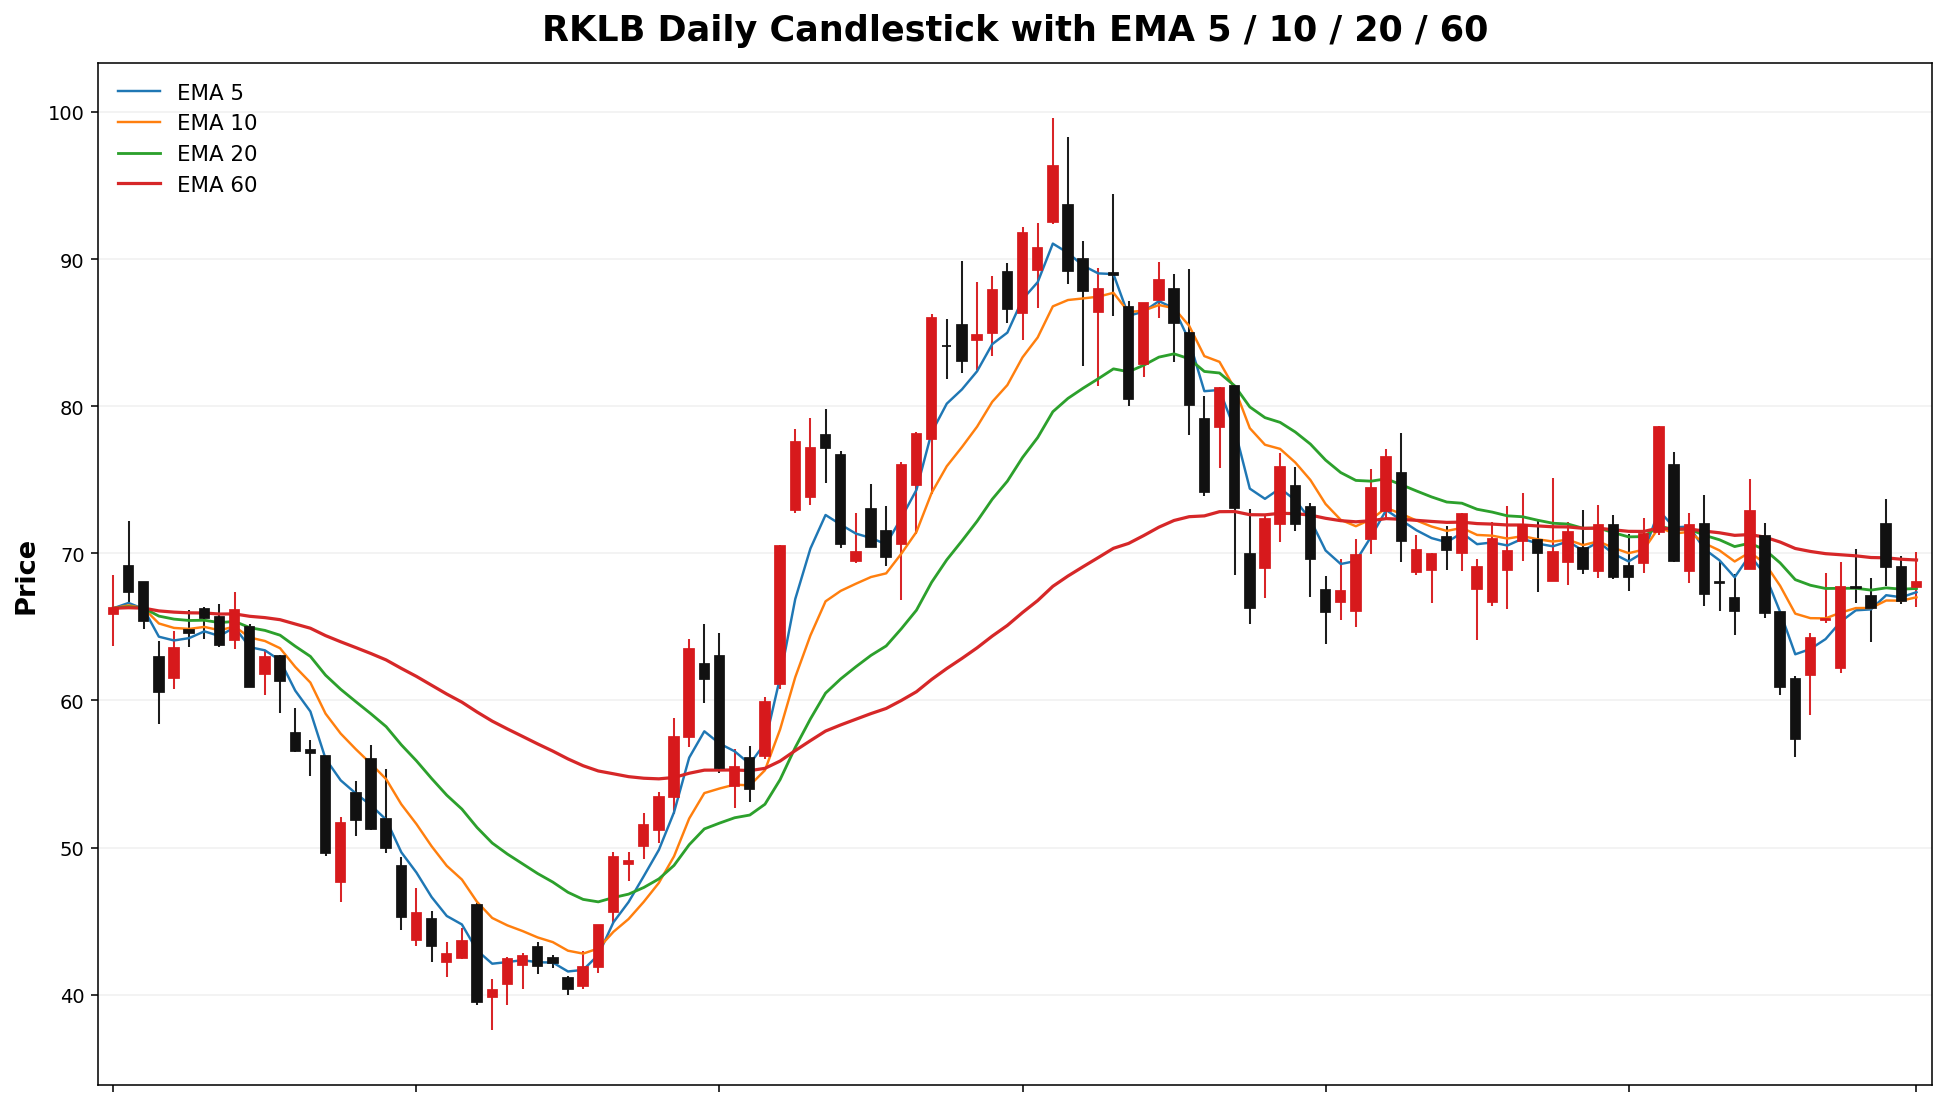
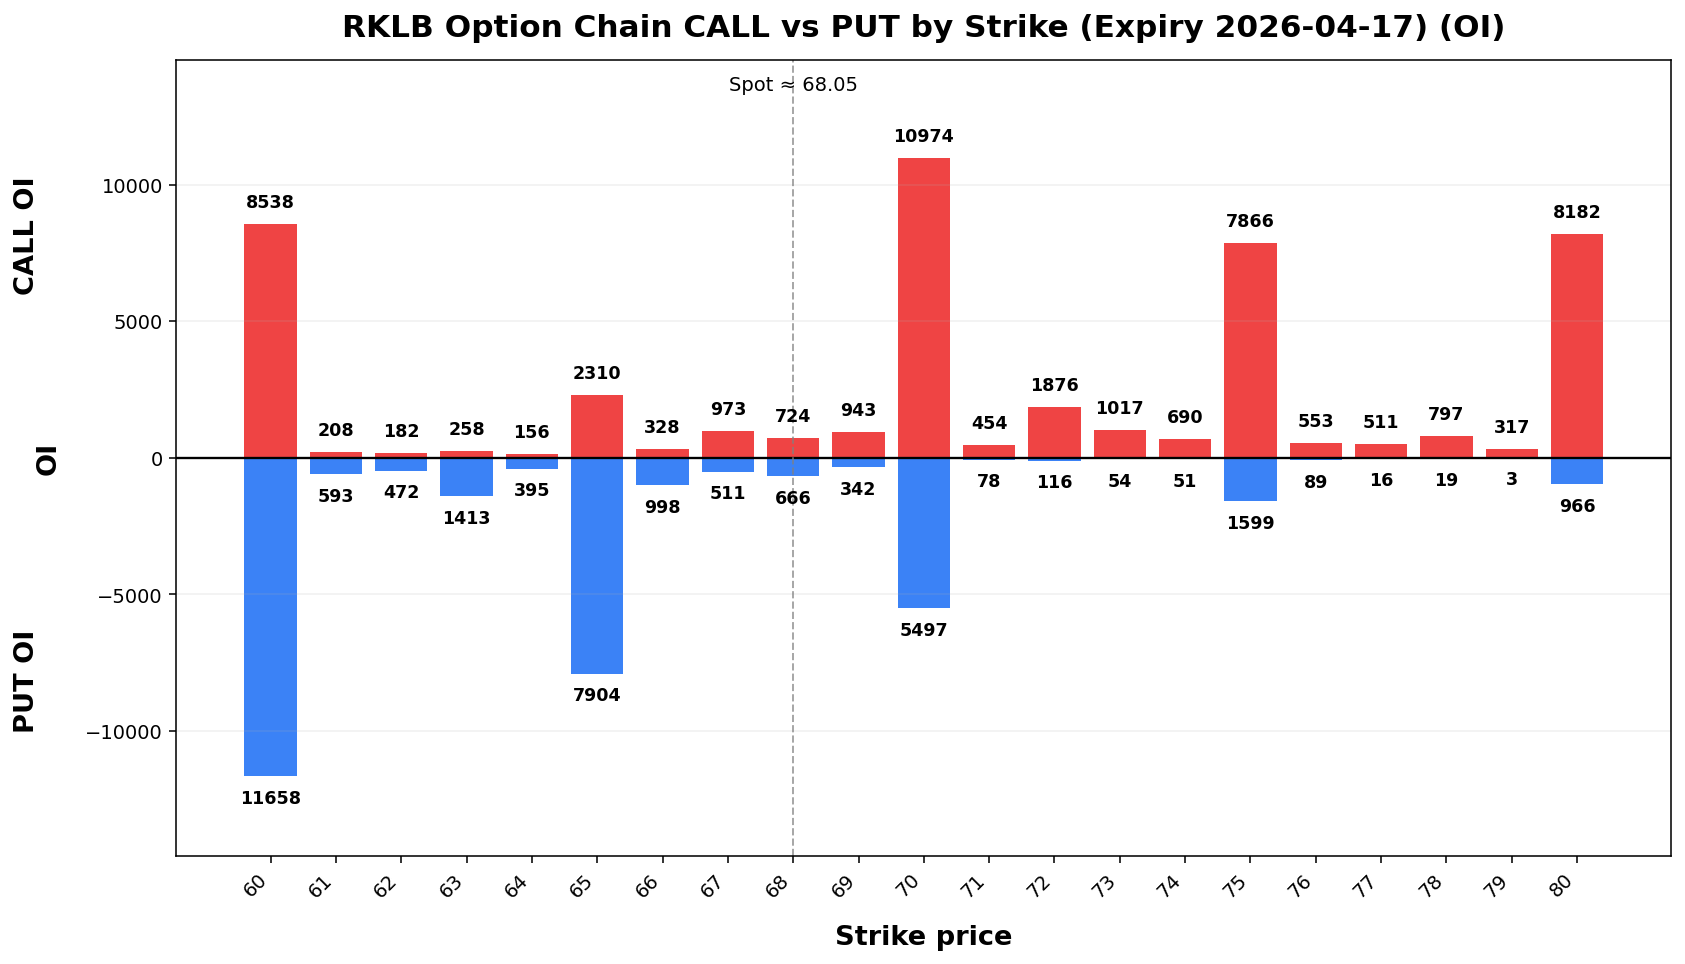
Term Structure
Expiry |
DTE |
Forward |
ATM IV |
ATM Straddle |
|---|
2026-04-17 |
6 |
68.07 |
73.18% |
6.27 |
2026-04-24 |
13 |
68.21 |
71.24% |
9.08 |
Weekly Range
Confidence |
Low |
High |
Width |
|---|
68% |
61.10 |
75.00 |
13.89 |
80% |
59.15 |
76.95 |
17.81 |
90% |
56.62 |
79.48 |
22.85 |
95% |
54.43 |
81.67 |
27.23 |
Structure & Probabilities
Support |
Resistance |
Gamma Flip |
Max Pain |
P>Res |
P<Sup |
|---|
65.00 |
70.00 |
64.71 |
63.00 |
29.7% |
30.37.2% |
Flow & Skew
| Call Vol |
Put Vol |
Vol P/C |
Call OI |
Put OI |
OI P/C |
Skew |
Skew Bias |
18,23627,735 |
17,57115,545 |
0.9656 |
108,86256,585 |
89,29970,012 |
0.821.24 |
2.54-1.17 vol pts |
PUT_SKEWCALL_SKEW |
Tail Risk
| Q10 |
Q50 |
Q90 |
Down Tail |
Up Tail |
Down/Up |
48.4140.18 |
67.2347.77 |
77.9156.69 |
19.647.94 |
9.868.57 |
1.990.93 |
Daily Technicals
| EMA20 |
EMA50 |
VWAP20 |
BB Lower |
BB Mid |
BB Upper |
BB Width |
Vol Ratio |
Path |
67.6141.60 |
69.3341.98 |
68.2539.86 |
58.9729.06 |
67.6739.62 |
76.3850.19 |
25.73%53.34% |
0.7493 |
DOWNSideways trend/ (expanding)Range |
Day Plan
65.47.00-70.50.00 range: fade extremes- >
70.50.00: chase only if hold + vol
- <
65.47.00: risk expand; reduce size
- Regime: TRANSITION
- Tech:
DOWNSideways trend/ (expanding)Range
Swing Plan
- Accumulate:
65.47.00-65.47.00
- Trim:
70.50.00-70.50.00
- Add: close >
70.50.00
- Cut: close <
65.47.00
- Best for: transition regime
Raw Text Summary
📌 RKLBIREN @ 68.0548.12 (2026-04-1219 08:4814 AM MYT)

• Current price is **68.05*48.12**. Key support is around **65.47.00**, and resistance is around **70.50.00**.
• For the next week, the model’s **68% expected range** is roughly **61.1042.79 to 75.00*53.45**.
• A wider **90% range** is about **56.6239.35 to 79.48*56.89**.
• Dealer positioning looks **LONG gamma**, so the market behavior is classified as **TRANSITION**.
• The estimated **gamma flip** is near **64.71*38.56**. Crossing and holding beyond this area can change the trading behavior.
• Approximate breakout odds: **above resistance 29.7%32.3%**, **below support 30.37.2%** by the target horizon.
• Options skew is tiltedfairly towardbalanced, so there is **puts*no strong directional bias**, whichfrom suggestsskew traders are paying more for downside protection.alone.
• Near-term implied volatility is higher than the next expiry (**IV1 73.18%79.08% vs IV2 71.24%77.92%**), which suggests **near-term event stress / backwardation**.
• Recent volume is only **0.74x** the 20-day average, so breakouts may be less reliable unless volume improves.
• On the daily chart, the stock currently looks like **DOWNSideways trend/ (expanding)*Range**.
• The implied distribution showsis **heavierfairly balanced** between upside and downside tail risk** than upside tail potential.tails.
AGQRBLX
Spot: 122.2160.34
Report Time: 2026-04-1219 08:4815 AM MYT
Regime: TRANSITION
Dealer Gamma: LONG
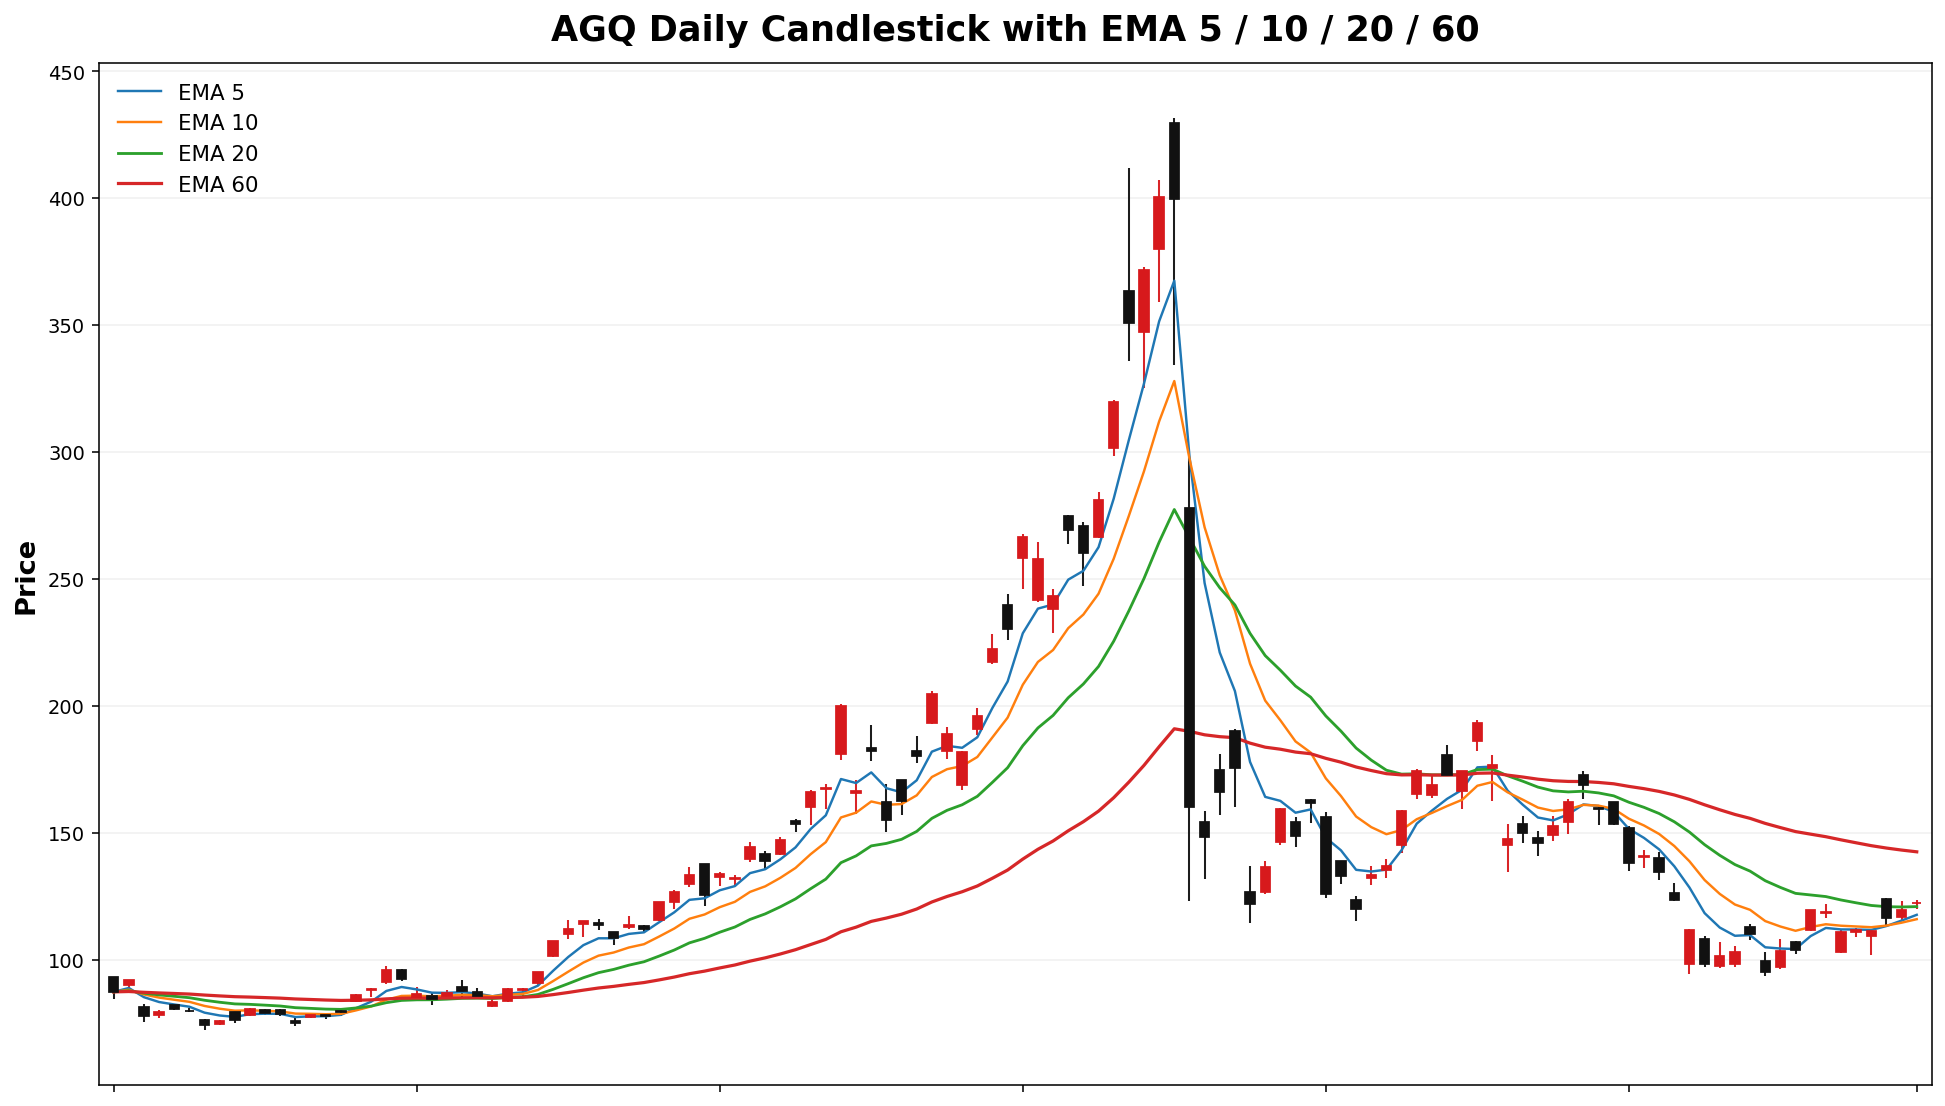
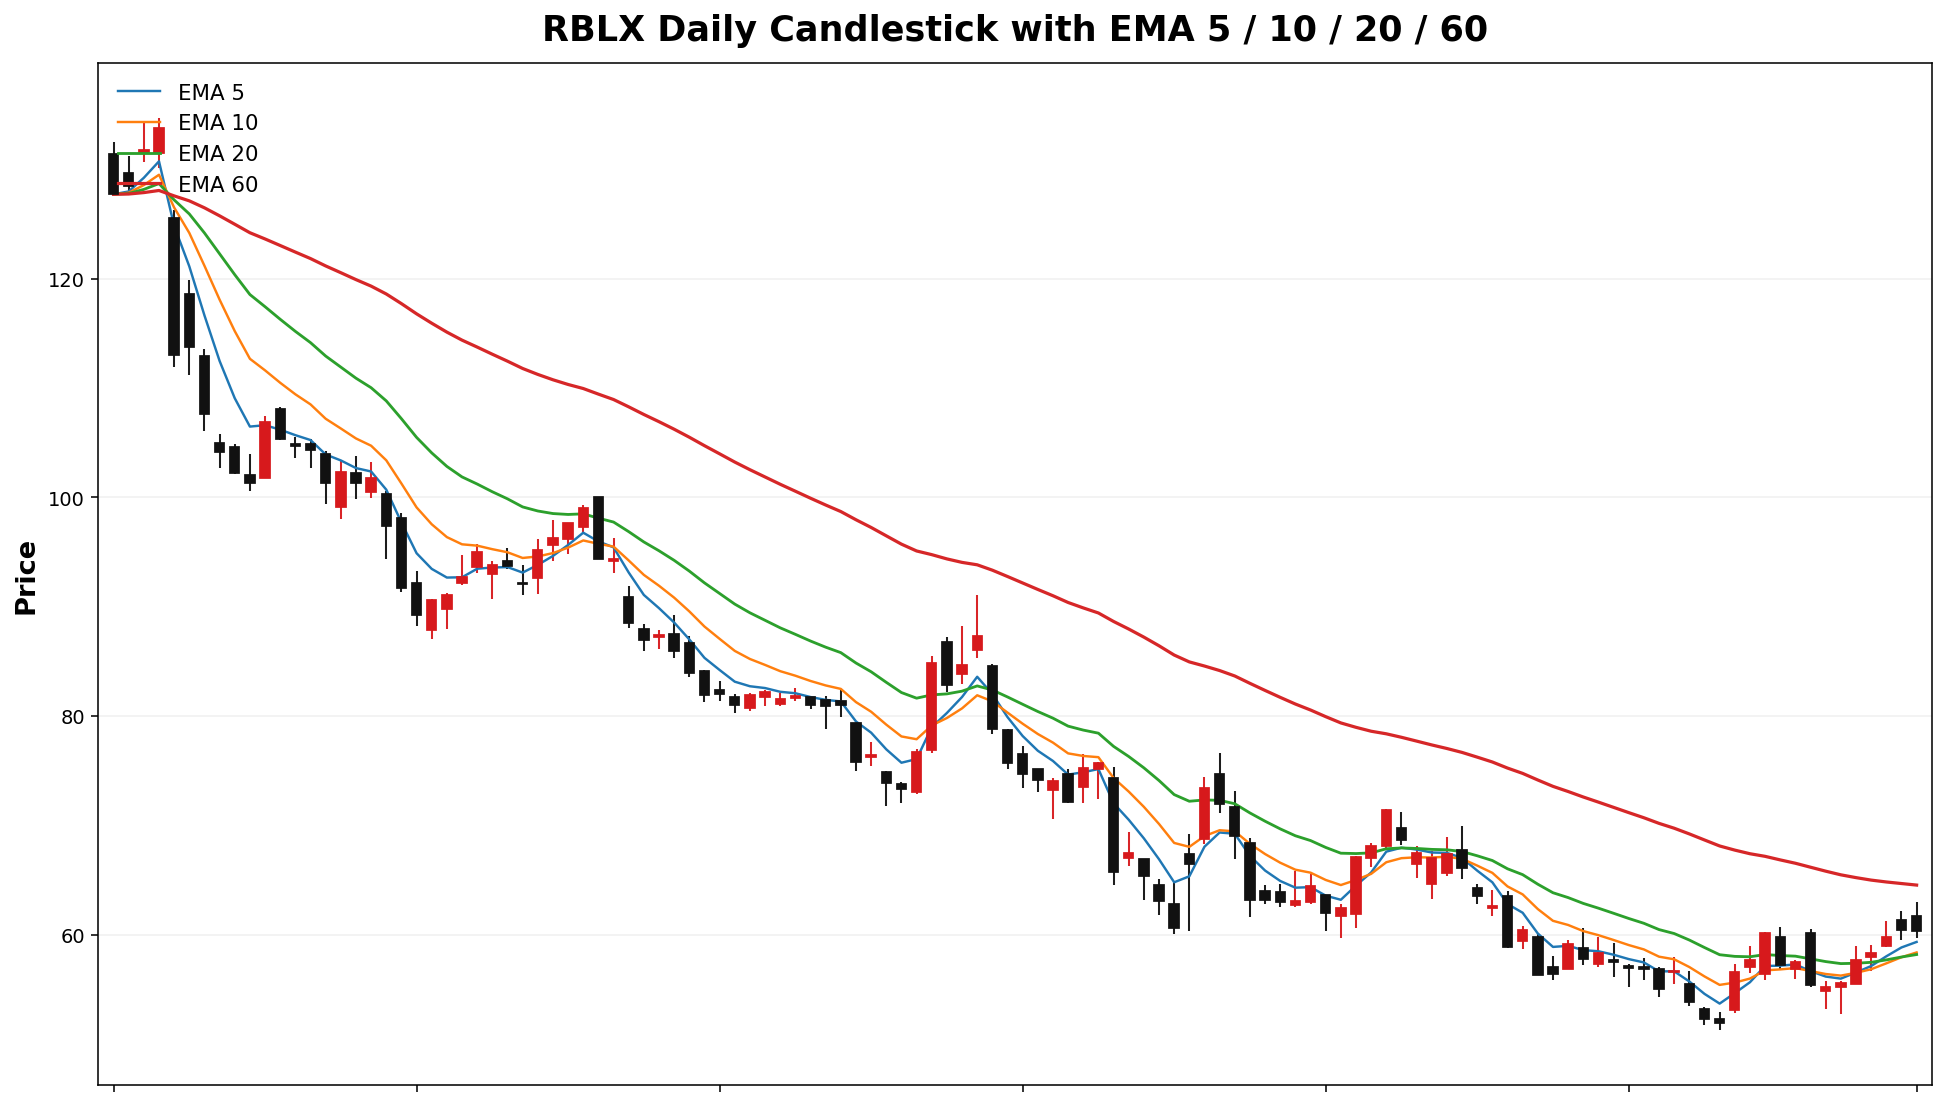
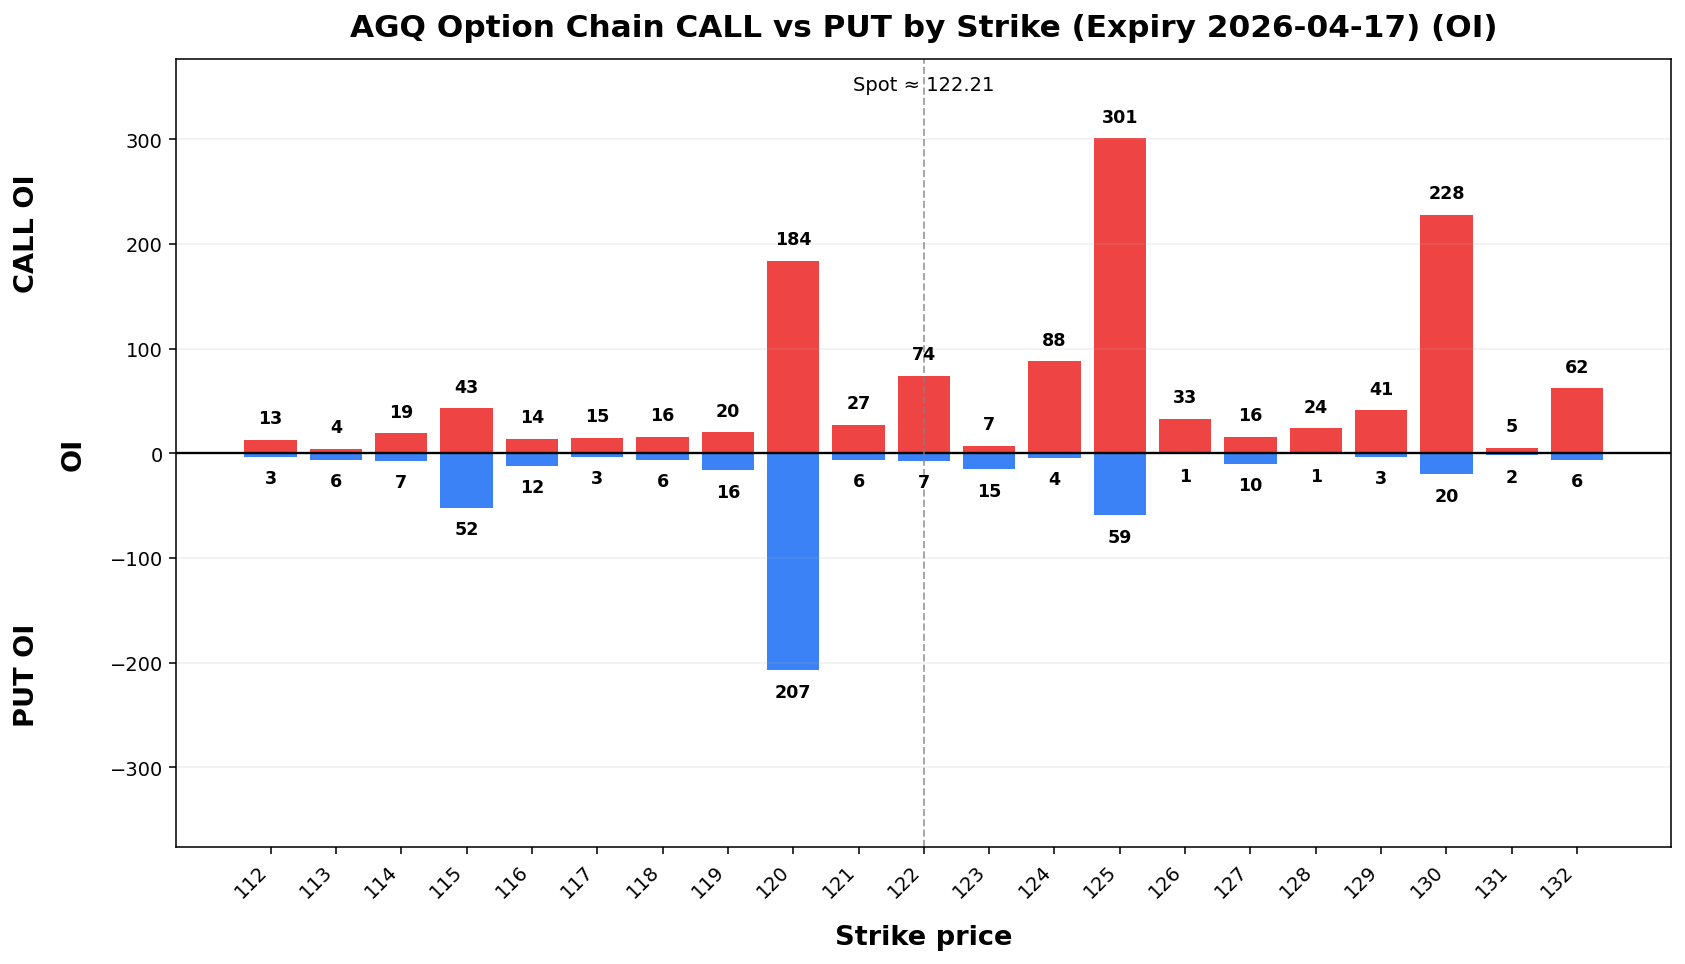
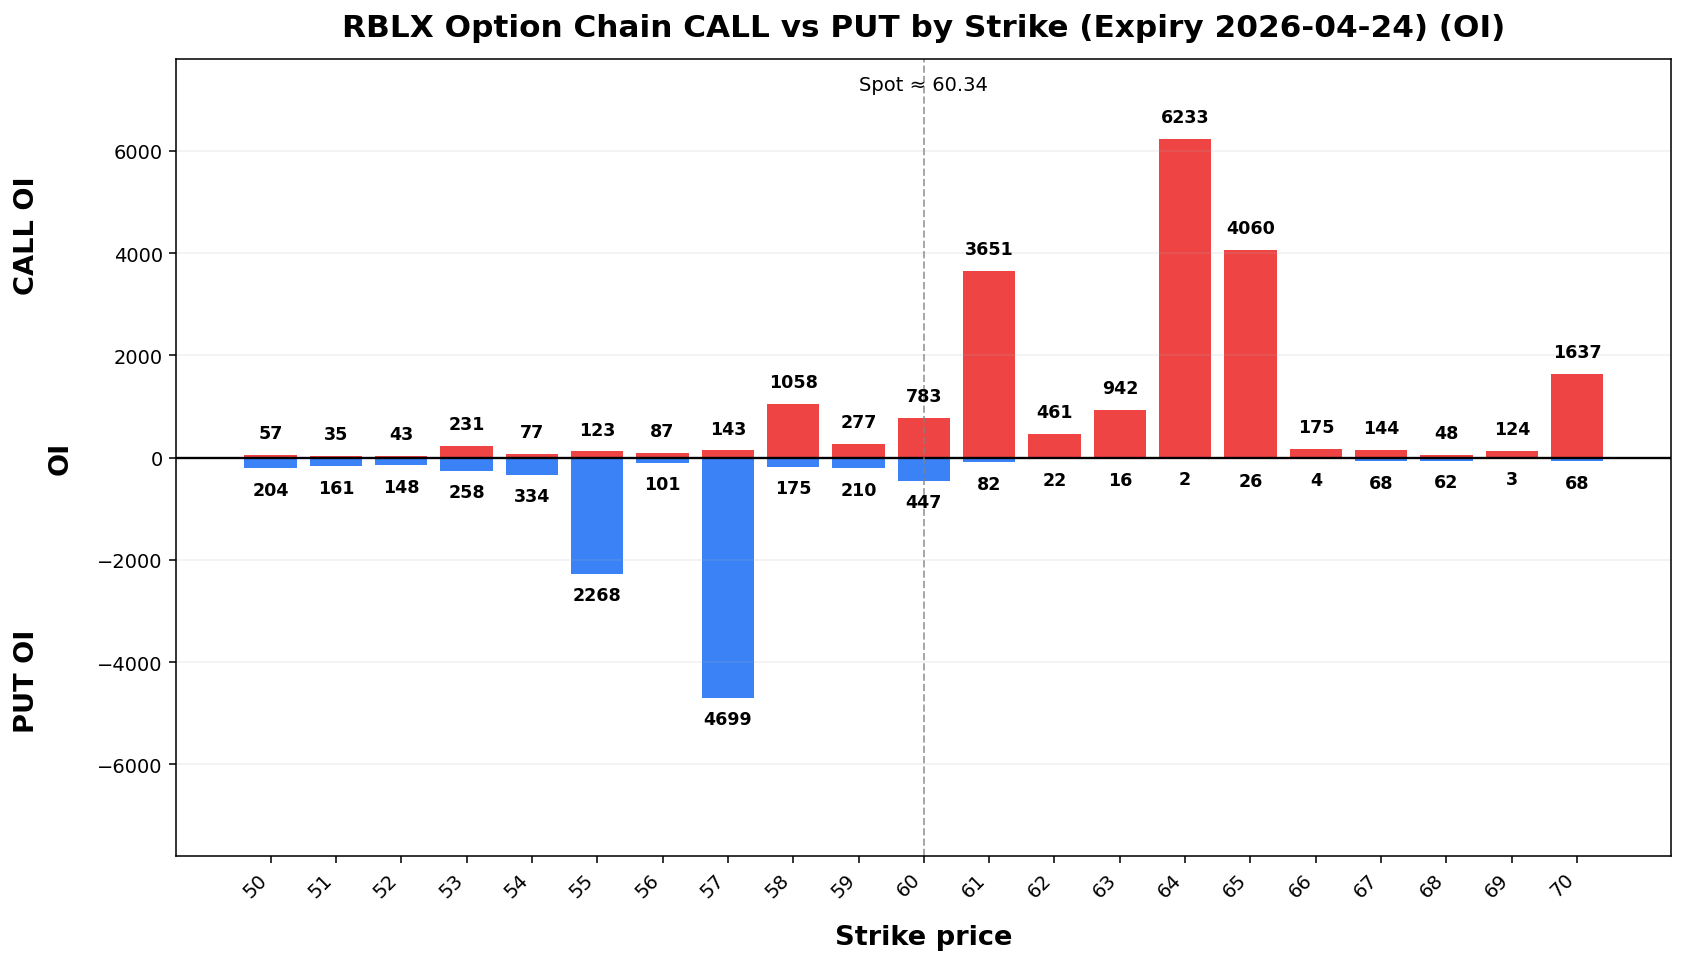
Term Structure
| Expiry |
DTE |
Forward |
ATM IV |
ATM Straddle |
2026-04-1724 |
6 |
122.2060.36 |
94.48%55.32% |
14.554.21 |
2026-04-2405-01 |
13 |
122.3660.40 |
87.86%79% |
20.109.93 |
Weekly Range
| Confidence |
Low |
High |
Width |
| 68% |
106.3554.49 |
138.0766.19 |
31.7211.69 |
| 80% |
101.8952.85 |
142.5367.83 |
40.6514.99 |
| 90% |
96.1350.72 |
148.2969.96 |
52.1719.24 |
| 95% |
91.1348.88 |
153.2971.80 |
62.1622.92 |
Structure & Probabilities
| Support |
Resistance |
Gamma Flip |
Max Pain |
P>Res |
P<Sup |
100.57.00 |
125.61.00 |
106.64 |
120.00 |
32.8% |
7.4% |
Flow & Skew
Call Vol |
Put Vol |
Vol P/C |
Call OI |
Put OI |
OI P/C |
Skew |
Skew Bias |
|---|
1,895 |
1,296 |
0.68 |
5,198 |
3,808 |
0.73 |
8.54 vol pts |
PUT_SKEW |
Tail Risk
Q10 |
Q50 |
Q90 |
Down Tail |
Up Tail |
Down/Up |
|---|
91.31 |
122.52 |
138.97 |
30.90 |
16.76 |
1.84 |
Daily Technicals
EMA20 |
EMA50 |
VWAP20 |
BB Lower |
BB Mid |
BB Upper |
BB Width |
Vol Ratio |
Path |
|---|
120.91 |
139.70 |
111.96 |
89.17 |
114.72 |
140.28 |
44.55% |
0.44 |
Sideways / Range |
Day Plan
100.00-125.00 range: fade extremes
> 125.00: chase only if hold + vol
< 100.00: risk expand; reduce size
Regime: TRANSITION
Tech: Sideways / Range
Swing Plan
Accumulate: 100.00-100.00
Trim: 125.00-125.00
Add: close > 125.00
Cut: close < 100.00
Best for: transition regime
Raw Text Summary
📌 AGQ @ 122.21 (2026-04-12 08:48 AM MYT)

• Current price is **122.21**. Key support is around **100.00**, and resistance is around **125.00**.
• For the next week, the model’s **68% expected range** is roughly **106.35 to 138.07**.
• A wider **90% range** is about **96.13 to 148.29**.
• Dealer positioning looks **LONG gamma**, so the market behavior is classified as **TRANSITION**.
• The estimated **gamma flip** is near **106.64**. Crossing and holding beyond this area can change the trading behavior.
• Approximate breakout odds: **above resistance 32.8%**, **below support 7.4%** by the target horizon.
• Options skew is tilted toward **puts**, which suggests traders are paying more for downside protection.
• Near-term implied volatility is higher than the next expiry (**IV1 94.48% vs IV2 87.86%**), which suggests **near-term event stress / backwardation**.
• Recent volume is only **0.44x** the 20-day average, so breakouts may be less reliable unless volume improves.
• On the daily chart, the stock currently looks like **Sideways / Range**.
• The implied distribution shows **heavier downside tail risk** than upside tail potential.
APLD
Spot: 26.26
Report Time: 2026-04-12 08:49 AM MYT
Regime: TRANSITION
Dealer Gamma: LONG
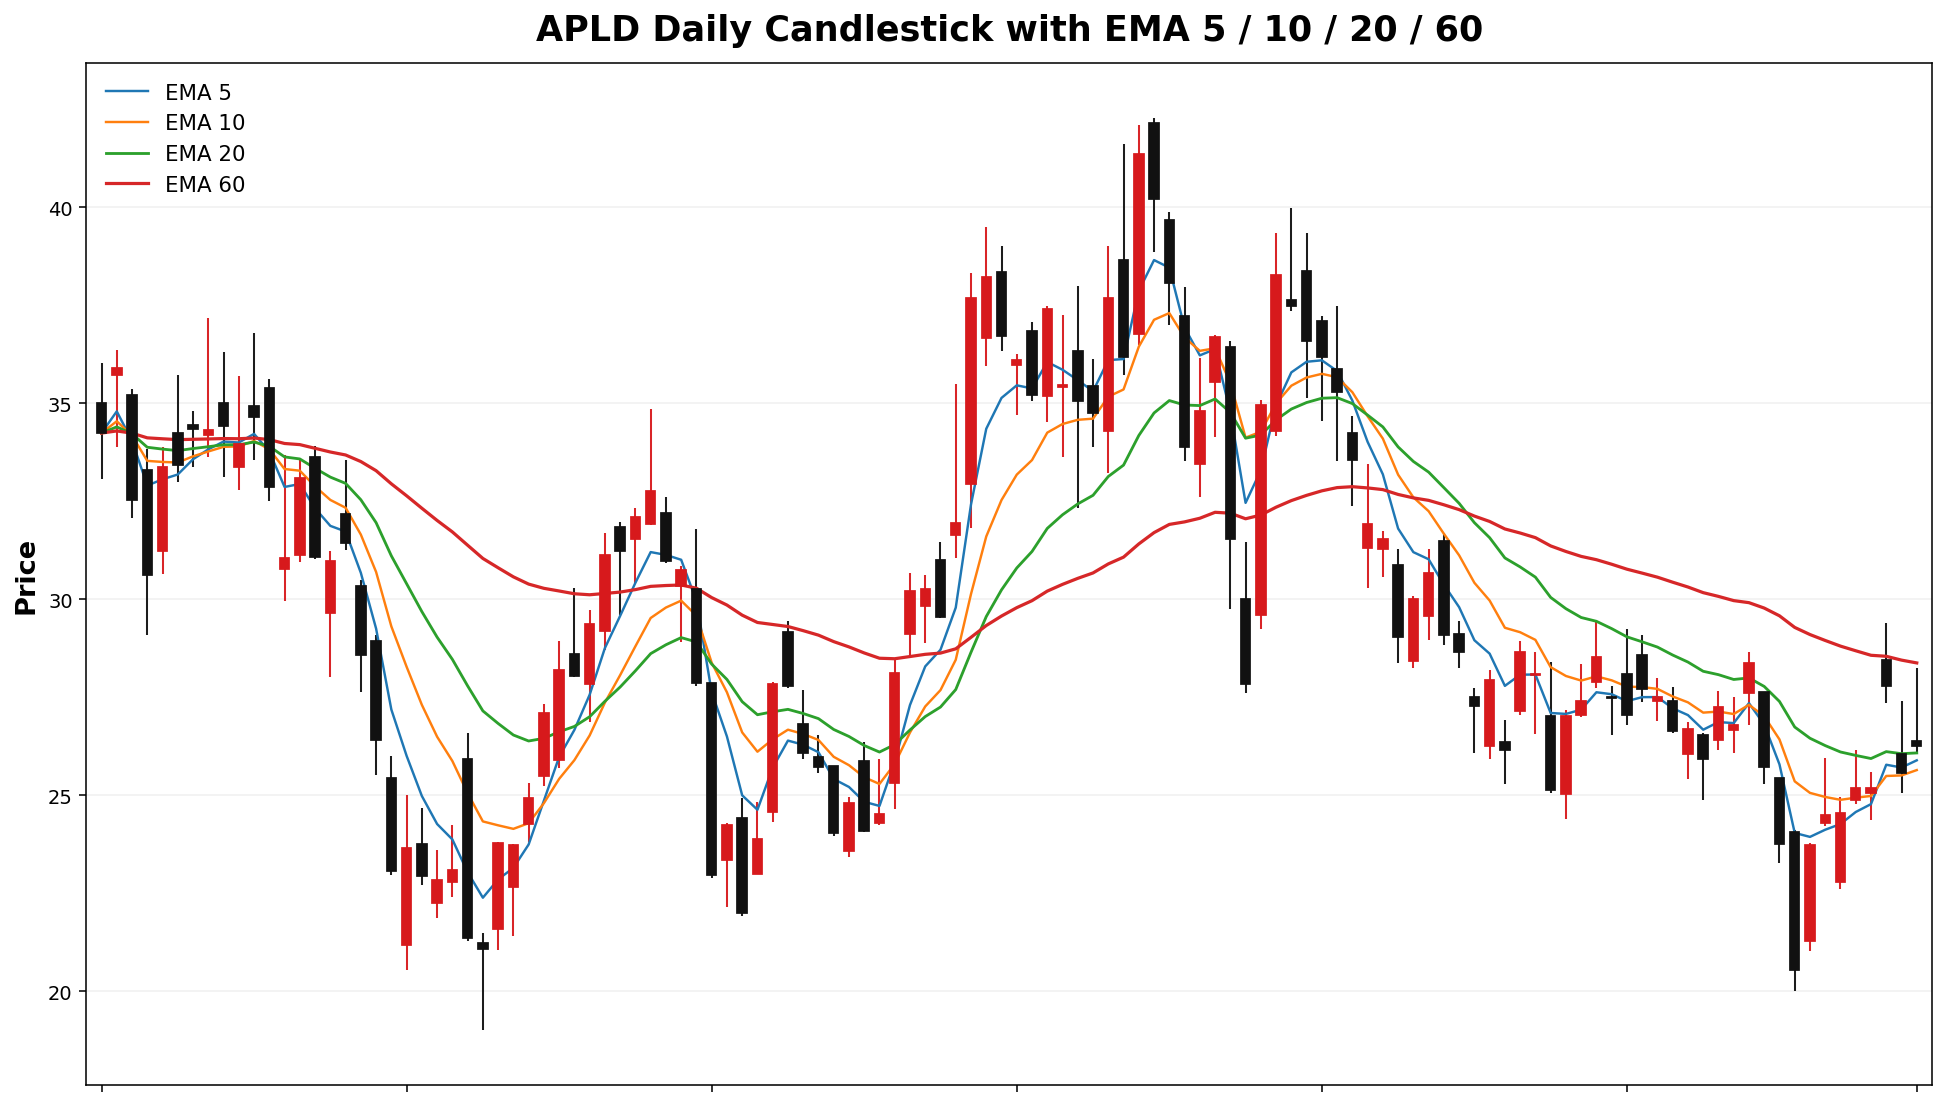
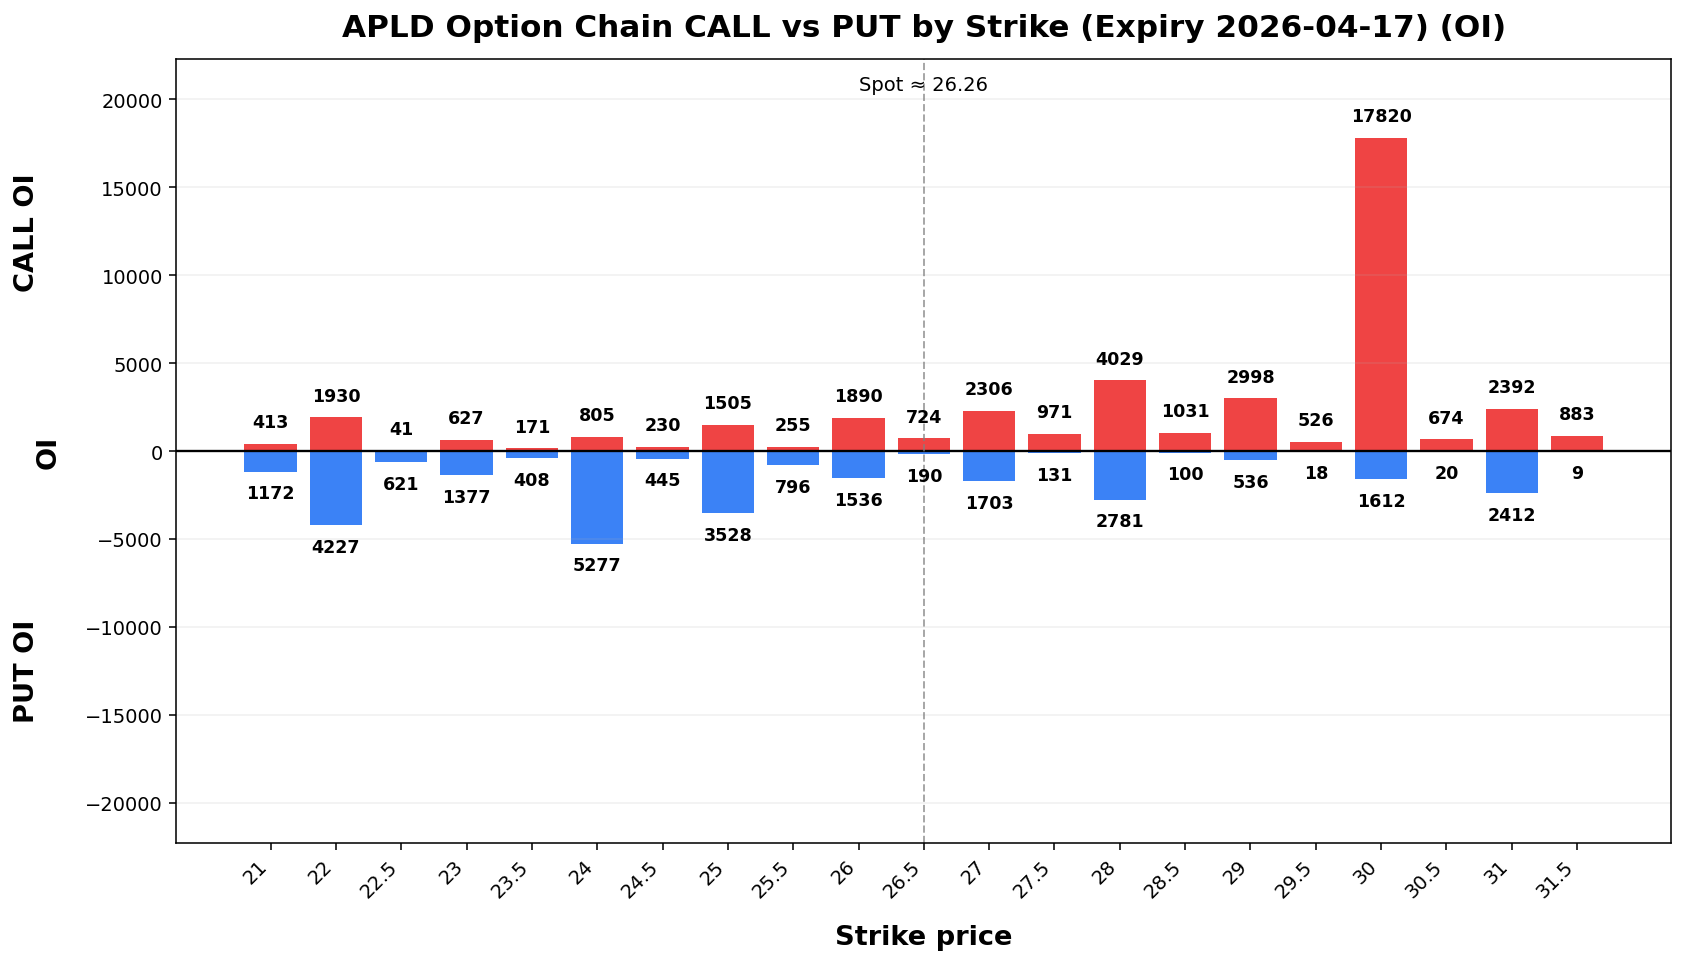
Term Structure
Expiry |
DTE |
Forward |
ATM IV |
ATM Straddle |
|---|
2026-04-17 |
6 |
26.26 |
86.58% |
2.87 |
2026-04-24 |
13 |
26.56.27 |
81.78% |
4.02 |
Weekly Range
Confidence |
Low |
High |
Width |
|---|
68% |
23.12 |
29.40 |
6.28 |
80% |
22.24 |
30.28 |
8.05 |
90% |
21.10 |
31.42 |
10.33 |
95% |
20.11 |
32.41 |
12.30 |
Structure & Probabilities
Support |
Resistance |
Gamma Flip |
Max Pain |
P>Res |
P<Sup |
|---|
25.00 |
28.00 |
24.34 |
27.00 |
23.8% |
33.8% |
Flow & Skew
Call Vol |
Put Vol |
Vol P/C |
Call OI |
Put OI |
OI P/C |
Skew |
Skew Bias |
|---|
33,265 |
13,821 |
0.42 |
91,645 |
44,189 |
0.48 |
5.76 vol pts |
PUT_SKEW |
Tail Risk
Q10 |
Q50 |
Q90 |
Down Tail |
Up Tail |
Down/Up |
|---|
22.43 |
26.64 |
30.93 |
3.83 |
4.67 |
0.82 |
Daily Technicals
EMA20 |
EMA50 |
VWAP20 |
BB Lower |
BB Mid |
BB Upper |
BB Width |
Vol Ratio |
Path |
|---|
26.08 |
27.88 |
25.84 |
22.18 |
25.84 |
29.50 |
28.33% |
1.31 |
DOWN trend (expanding) |
Day Plan
25.00-28.00 range: fade extremes
> 28.00: chase only if hold + vol
< 25.00: risk expand; reduce size
Regime: TRANSITION
Tech: DOWN trend (expanding)
Swing Plan
Accumulate: 25.00-25.00
Trim: 28.00-28.00
Add: close > 28.00
Cut: close < 25.00
Best for: transition regime
Raw Text Summary
📌 APLD @ 26.26 (2026-04-12 08:49 AM MYT)

• Current price is **26.26**. Key support is around **25.00**, and resistance is around **28.00**.
• For the next week, the model’s **68% expected range** is roughly **23.12 to 29.40**.
• A wider **90% range** is about **21.10 to 31.42**.
• Dealer positioning looks **LONG gamma**, so the market behavior is classified as **TRANSITION**.
• The estimated **gamma flip** is near **24.34**. Crossing and holding beyond this area can change the trading behavior.
• Approximate breakout odds: **above resistance 23.8%**, **below support 33.8%** by the target horizon.
• Options skew is tilted toward **puts**, which suggests traders are paying more for downside protection.
• Near-term implied volatility is higher than the next expiry (**IV1 86.58% vs IV2 81.78%**), which suggests **near-term event stress / backwardation**.
• On the daily chart, the stock currently looks like **DOWN trend (expanding)**.
• The implied distribution shows **more upside tail potential** than downside tail risk.
BNO
Spot: 47.25
Report Time: 2026-04-12 08:49 AM MYT
Regime: TRANSITION
Dealer Gamma: LONG
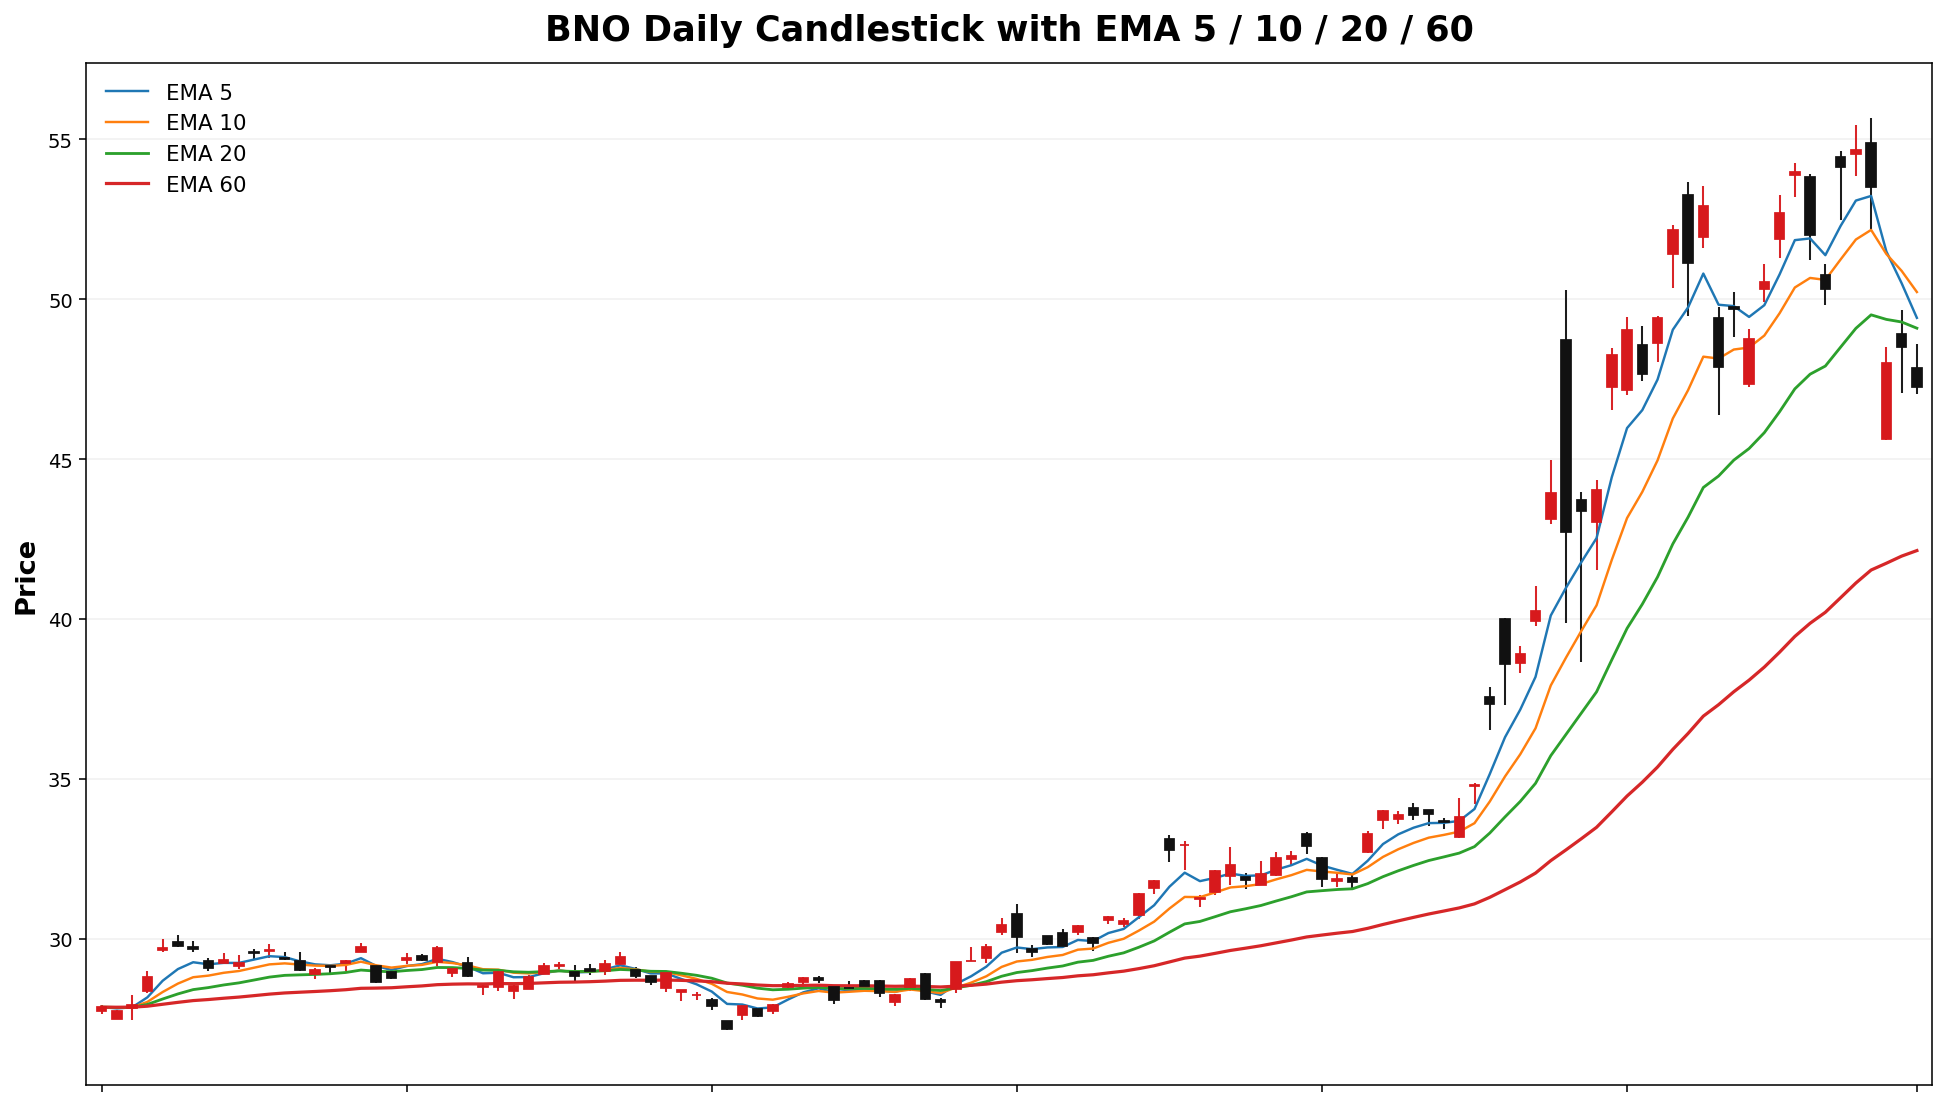
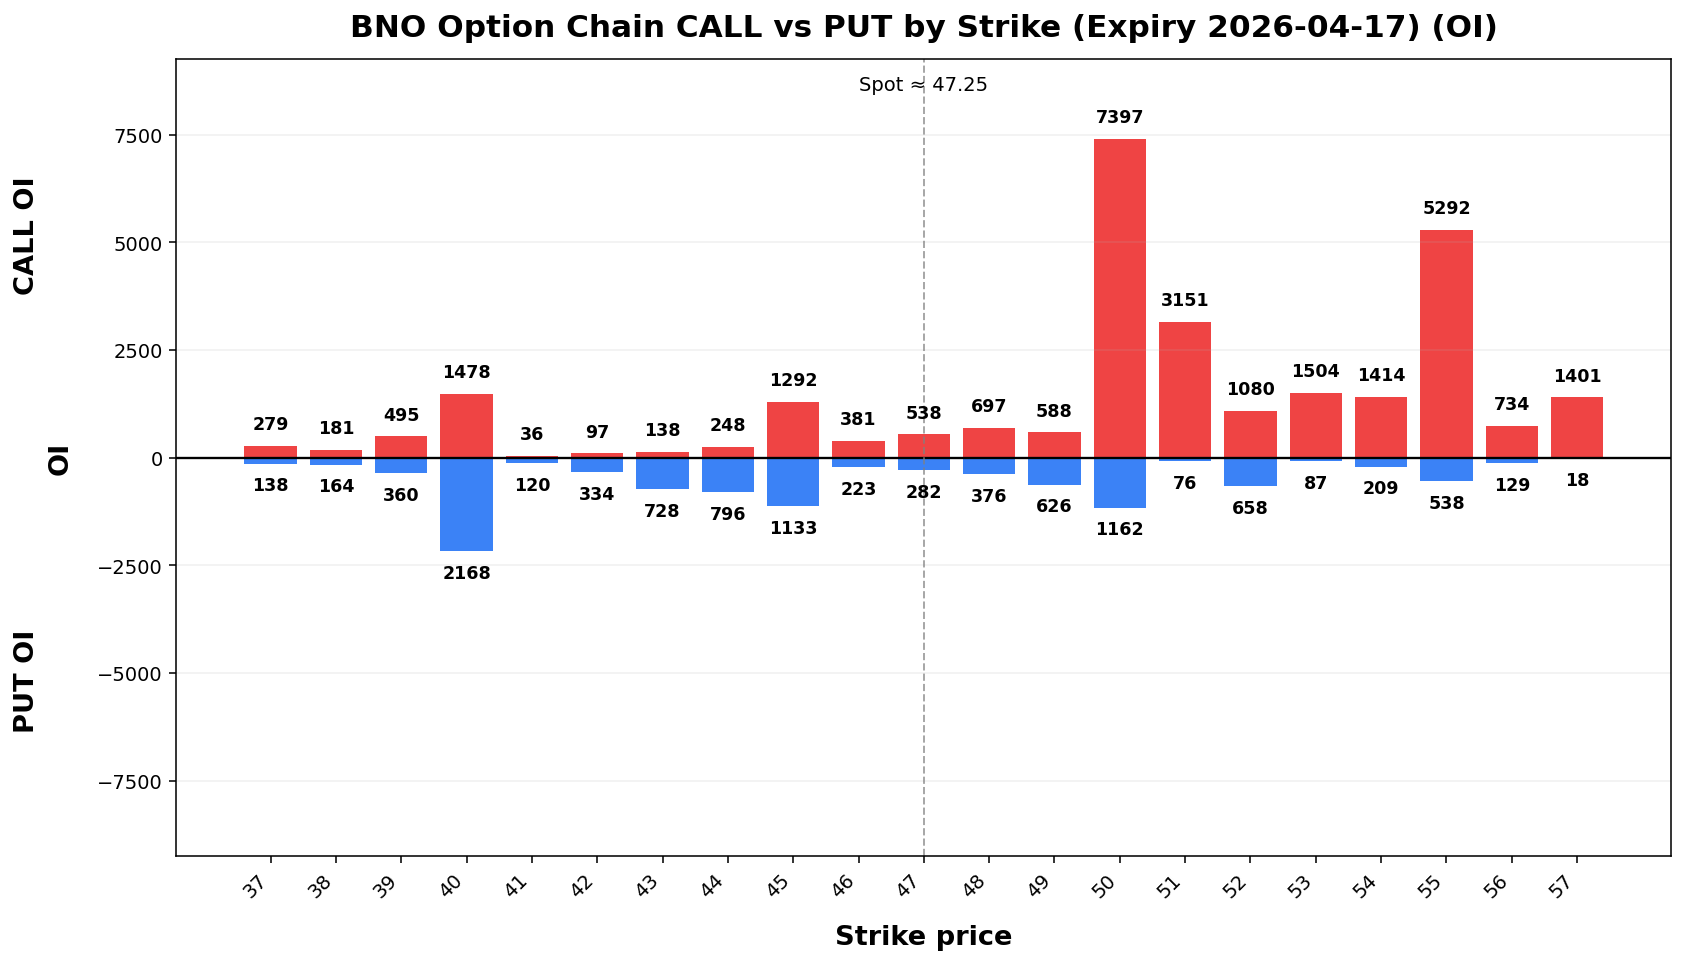
Term Structure
Expiry |
DTE |
Forward |
ATM IV |
ATM Straddle |
|---|
2026-04-17 |
6 |
47.32 |
75.58% |
4.50 |
2026-05-15 |
34 |
47.50 |
65.75% |
9.45 |
Weekly Range
Confidence |
Low |
High |
Width |
|---|
68% |
42.37 |
52.13 |
9.76 |
80% |
41.00 |
53.50 |
12.51 |
90% |
39.22 |
55.28 |
16.06 |
95% |
37.68 |
56.82 |
19.13 |
Structure & Probabilities
Support |
Resistance |
Gamma Flip |
Max Pain |
P>Res |
P<Sup |
|---|
| 40.00 |
50.0037.1% |
39.00 |
45.00 |
26.2% |
5.23.2% |
Flow & Skew
| Call Vol |
Put Vol |
Vol P/C |
Call OI |
Put OI |
OI P/C |
Skew |
Skew Bias |
4,14414,033 |
1,1199,654 |
0.2769 |
46,65622,424 |
14,125008 |
0.3062 |
-12.600.88 vol pts |
CALL_SKEWFLAT |
Tail Risk
| Q10 |
Q50 |
Q90 |
Down Tail |
Up Tail |
Down/Up |
15.96 |
19.79 |
50.26 |
31.29 |
3.01 |
10.41 |
Daily Technicals
EMA20 |
EMA50 |
VWAP20 |
BB Lower |
BB Mid |
BB Upper |
BB Width |
Vol Ratio |
Path |
|---|
49.09 |
43.56 |
50.83 |
45.91 |
50.72 |
55.52 |
18.94% |
0.57 |
Sideways / Range |
Day Plan
40.00-50.00 range: fade extremes
> 50.00: chase only if hold + vol
< 40.00: risk expand; reduce size
Regime: TRANSITION
Tech: Sideways / Range
Swing Plan
Accumulate: 40.00-40.00
Trim: 50.00-50.00
Add: close > 50.00
Cut: close < 40.00
Best for: transition regime
Raw Text Summary
📌 BNO @ 47.25 (2026-04-12 08:49 AM MYT)

• Current price is **47.25**. Key support is around **40.00**, and resistance is around **50.00**.
• For the next week, the model’s **68% expected range** is roughly **42.37 to 52.13**.
• A wider **90% range** is about **39.22 to 55.28**.
• Dealer positioning looks **LONG gamma**, so the market behavior is classified as **TRANSITION**.
• The estimated **gamma flip** is near **39.00**. Crossing and holding beyond this area can change the trading behavior.
• Approximate breakout odds: **above resistance 26.2%**, **below support 5.2%** by the target horizon.
• Options skew is tilted toward **calls**, which suggests upside speculation is relatively stronger.
• Near-term implied volatility is higher than the next expiry (**IV1 75.58% vs IV2 65.75%**), which suggests **near-term event stress / backwardation**.
• Recent volume is only **0.57x** the 20-day average, so breakouts may be less reliable unless volume improves.
• On the daily chart, the stock currently looks like **Sideways / Range**.
• The implied distribution shows **heavier downside tail risk** than upside tail potential.
OKLO
Spot: 50.25
Report Time: 2026-04-12 08:49 AM MYT
Regime: TREND
Dealer Gamma: SHORT
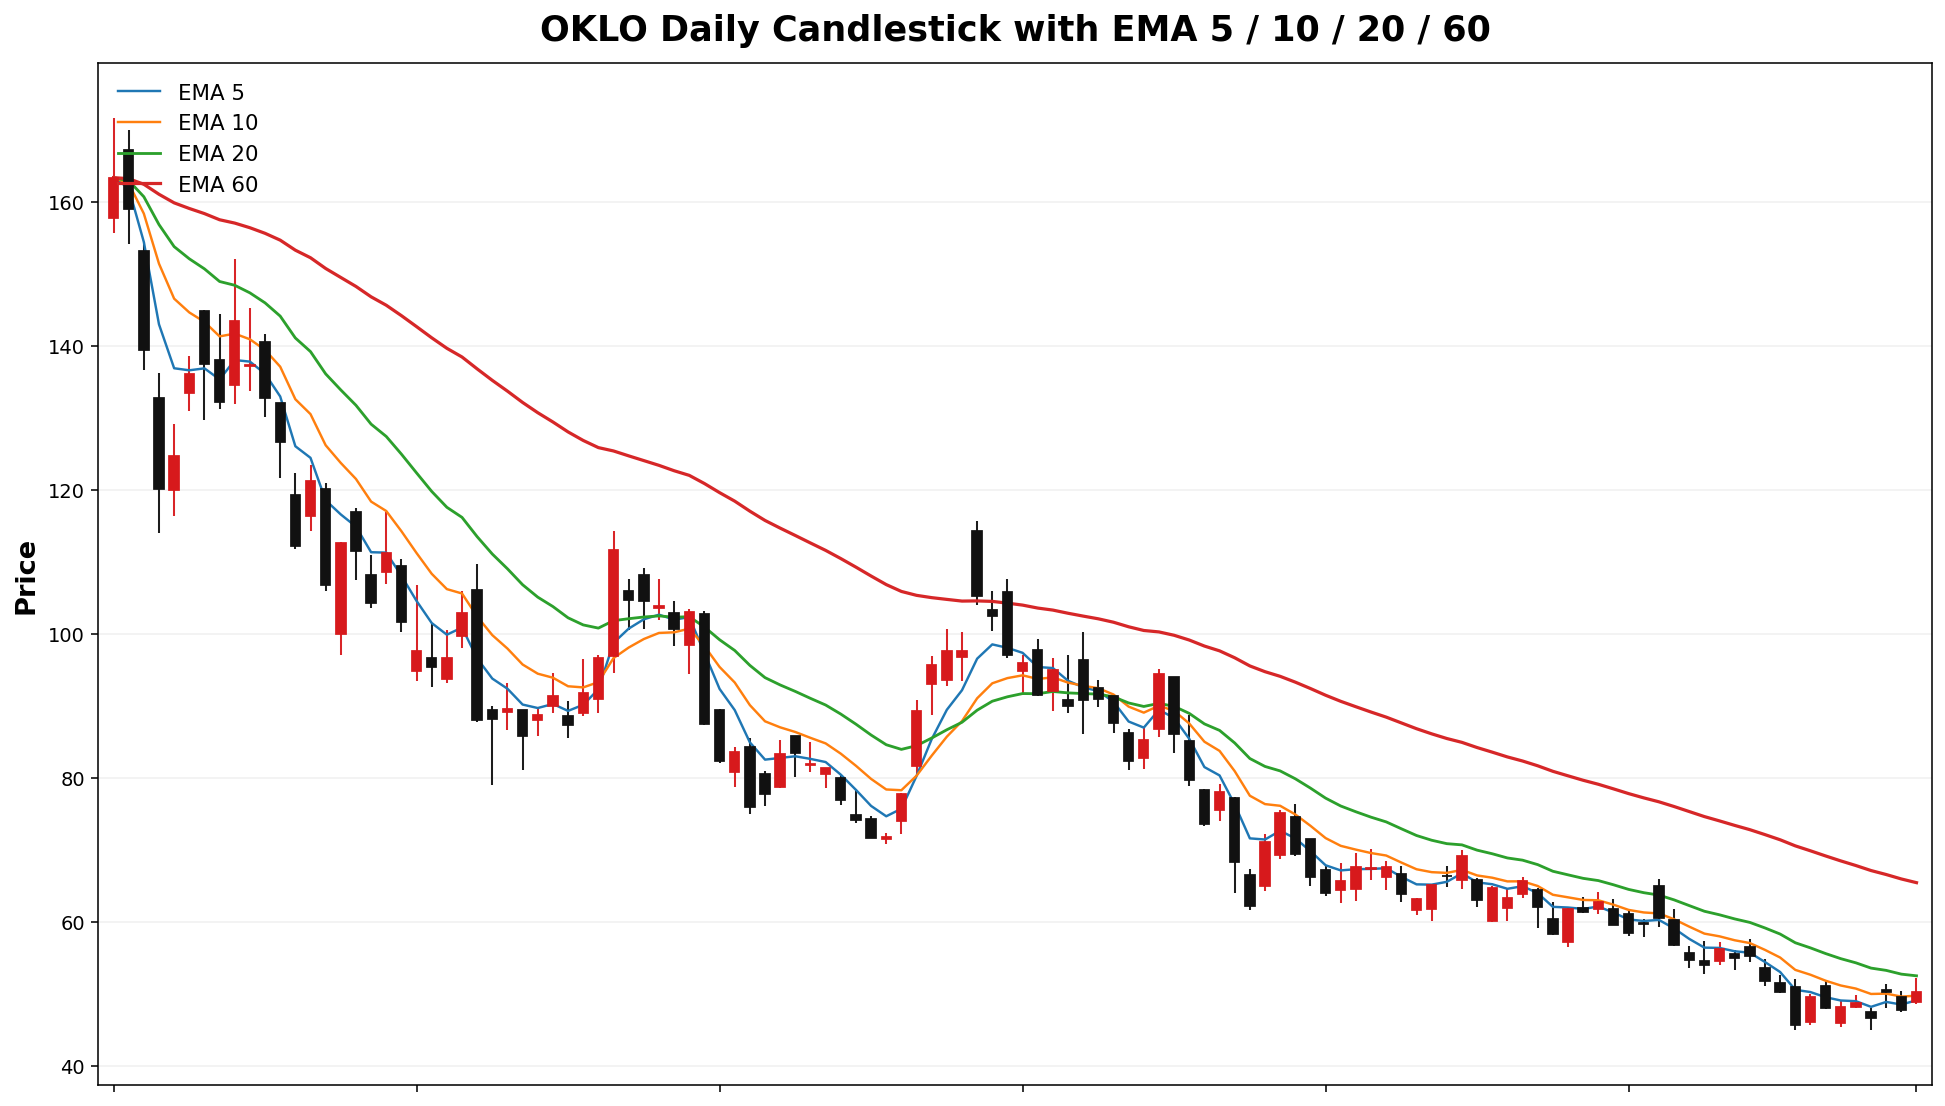
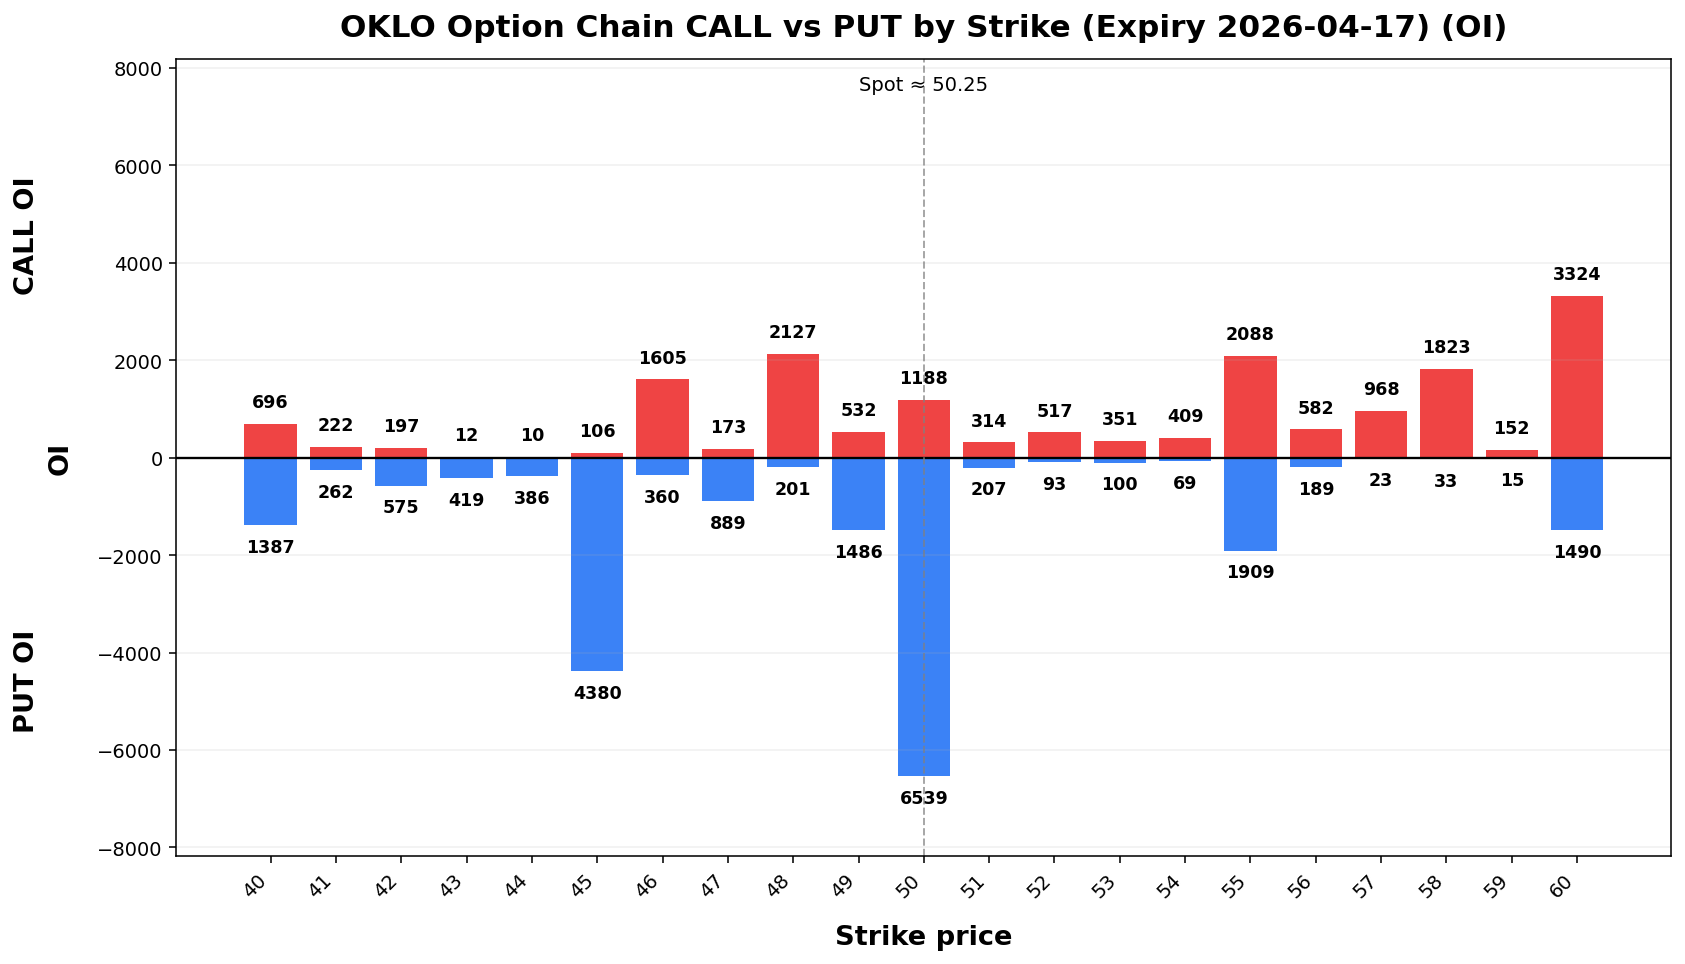
Term Structure
Expiry |
DTE |
Forward |
ATM IV |
ATM Straddle |
|---|
2026-04-17 |
6 |
50.32 |
77.15% |
4.88 |
2026-04-24 |
13 |
50.30 |
73.62% |
6.92 |
Weekly Range
Confidence |
Low |
High |
Width |
|---|
68% |
44.88 |
55.62 |
10.74 |
80% |
43.37 |
57.13 |
13.77 |
90% |
41.42 |
59.08 |
17.67 |
95% |
39.72 |
60.78 |
21.05 |
Structure & Probabilities
Support |
Resistance |
Gamma Flip |
Max Pain |
P>Res |
P<Sup |
|---|
50.53.00 |
60.0007 |
52.35 |
53.00 |
4.2% |
58.1% |
Flow & Skew
Call Vol |
Put Vol |
Vol P/C |
Call OI |
Put OI |
OI P/C |
Skew |
Skew Bias |
|---|
13,388 |
8,041 |
0.60 |
42,107 |
42,487 |
1.01 |
1.86 vol pts |
PUT_SKEW |
Tail Risk
Q10 |
Q50 |
Q90 |
Down Tail |
Up Tail |
Down/Up |
|---|
40.77 |
48.85 |
57.38 |
9.4866.66 |
7.13 |
1.33 |
Daily Technicals
EMA20 |
EMA50 |
VWAP20 |
BB Lower |
BB Mid |
BB Upper |
BB Width |
Vol Ratio |
Path |
|---|
52.47 |
61.63 |
53.53 |
43.36 |
52.37 |
61.38 |
34.39% |
0.85 |
DOWN trend (expanding) |
Day Plan
50.00-60.00 range: fade extremes
> 60.00: chase only if hold + vol
< 50.00: risk expand; reduce size
Regime: TREND
Tech: DOWN trend (expanding)
Swing Plan
Accumulate: 50.00-50.00
Trim: 60.00-60.00
Add: close > 60.00
Cut: close < 50.00
Best for: trend regime
Raw Text Summary
📌 OKLO @ 50.25 (2026-04-12 08:49 AM MYT)

• Current price is **50.25**. Key support is around **50.00**, and resistance is around **60.00**.
• For the next week, the model’s **68% expected range** is roughly **44.88 to 55.62**.
• A wider **90% range** is about **41.42 to 59.08**.
• Dealer positioning looks **SHORT gamma**, so the market behavior is classified as **TREND**.
• The estimated **gamma flip** is near **52.35**. Crossing and holding beyond this area can change the trading behavior.
• Approximate breakout odds: **above resistance 4.2%**, **below support 58.1%** by the target horizon.
• Options skew is fairly balanced, so there is **no strong directional bias** from skew alone.
• Near-term implied volatility is higher than the next expiry (**IV1 77.15% vs IV2 73.62%**), which suggests **near-term event stress / backwardation**.
• On the daily chart, the stock currently looks like **DOWN trend (expanding)**.
• The implied distribution shows **heavier downside tail risk** than upside tail potential.
IREN
Spot: 39.32
Report Time: 2026-04-12 08:49 AM MYT
Regime: TRANSITION
Dealer Gamma: LONG
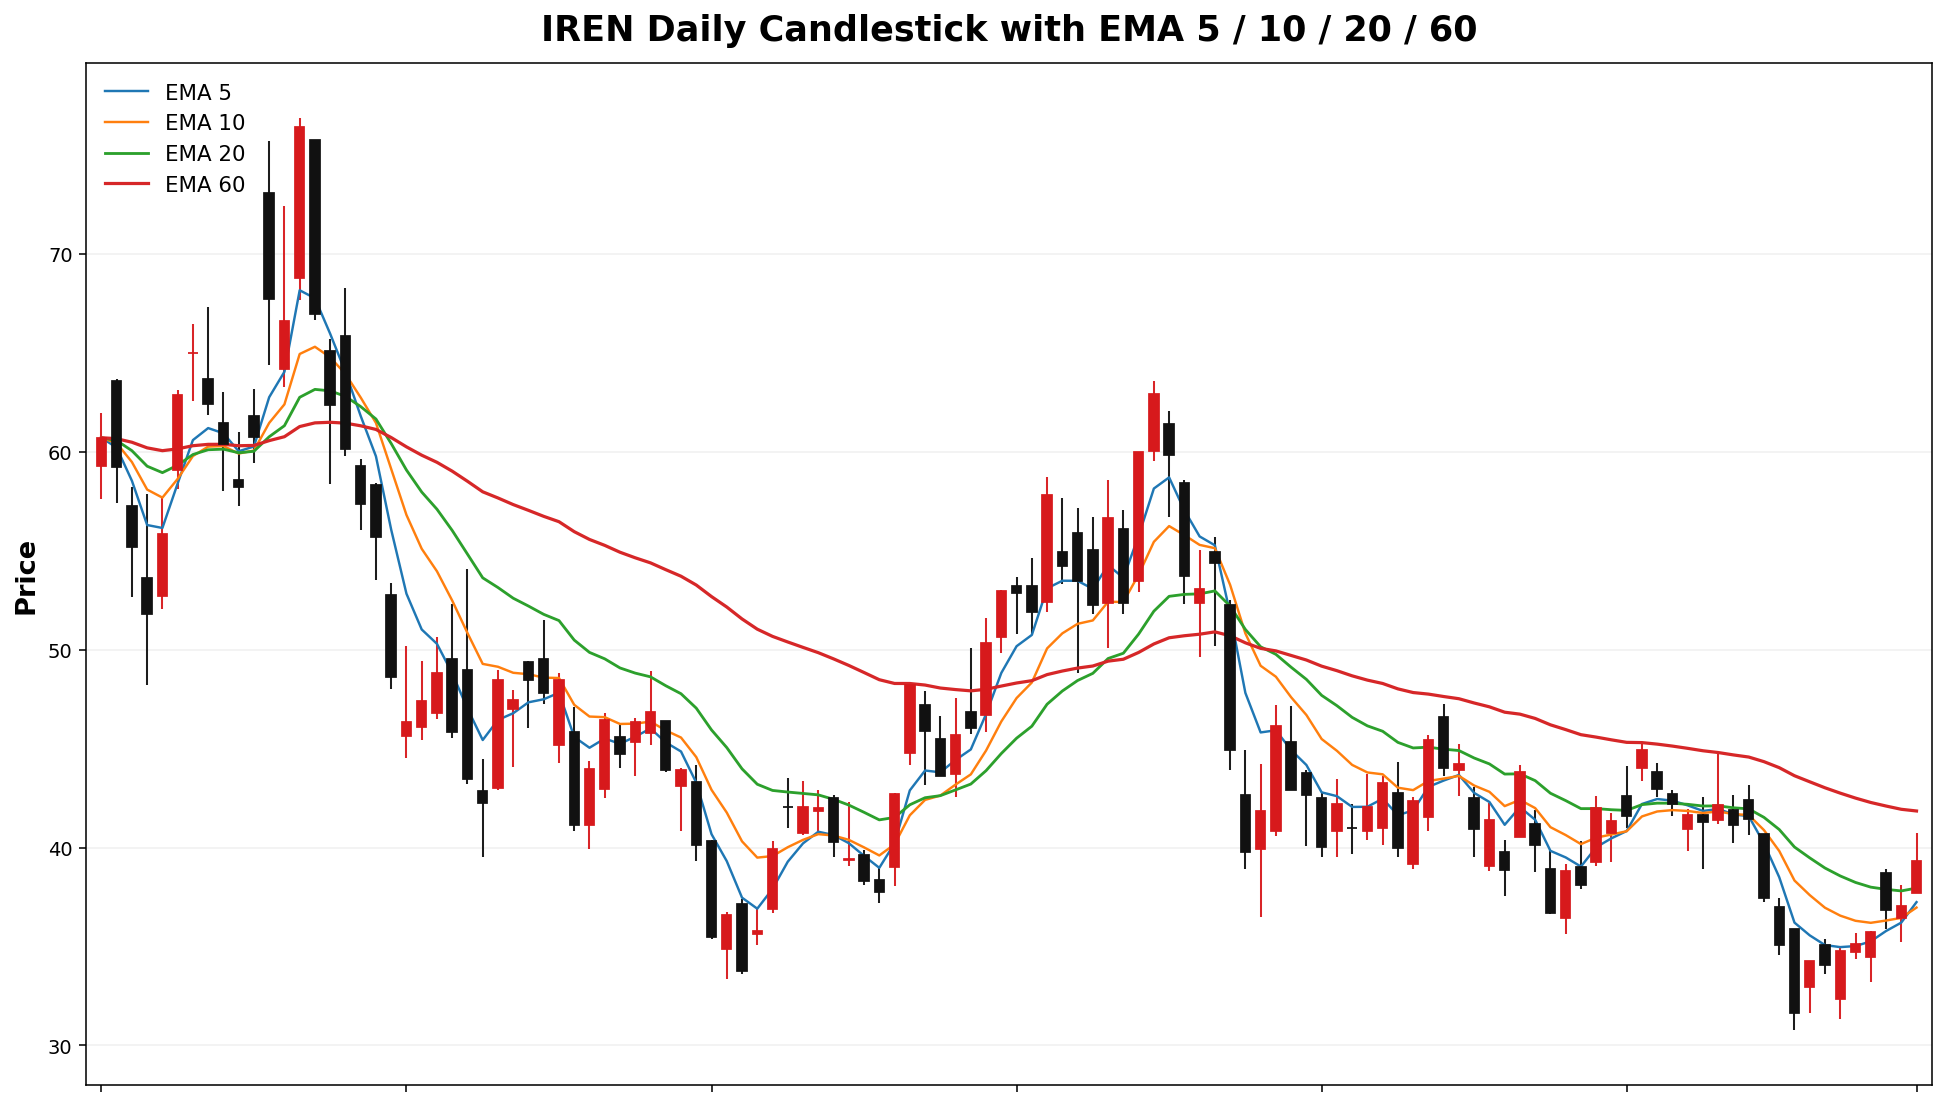
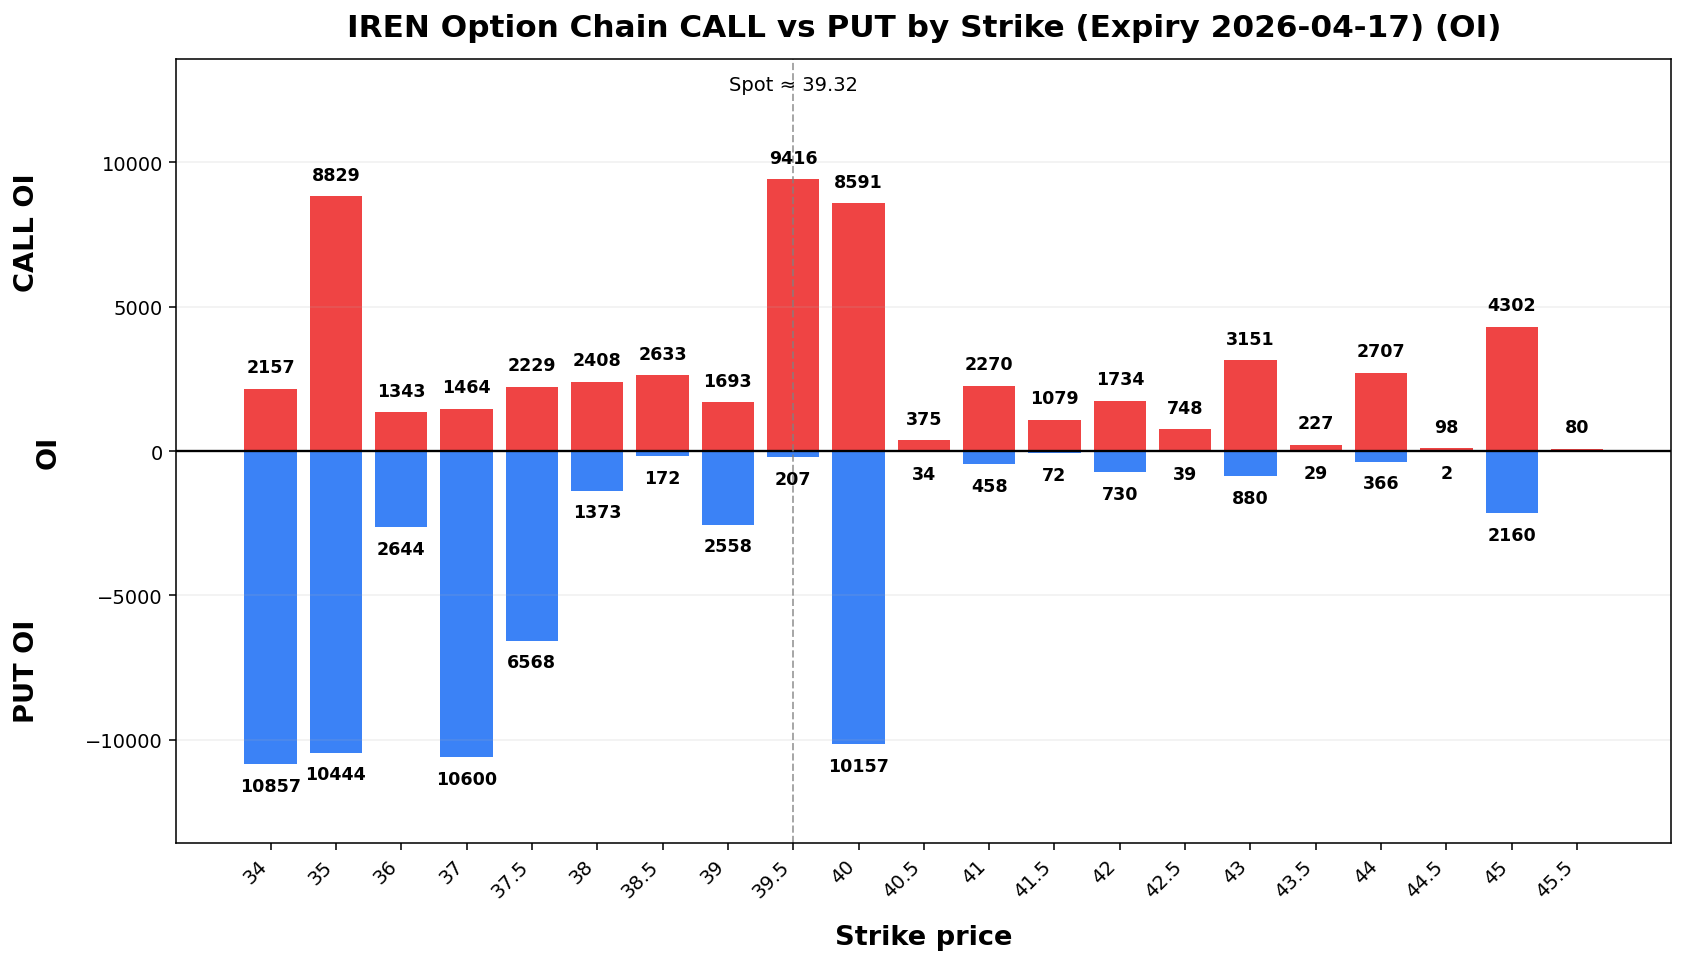
Term Structure
Expiry |
DTE |
Forward |
ATM IV |
ATM Straddle |
|---|
2026-04-17 |
6 |
39.38 |
80.43% |
3.99 |
2026-04-24 |
13 |
39.45 |
79.95% |
5.88 |
Weekly Range
Confidence |
Low |
High |
Width |
|---|
68% |
34.87 |
43.77 |
8.89 |
80% |
33.62 |
45.02 |
11.39 |
90% |
32.01 |
46.63 |
14.62 |
95% |
30.61 |
48.03 |
17.42 |
Structure & Probabilities
Support |
Resistance |
Gamma Flip |
Max Pain |
P>Res |
P<Sup |
|---|
37.50 |
39.50 |
38.04 |
37.50 |
39.7% |
33.5% |
Flow & Skew
Call Vol |
Put Vol |
Vol P/C |
Call OI |
Put OI |
OI P/C |
Skew |
Skew Bias |
|---|
53,934 |
31,105 |
0.58 |
108,296 |
101,040 |
0.93 |
7.91 vol pts |
PUT_SKEW |
Tail Risk
Q10 |
Q50 |
Q90 |
Down Tail |
Up Tail |
Down/Up |
|---|
31.40 |
39.45 |
46.14 |
7.9234 |
6.8232 |
1.16 |
Daily Technicals
| EMA20 |
EMA50 |
VWAP20 |
BB Lower |
BB Mid |
BB Upper |
BB Width |
Vol Ratio |
Path |
37.9658.18 |
40.8462.48 |
38.6956.79 |
31.0451.90 |
38.5456.76 |
46.0361.62 |
38.91%17.12% |
1.120.95 |
Sideways / Range |
Day Plan
37.50-39.5057.00-61.00 range: fade extremes- >
39.50:61.00: chase only if hold + vol
- <
37.50:57.00: risk expand; reduce size
- Regime: TRANSITION
- Tech: Sideways / Range
Swing Plan
- Accumulate:
37.50-37.5057.00-57.00
- Trim:
39.50-39.5061.00-61.00
- Add: close >
39.5061.00
- Cut: close <
37.5057.00
- Best for: transition regime
Raw Text Summary
📌 IRENRBLX @ 39.3260.34 (2026-04-1219 08:4915 AM MYT)

• Current price is **39.32*60.34**. Key support is around **37.50*57.00**, and resistance is around **39.50*61.00**.
• For the next week, the model’s **68% expected range** is roughly **34.8754.49 to 43.77*66.19**.
• A wider **90% range** is about **32.0150.72 to 46.63*69.96**.
• Dealer positioning looks **LONG gamma**, so the market behavior is classified as **TRANSITION**.
• The estimated **gamma flip** is near **38.04*56.27**. Crossing and holding beyond this area can change the trading behavior.
• Approximate breakout odds: **above resistance 39.7%37.1%**, **below support 33.5%** by the target horizon.
• Options skew is tilted toward **puts**, which suggests traders are paying more for downside protection.
• Near-term implied volatility is higher than the next expiry (**IV1 80.43% vs IV2 79.95%**), which suggests **near-term event stress / backwardation**.
• On the daily chart, the stock currently looks like **Sideways / Range**.
• The implied distribution shows **heavier downside tail risk** than upside tail potential.
ETHU
Spot: 25.66
Report Time: 2026-04-12 08:49 AM MYT
Regime: TRANSITION
Dealer Gamma: LONG
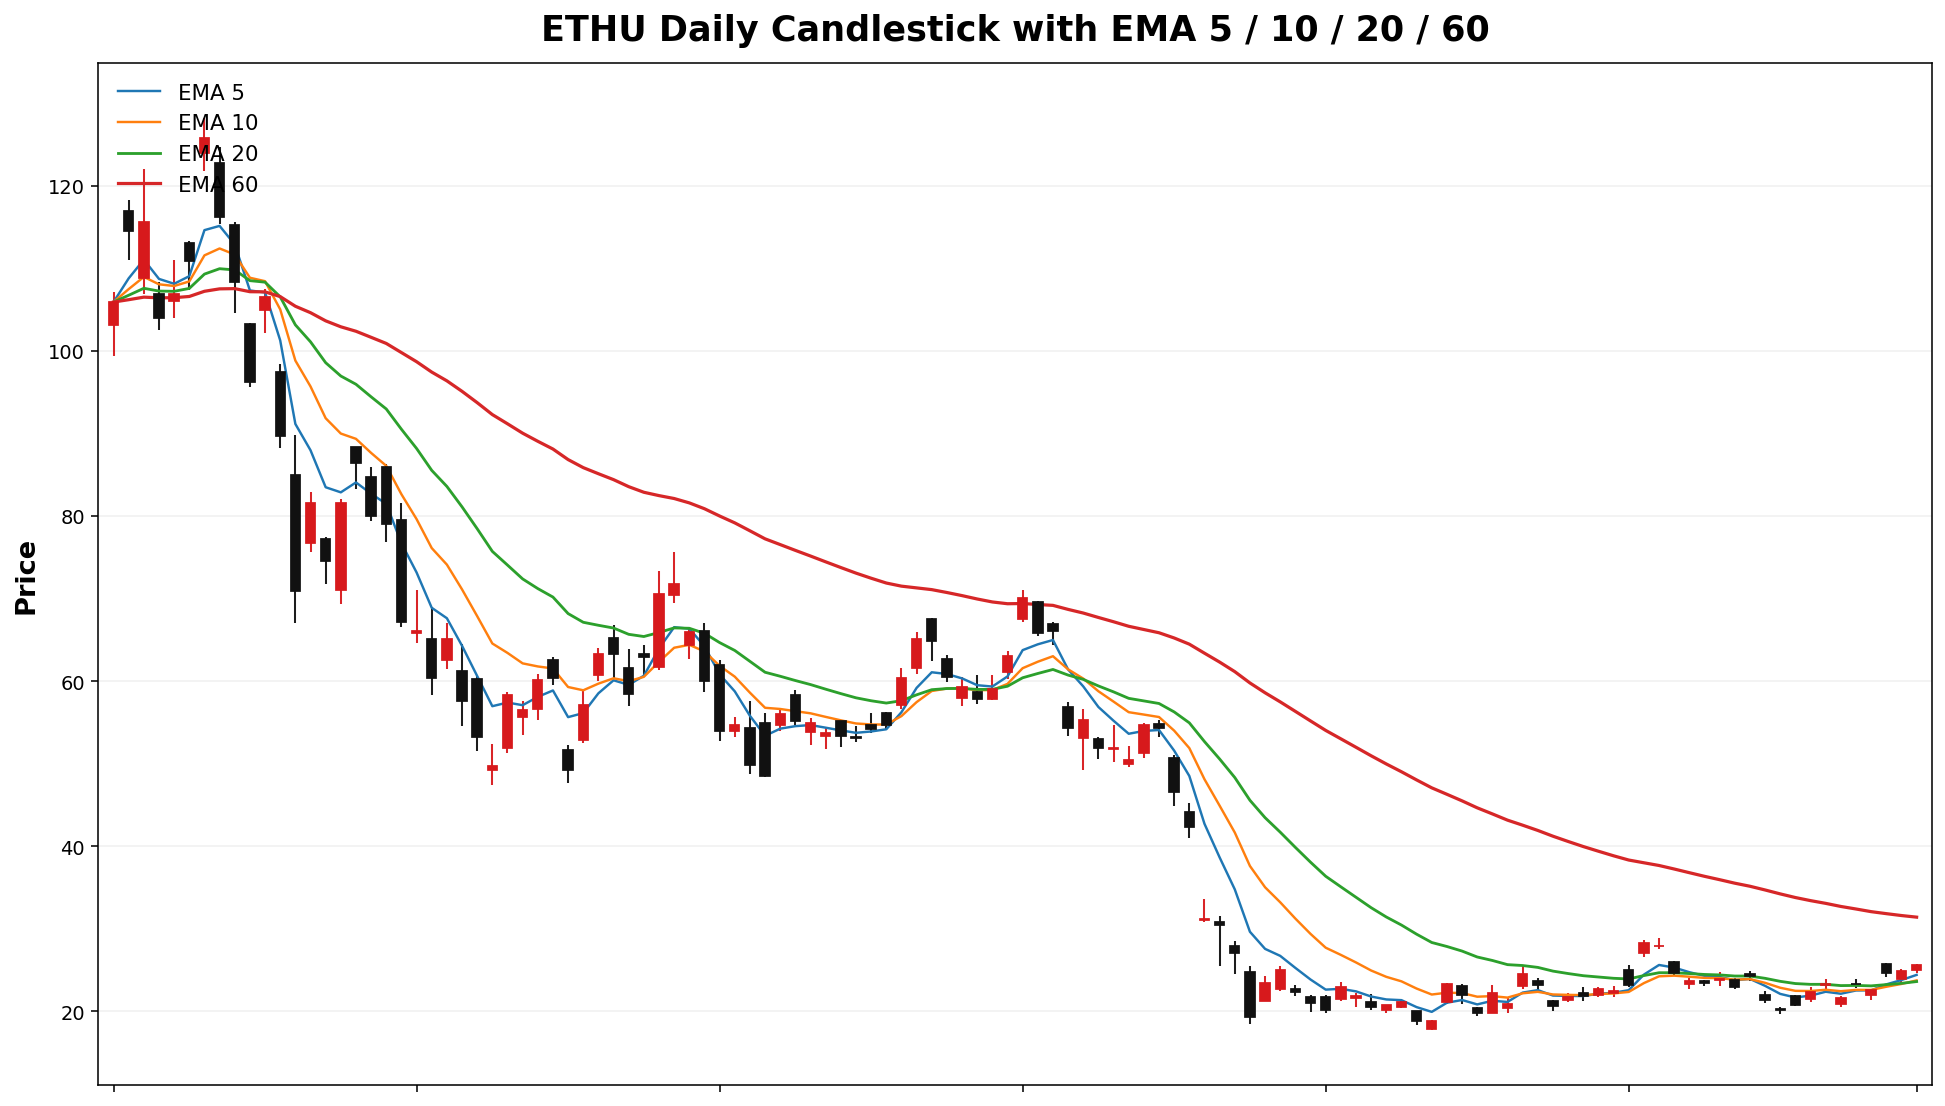
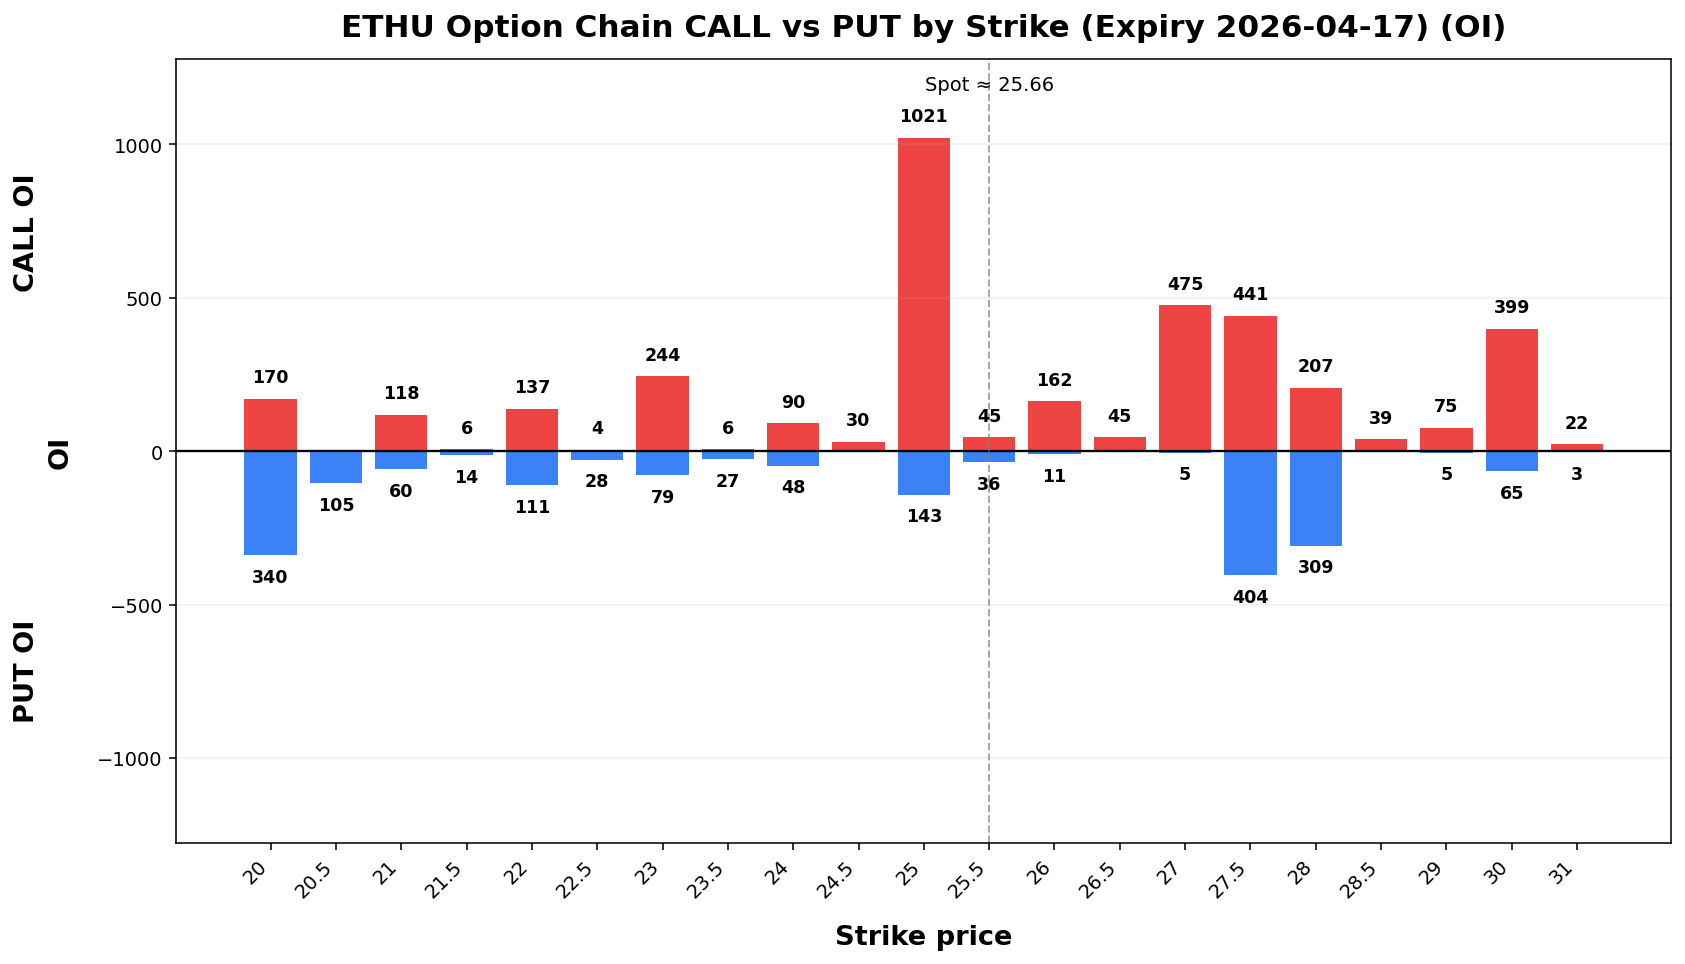
Term Structure
Expiry |
DTE |
Forward |
ATM IV |
ATM Straddle |
|---|
2026-04-17 |
6 |
25.50 |
97.43% |
3.15 |
2026-04-24 |
13 |
25.46 |
97.33% |
4.67 |
Weekly Range
Confidence |
Low |
High |
Width |
|---|
68% |
22.14 |
29.18 |
7.04 |
80% |
21.15 |
30.17 |
9.02 |
90% |
19.87 |
31.45 |
11.58 |
95% |
18.76 |
32.56 |
13.80 |
Structure & Probabilities
Support |
Resistance |
Gamma Flip |
Max Pain |
P>Res |
P<Sup |
|---|
25.00 |
27.00 |
21.42 |
25.00 |
29.9% |
36.2% |
Flow & Skew
Call Vol |
Put Vol |
Vol P/C |
Call OI |
Put OI |
OI P/C |
Skew |
Skew Bias |
|---|
2,210 |
780 |
0.35 |
5,306 |
4,525 |
0.85 |
1.76 vol pts |
PUT_SKEW |
Tail Risk
Q10 |
Q50 |
Q90 |
Down Tail |
Up Tail |
Down/Up |
|---|
7.65 |
24.73 |
29.68 |
18.01 |
4.02 |
4.48 |
Daily Technicals
EMA20 |
EMA50 |
VWAP20 |
BB Lower |
BB Mid |
BB Upper |
BB Width |
Vol Ratio |
Path |
|---|
23.60 |
28.99 |
23.91 |
19.53 |
23.65 |
27.76 |
34.81% |
0.85 |
Sideways / Range |
Day Plan
25.00-27.00 range: fade extremes
> 27.00: chase only if hold + vol
< 25.00: risk expand; reduce size
Regime: TRANSITION
Tech: Sideways / Range
Swing Plan
Accumulate: 25.00-25.00
Trim: 27.00-27.00
Add: close > 27.00
Cut: close < 25.00
Best for: transition regime
Raw Text Summary
📌 ETHU @ 25.66 (2026-04-12 08:49 AM MYT)

• Current price is **25.66**. Key support is around **25.00**, and resistance is around **27.00**.
• For the next week, the model’s **68% expected range** is roughly **22.14 to 29.18**.
• A wider **90% range** is about **19.87 to 31.45**.
• Dealer positioning looks **LONG gamma**, so the market behavior is classified as **TRANSITION**.
• The estimated **gamma flip** is near **21.42**. Crossing and holding beyond this area can change the trading behavior.
• Approximate breakout odds: **above resistance 29.9%**, **below support 36.2%** by the target horizon.
• Options skew is fairly balanced, so there is **no strong directional bias** from skew alone.
• Near-term implied volatility is higher than the next expiry (**IV1 97.43% vs IV2 97.33%**), which suggests **near-term event stress / backwardation**.
• On the daily chart, the stock currently looks like **Sideways / Range**.
• The implied distribution shows **heavier downside tail risk** than upside tail potential.
DPST
Spot: 114.01
Report Time: 2026-04-12 08:49 AM MYT
Regime: TRANSITION
Dealer Gamma: LONG
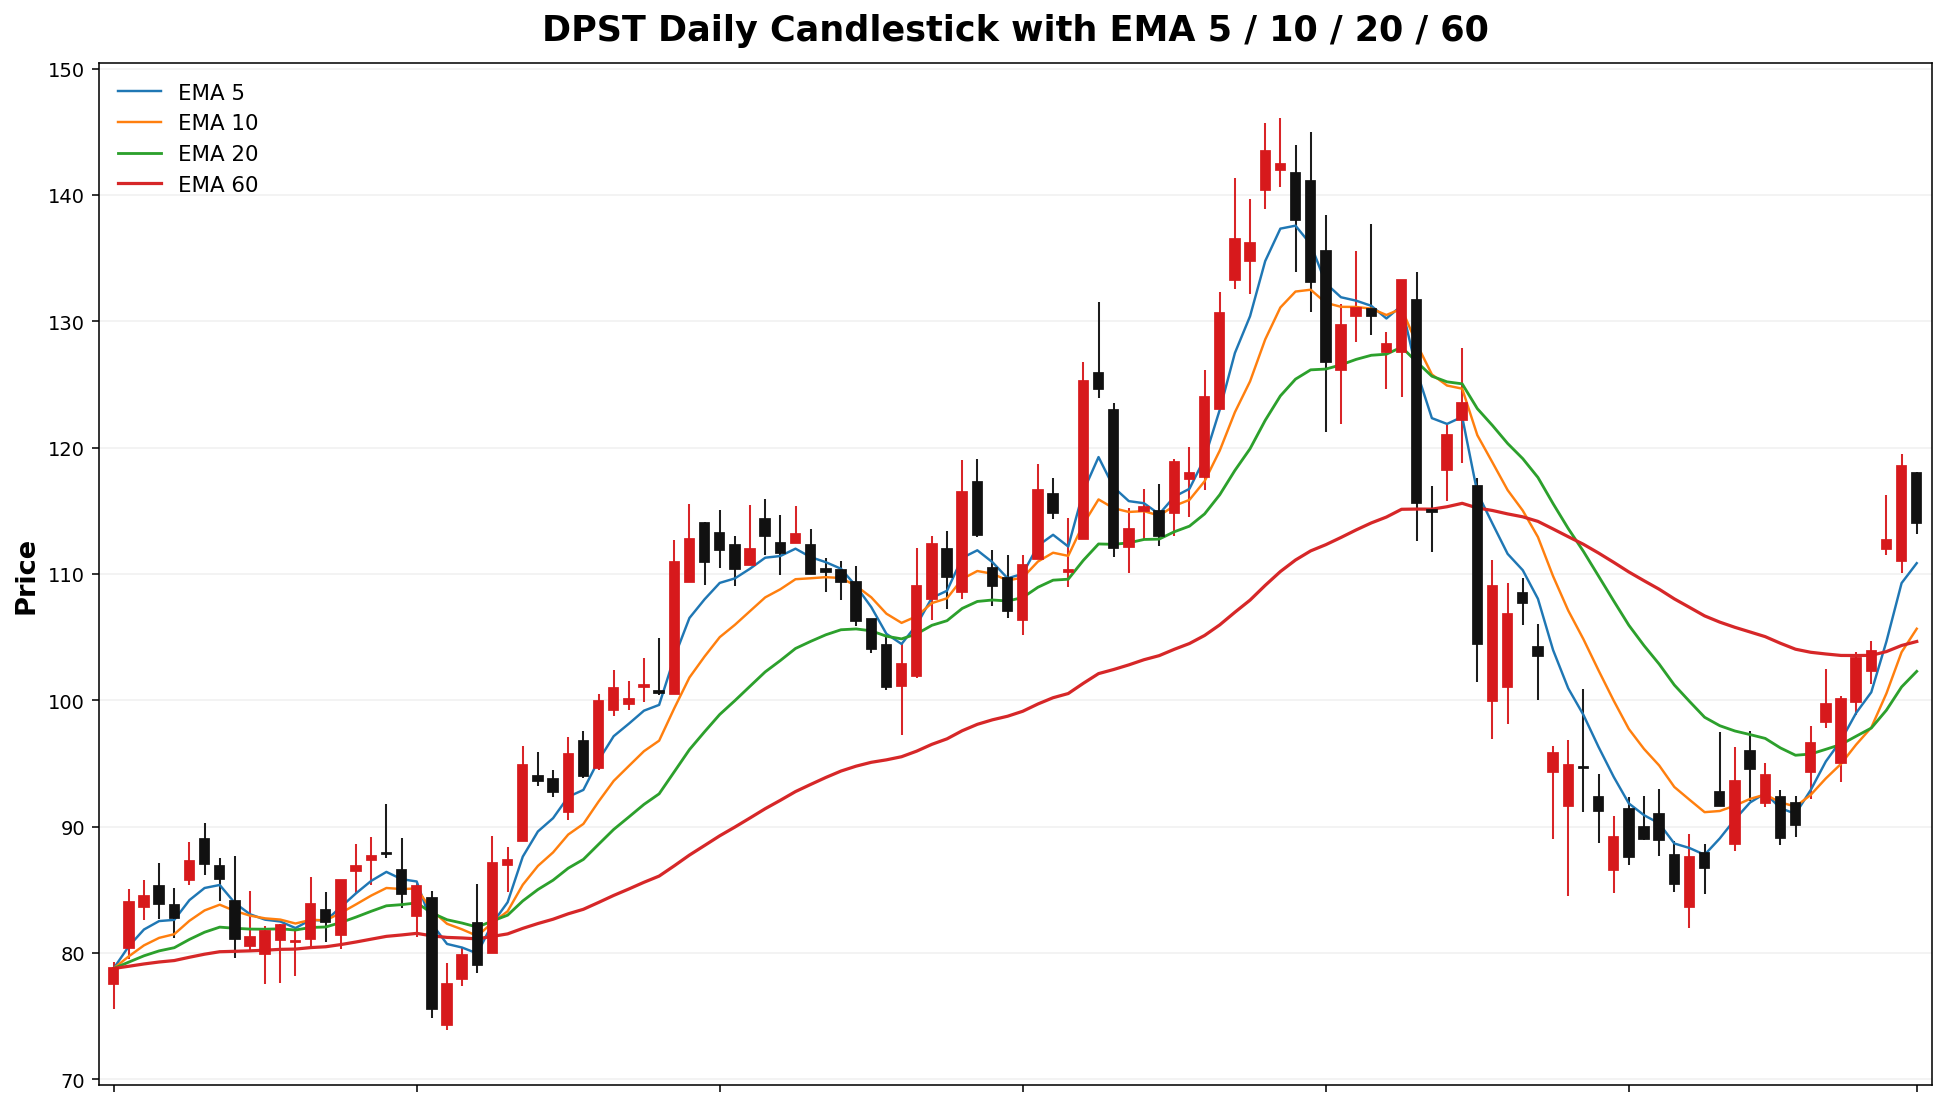
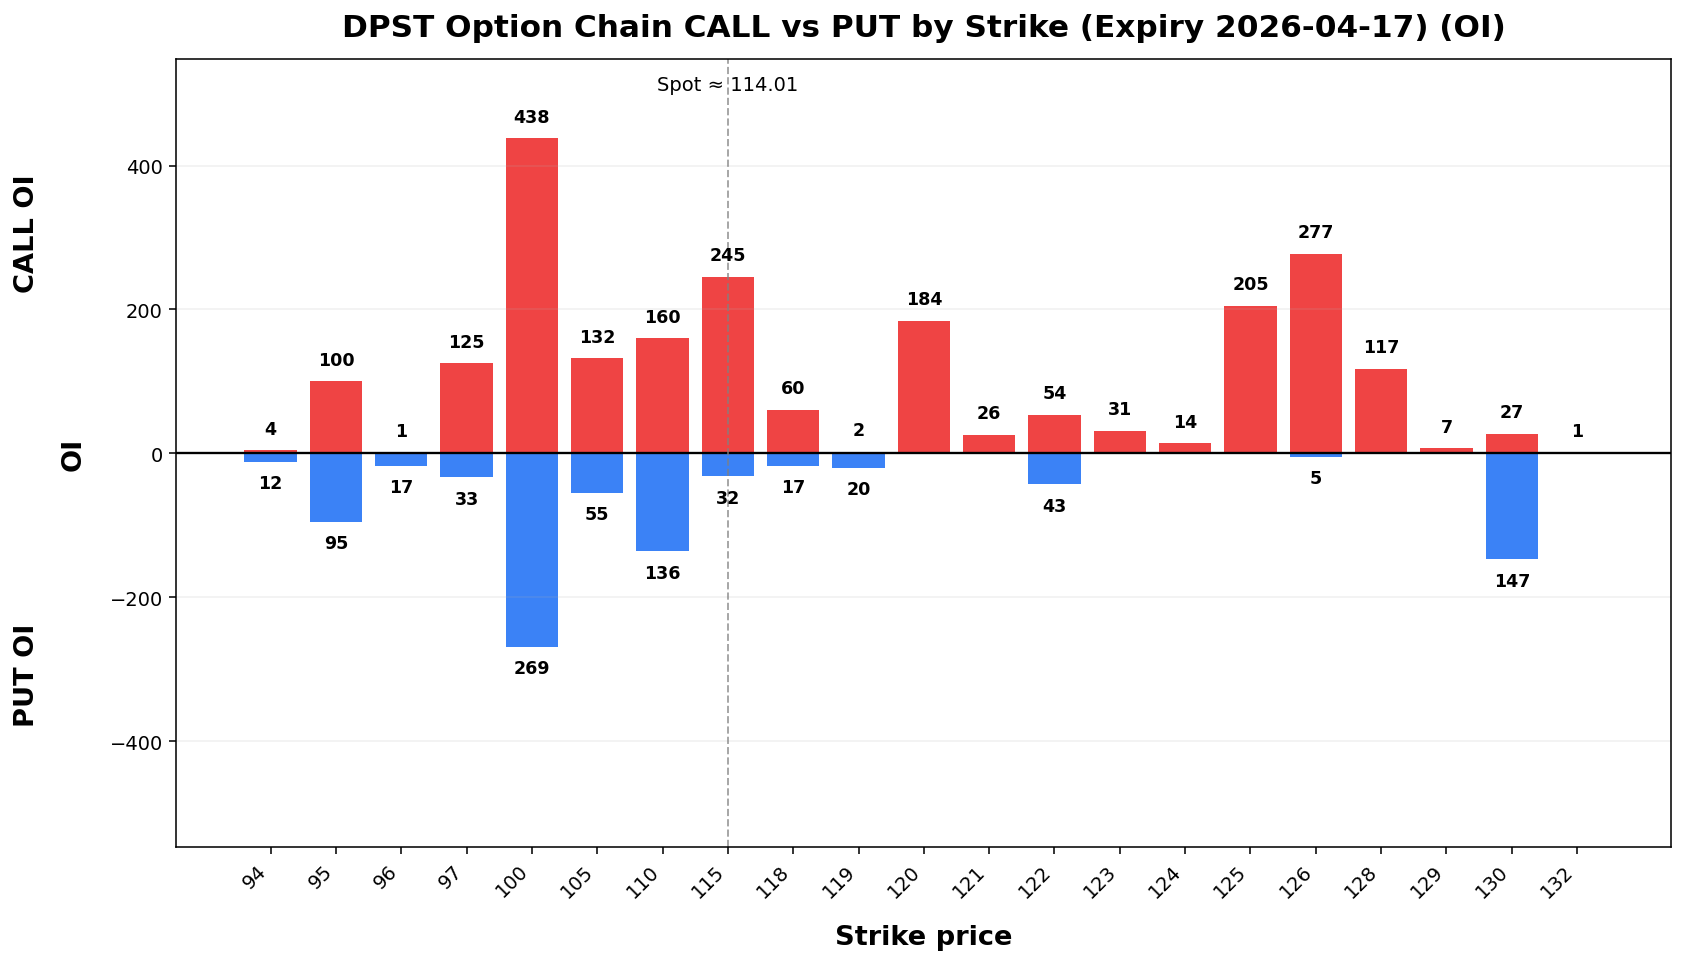
Term Structure
Expiry |
DTE |
Forward |
ATM IV |
ATM Straddle |
|---|
2026-04-17 |
6 |
114.14 |
62.30% |
8.95 |
2026-04-24 |
13 |
114.42 |
64.43% |
13.75 |
Weekly Range
Confidence |
Low |
High |
Width |
|---|
68% |
103.88 |
124.14 |
20.26 |
80% |
101.03 |
126.99 |
25.97 |
90% |
97.35 |
130.67 |
33.33 |
95% |
94.15 |
133.87 |
39.71 |
Structure & Probabilities
Support |
Resistance |
Gamma Flip |
Max Pain |
P>Res |
P<Sup |
|---|
100.00 |
115.00 |
99.23 |
100.00 |
34.6% |
7.5% |
Flow & Skew
Call Vol |
Put Vol |
Vol P/C |
Call OI |
Put OI |
OI P/C |
Skew |
Skew Bias |
|---|
551 |
688 |
1.25 |
2,418 |
3,436 |
1.42 |
7.76 vol pts |
PUT_SKEW |
Tail Risk
Q10 |
Q50 |
Q90 |
Down Tail |
Up Tail |
Down/Up |
|---|
95.53 |
113.85 |
127.69 |
18.48 |
13.68 |
1.35 |
Daily Technicals
EMA20 |
EMA50 |
VWAP20 |
BB Lower |
BB Mid |
BB Upper |
BB Width |
Vol Ratio |
Path |
|---|
102.29 |
104.56 |
96.42 |
76.89 |
96.38 |
115.87 |
40.44% |
1.02 |
Sideways / Range |
Day Plan
100.00-115.00 range: fade extremes
> 115.00: chase only if hold + vol
< 100.00: risk expand; reduce size
Regime: TRANSITION
Tech: Sideways / Range
Swing Plan
Accumulate: 100.00-100.00
Trim: 115.00-115.00
Add: close > 115.00
Cut: close < 100.00
Best for: transition regime
Raw Text Summary
📌 DPST @ 114.01 (2026-04-12 08:49 AM MYT)

• Current price is **114.01**. Key support is around **100.00**, and resistance is around **115.00**.
• For the next week, the model’s **68% expected range** is roughly **103.88 to 124.14**.
• A wider **90% range** is about **97.35 to 130.67**.
• Dealer positioning looks **LONG gamma**, so the market behavior is classified as **TRANSITION**.
• The estimated **gamma flip** is near **99.23**. Crossing and holding beyond this area can change the trading behavior.
• Approximate breakout odds: **above resistance 34.6%**, **below support 7.5%** by the target horizon.
• Options skew is tilted toward **puts**, which suggests traders are paying more for downside protection.
• Near-term implied volatility is lower than the next expiry (**IV1 62.30%55.32% vs IV2 64.43%87.79%**), which suggests a **contango / calmer front expiry** setup.
• On the daily chart, the stock currently looks like **Sideways / Range**.
• The implied distribution shows **heavier downside tail risk** than upside tail potential.
USDALAB
Spot: 61.89174.05
Report Time: 2026-04-1219 08:4915 AM MYT
Regime: TRANSITION
Dealer Gamma: LONG
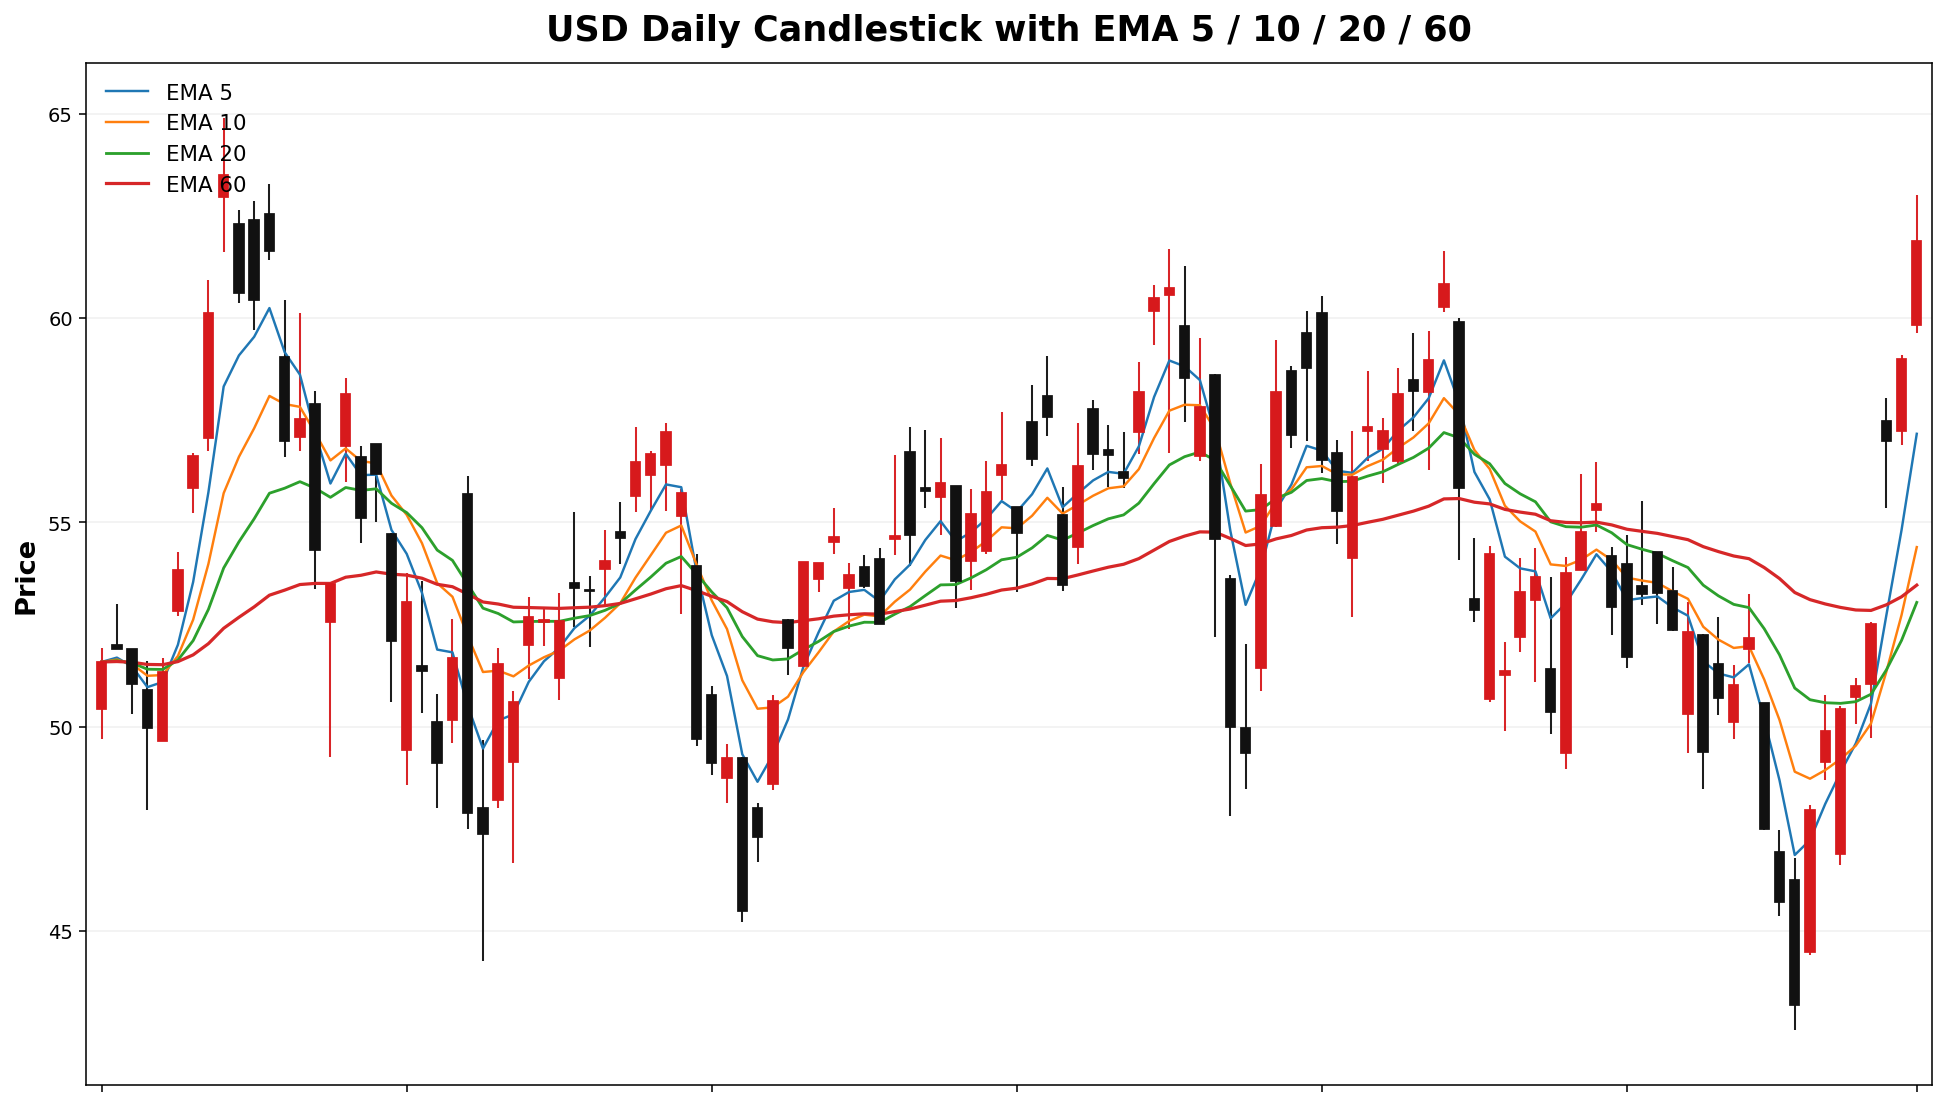
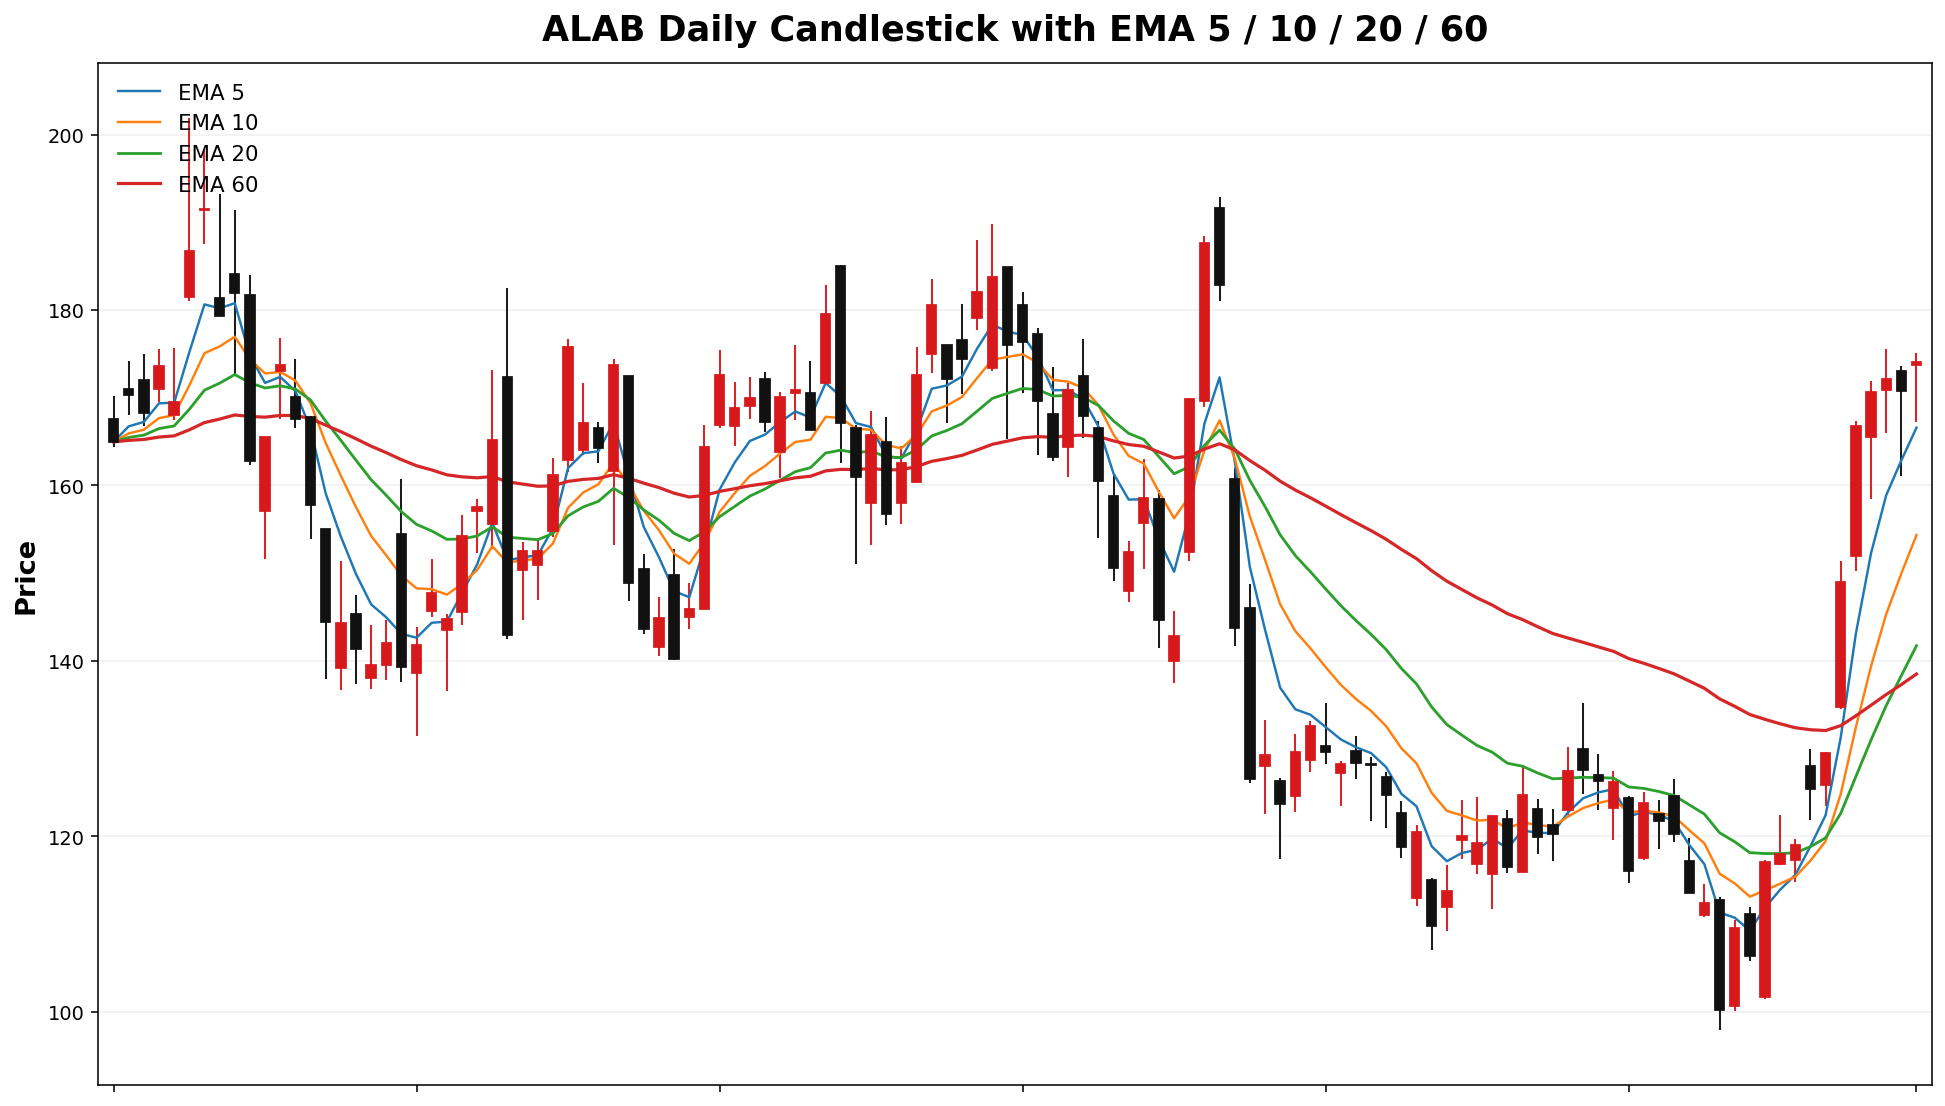
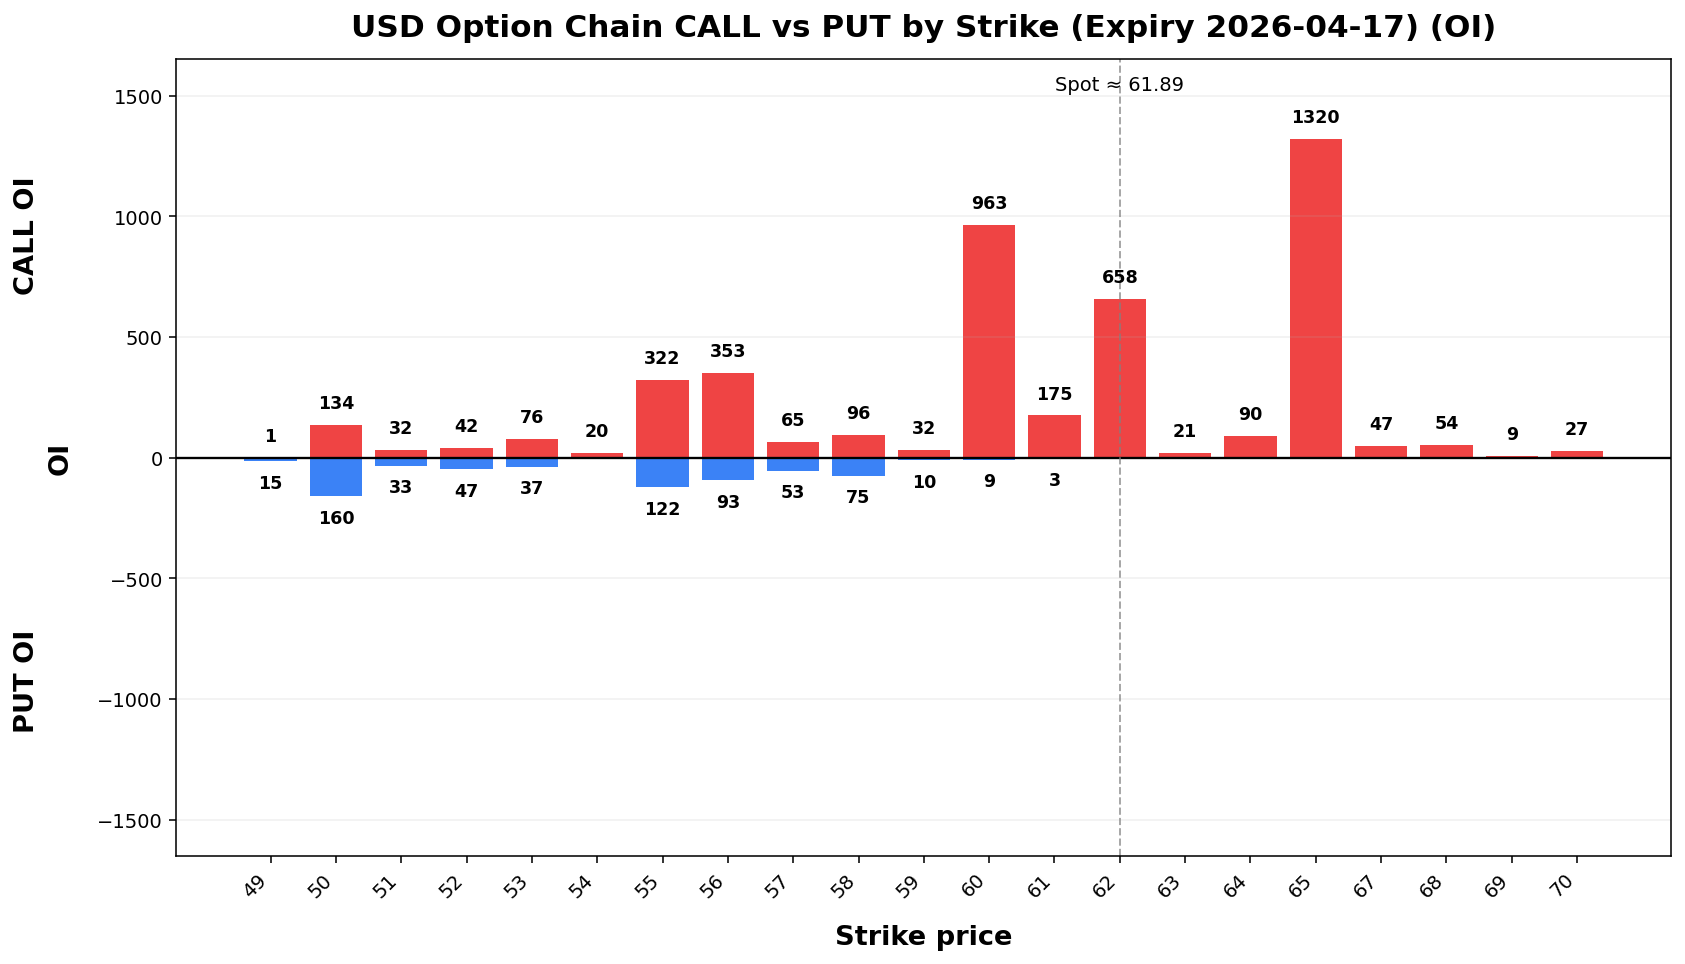
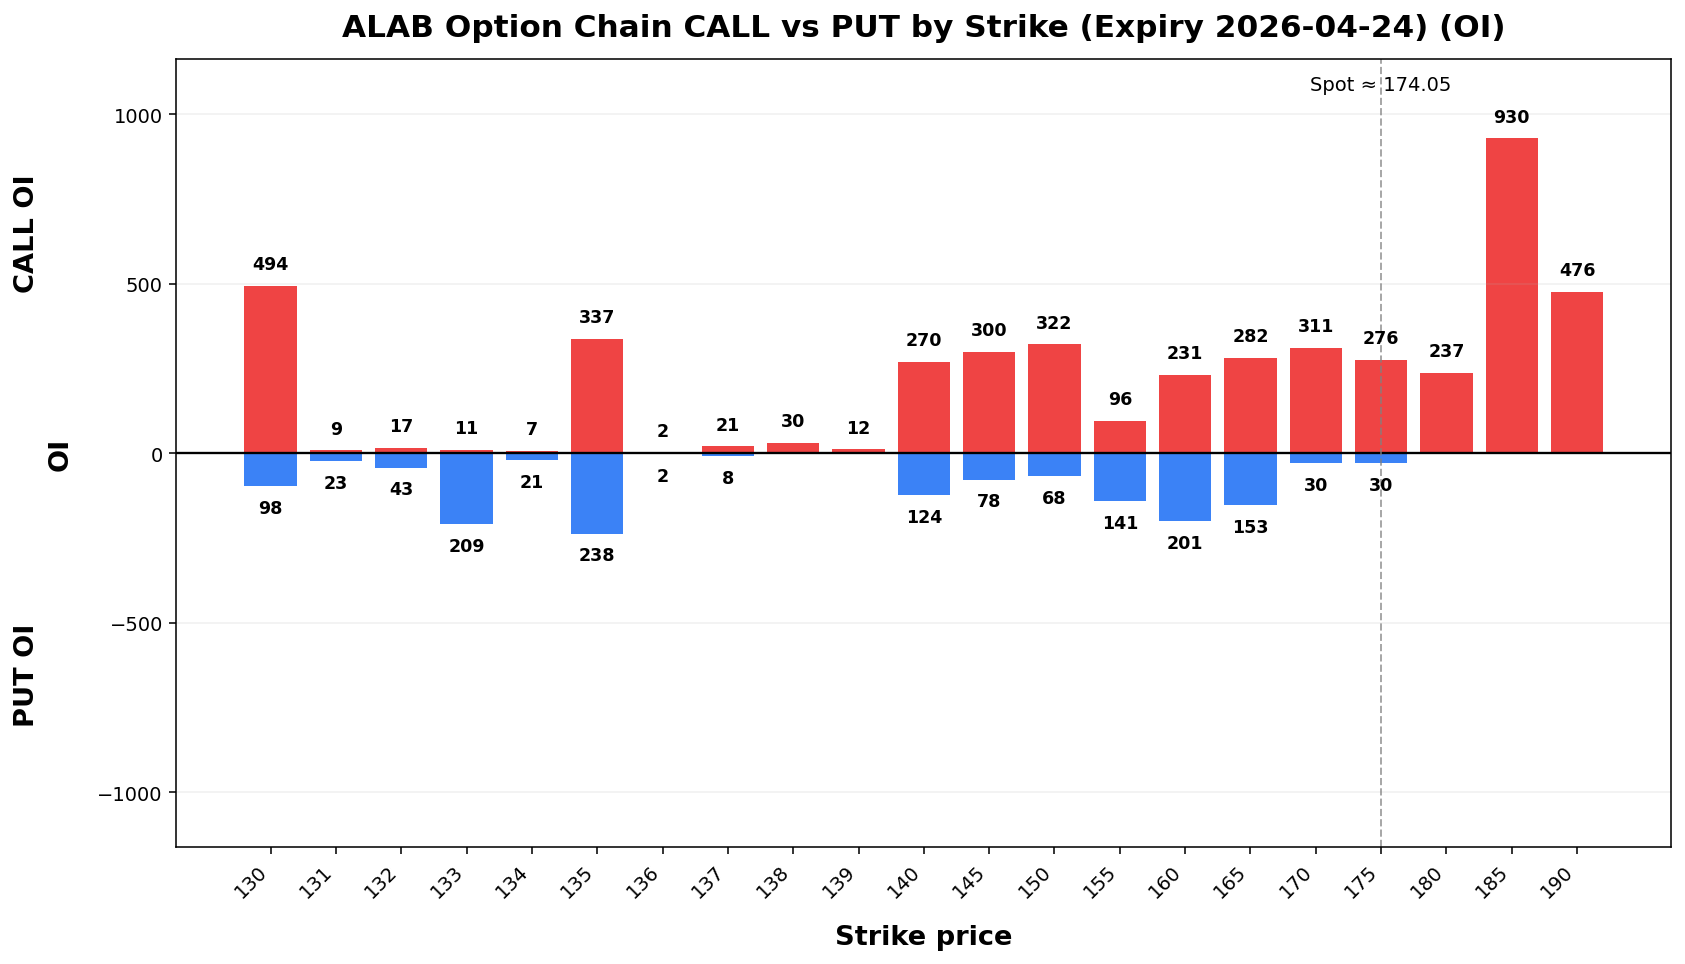
Term Structure
| Expiry |
DTE |
Forward |
ATM IV |
ATM Straddle |
2026-04-1724 |
6 |
62.05174.24 |
71.81%67.92% |
5.6014.92 |
2026-05-1501 |
3413 |
61.96174.27 |
64.00%67.92% |
12.0522.15 |
Weekly Range
| Confidence |
Low |
High |
Width |
| 68% |
55.79157.40 |
67.99190.70 |
12.2133.30 |
| 80% |
54.07 |
69.152.71 |
15.64195.39 |
42.68 |
| 90% |
51.85146.66 |
71.93201.44 |
20.0854.78 |
| 95% |
49.93141.41 |
73.85206.69 |
23.9265.27 |
Structure & Probabilities
| Support |
Resistance |
Gamma Flip |
Max Pain |
P>Res |
P<Sup |
61.170.00 |
62.175.00 |
48.57119.14 |
53.65.00 |
40.5%6% |
43.4%34.3% |
Flow & Skew
| Call Vol |
Put Vol |
Vol P/C |
Call OI |
Put OI |
OI P/C |
Skew |
Skew Bias |
4802,562 |
8701,728 |
0.67 |
5,815 |
4,394 |
0.76 |
1.81 |
4,730 |
2,236 |
0.47 |
39.1659 vol pts |
PUT_SKEW |
Tail Risk
| Q10 |
Q50 |
Q90 |
Down Tail |
Up Tail |
Down/Up |
53.91138.90 |
64.47168.79 |
68.77183.03 |
7.35.15 |
8.98 |
6.88 |
1.163.92 |
Daily Technicals
| EMA20 |
EMA50 |
VWAP20 |
BB Lower |
BB Mid |
BB Upper |
BB Width |
Vol Ratio |
Path |
53.04141.74 |
53.31137.57 |
51.70135.30 |
43.1081.66 |
51.61131.84 |
60.12182.01 |
32.98%76.11% |
1.1401 |
SidewaysUP /trend Range(expanding) |
Day Plan
61.170.00-62.175.00 range: fade extremes- >
62.175.00: chase only if hold + vol
- <
61.170.00: risk expand; reduce size
- Regime: TRANSITION
- Tech:
SidewaysUP /trend Range(expanding)
Swing Plan
- Accumulate:
61.170.00-61.170.00
- Trim:
62.175.00-62.175.00
- Add: close >
62.175.00
- Cut: close <
61.170.00
- Best for: transition regime
Raw Text Summary
📌 USDALAB @ 61.89174.05 (2026-04-1219 08:4915 AM MYT)

• Current price is **61.89*174.05**. Key support is around **61.170.00**, and resistance is around **62.175.00**.
• For the next week, the model’s **68% expected range** is roughly **55.79157.40 to 67.99*190.70**.
• A wider **90% range** is about **51.85146.66 to 71.93*201.44**.
• Dealer positioning looks **LONG gamma**, so the market behavior is classified as **TRANSITION**.
• The estimated **gamma flip** is near **48.57*119.14**. Crossing and holding beyond this area can change the trading behavior.
• Approximate breakout odds: **above resistance 40.5%6%**, **below support 43.4%34.3%** by the target horizon.
• Options skew is fairly balanced, so there is **no strong directional bias** from skew alone.
• Near-term implied volatility is lower than the next expiry (**IV1 67.92% vs IV2 67.92%**), which suggests a **contango / calmer front expiry** setup.
• On the daily chart, the stock currently looks like **UP trend (expanding)**.
• The implied distribution shows **heavier downside tail risk** than upside tail potential.
APLD
Spot: 31.53
Report Time: 2026-04-19 08:15 AM MYT
Regime: TRANSITION
Dealer Gamma: LONG
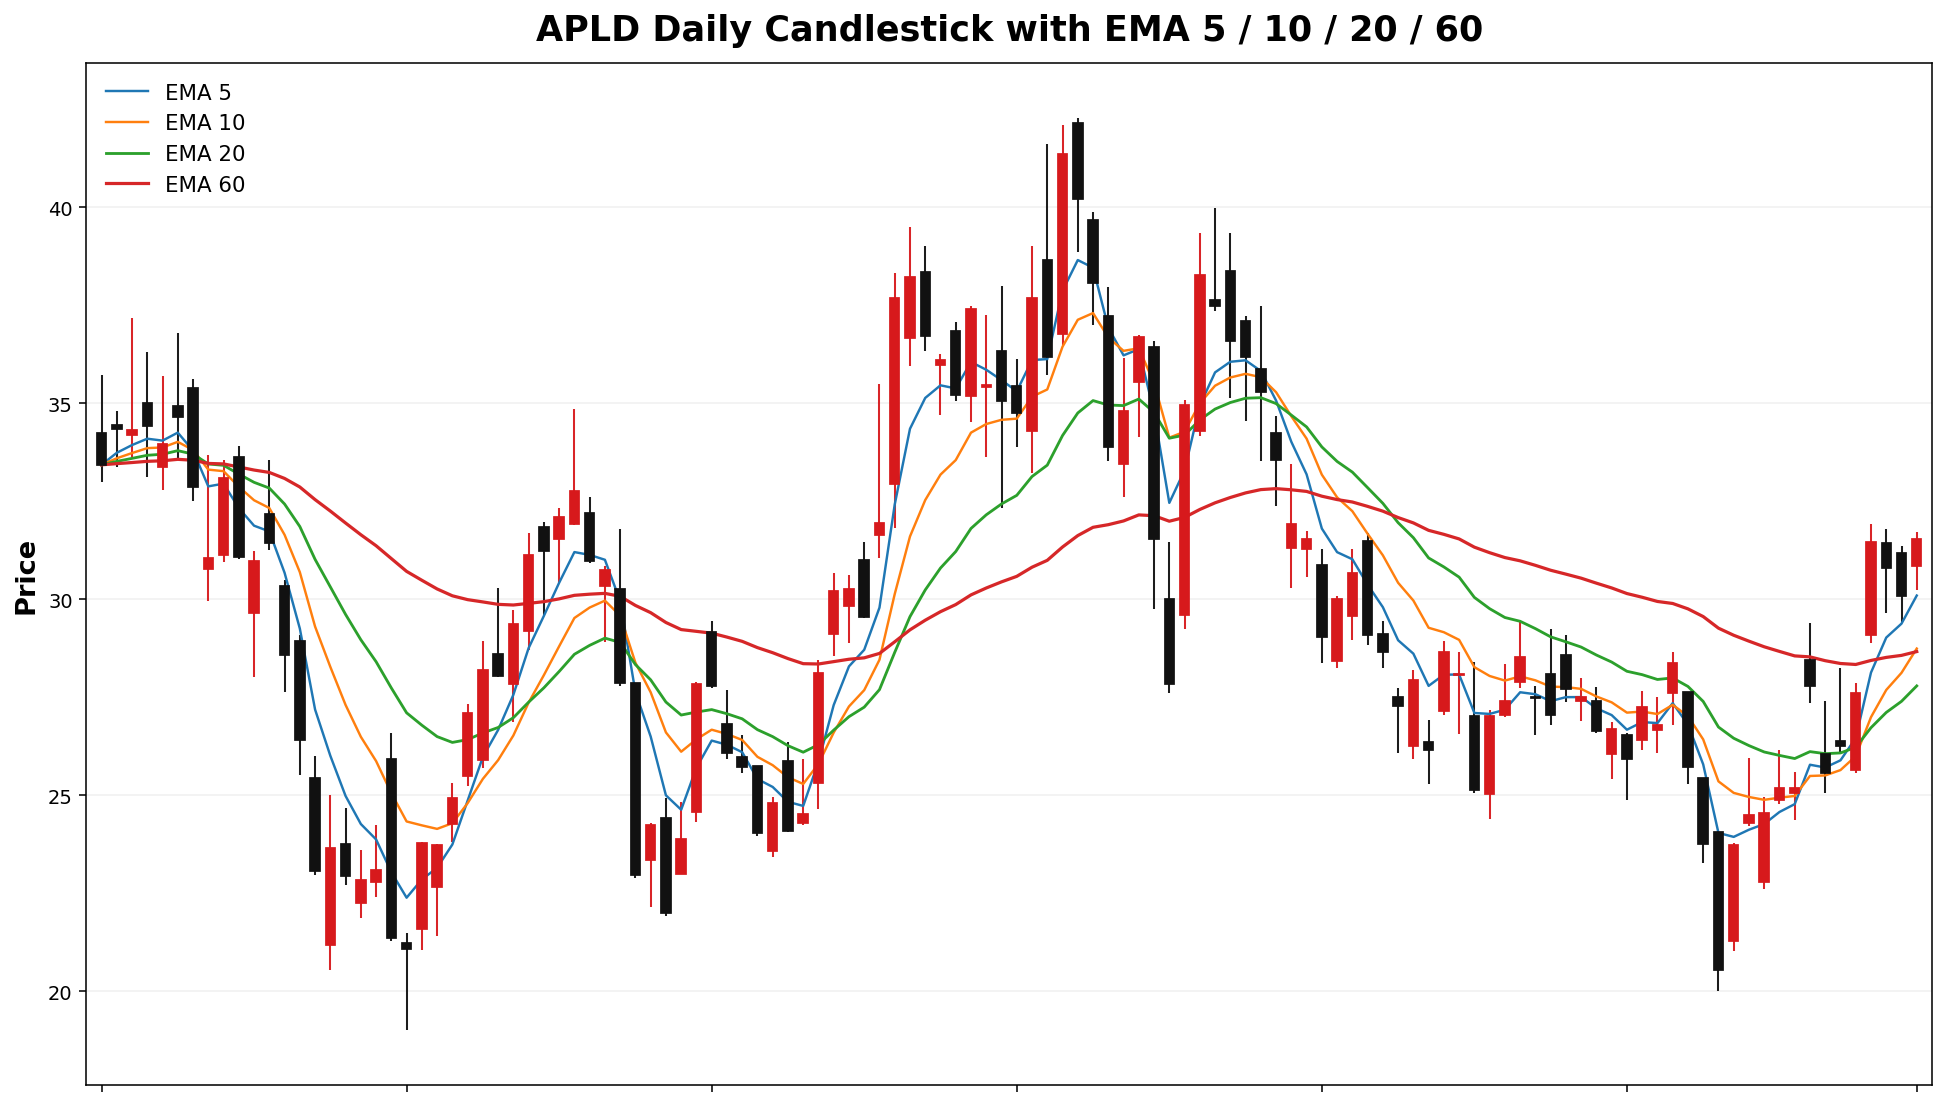
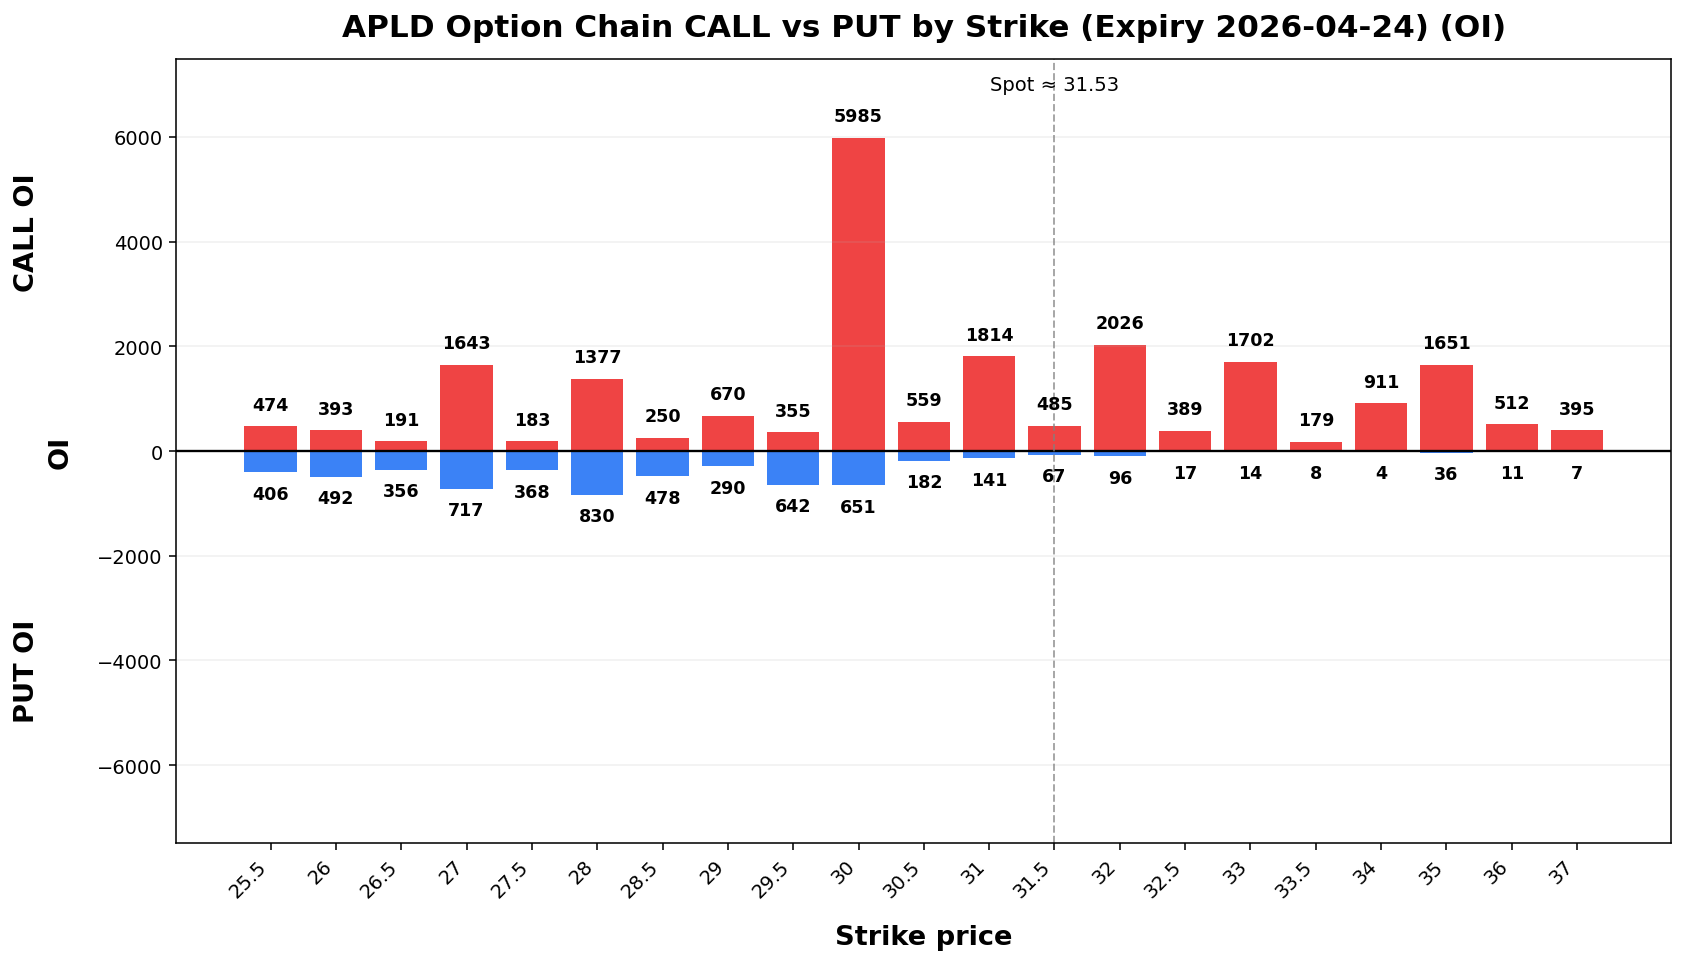
Term Structure
| Expiry |
DTE |
Forward |
ATM IV |
ATM Straddle |
| 2026-04-24 |
6 |
31.54 |
86.66% |
3.45 |
| 2026-05-01 |
13 |
31.68 |
82.77% |
4.89 |
Weekly Range
| Confidence |
Low |
High |
Width |
| 68% |
27.74 |
35.32 |
7.58 |
| 80% |
26.68 |
36.38 |
9.71 |
| 90% |
25.30 |
37.76 |
12.46 |
| 95% |
24.11 |
38.95 |
14.85 |
Structure & Probabilities
| Support |
Resistance |
Gamma Flip |
Max Pain |
P>Res |
P<Sup |
| 31.00 |
32.00 |
24.74 |
27.00 |
44.2% |
36.5% |
Flow & Skew
| Call Vol |
Put Vol |
Vol P/C |
Call OI |
Put OI |
OI P/C |
Skew |
Skew Bias |
| 18,351 |
12,539 |
0.68 |
24,687 |
15,288 |
0.62 |
-2.15 vol pts |
CALL_SKEW |
Tail Risk
| Q10 |
Q50 |
Q90 |
Down Tail |
Up Tail |
Down/Up |
| 23.20 |
31.53 |
36.05 |
8.33 |
4.52 |
1.85 |
Daily Technicals
| EMA20 |
EMA50 |
VWAP20 |
BB Lower |
BB Mid |
BB Upper |
BB Width |
Vol Ratio |
Path |
| 27.79 |
28.33 |
26.72 |
20.98 |
26.63 |
32.29 |
42.46% |
0.87 |
Sideways / Range |
Day Plan
- 31.00-32.00 range: fade extremes
- > 32.00: chase only if hold + vol
- < 31.00: risk expand; reduce size
- Regime: TRANSITION
- Tech: Sideways / Range
Swing Plan
- Accumulate: 31.00-31.00
- Trim: 32.00-32.00
- Add: close > 32.00
- Cut: close < 31.00
- Best for: transition regime
Raw Text Summary
📌 APLD @ 31.53 (2026-04-19 08:15 AM MYT)

• Current price is **31.53**. Key support is around **31.00**, and resistance is around **32.00**.
• For the next week, the model’s **68% expected range** is roughly **27.74 to 35.32**.
• A wider **90% range** is about **25.30 to 37.76**.
• Dealer positioning looks **LONG gamma**, so the market behavior is classified as **TRANSITION**.
• The estimated **gamma flip** is near **24.74**. Crossing and holding beyond this area can change the trading behavior.
• Approximate breakout odds: **above resistance 44.2%**, **below support 36.5%** by the target horizon.
• Options skew is tilted toward **puts*calls**, which suggests tradersupside arespeculation payingis morerelatively for downside protection.stronger.
• Near-term implied volatility is higher than the next expiry (**IV1 71.81%86.66% vs IV2 64.00%82.77%**), which suggests **near-term event stress / backwardation**.
• On the daily chart, the stock currently looks like **Sideways / Range**.
• The implied distribution shows **heavier downside tail risk** than upside tail potential.
LEULMND
Spot: 187.2270.94
Report Time: 2026-04-1219 08:4915 AM MYT
Regime: TRENDTRANSITION
Dealer Gamma: SHORTLONG
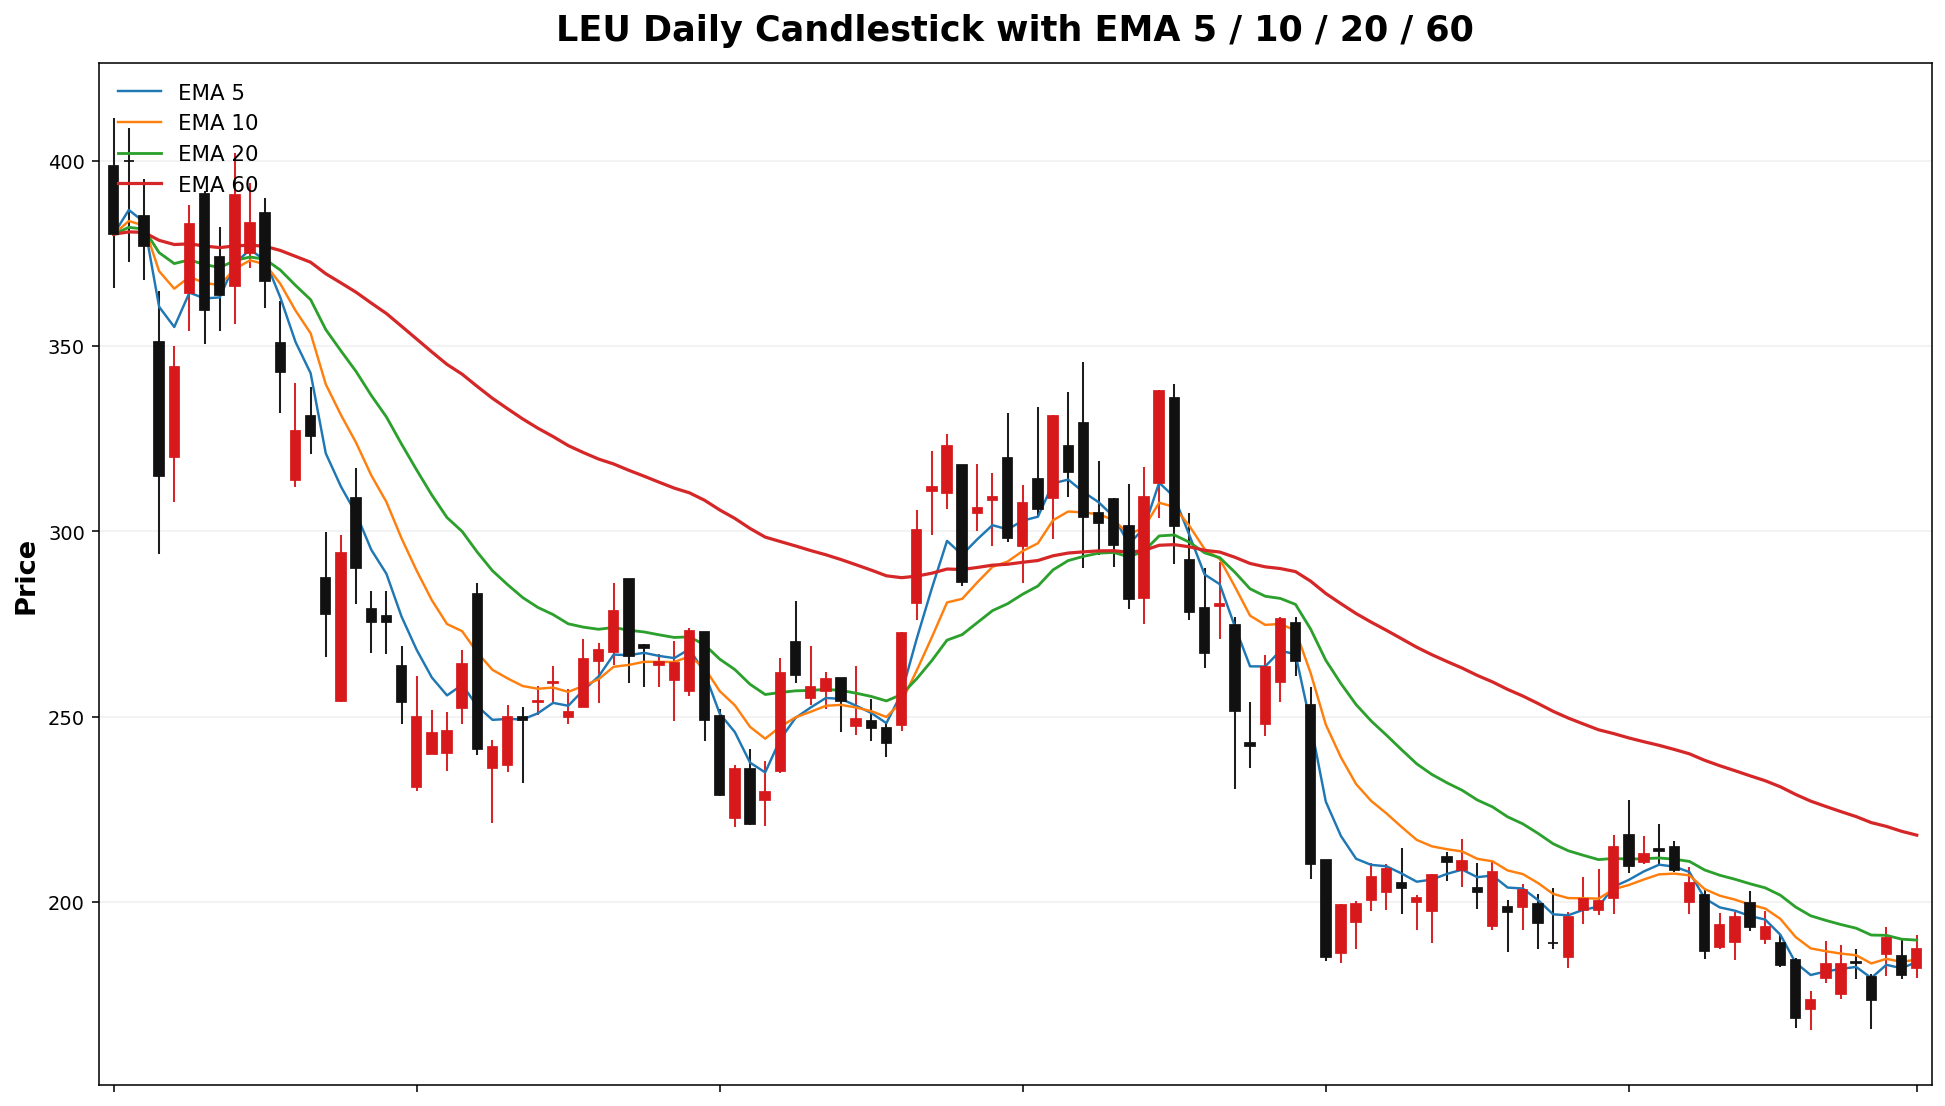
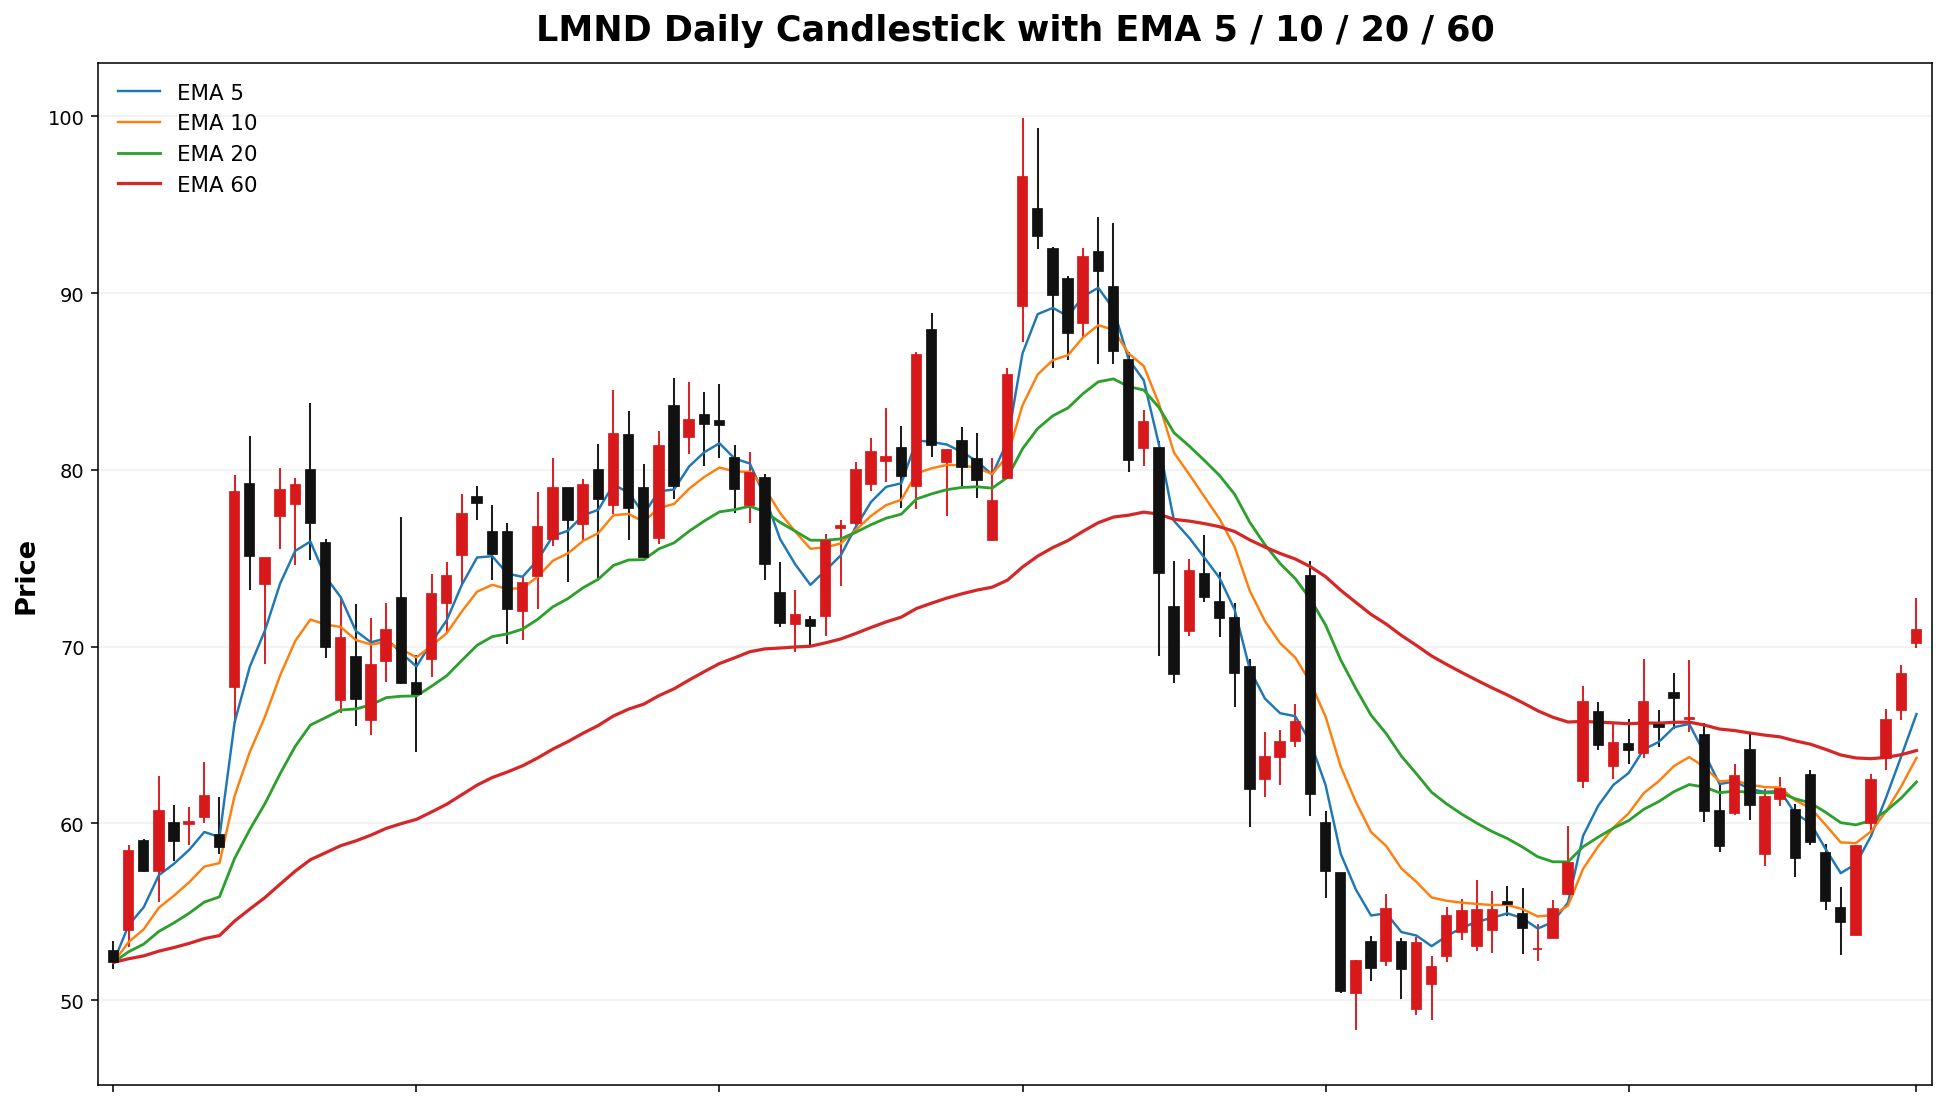
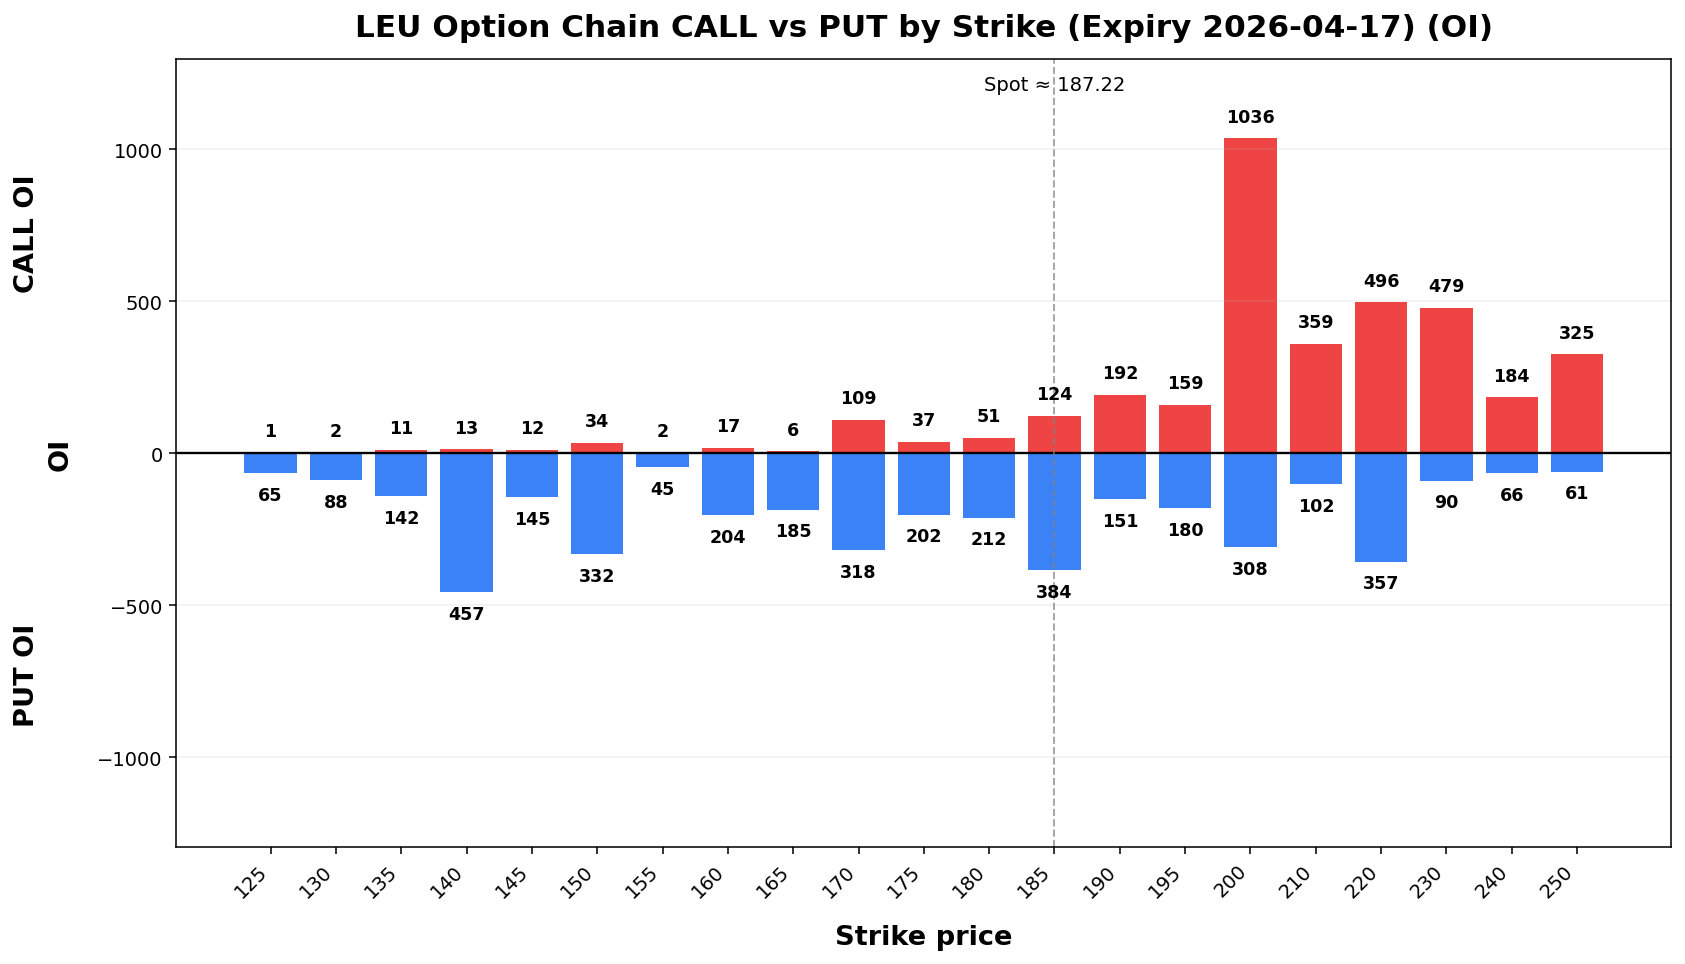
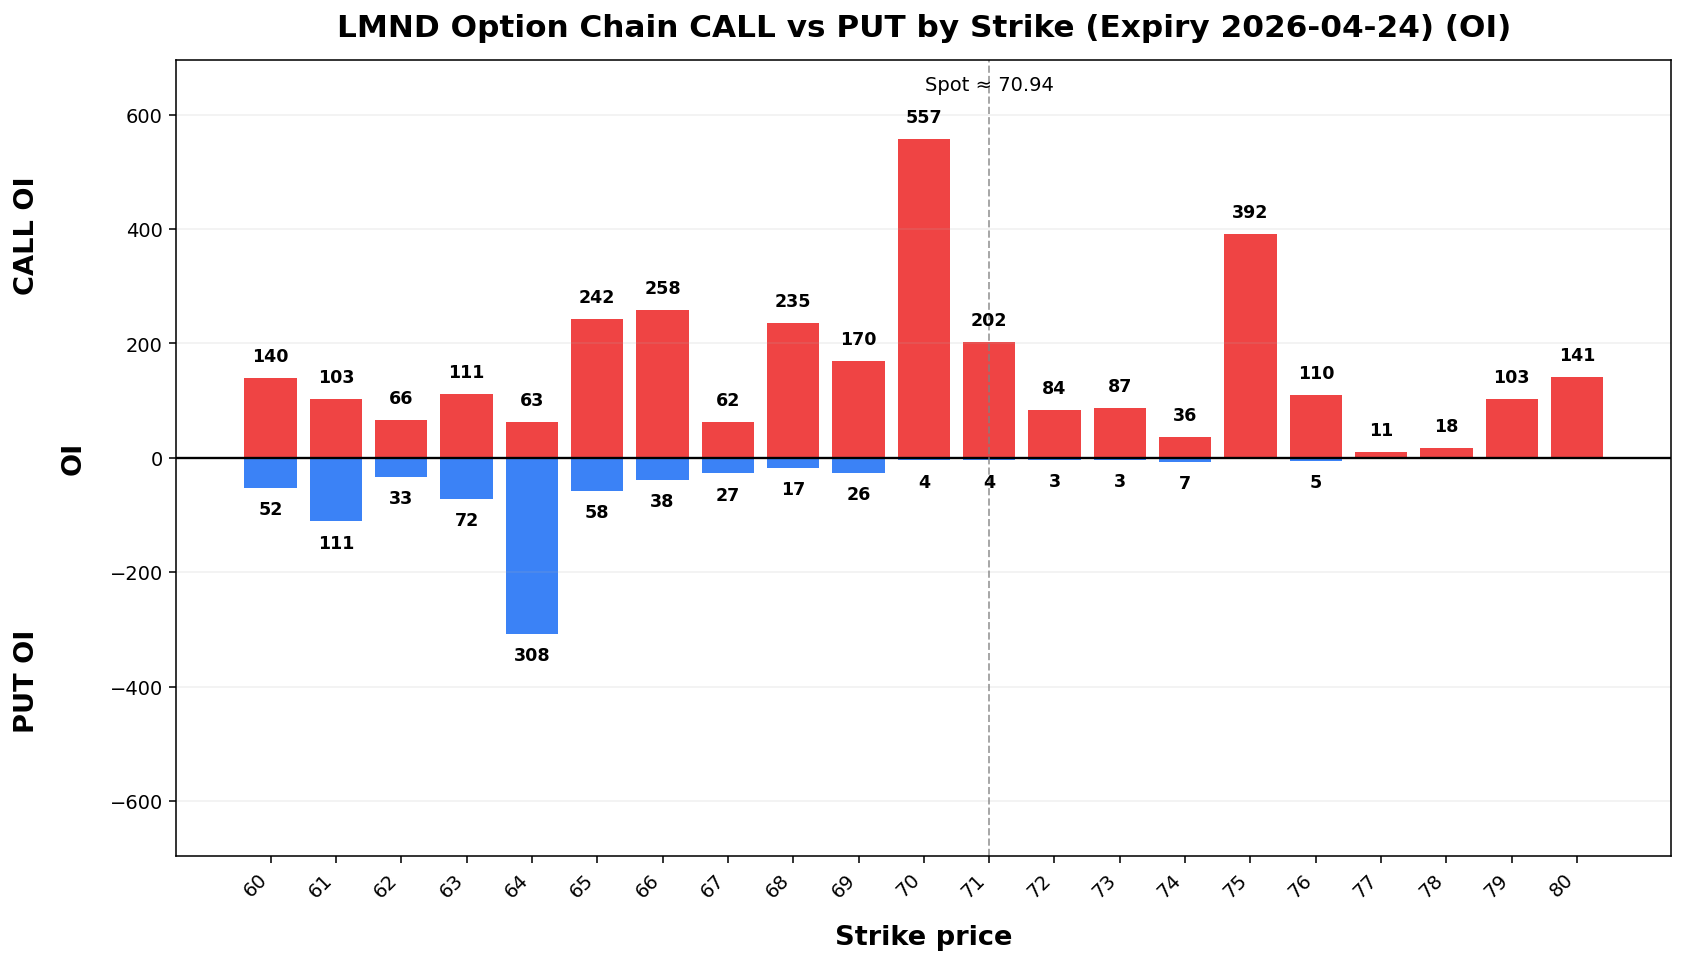
Term Structure
| Expiry |
DTE |
Forward |
ATM IV |
ATM Straddle |
2026-04-1724 |
6 |
187.2470.92 |
69.31%60.01% |
16.355.38 |
2026-05-1501 |
3413 |
187.7670.92 |
73.57%94.80% |
41.9012.60 |
Weekly Range
| Confidence |
Low |
High |
Width |
| 68% |
168.6663.50 |
205.7878.38 |
37.1114.88 |
| 80% |
163.4461.41 |
211.0080.47 |
47.5619.06 |
| 90% |
156.7058.71 |
217.7483.17 |
61.0424.47 |
| 95% |
150.8556.36 |
223.5985.52 |
72.7429.15 |
Structure & Probabilities
| Support |
Resistance |
Gamma Flip |
Max Pain |
P>Res |
P<Sup |
185.70.00 |
200.71.00 |
186.0757.84 |
200.30.00 |
23.2%44.6% |
51.33.8% |
Flow & Skew
| Call Vol |
Put Vol |
Vol P/C |
Call OI |
Put OI |
OI P/C |
Skew |
Skew Bias |
| 3,409 |
2,083 |
0.61 |
3,459 |
1,890 |
0.55 |
-2.44 vol pts |
CALL_SKEW |
Tail Risk
| Q10 |
Q50 |
Q90 |
Down Tail |
Up Tail |
Down/Up |
| 59.61 |
70.77 |
78.58 |
11.33 |
7.64 |
1.48 |
Daily Technicals
| EMA20 |
EMA50 |
VWAP20 |
BB Lower |
BB Mid |
BB Upper |
BB Width |
Vol Ratio |
Path |
| 62.35 |
63.54 |
62.29 |
53.75 |
62.49 |
71.22 |
27.95% |
0.89 |
Sideways / Range |
Day Plan
- 70.00-71.00 range: fade extremes
- > 71.00: chase only if hold + vol
- < 70.00: risk expand; reduce size
- Regime: TRANSITION
- Tech: Sideways / Range
Swing Plan
- Accumulate: 70.00-70.00
- Trim: 71.00-71.00
- Add: close > 71.00
- Cut: close < 70.00
- Best for: transition regime
Raw Text Summary
📌 LMND @ 70.94 (2026-04-19 08:15 AM MYT)

• Current price is **70.94**. Key support is around **70.00**, and resistance is around **71.00**.
• For the next week, the model’s **68% expected range** is roughly **63.50 to 78.38**.
• A wider **90% range** is about **58.71 to 83.17**.
• Dealer positioning looks **LONG gamma**, so the market behavior is classified as **TRANSITION**.
• The estimated **gamma flip** is near **57.84**. Crossing and holding beyond this area can change the trading behavior.
• Approximate breakout odds: **above resistance 44.6%**, **below support 33.8%** by the target horizon.
• Options skew is tilted toward **calls**, which suggests upside speculation is relatively stronger.
• Near-term implied volatility is lower than the next expiry (**IV1 60.01% vs IV2 94.80%**), which suggests a **contango / calmer front expiry** setup.
• On the daily chart, the stock currently looks like **Sideways / Range**.
• The implied distribution shows **heavier downside tail risk** than upside tail potential.
UAL
Spot: 101.80
Report Time: 2026-04-19 08:15 AM MYT
Regime: TRANSITION
Dealer Gamma: LONG
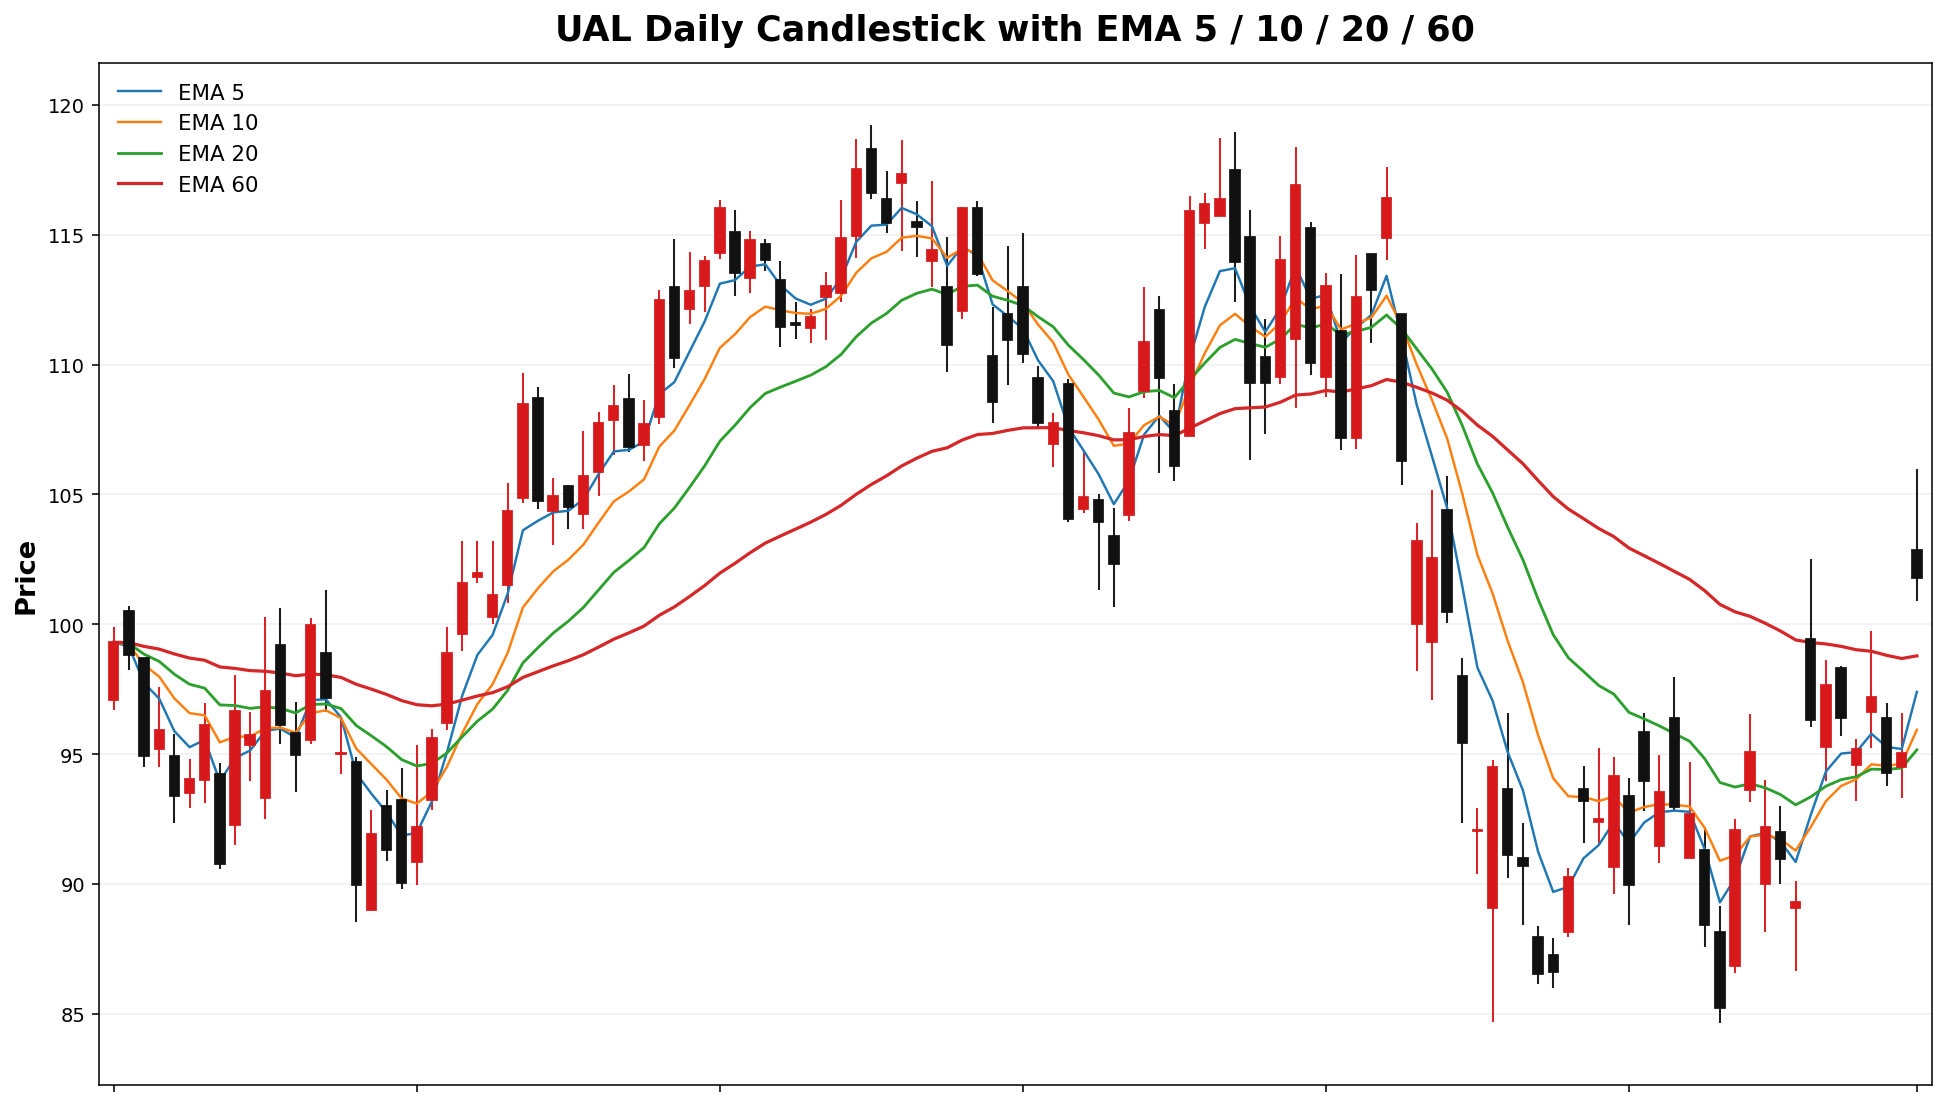
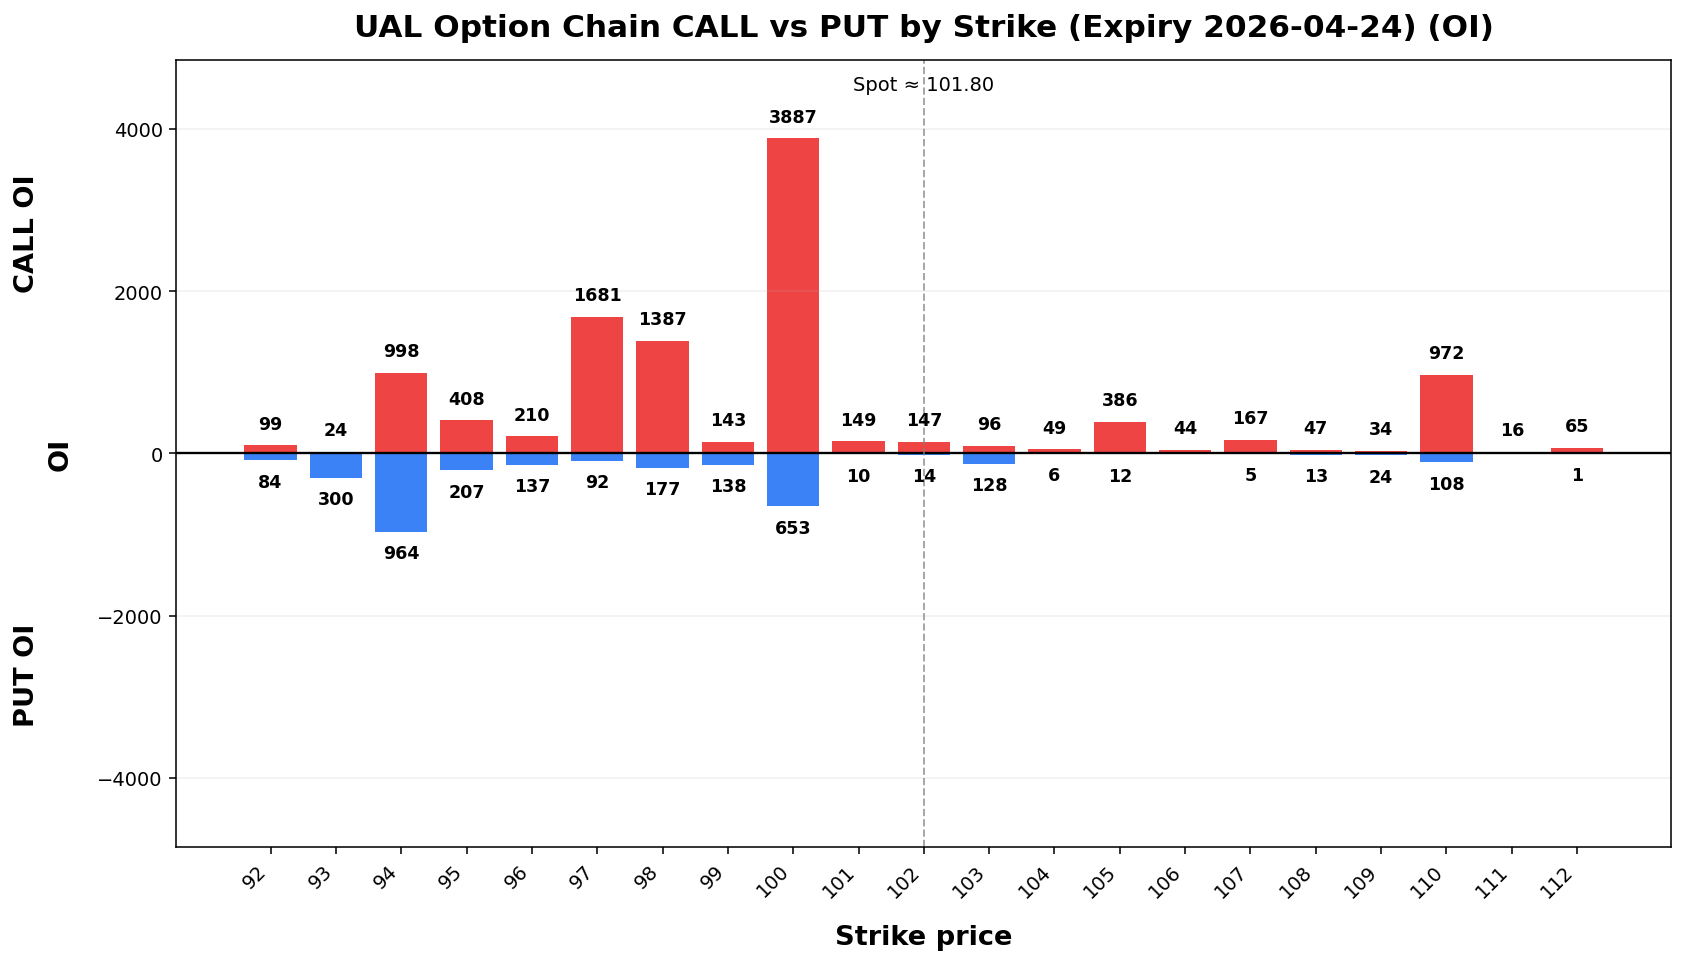
Term Structure
| Expiry |
DTE |
Forward |
ATM IV |
ATM Straddle |
| 2026-04-24 |
6 |
101.87 |
63.99% |
8.23 |
| 2026-05-01 |
13 |
101.98 |
53.08% |
10.12 |
Weekly Range
| Confidence |
Low |
High |
Width |
| 68% |
93.15 |
110.45 |
17.29 |
| 80% |
90.72 |
112.88 |
22.16 |
| 90% |
87.58 |
116.02 |
28.44 |
| 95% |
84.86 |
118.74 |
33.89 |
Structure & Probabilities
| Support |
Resistance |
Gamma Flip |
Max Pain |
P>Res |
P<Sup |
| 100.00 |
110.00 |
84.17 |
94.00 |
15.8% |
45.9% |
Flow & Skew
| Call Vol |
Put Vol |
Vol P/C |
Call OI |
Put OI |
OI P/C |
Skew |
Skew Bias |
| 5,667 |
6,491 |
1.15 |
12,167 |
7,305 |
0.60 |
4.44 vol pts |
PUT_SKEW |
Tail Risk
| Q10 |
Q50 |
Q90 |
Down Tail |
Up Tail |
Down/Up |
| 87.53 |
100.49 |
113.93 |
14.27 |
12.13 |
1.18 |
Daily Technicals
| EMA20 |
EMA50 |
VWAP20 |
BB Lower |
BB Mid |
BB Upper |
BB Width |
Vol Ratio |
Path |
| 95.17 |
97.97 |
94.19 |
86.11 |
93.51 |
100.92 |
15.84% |
1.54 |
Sideways / Range |
Day Plan
- 100.00-110.00 range: fade extremes
- > 110.00: chase only if hold + vol
- < 100.00: risk expand; reduce size
- Regime: TRANSITION
- Tech: Sideways / Range
Swing Plan
- Accumulate: 100.00-100.00
- Trim: 110.00-110.00
- Add: close > 110.00
- Cut: close < 100.00
- Best for: transition regime
Raw Text Summary
📌 UAL @ 101.80 (2026-04-19 08:15 AM MYT)

• Current price is **101.80**. Key support is around **100.00**, and resistance is around **110.00**.
• For the next week, the model’s **68% expected range** is roughly **93.15 to 110.45**.
• A wider **90% range** is about **87.58 to 116.02**.
• Dealer positioning looks **LONG gamma**, so the market behavior is classified as **TRANSITION**.
• The estimated **gamma flip** is near **84.17**. Crossing and holding beyond this area can change the trading behavior.
• Approximate breakout odds: **above resistance 15.8%**, **below support 45.9%** by the target horizon.
• Options skew is tilted toward **puts**, which suggests traders are paying more for downside protection.
• Near-term implied volatility is higher than the next expiry (**IV1 63.99% vs IV2 53.08%**), which suggests **near-term event stress / backwardation**.
• Recent volume is **1.54x** the 20-day average, which supports stronger continuation or breakout follow-through.
• On the daily chart, the stock currently looks like **Sideways / Range**.
• The implied distribution shows **heavier downside tail risk** than upside tail potential.
PL
Spot: 38.48
Report Time: 2026-04-19 08:15 AM MYT
Regime: PIN
Dealer Gamma: LONG
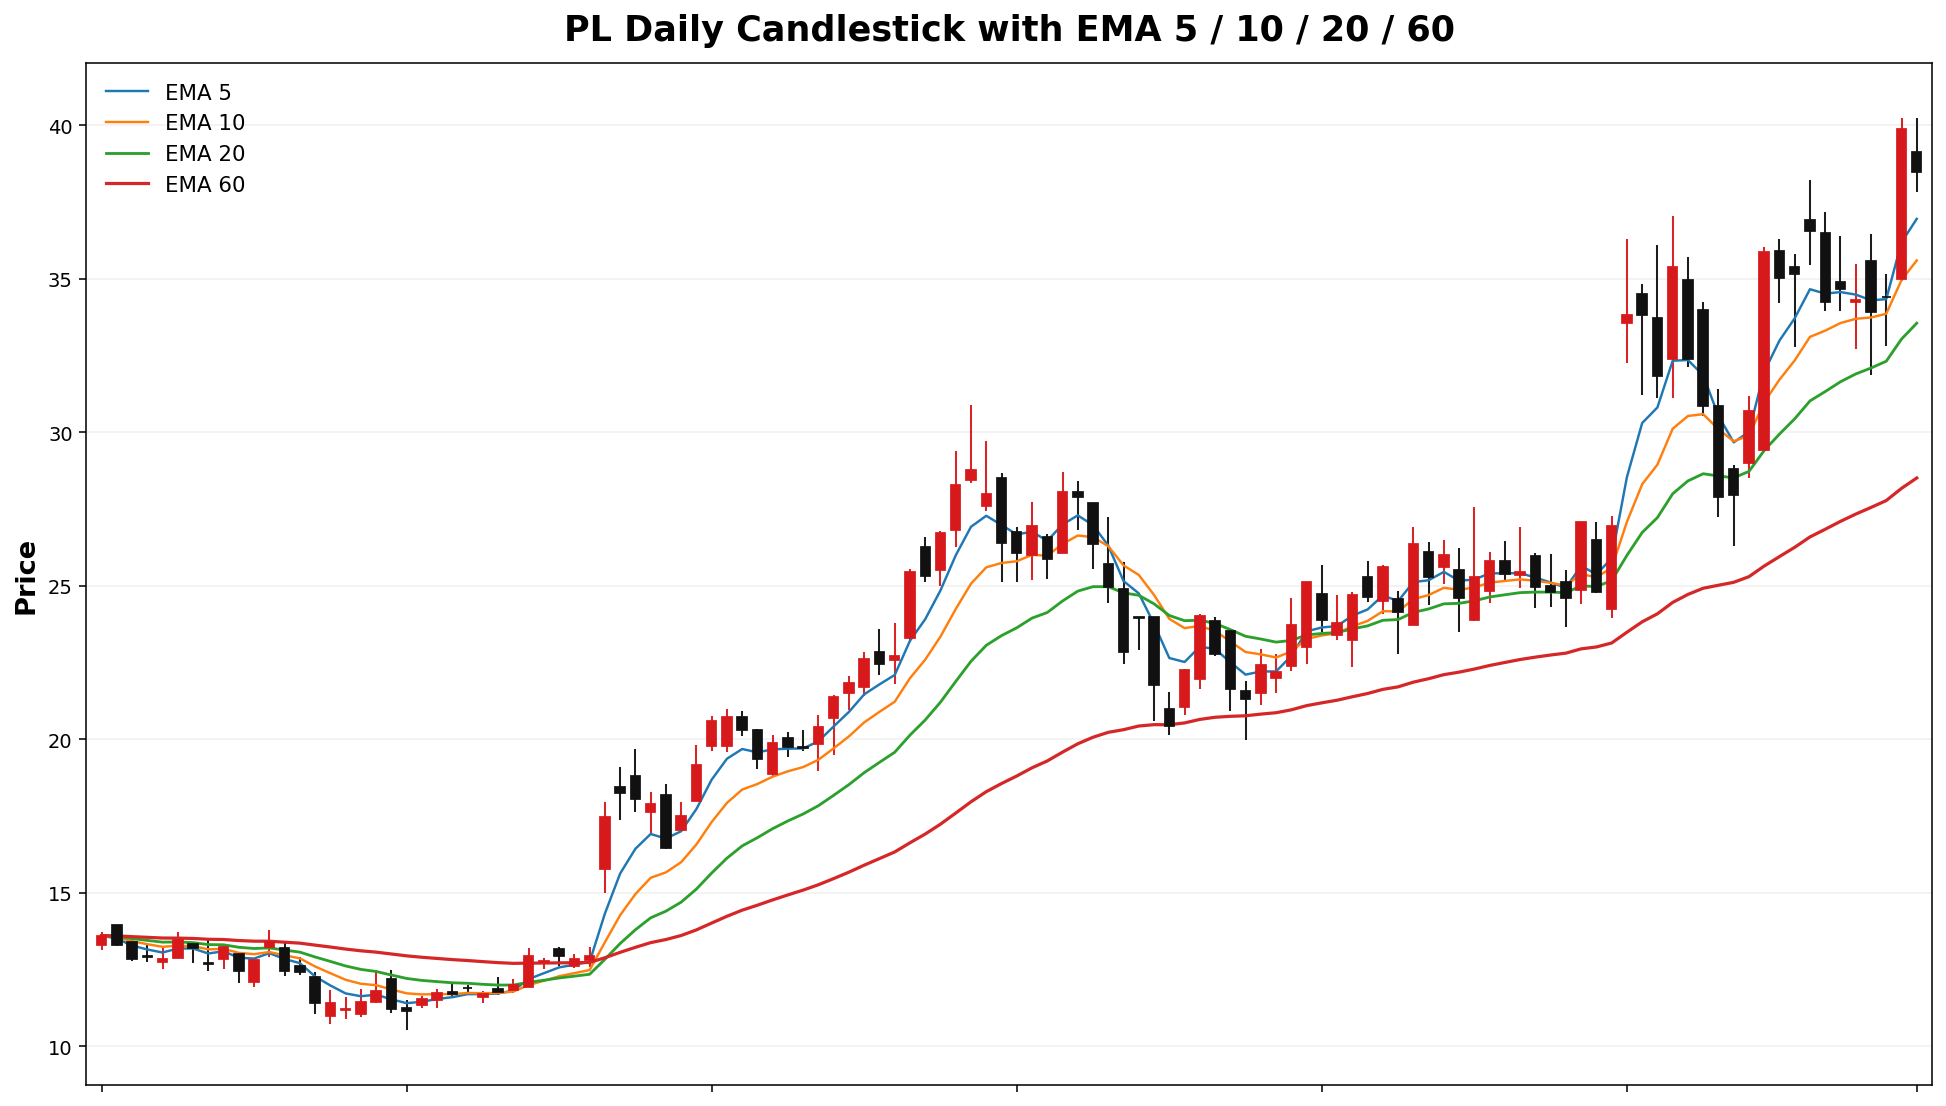
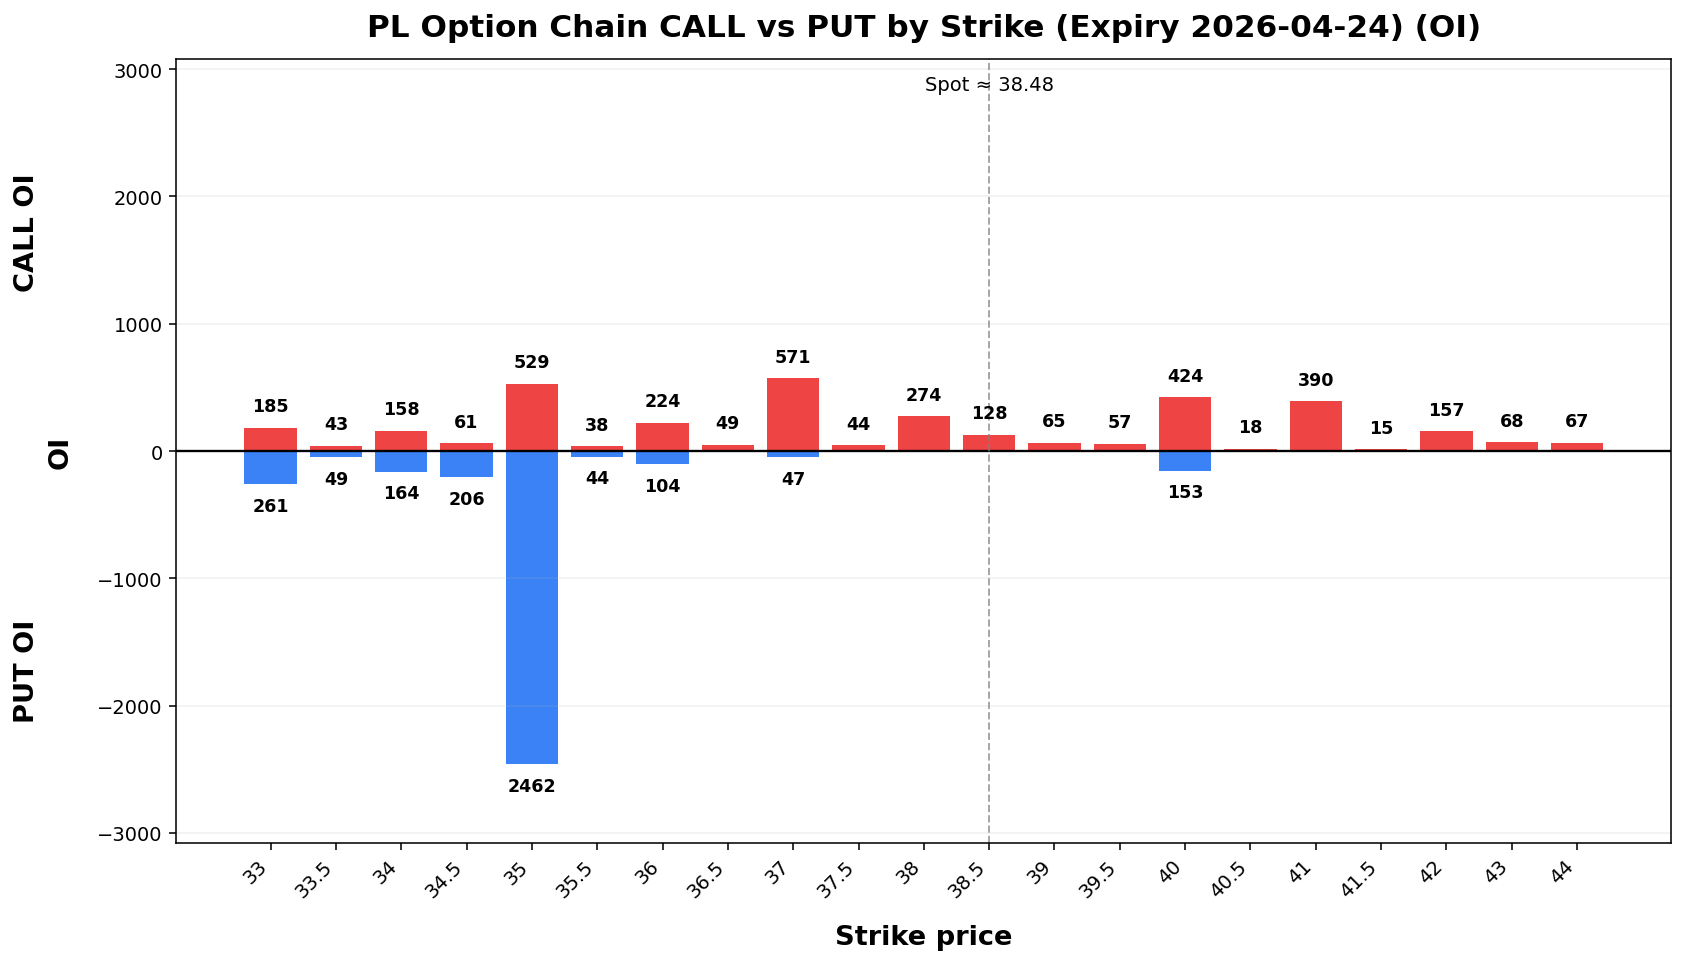
Term Structure
| Expiry |
DTE |
Forward |
ATM IV |
ATM Straddle |
| 2026-04-24 |
6 |
38.41 |
88.51% |
4.30 |
| 2026-05-01 |
13 |
38.50 |
83.57% |
6.03 |
Weekly Range
| Confidence |
Low |
High |
Width |
| 68% |
33.78 |
43.18 |
9.41 |
| 80% |
32.45 |
44.51 |
12.05 |
| 90% |
30.74 |
46.22 |
15.47 |
| 95% |
29.26 |
47.70 |
18.43 |
Structure & Probabilities
| Support |
Resistance |
Gamma Flip |
Max Pain |
P>Res |
P<Sup |
| 38.00 |
40.00 |
38.80 |
35.00 |
31.0% |
38.1% |
Flow & Skew
| Call Vol |
Put Vol |
Vol P/C |
Call OI |
Put OI |
OI P/C |
Skew |
Skew Bias |
1,0173,990 |
3591,681 |
0.35 |
6,33742 |
4,318780 |
12,093 |
2.53 |
0.68 |
2.5659 vol pts |
PUT_SKEWFLAT |
Tail Risk
| Q10 |
Q50 |
Q90 |
Down Tail |
Up Tail |
Down/Up |
161.0432.09 |
186.7737.89 |
212.4145.67 |
26.186.39 |
25.7.19 |
1.040.89 |
Daily Technicals
| EMA20 |
EMA50 |
VWAP20 |
BB Lower |
BB Mid |
BB Upper |
BB Width |
Vol Ratio |
Path |
189.6633.55 |
210.3029.49 |
189.81 |
164.21 |
190.92 |
217.6333.73 |
27.98%85 |
33.86 |
39.87 |
35.48% |
0.6561 |
DOWNUP trend (expanding) |
Day Plan
185.38.00-200.40.00 range: fade extremes- >
200.40.00: chase only if hold + vol
- <
185.38.00: risk expand; reduce size
- Regime:
TRENDPIN
- Tech:
DOWNUP trend (expanding)
Swing Plan
- Accumulate:
185.38.00-185.38.00
- Trim:
200.40.00-200.40.00
- Add: close >
200.40.00
- Cut: close <
185.38.00
- Best for:
trendpin regime
Raw Text Summary
📌 LEUPL @ 187.2238.48 (2026-04-1219 08:4915 AM MYT)

• Current price is **187.22*38.48**. Key support is around **185.38.00**, and resistance is around **200.40.00**.
• For the next week, the model’s **68% expected range** is roughly **168.6633.78 to 205.78*43.18**.
• A wider **90% range** is about **156.7030.74 to 217.74*46.22**.
• Dealer positioning looks **SHORTLONG gamma**, so the market behavior is classified as **TREND*PIN**.
• The estimated **gamma flip** is near **186.07*38.80**. Crossing and holding beyond this area can change the trading behavior.
• Approximate breakout odds: **above resistance 23.2%31.0%**, **below support 51.38.1%** by the target horizon.
• Options skew is tiltedfairly towardbalanced, so there is **puts*no strong directional bias**, whichfrom suggestsskew traders are paying more for downside protection.alone.
• Near-term implied volatility is lowerhigher than the next expiry (**IV1 69.31%88.51% vs IV2 73.83.57%**), which suggests a **contangonear-term event stress / calmer front expiry*backwardation** setup..
• Recent volume is only **0.65x*61x** the 20-day average, so breakouts may be less reliable unless volume improves.
• On the daily chart, the stock currently looks like **DOWNUP trend (expanding)**.
• The implied distribution isshows **fairly balanced** betweenmore upside andtail potential** than downside tails.tail risk.
NAILTEM
Spot: 42.1655.87
Report Time: 2026-04-1219 08:4915 AM MYT
Regime: TRANSITION
Dealer Gamma: LONG
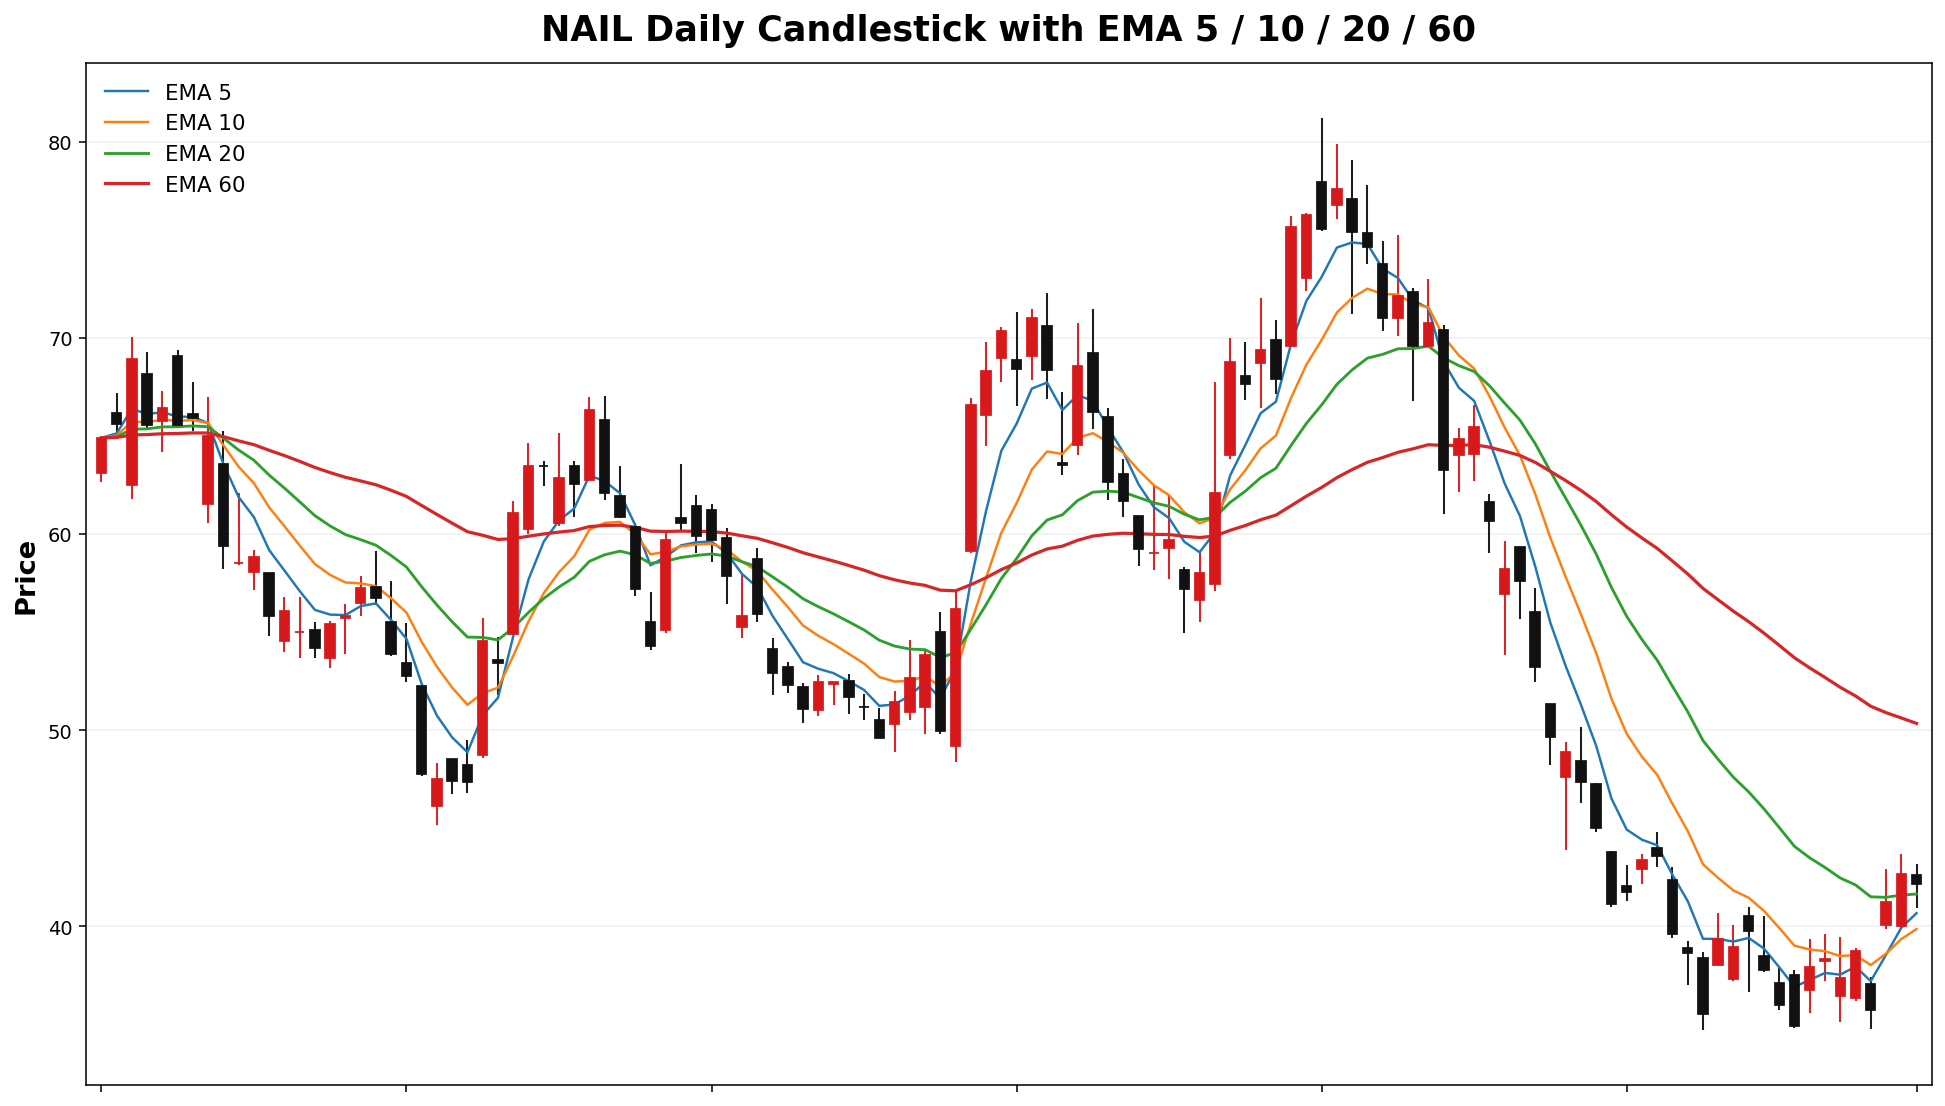
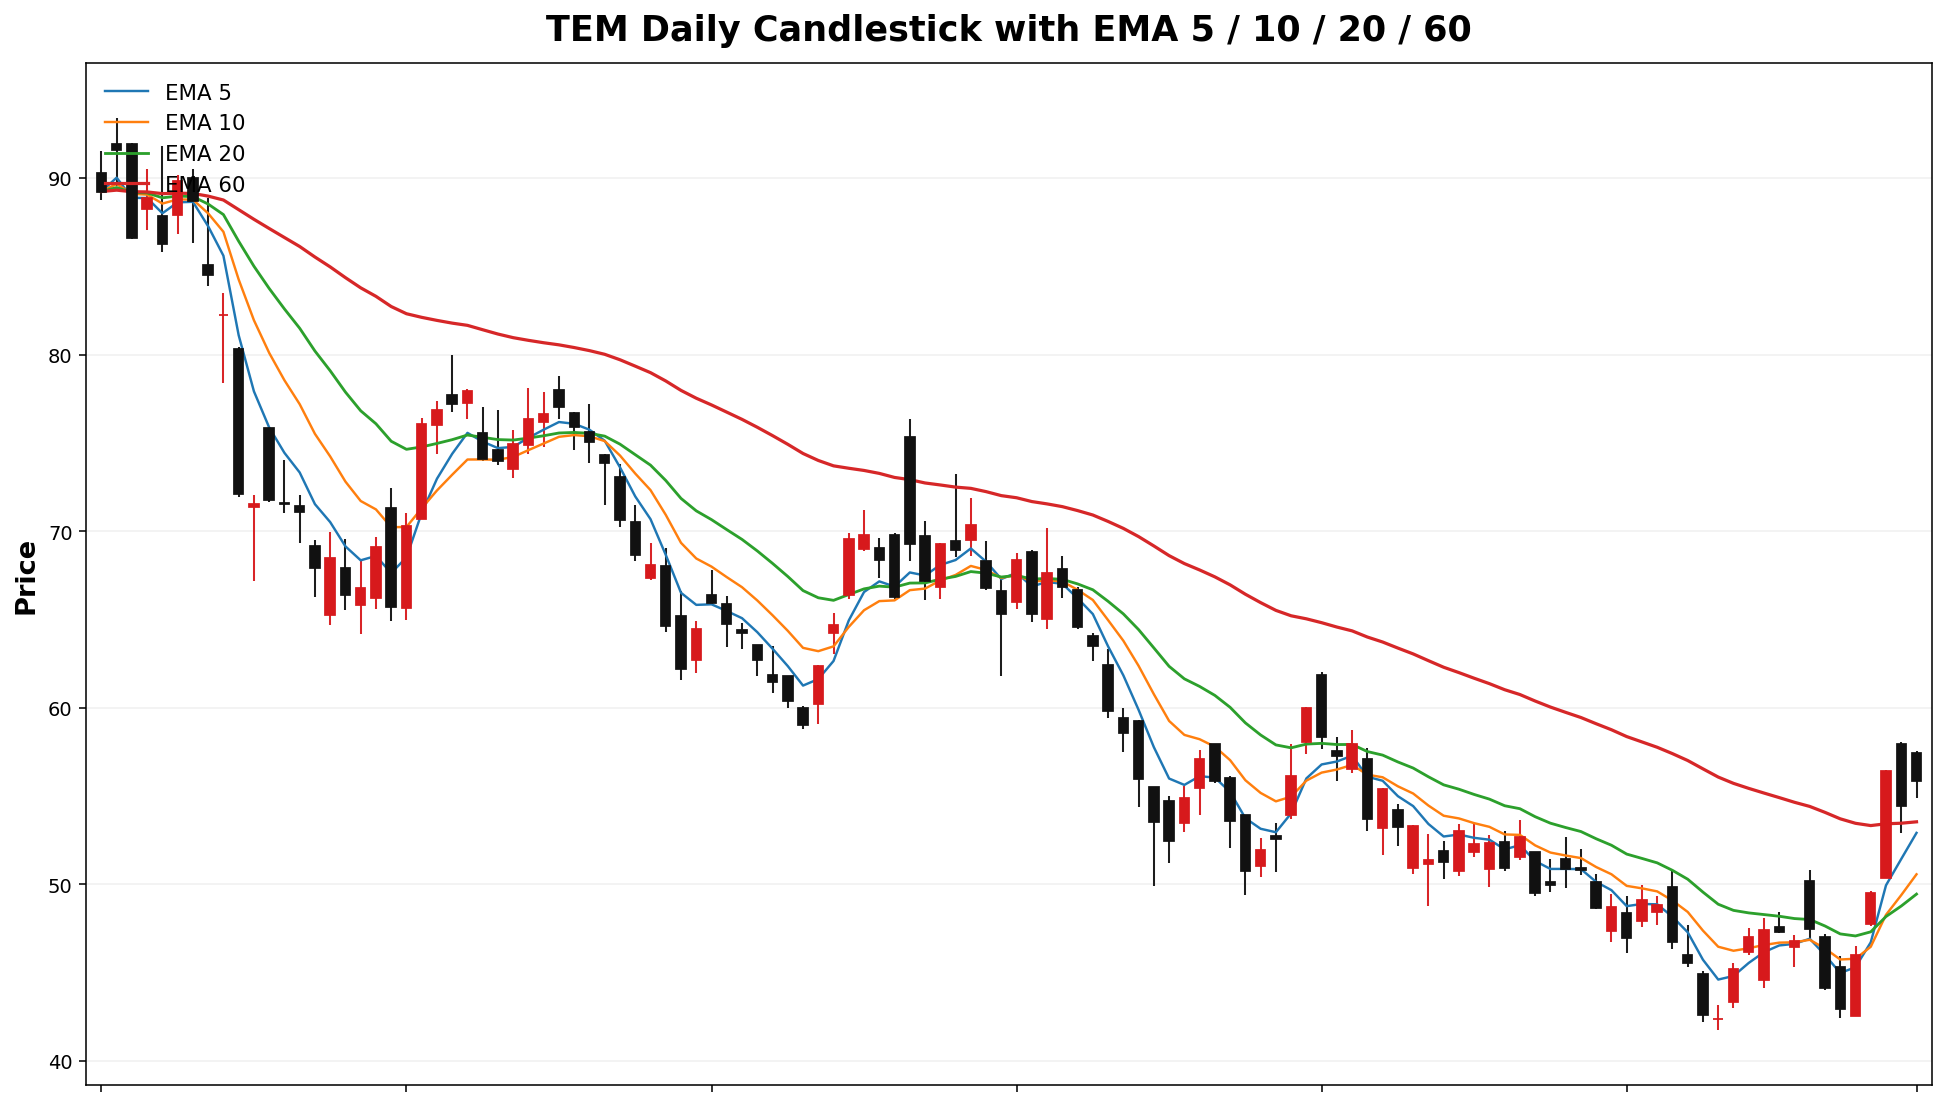
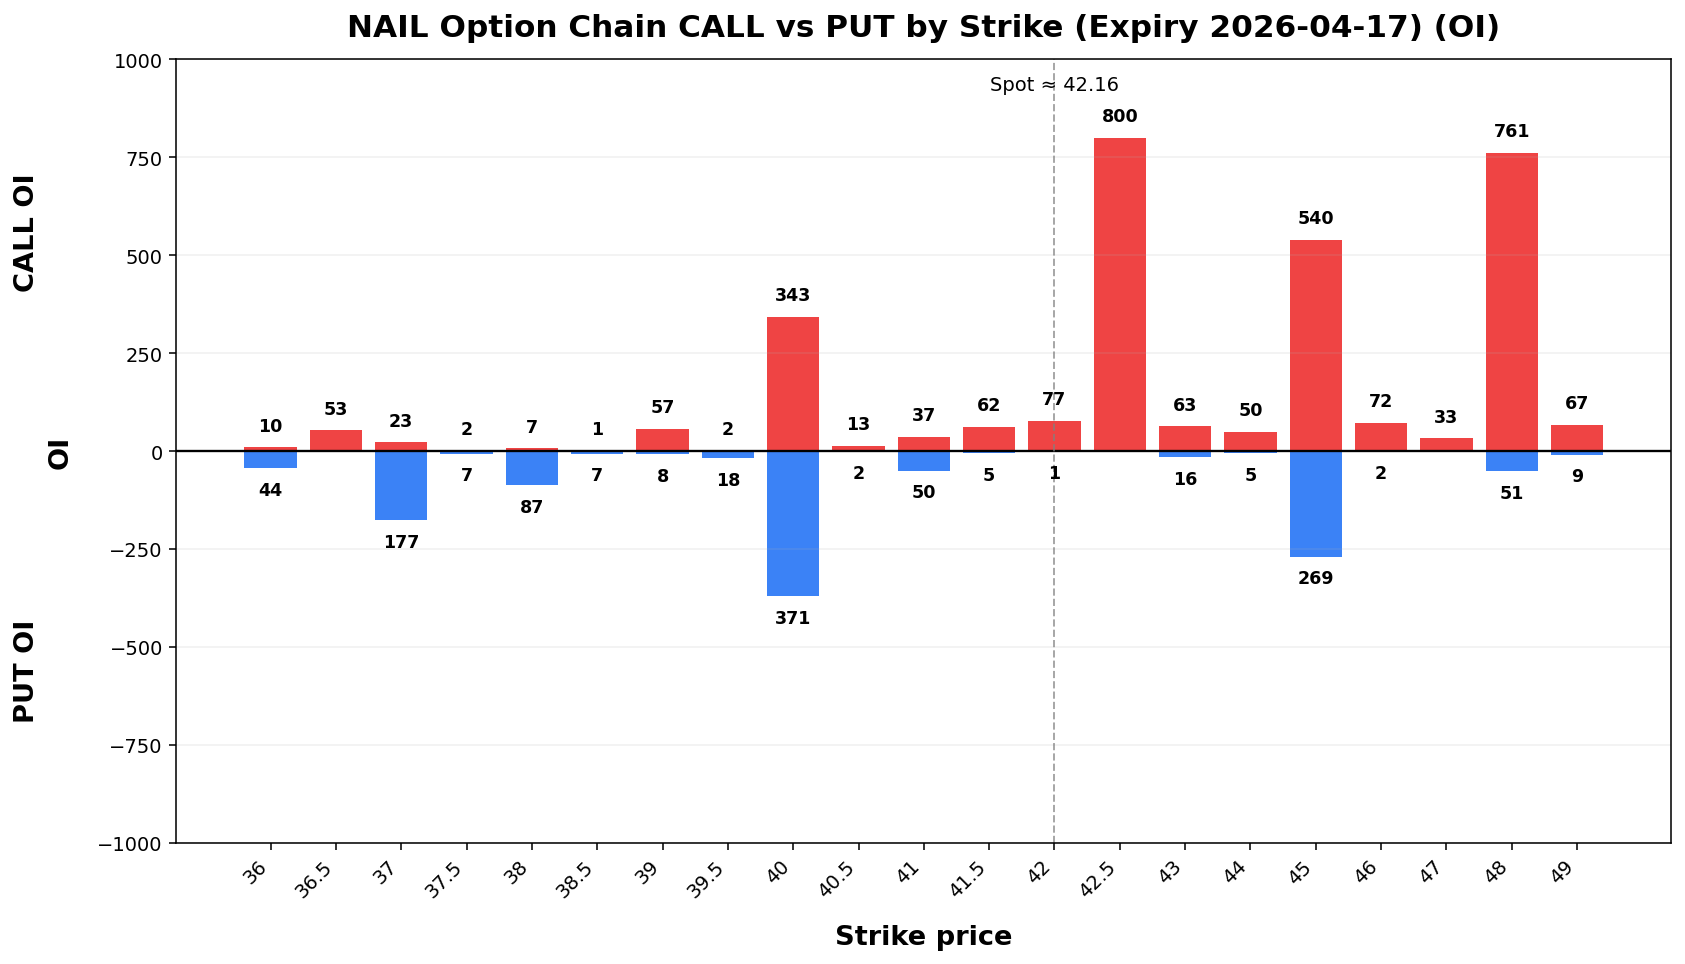
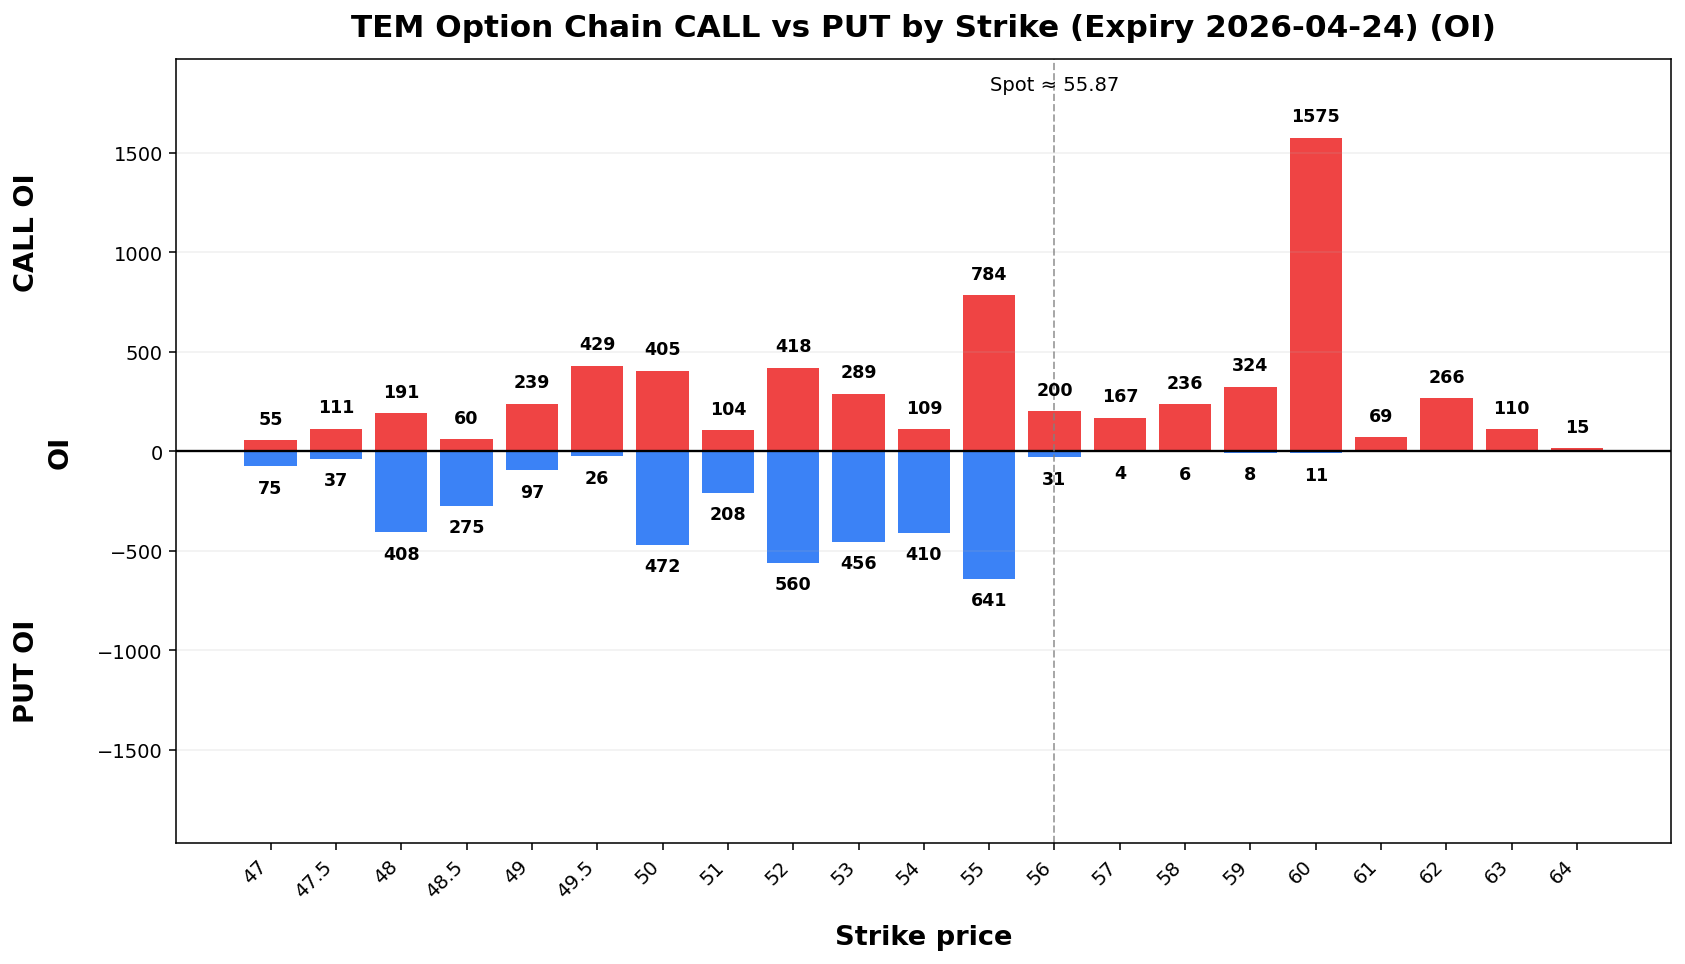
Term Structure
| Expiry |
DTE |
Forward |
ATM IV |
ATM Straddle |
2026-04-1724 |
6 |
42.1855.93 |
80.48%62.66% |
4.2842 |
2026-04-2405-01 |
13 |
41.9656.02 |
75.71%63.77% |
5.976.68 |
Weekly Range
| Confidence |
Low |
High |
Width |
| 68% |
37.4850.91 |
46.8460.83 |
9.3693 |
| 80% |
36.1749.51 |
48.1562.23 |
11.9912.72 |
| 90% |
34.4747.71 |
49.8564.03 |
15.3916.33 |
| 95% |
32.9946.14 |
51.3365.60 |
18.3419.45 |
Structure & Probabilities
| Support |
Resistance |
Gamma Flip |
Max Pain |
P>Res |
P<Sup |
40.55.00 |
42.5060.00 |
36.2351.29 |
41.5025.00 |
36.0%16.5% |
29.4%35.1% |
Flow & Skew
| Call Vol |
Put Vol |
Vol P/C |
Call OI |
Put OI |
OI P/C |
Skew |
Skew Bias |
7103,250 |
5611,686 |
0.7952 |
5,5097,924 |
2,3066,170 |
0.4278 |
17.09-1.07 vol pts |
PUT_SKEWCALL_SKEW |
Tail Risk
| Q10 |
Q50 |
Q90 |
Down Tail |
Up Tail |
Down/Up |
32.8547.33 |
41.0555.42 |
43.6962.55 |
9.318.54 |
6.68 |
1.53 |
6.0828 |
Daily Technicals
| EMA20 |
EMA50 |
VWAP20 |
BB Lower |
BB Mid |
BB Upper |
BB Width |
Vol Ratio |
Path |
41.6549.45 |
52.15 |
48.9245 |
39.2568 |
47.64 |
55.59 |
33.9240% |
39.17 |
44.42 |
26.80% |
0.601.20 |
Sideways / Range |
Day Plan
40.55.00-42.5060.00 range: fade extremes- >
42.50:60.00: chase only if hold + vol
- <
40.55.00: risk expand; reduce size
- Regime: TRANSITION
- Tech: Sideways / Range
Swing Plan
- Accumulate:
40.55.00-40.55.00
- Trim:
42.50-42.5060.00-60.00
- Add: close >
42.5060.00
- Cut: close <
40.55.00
- Best for: transition regime
Raw Text Summary
📌 NAILTEM @ 42.1655.87 (2026-04-1219 08:4915 AM MYT)

• Current price is **42.16*55.87**. Key support is around **40.55.00**, and resistance is around **42.50*60.00**.
• For the next week, the model’s **68% expected range** is roughly **37.4850.91 to 46.84*60.83**.
• A wider **90% range** is about **34.4747.71 to 49.85*64.03**.
• Dealer positioning looks **LONG gamma**, so the market behavior is classified as **TRANSITION**.
• The estimated **gamma flip** is near **36.23*51.29**. Crossing and holding beyond this area can change the trading behavior.
• Approximate breakout odds: **above resistance 36.0%16.5%**, **below support 35.1%** by the target horizon.
• Options skew is fairly balanced, so there is **no strong directional bias** from skew alone.
• Near-term implied volatility is lower than the next expiry (**IV1 62.66% vs IV2 63.77%**), which suggests a **contango / calmer front expiry** setup.
• On the daily chart, the stock currently looks like **Sideways / Range**.
• The implied distribution shows **heavier downside tail risk** than upside tail potential.
GLXY
Spot: 25.84
Report Time: 2026-04-19 08:15 AM MYT
Regime: TRANSITION
Dealer Gamma: LONG
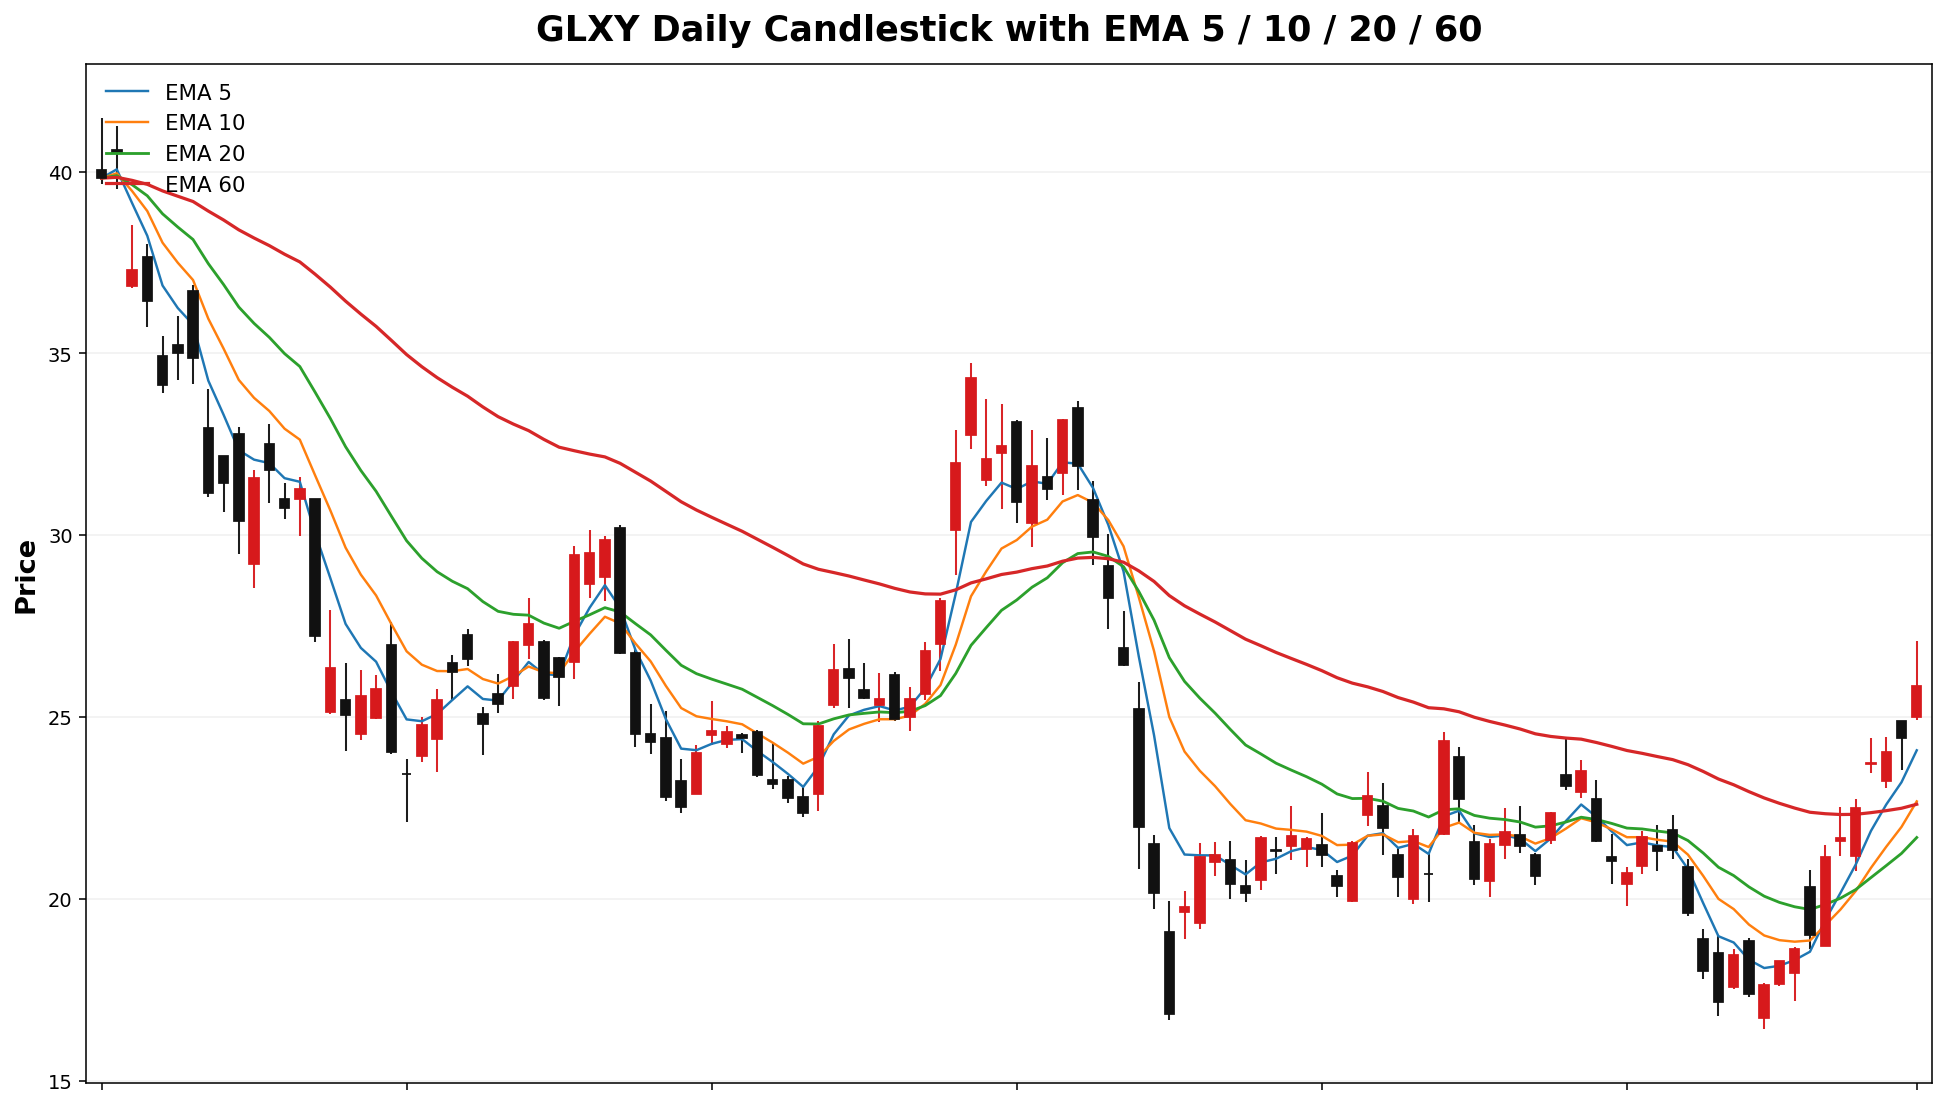
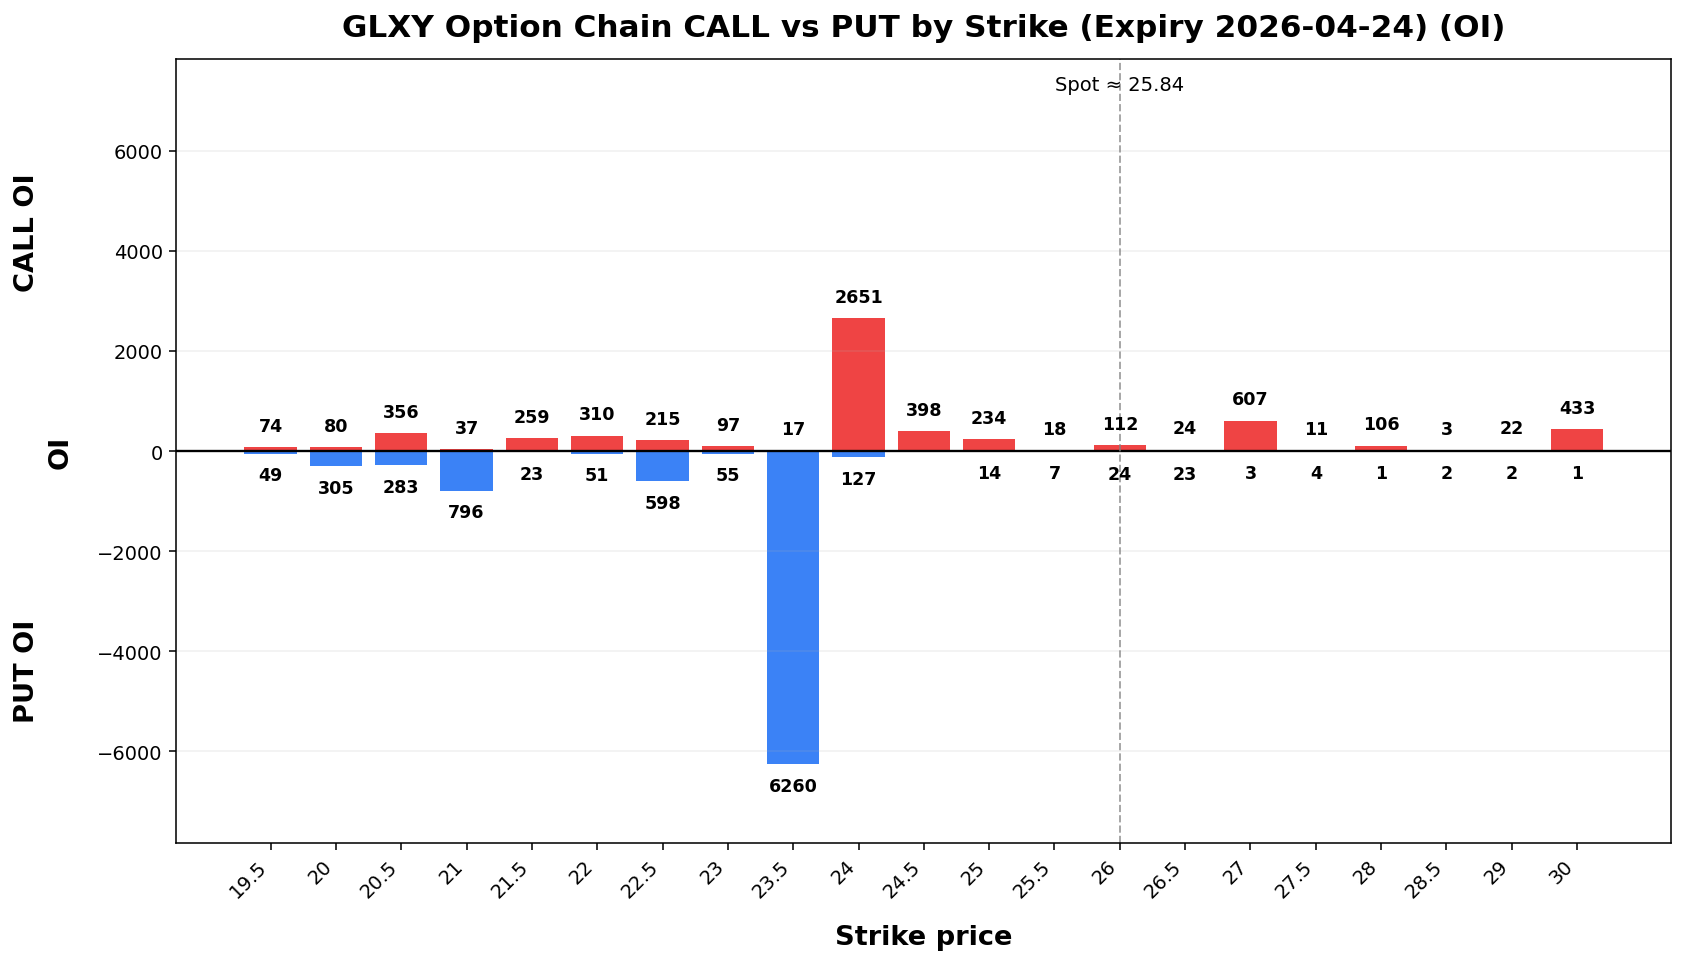
Term Structure
| Expiry |
DTE |
Forward |
ATM IV |
ATM Straddle |
| 2026-04-24 |
6 |
25.83 |
74.33% |
2.42 |
| 2026-05-01 |
13 |
25.81 |
86.96% |
4.21 |
Weekly Range
| Confidence |
Low |
High |
Width |
| 68% |
22.96 |
28.72 |
5.76 |
| 80% |
22.15 |
29.4%53 |
7.38 |
| 90% |
21.10 |
30.58 |
9.47 |
| 95% |
20.20 |
31.48 |
11.29 |
Structure & Probabilities
| Support |
Resistance |
Gamma Flip |
Max Pain |
P>Res |
P<Sup |
| 24.50 |
27.00 |
26.90 |
23.50 |
28.9% |
32.3% |
Flow & Skew
| Call Vol |
Put Vol |
Vol P/C |
Call OI |
Put OI |
OI P/C |
Skew |
Skew Bias |
| 6,848 |
2,463 |
0.36 |
6,659 |
12,242 |
1.84 |
4.69 vol pts |
PUT_SKEW |
Tail Risk
| Q10 |
Q50 |
Q90 |
Down Tail |
Up Tail |
Down/Up |
| 22.79 |
25.70 |
29.25 |
3.05 |
3.41 |
0.89 |
Daily Technicals
| EMA20 |
EMA50 |
VWAP20 |
BB Lower |
BB Mid |
BB Upper |
BB Width |
Vol Ratio |
Path |
| 21.68 |
22.11 |
20.66 |
15.47 |
20.63 |
25.78 |
49.99% |
1.68 |
Sideways / Range |
Day Plan
- 24.50-27.00 range: fade extremes
- > 27.00: chase only if hold + vol
- < 24.50: risk expand; reduce size
- Regime: TRANSITION
- Tech: Sideways / Range
Swing Plan
- Accumulate: 24.50-24.50
- Trim: 27.00-27.00
- Add: close > 27.00
- Cut: close < 24.50
- Best for: transition regime
Raw Text Summary
📌 GLXY @ 25.84 (2026-04-19 08:15 AM MYT)

• Current price is **25.84**. Key support is around **24.50**, and resistance is around **27.00**.
• For the next week, the model’s **68% expected range** is roughly **22.96 to 28.72**.
• A wider **90% range** is about **21.10 to 30.58**.
• Dealer positioning looks **LONG gamma**, so the market behavior is classified as **TRANSITION**.
• The estimated **gamma flip** is near **26.90**. Crossing and holding beyond this area can change the trading behavior.
• Approximate breakout odds: **above resistance 28.9%**, **below support 32.3%** by the target horizon.
• Options skew is tilted toward **puts**, which suggests traders are paying more for downside protection.
• Near-term implied volatility is lower than the next expiry (**IV1 74.33% vs IV2 86.96%**), which suggests a **contango / calmer front expiry** setup.
• Recent volume is **1.68x** the 20-day average, which supports stronger continuation or breakout follow-through.
• On the daily chart, the stock currently looks like **Sideways / Range**.
• The implied distribution shows **more upside tail potential** than downside tail risk.
ETHU
Spot: 29.71
Report Time: 2026-04-19 08:15 AM MYT
Regime: TRANSITION
Dealer Gamma: LONG
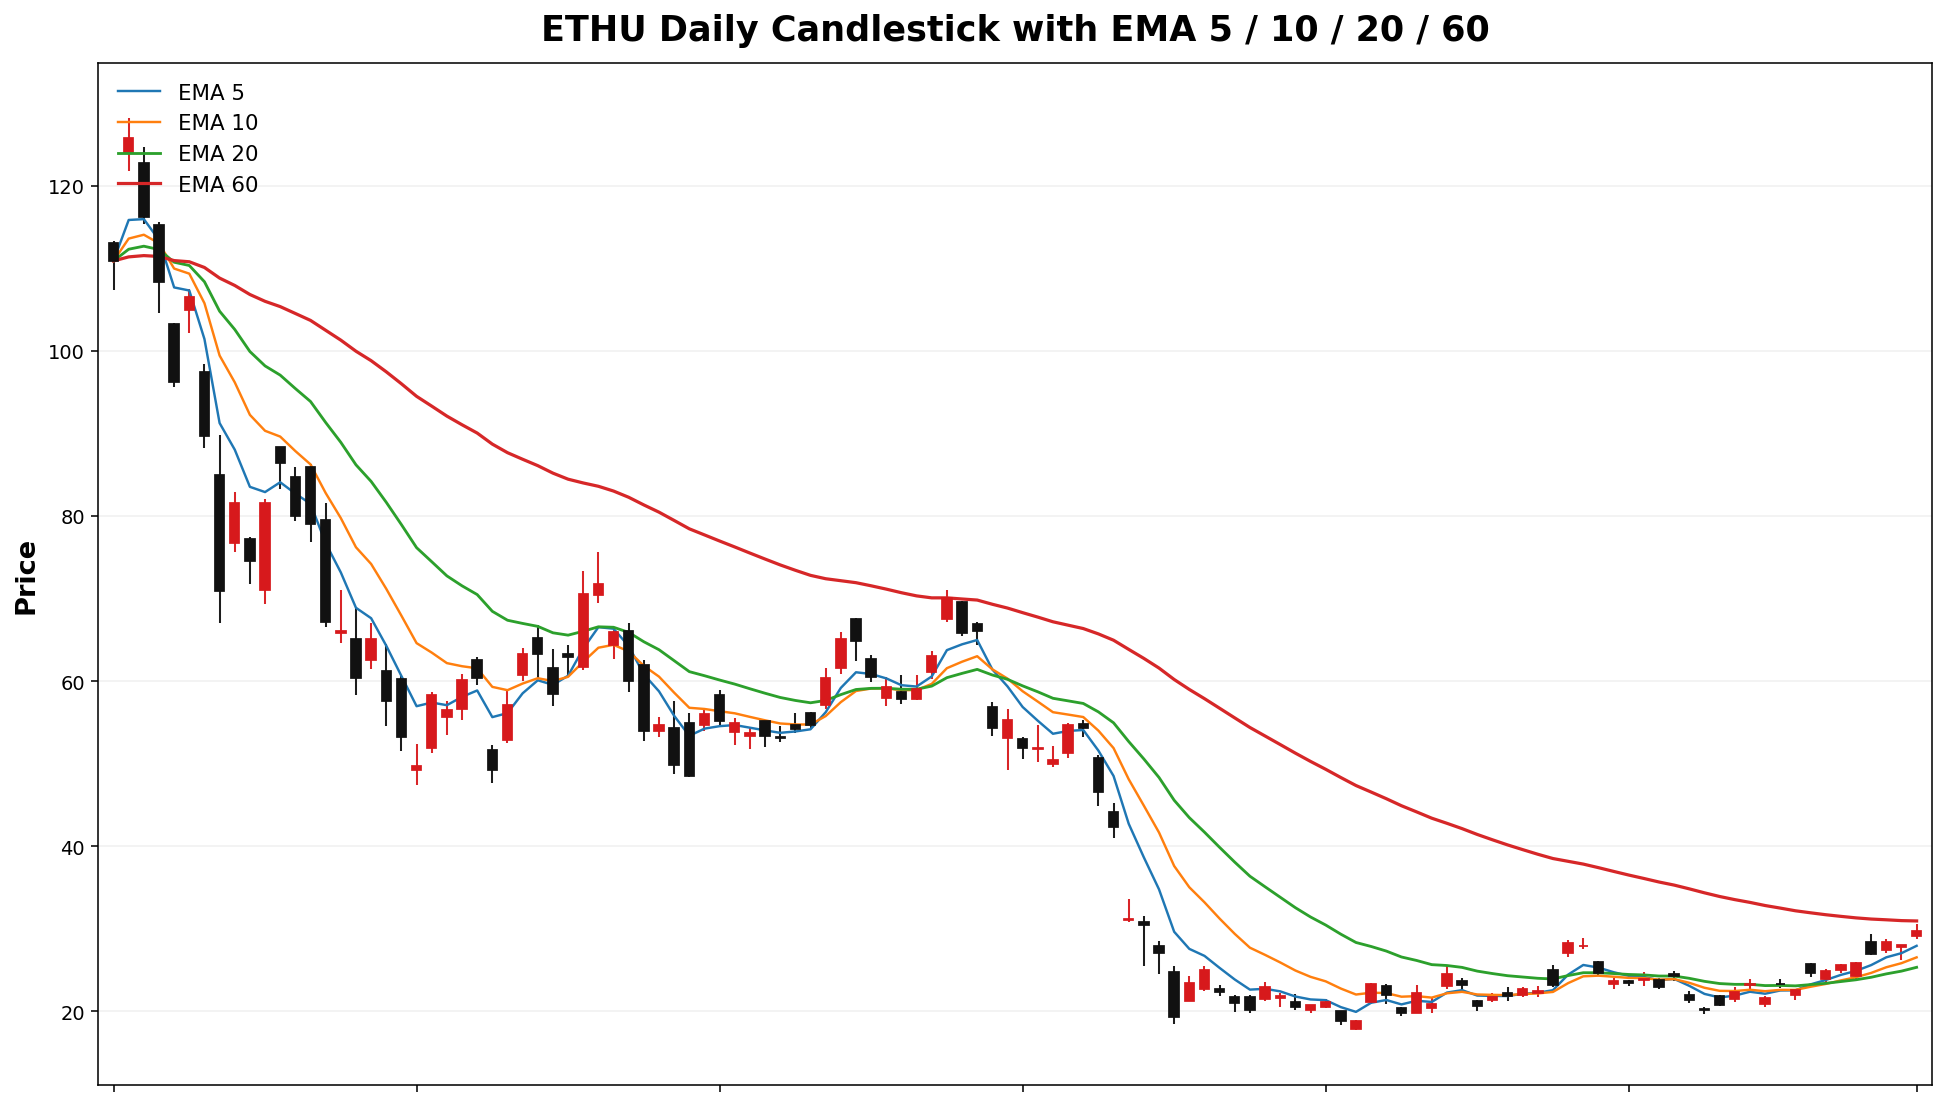
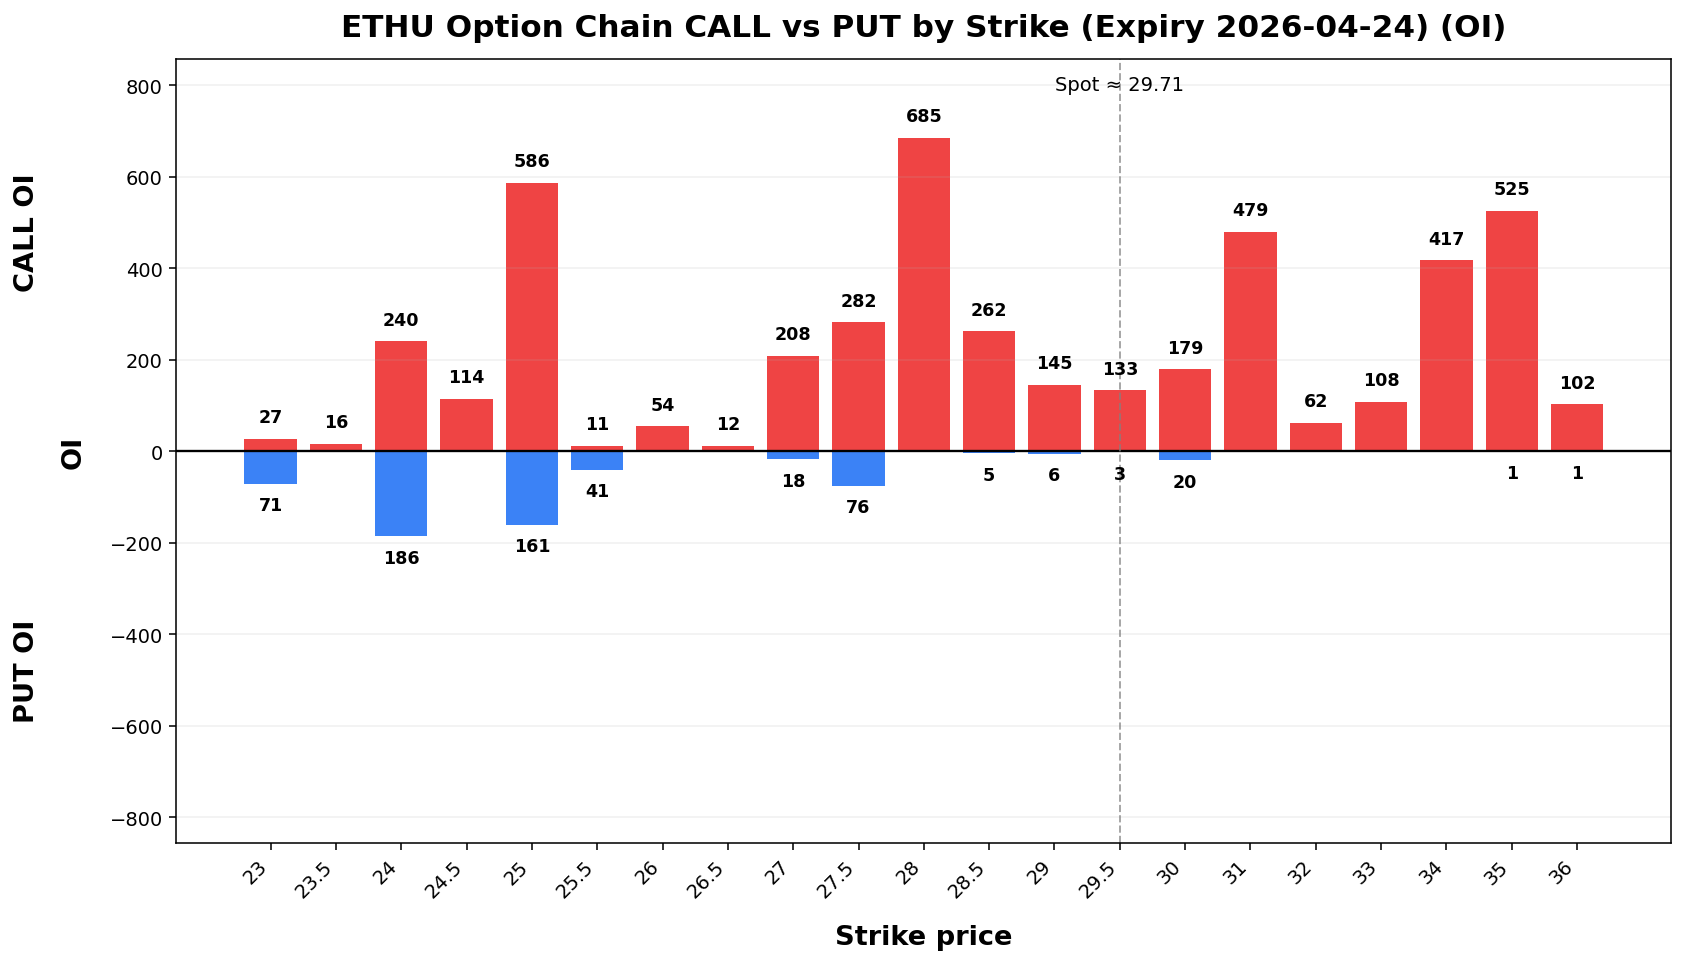
Term Structure
| Expiry |
DTE |
Forward |
ATM IV |
ATM Straddle |
| 2026-04-24 |
6 |
29.67 |
111.97% |
4.20 |
| 2026-05-01 |
13 |
29.68 |
105.09% |
5.85 |
Weekly Range
| Confidence |
Low |
High |
Width |
| 68% |
25.13 |
34.29 |
9.17 |
| 80% |
23.84 |
35.58 |
11.75 |
| 90% |
22.17 |
37.25 |
15.08 |
| 95% |
20.73 |
38.69 |
17.97 |
Structure & Probabilities
| Support |
Resistance |
Gamma Flip |
Max Pain |
P>Res |
P<Sup |
| 28.50 |
31.00 |
20.57 |
24.00 |
38.9% |
39.6% |
Flow & Skew
| Call Vol |
Put Vol |
Vol P/C |
Call OI |
Put OI |
OI P/C |
Skew |
Skew Bias |
| 2,678 |
562 |
0.21 |
5,079 |
2,781 |
0.55 |
-0.59 vol pts |
FLAT |
Tail Risk
| Q10 |
Q50 |
Q90 |
Down Tail |
Up Tail |
Down/Up |
| 13.54 |
28.63 |
35.52 |
16.17 |
5.81 |
2.78 |
Daily Technicals
| EMA20 |
EMA50 |
VWAP20 |
BB Lower |
BB Mid |
BB Upper |
BB Width |
Vol Ratio |
Path |
| 25.33 |
28.79 |
24.41 |
19.02 |
24.22 |
29.42 |
42.94% |
1.56 |
Sideways / Range |
Day Plan
- 28.50-31.00 range: fade extremes
- > 31.00: chase only if hold + vol
- < 28.50: risk expand; reduce size
- Regime: TRANSITION
- Tech: Sideways / Range
Swing Plan
- Accumulate: 28.50-28.50
- Trim: 31.00-31.00
- Add: close > 31.00
- Cut: close < 28.50
- Best for: transition regime
Raw Text Summary
📌 ETHU @ 29.71 (2026-04-19 08:15 AM MYT)

• Current price is **29.71**. Key support is around **28.50**, and resistance is around **31.00**.
• For the next week, the model’s **68% expected range** is roughly **25.13 to 34.29**.
• A wider **90% range** is about **22.17 to 37.25**.
• Dealer positioning looks **LONG gamma**, so the market behavior is classified as **TRANSITION**.
• The estimated **gamma flip** is near **20.57**. Crossing and holding beyond this area can change the trading behavior.
• Approximate breakout odds: **above resistance 38.9%**, **below support 39.6%** by the target horizon.
• Options skew is fairly balanced, so there is **no strong directional bias** from skew alone.
• Near-term implied volatility is higher than the next expiry (**IV1 111.97% vs IV2 105.09%**), which suggests **near-term event stress / backwardation**.
• Recent volume is **1.56x** the 20-day average, which supports stronger continuation or breakout follow-through.
• On the daily chart, the stock currently looks like **Sideways / Range**.
• The implied distribution shows **heavier downside tail risk** than upside tail potential.
DPST
Spot: 120.63
Report Time: 2026-04-19 08:15 AM MYT
Regime: TRANSITION
Dealer Gamma: LONG
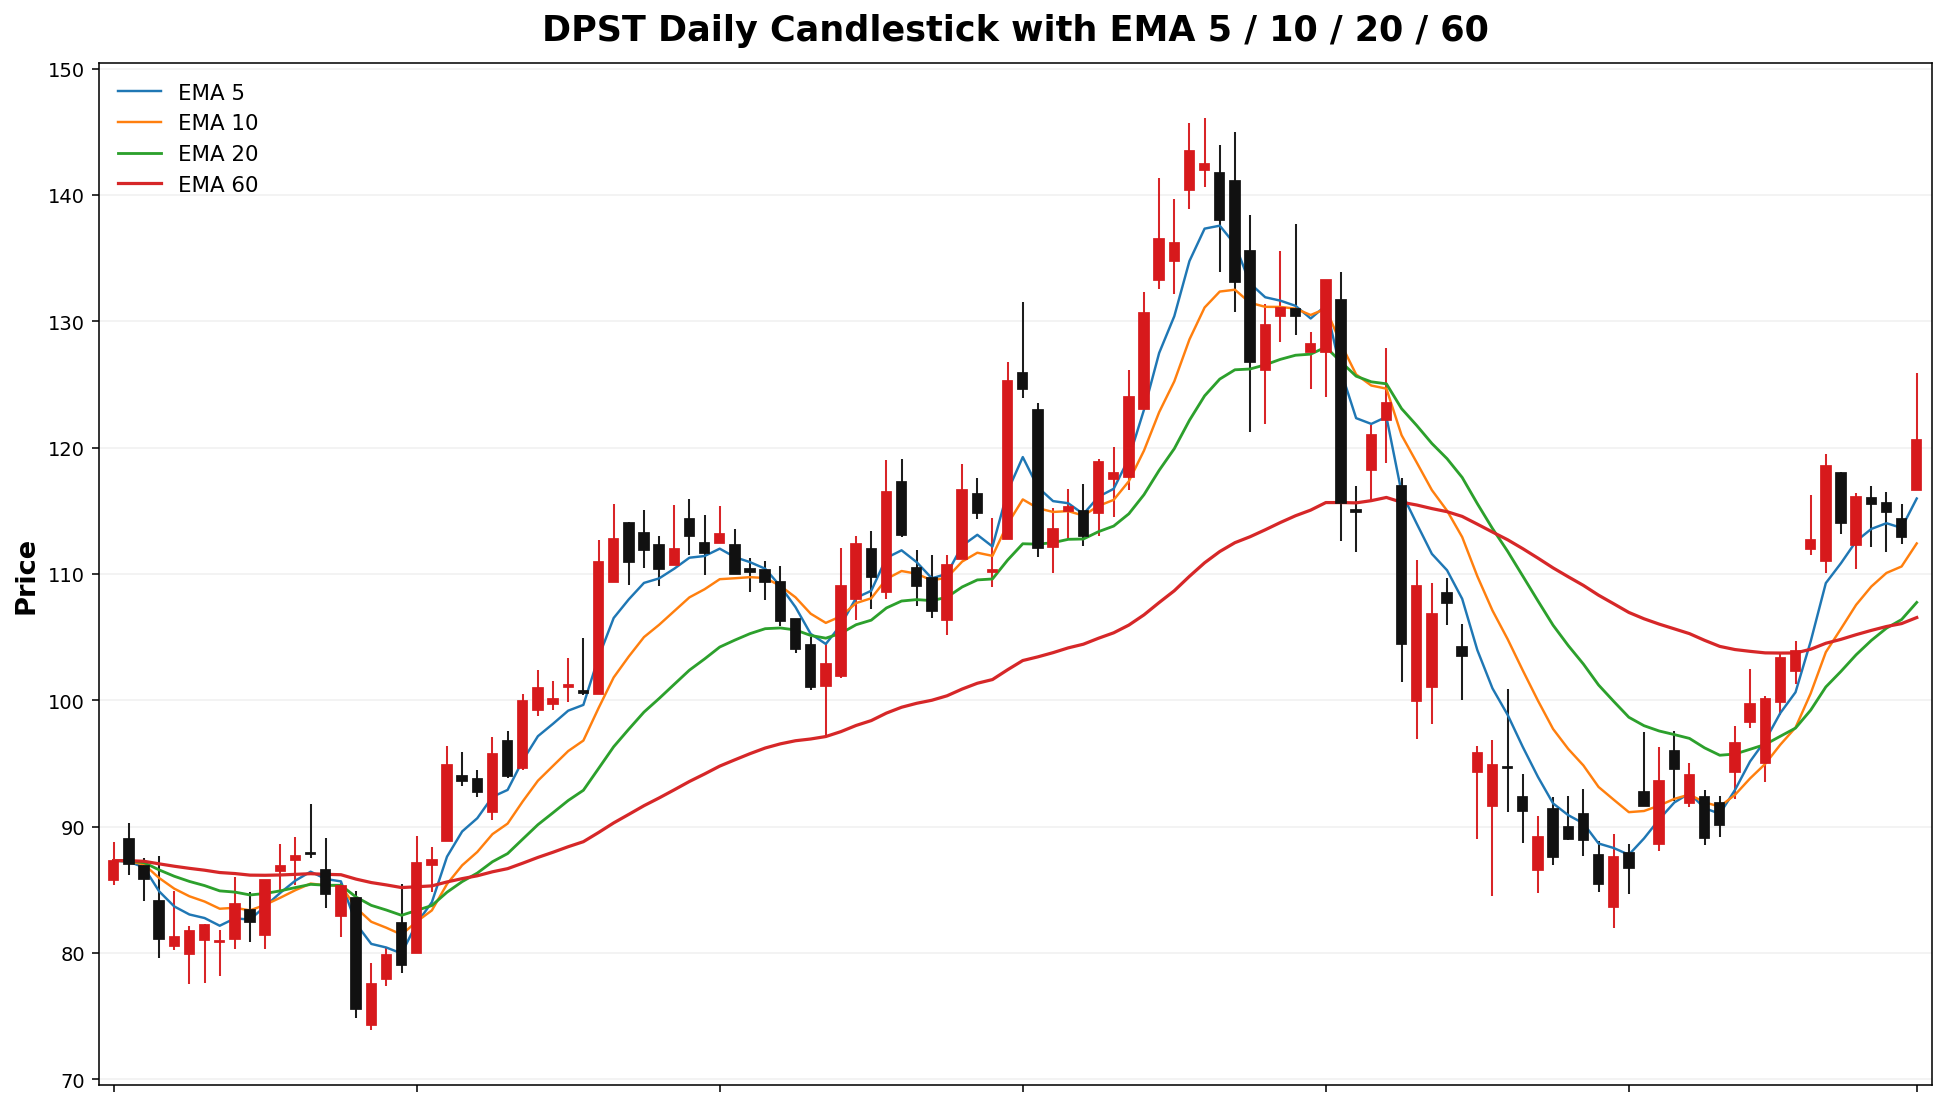
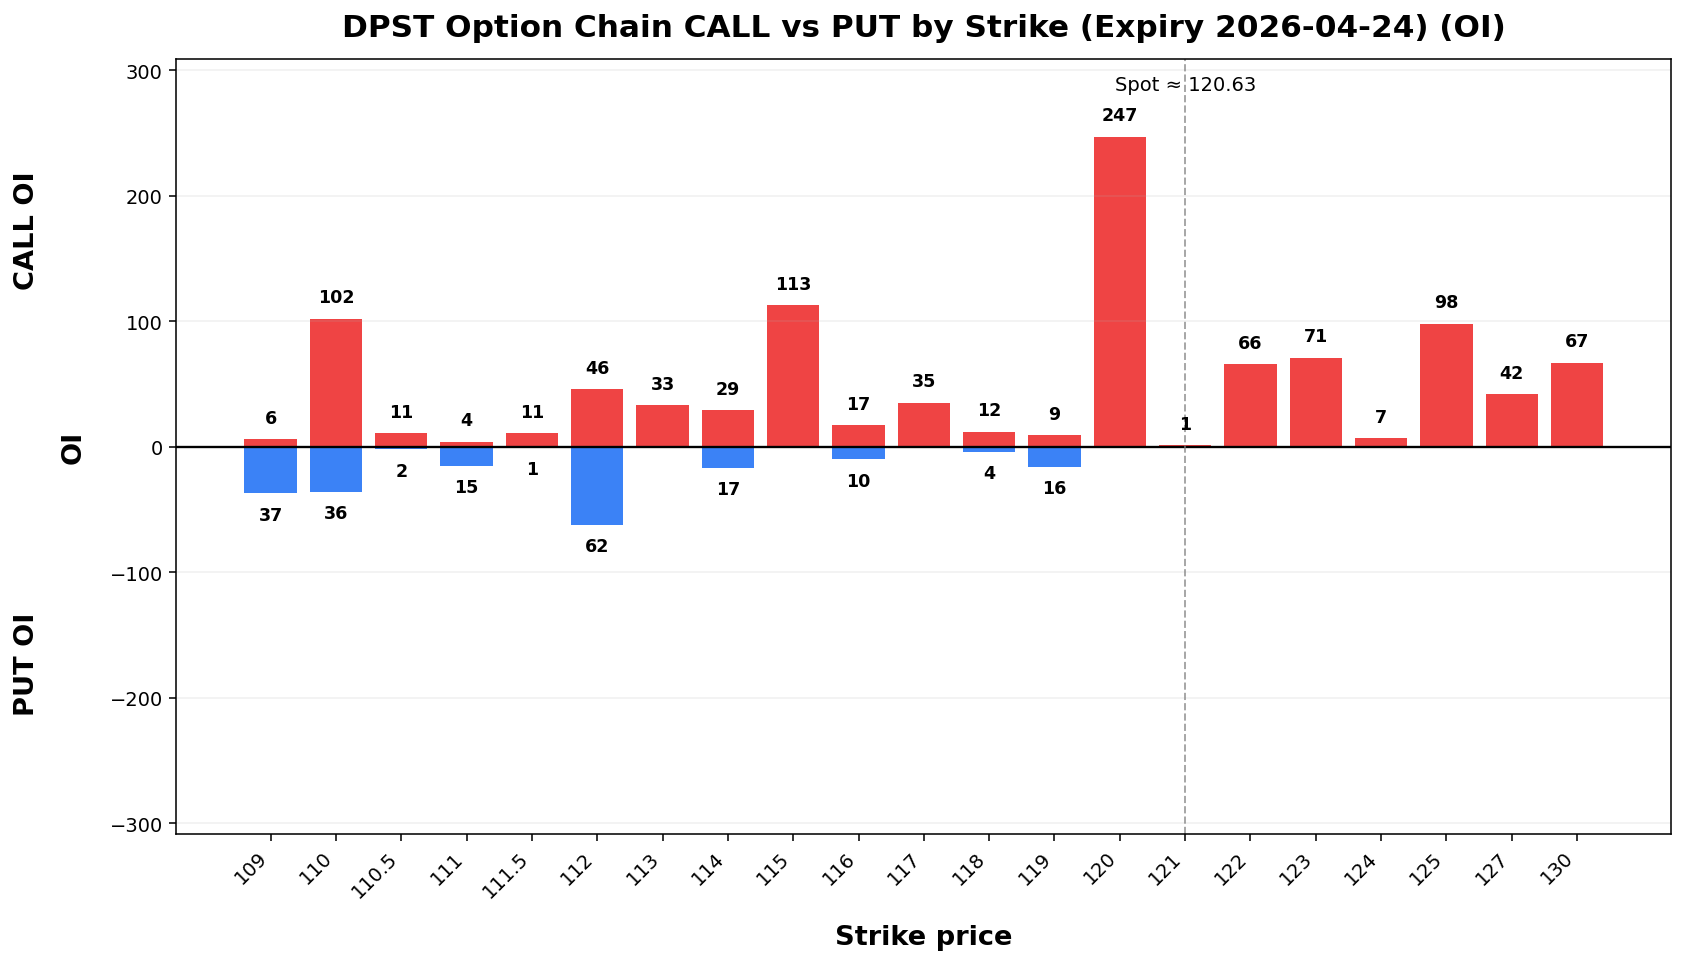
Term Structure
| Expiry |
DTE |
Forward |
ATM IV |
ATM Straddle |
| 2026-04-24 |
6 |
120.73 |
66.32% |
10.10 |
| 2026-05-01 |
13 |
119.85 |
63.05% |
14.25 |
Weekly Range
| Confidence |
Low |
High |
Width |
| 68% |
109.56 |
131.70 |
22.14 |
| 80% |
106.44 |
134.82 |
28.38 |
| 90% |
102.42 |
138.84 |
36.42 |
| 95% |
98.93 |
142.33 |
43.40 |
Structure & Probabilities
| Support |
Resistance |
Gamma Flip |
Max Pain |
P>Res |
P<Sup |
| 120.00 |
125.00 |
103.09 |
105.00 |
31.9% |
52.5% |
Flow & Skew
| Call Vol |
Put Vol |
Vol P/C |
Call OI |
Put OI |
OI P/C |
Skew |
Skew Bias |
| 522 |
336 |
0.64 |
1,524 |
1,535 |
1.01 |
6.64 vol pts |
PUT_SKEW |
Tail Risk
| Q10 |
Q50 |
Q90 |
Down Tail |
Up Tail |
Down/Up |
| 81.87 |
115.87 |
125.82 |
38.76 |
5.19 |
7.47 |
Daily Technicals
| EMA20 |
EMA50 |
VWAP20 |
BB Lower |
BB Mid |
BB Upper |
BB Width |
Vol Ratio |
Path |
| 107.75 |
106.65 |
103.69 |
81.04 |
103.45 |
125.85 |
43.31% |
1.79 |
UP trend (expanding) |
Day Plan
- 120.00-125.00 range: fade extremes
- > 125.00: chase only if hold + vol
- < 120.00: risk expand; reduce size
- Regime: TRANSITION
- Tech: UP trend (expanding)
Swing Plan
- Accumulate: 120.00-120.00
- Trim: 125.00-125.00
- Add: close > 125.00
- Cut: close < 120.00
- Best for: transition regime
Raw Text Summary
📌 DPST @ 120.63 (2026-04-19 08:15 AM MYT)

• Current price is **120.63**. Key support is around **120.00**, and resistance is around **125.00**.
• For the next week, the model’s **68% expected range** is roughly **109.56 to 131.70**.
• A wider **90% range** is about **102.42 to 138.84**.
• Dealer positioning looks **LONG gamma**, so the market behavior is classified as **TRANSITION**.
• The estimated **gamma flip** is near **103.09**. Crossing and holding beyond this area can change the trading behavior.
• Approximate breakout odds: **above resistance 31.9%**, **below support 52.5%** by the target horizon.
• Options skew is tilted toward **puts**, which suggests traders are paying more for downside protection.
• Near-term implied volatility is higher than the next expiry (**IV1 80.48%66.32% vs IV2 75.71%63.05%**), which suggests **near-term event stress / backwardation**.
• Recent volume is only **0.60x*1.79x** the 20-day average, sowhich breakoutssupports maystronger becontinuation lessor reliablebreakout unless volume improves.follow-through.
• On the daily chart, the stock currently looks like **SidewaysUP /trend Range*(expanding)**.
• The implied distribution shows **heavier downside tail risk** than upside tail potential.
RHNAIL
Spot: 125.5846.80
Report Time: 2026-04-1219 08:4916 AM MYT
Regime: TRANSITION
Dealer Gamma: LONG
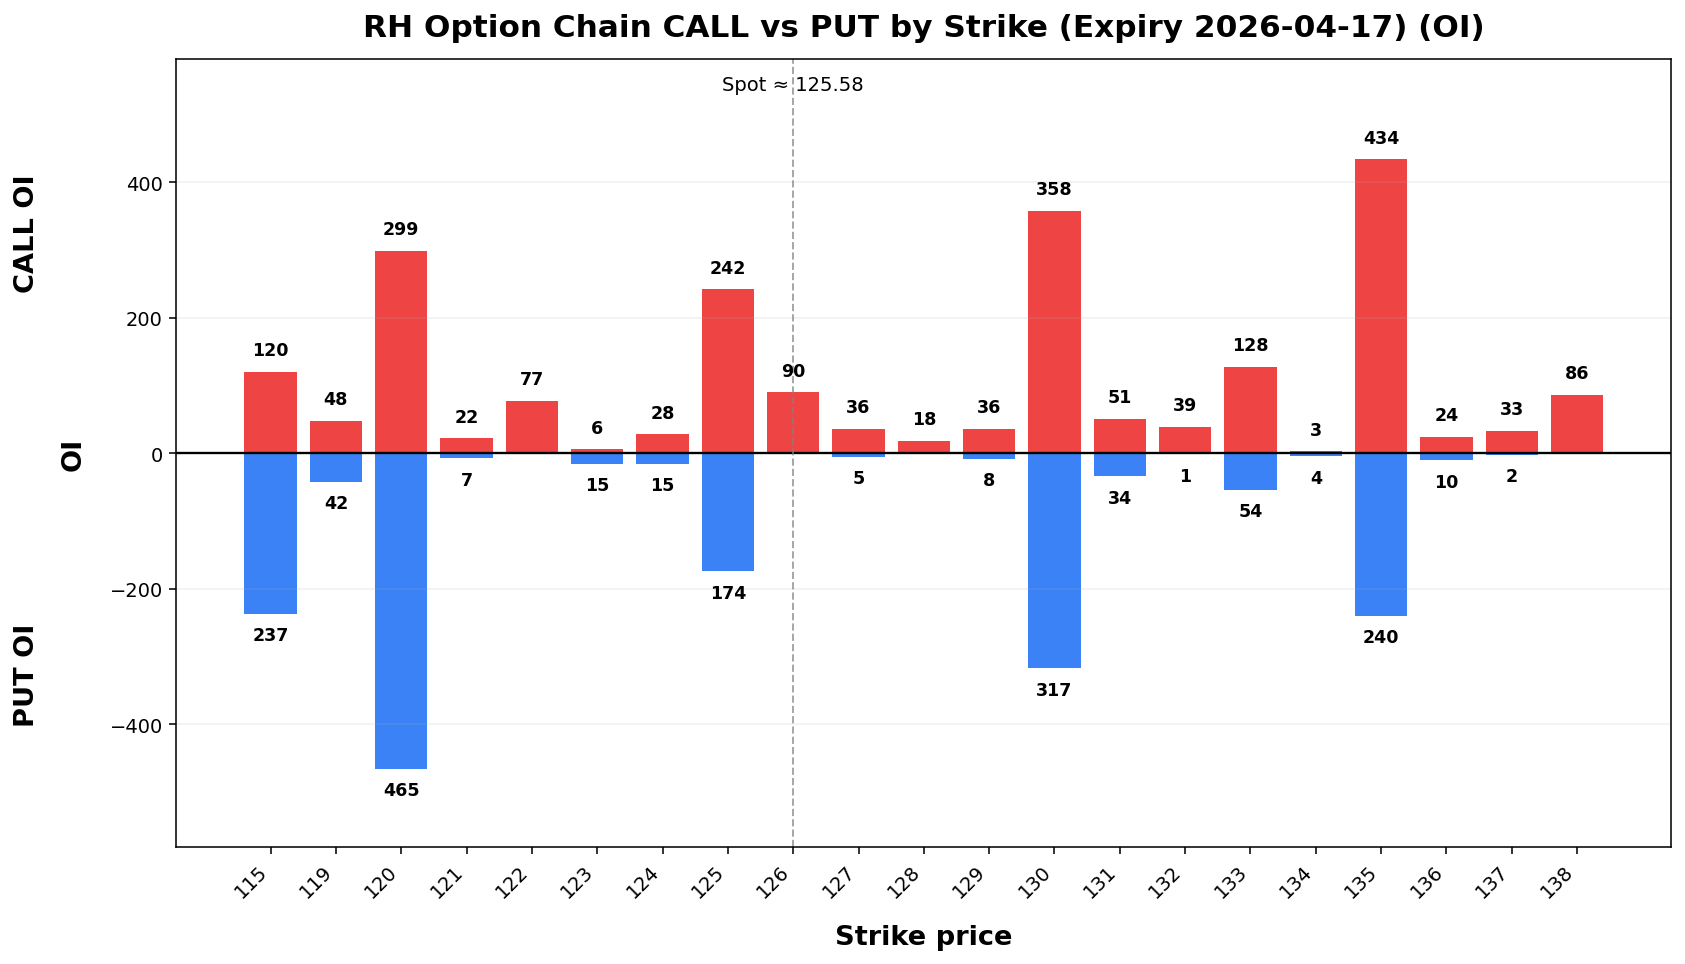
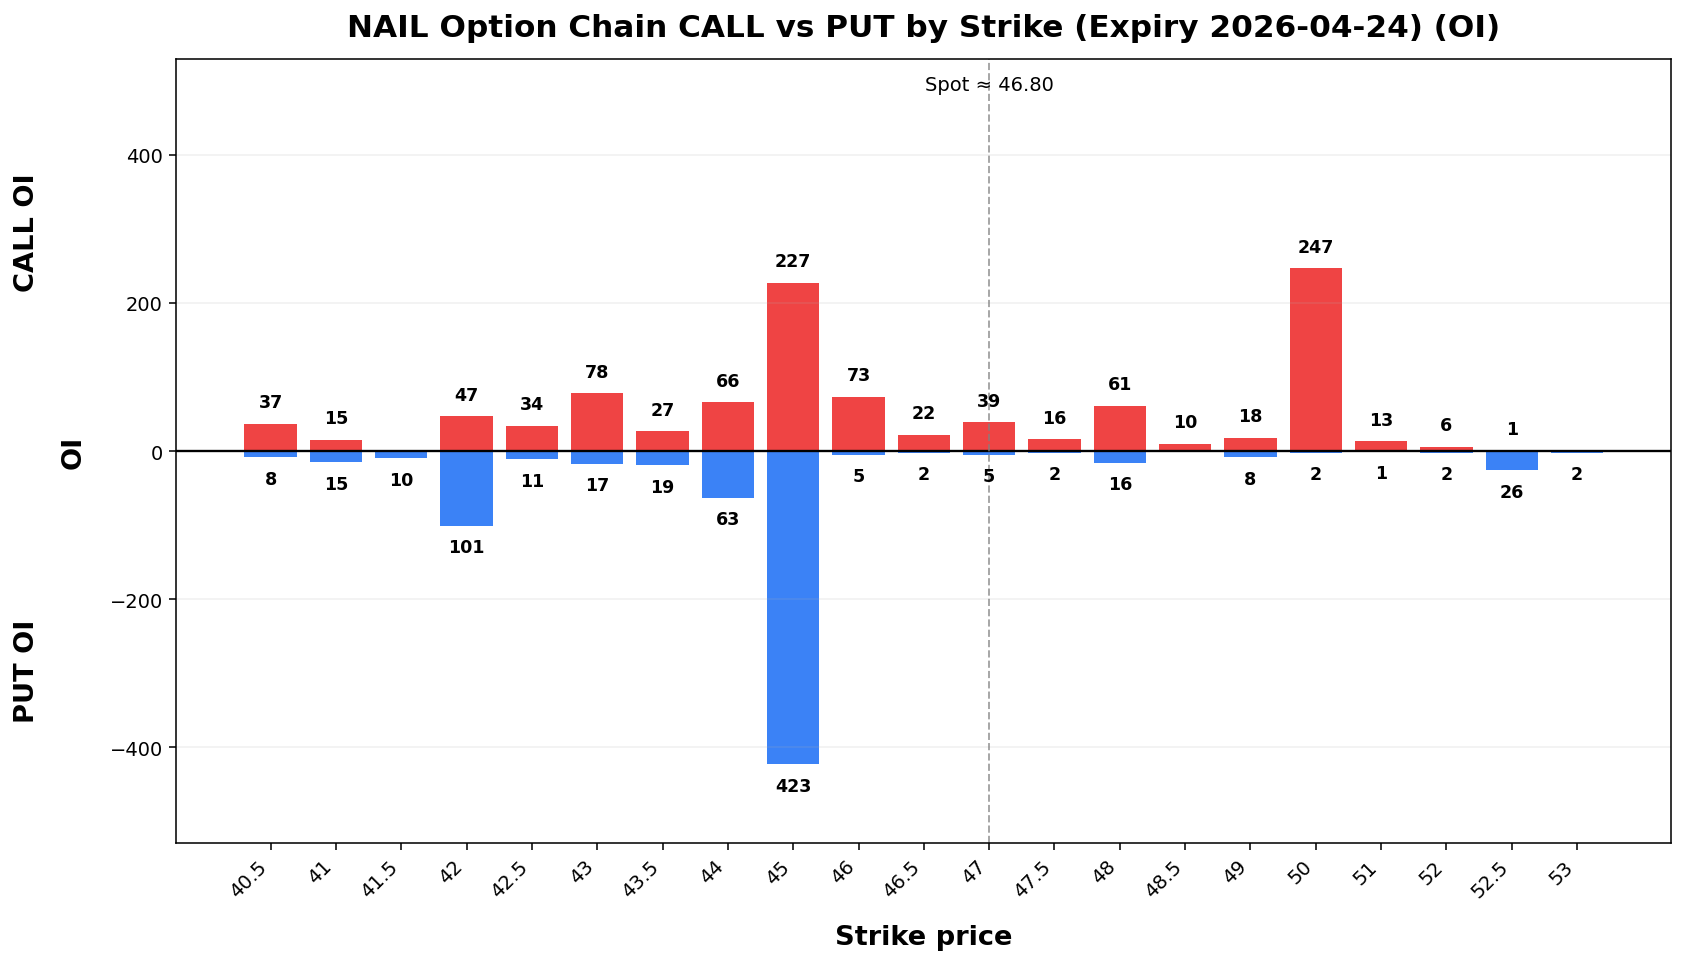
Term Structure
| Expiry |
DTE |
Forward |
ATM IV |
ATM Straddle |
2026-04-1724 |
6 |
125.3446.98 |
59.09%73.62% |
9.4.35 |
2026-04-2405-01 |
13 |
125.6347.11 |
56.36%63.58% |
13.255.58 |
Weekly Range
| Confidence |
Low |
High |
Width |
| 68% |
115.3042.17 |
135.8651.43 |
20.569.25 |
| 80% |
112.4140.87 |
138.7552.73 |
26.3511.86 |
| 90% |
108.6739.19 |
142.4954.41 |
33.8215.22 |
| 95% |
105.43 |
145.37.73 |
40.2955.87 |
18.13 |
Structure & Probabilities
| Support |
Resistance |
Gamma Flip |
Max Pain |
P>Res |
P<Sup |
120.45.00 |
135.50.00 |
120.9744.89 |
130.45.00 |
14.8%22.5% |
28.8%38.3% |
Flow & Skew
| Call Vol |
Put Vol |
Vol P/C |
Call OI |
Put OI |
OI P/C |
Skew |
Skew Bias |
1,121648 |
822 |
0.50 |
1,840 |
2,952001 |
2.631.09 |
7,431 |
6,523 |
0.88 |
10.477.23 vol pts |
PUT_SKEW |
Tail Risk
| Q10 |
Q50 |
Q90 |
Down Tail |
Up Tail |
Down/Up |
119.19 |
125.69 |
139.38 |
6.36.39 |
13.8047.58 |
0.4652.61 |
10.41 |
5.81 |
1.79 |
Daily Technicals
| EMA20 |
EMA50 |
VWAP20 |
BB Lower |
BB Mid |
BB Upper |
BB Width |
Vol Ratio |
Path |
130.4642.39 |
151.0647.93 |
123.4039.87 |
111.5133.32 |
127.6339.69 |
143.7646.05 |
25.27%32.08% |
1.022.04 |
DOWNSideways trend/ (expanding)Range |
Day Plan
120.45.00-135.50.00 range: fade extremes- >
135.50.00: chase only if hold + vol
- <
120.45.00: risk expand; reduce size
- Regime: TRANSITION
- Tech:
DOWNSideways trend/ (expanding)Range
Swing Plan
- Accumulate:
120.45.00-120.45.00
- Trim:
135.50.00-135.50.00
- Add: close >
135.50.00
- Cut: close <
120.45.00
- Best for: transition regime
Raw Text Summary
📌 RHNAIL @ 125.5846.80 (2026-04-1219 08:4916 AM MYT)

• Current price is **125.58*46.80**. Key support is around **120.45.00**, and resistance is around **135.50.00**.
• For the next week, the model’s **68% expected range** is roughly **115.3042.17 to 135.86*51.43**.
• A wider **90% range** is about **108.6739.19 to 142.49*54.41**.
• Dealer positioning looks **LONG gamma**, so the market behavior is classified as **TRANSITION**.
• The estimated **gamma flip** is near **120.97*44.89**. Crossing and holding beyond this area can change the trading behavior.
• Approximate breakout odds: **above resistance 14.8%22.5%**, **below support 28.8%38.3%** by the target horizon.
• Options skew is tilted toward **puts**, which suggests traders are paying more for downside protection.
• Near-term implied volatility is higher than the next expiry (**IV1 59.09%73.62% vs IV2 56.36%63.58%**), which suggests **near-term event stress / backwardation**.
• Recent volume is **2.04x** the 20-day average, which supports stronger continuation or breakout follow-through.
• On the daily chart, the stock currently looks like **Sideways / Range**.
• The implied distribution shows **heavier downside tail risk** than upside tail potential.
KTOS
Spot: 70.99
Report Time: 2026-04-19 08:16 AM MYT
Regime: TREND
Dealer Gamma: SHORT
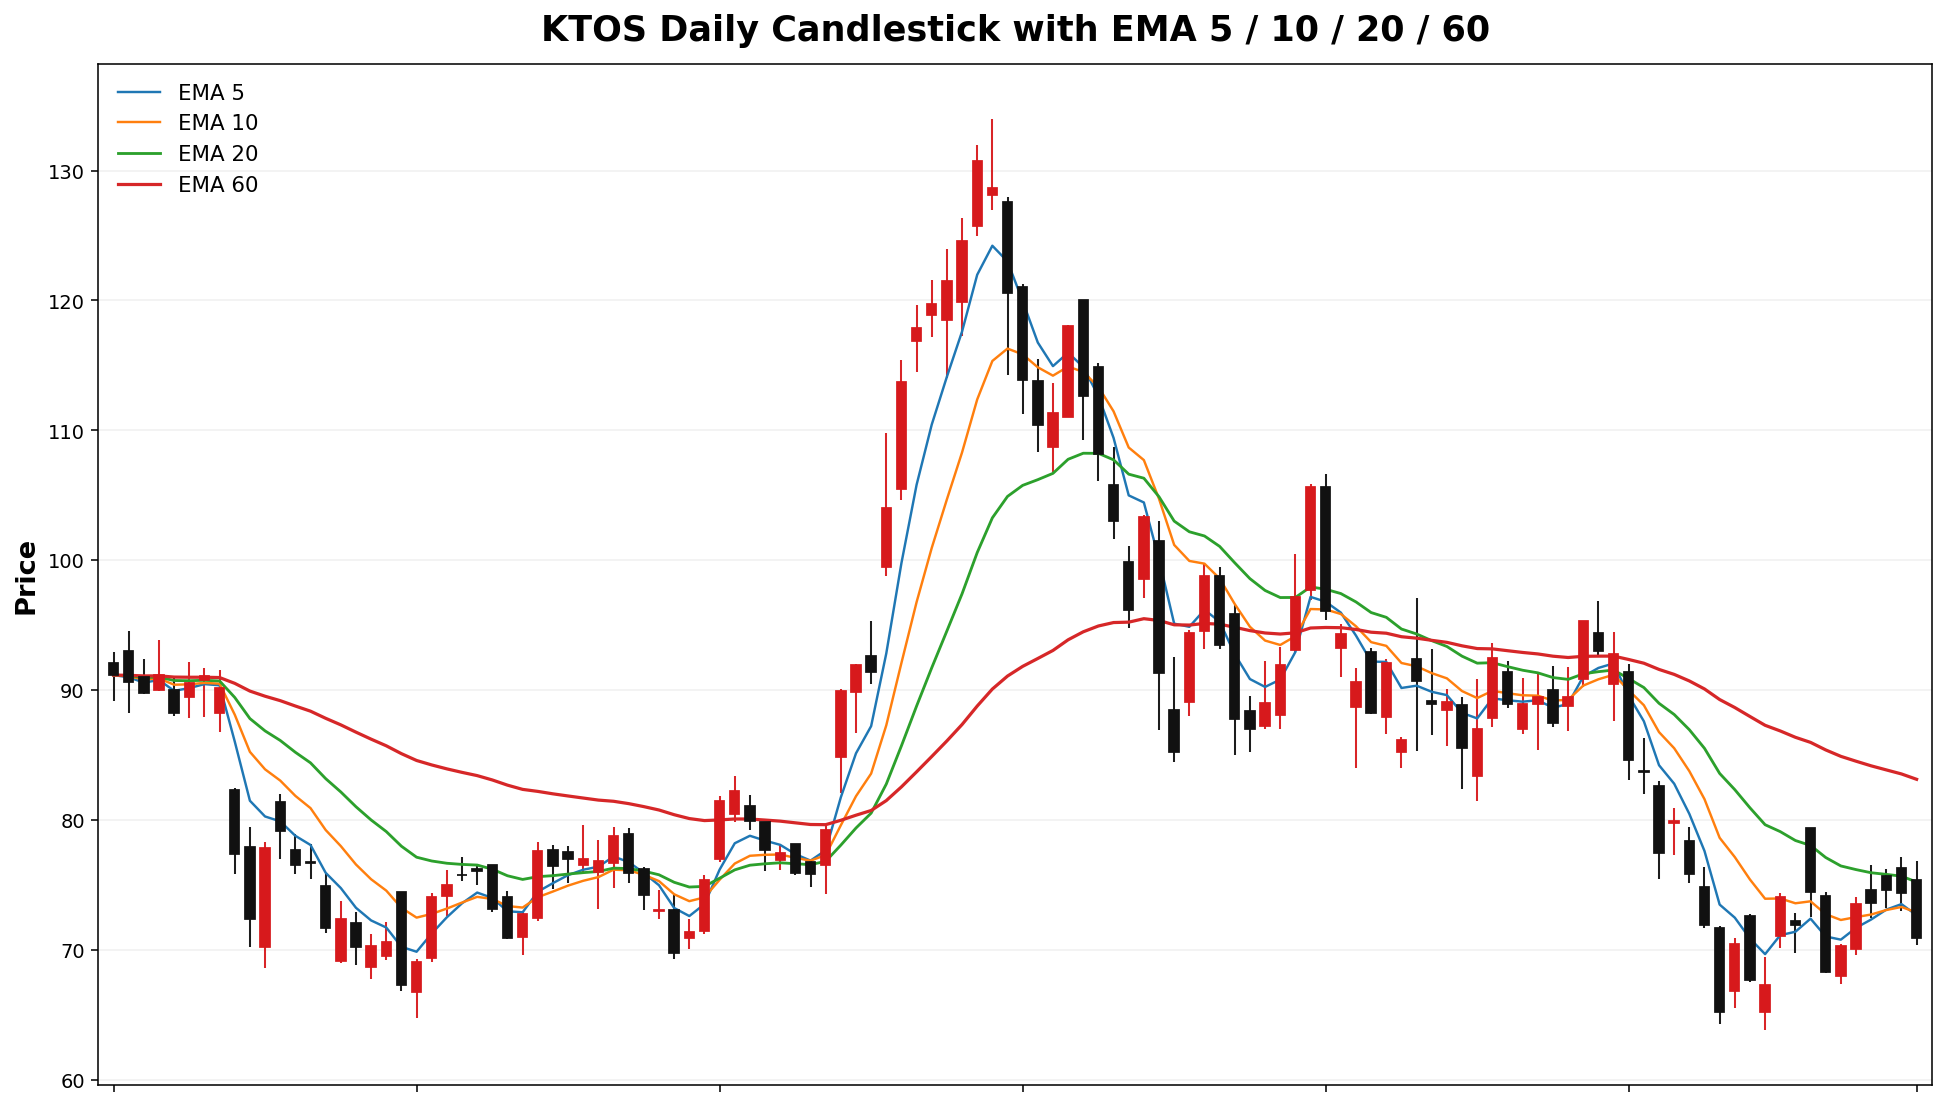
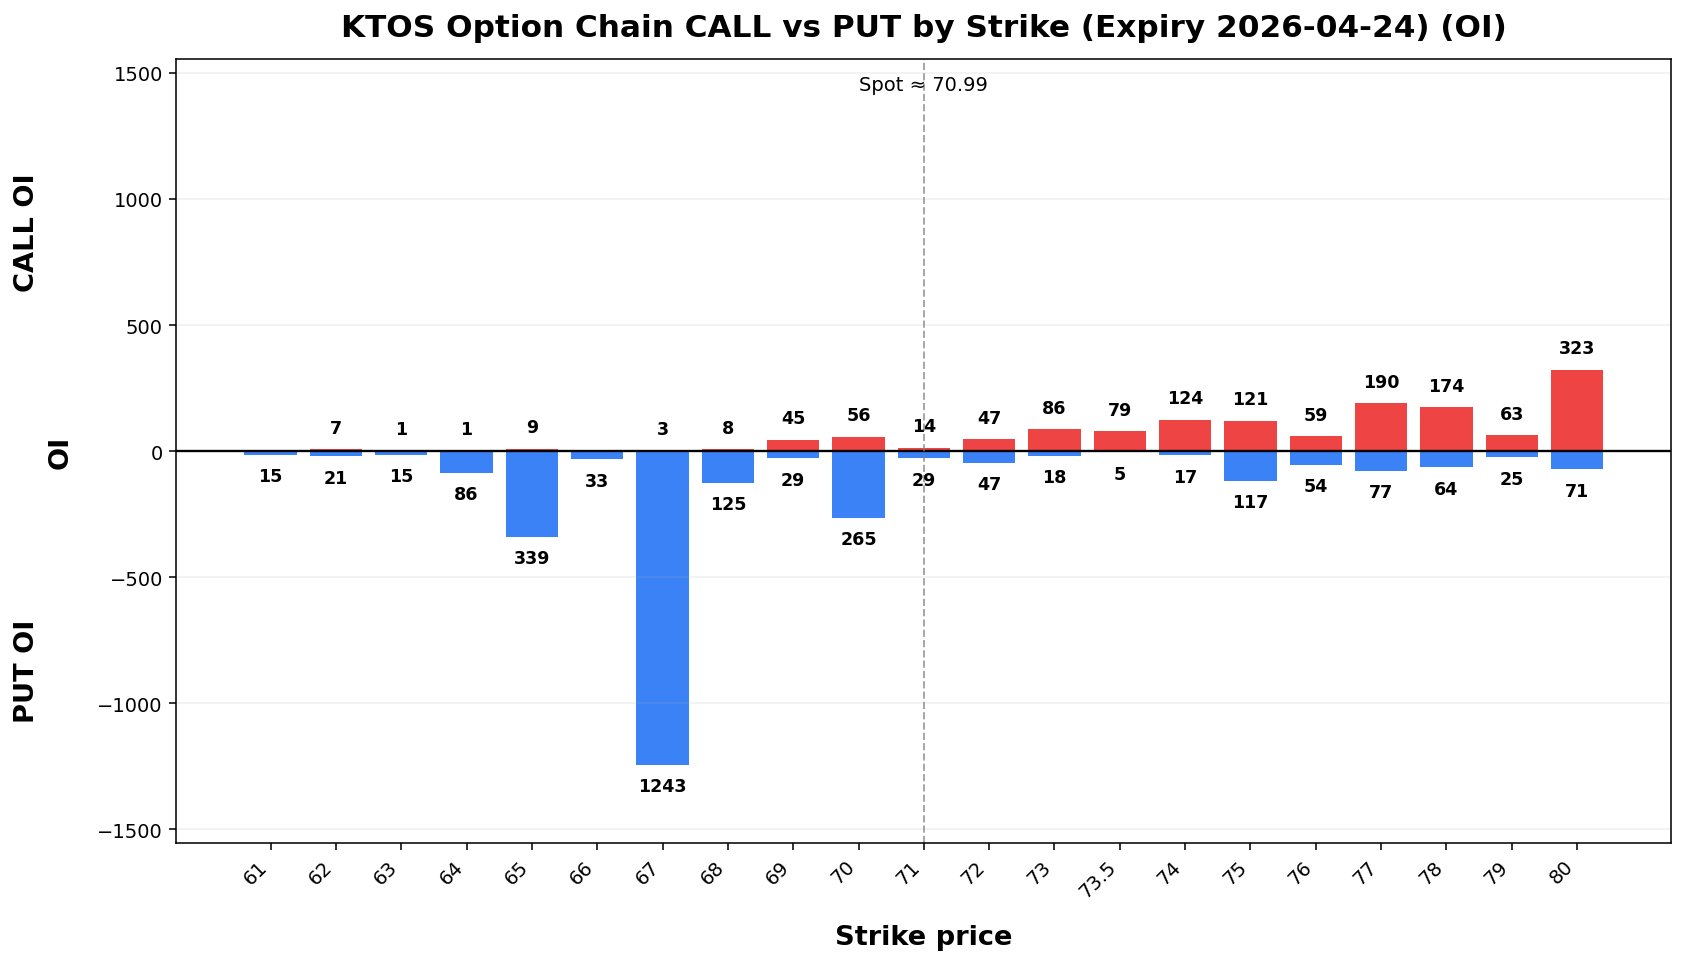
Term Structure
| Expiry |
DTE |
Forward |
ATM IV |
ATM Straddle |
| 2026-04-24 |
6 |
70.92 |
63.04% |
5.65 |
| 2026-05-01 |
13 |
70.98 |
59.77% |
7.95 |
Weekly Range
| Confidence |
Low |
High |
Width |
| 68% |
64.80 |
77.18 |
12.38 |
| 80% |
63.06 |
78.92 |
15.86 |
| 90% |
60.81 |
81.17 |
20.36 |
| 95% |
58.86 |
83.12 |
24.26 |
Structure & Probabilities
| Support |
Resistance |
Gamma Flip |
Max Pain |
P>Res |
P<Sup |
| 70.00 |
77.00 |
72.92 |
55.00 |
22.4% |
59.0% |
Flow & Skew
| Call Vol |
Put Vol |
Vol P/C |
Call OI |
Put OI |
OI P/C |
Skew |
Skew Bias |
| 1,725 |
803 |
0.47 |
3,805 |
3,705 |
0.97 |
0.10 vol pts |
FLAT |
Tail Risk
| Q10 |
Q50 |
Q90 |
Down Tail |
Up Tail |
Down/Up |
| 64.49 |
73.14 |
77.36 |
6.50 |
6.37 |
1.02 |
Daily Technicals
| EMA20 |
EMA50 |
VWAP20 |
BB Lower |
BB Mid |
BB Upper |
BB Width |
Vol Ratio |
Path |
| 75.26 |
81.86 |
74.09 |
63.38 |
73.54 |
83.71 |
27.64% |
1.77 |
DOWN trend (expanding) |
Day Plan
- 70.00-77.00 range: fade extremes
- > 77.00: chase only if hold + vol
- < 70.00: risk expand; reduce size
- Regime: TREND
- Tech: DOWN trend (expanding)
Swing Plan
- Accumulate: 70.00-70.00
- Trim: 77.00-77.00
- Add: close > 77.00
- Cut: close < 70.00
- Best for: trend regime
Raw Text Summary
📌 KTOS @ 70.99 (2026-04-19 08:16 AM MYT)

• Current price is **70.99**. Key support is around **70.00**, and resistance is around **77.00**.
• For the next week, the model’s **68% expected range** is roughly **64.80 to 77.18**.
• A wider **90% range** is about **60.81 to 81.17**.
• Dealer positioning looks **SHORT gamma**, so the market behavior is classified as **TREND**.
• The estimated **gamma flip** is near **72.92**. Crossing and holding beyond this area can change the trading behavior.
• Approximate breakout odds: **above resistance 22.4%**, **below support 59.0%** by the target horizon.
• Options skew is fairly balanced, so there is **no strong directional bias** from skew alone.
• Near-term implied volatility is higher than the next expiry (**IV1 63.04% vs IV2 59.77%**), which suggests **near-term event stress / backwardation**.
• Recent volume is **1.77x** the 20-day average, which supports stronger continuation or breakout follow-through.
• On the daily chart, the stock currently looks like **DOWN trend (expanding)**.
• The implied distribution showsis **morefairly balanced** between upside tail potential** thanand downside tail risk.tails.